


Características


¿Tienes alguna pregunta?
Recomendar


5 diapositivas
Business Cycle and Wheel Diagram
Illustrate key stages, continuous workflows, or strategic frameworks with this circular business diagram. Ideal for visualizing four connected steps in a clean, modern style. Easily editable in PowerPoint, Keynote, and Google Slides for full customization.


26 diapositivas
Rob Presentation Template
The Rob template is a presentation with an elegant and clean look. This template uses mostly a white and black color scheme, with the background image being a marble design to give a more sophisticated look. The presentation uses a lot of images to communicate. This template has slides dedicated to displaying photograph this is a great presentation to use if you have photos that you want to make a statement. It offers a bold design that is visually pleasing to the audience and encourages them to pay close attention. The template includes all the components needed for a successful presentation.


22 diapositivas
Inspirae Project Status Report Presentation
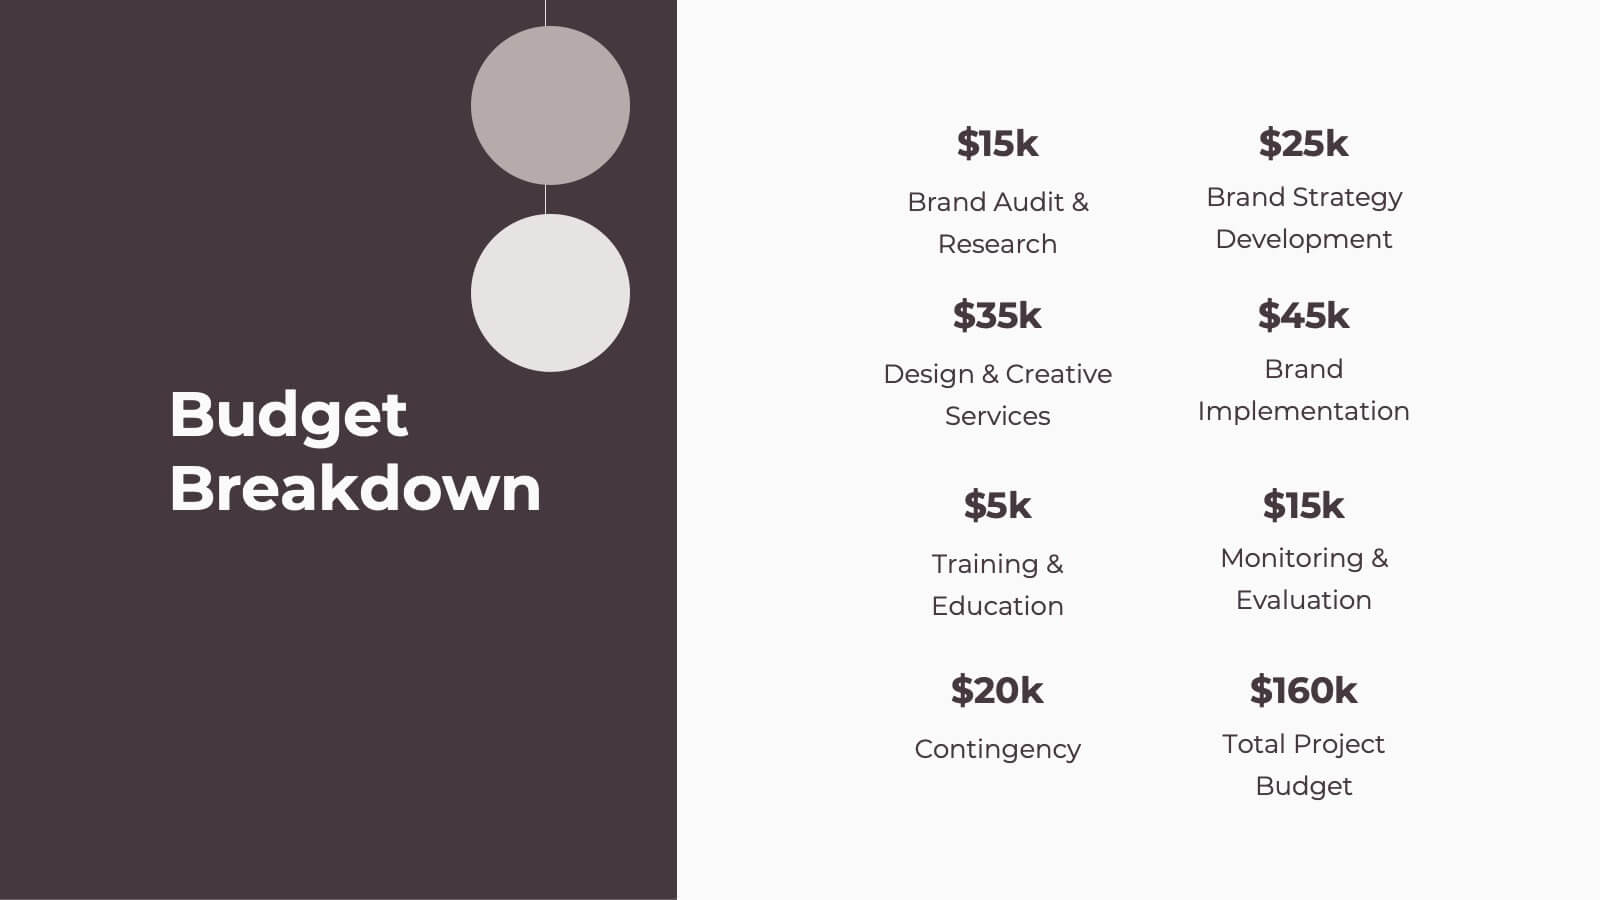
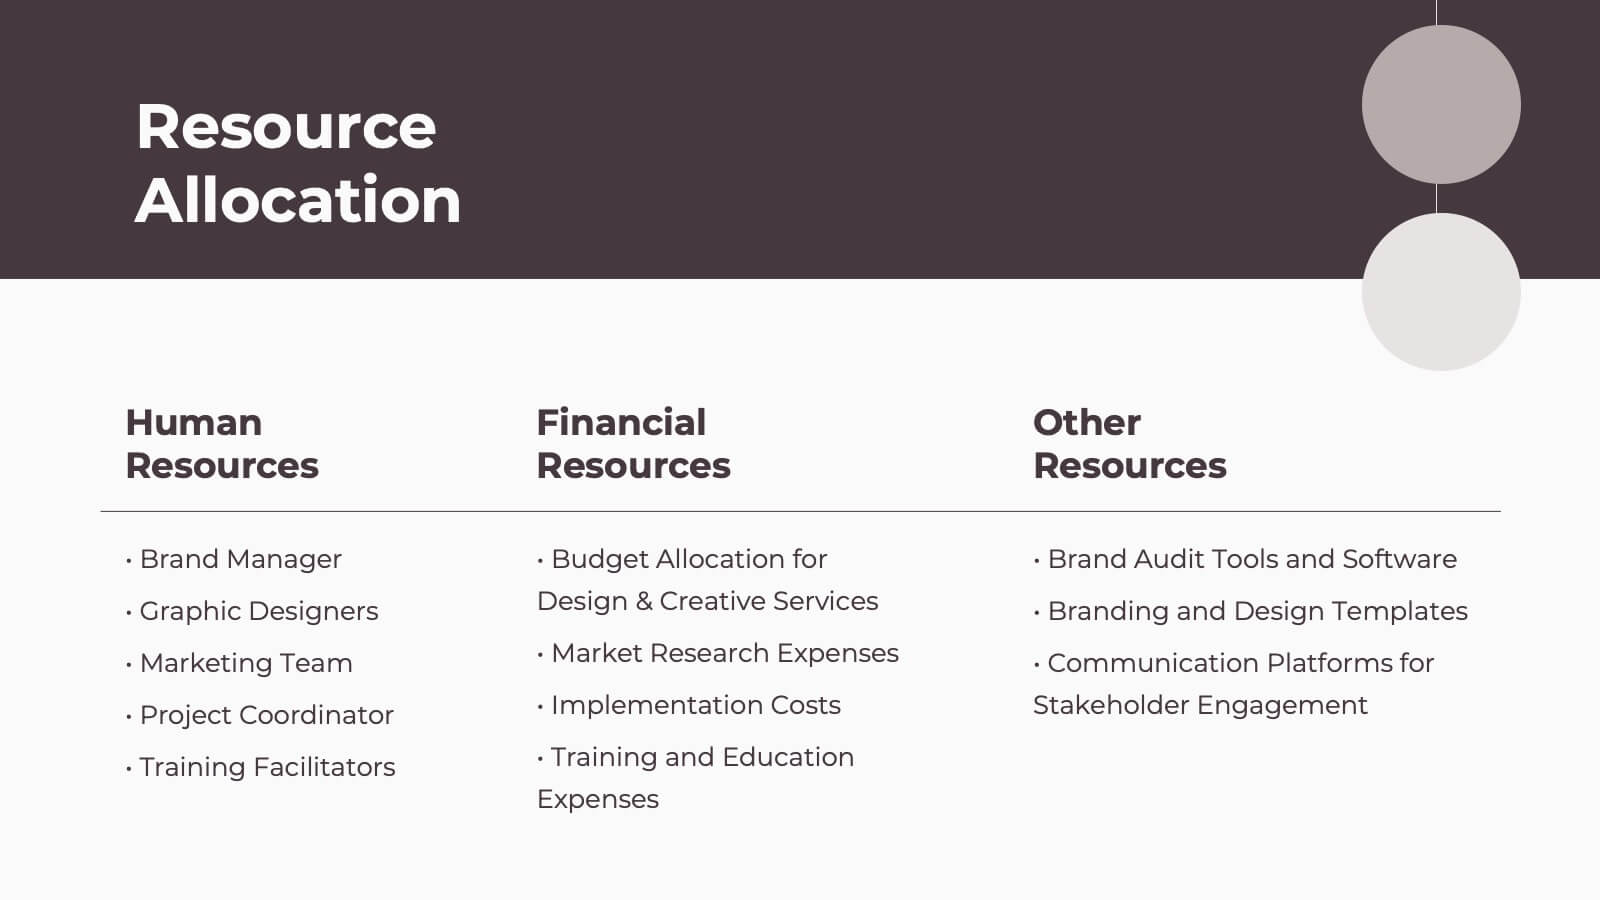
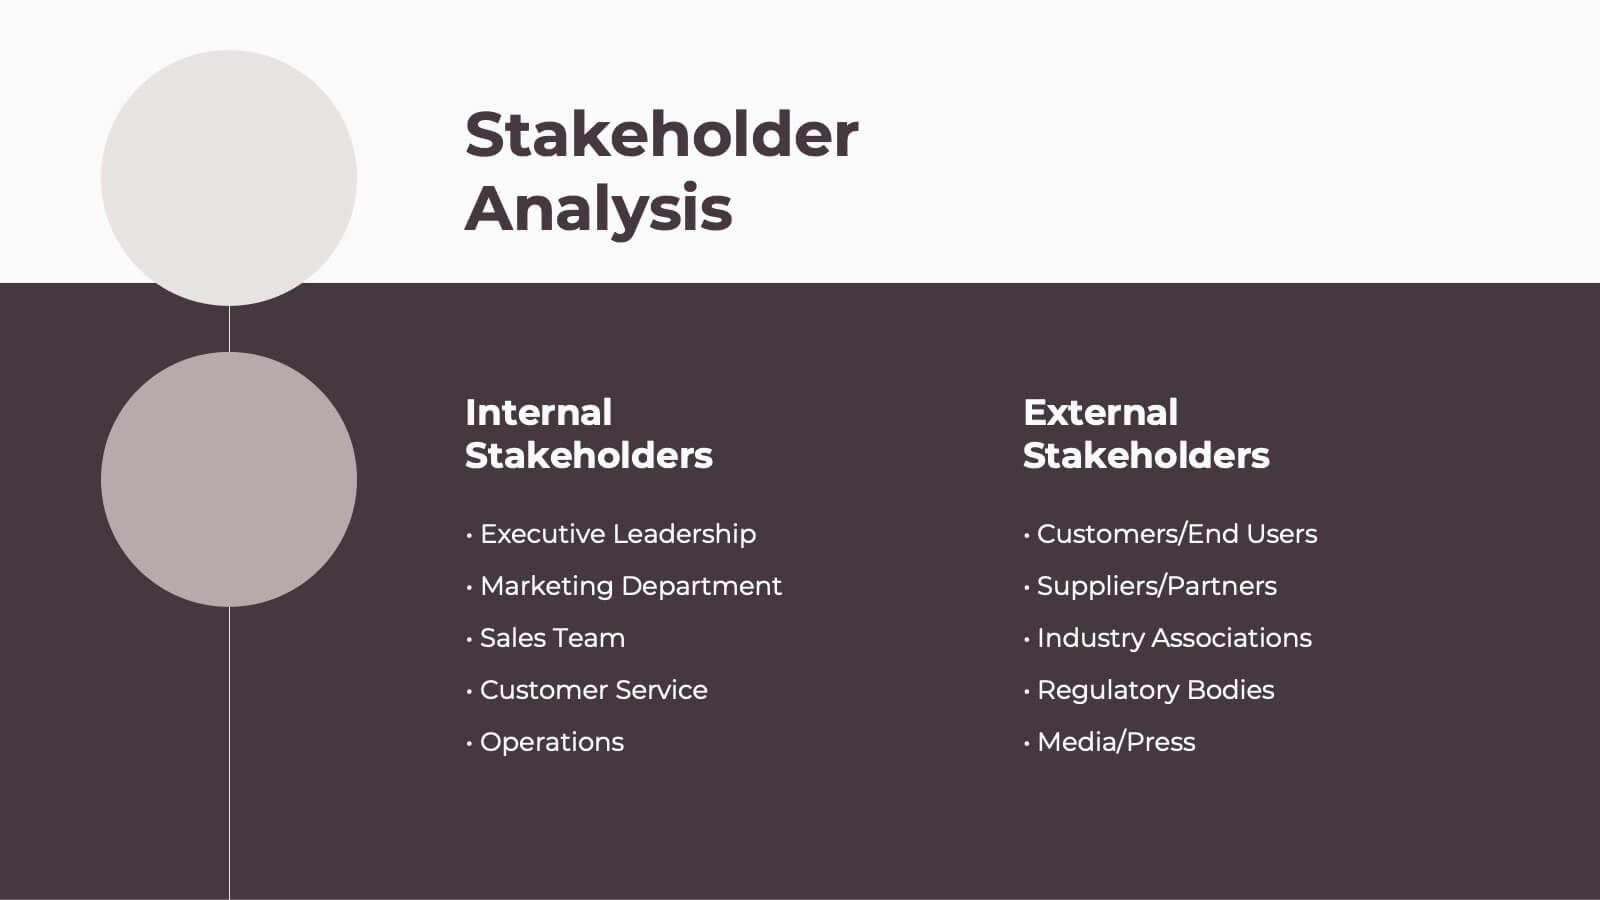
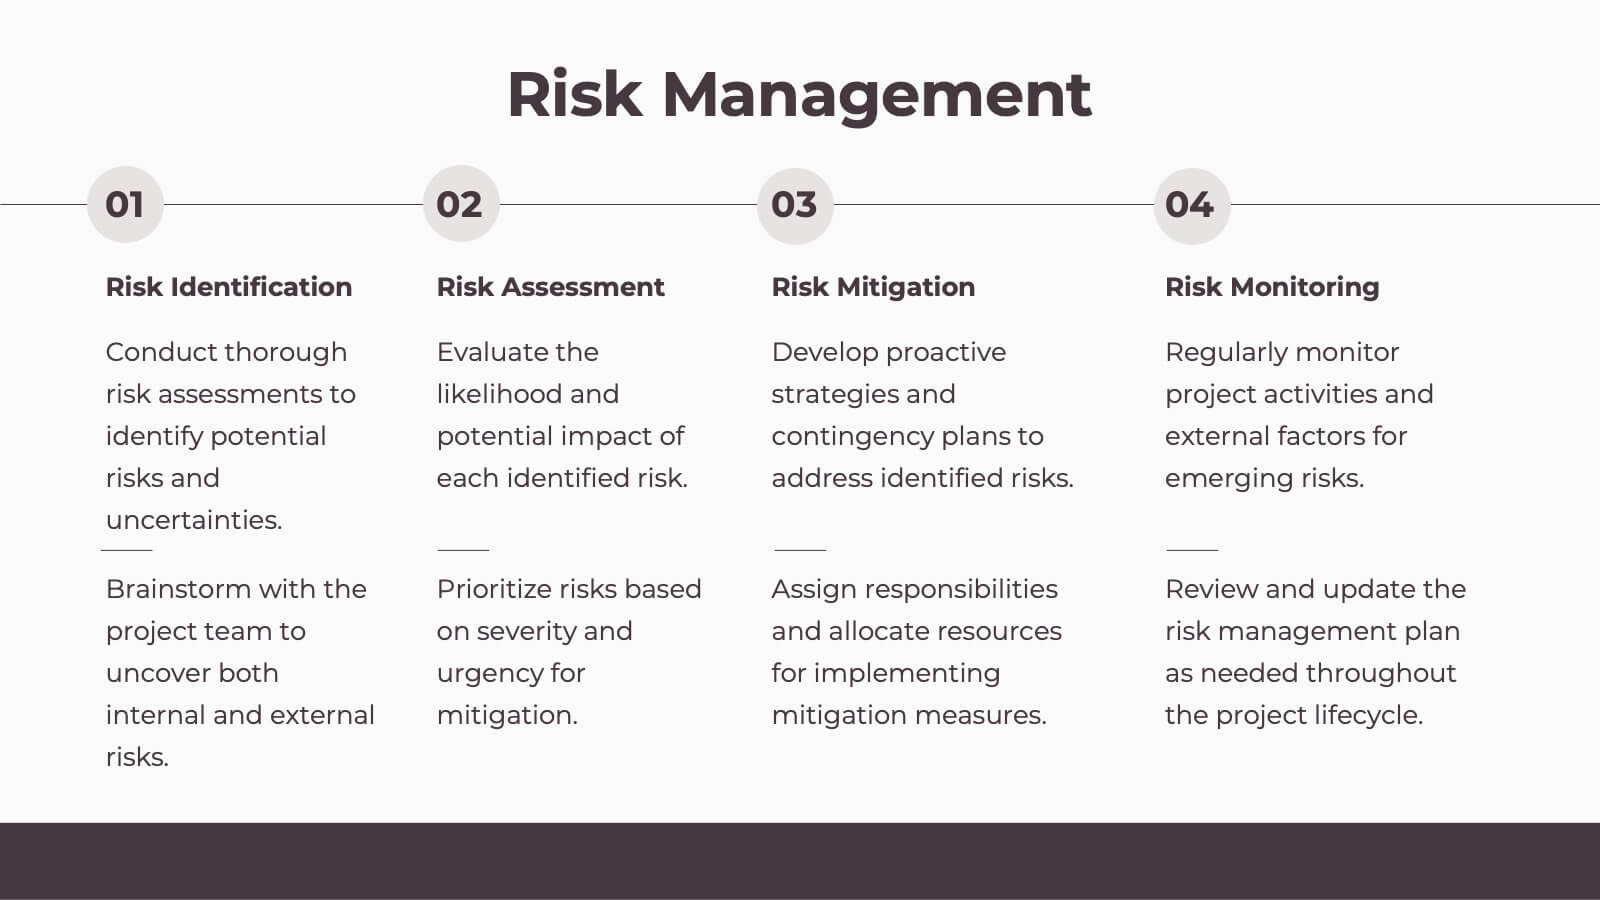
This sleek and modern project status report presentation template is designed to help you effectively communicate progress, challenges, and key insights. It covers essential sections such as performance metrics, sales performance, risk assessments, and strategic initiatives, ensuring a comprehensive overview. Compatible with PowerPoint, Keynote, and Google Slides for seamless customization.


7 diapositivas
Business Networking Strategy Presentation
Build strong business connections with this Business Networking Strategy template. Featuring a circular segmented diagram, this slide helps illustrate key networking approaches, strategic partnerships, and relationship-building techniques in an easy-to-understand format. Ideal for entrepreneurs, business developers, and corporate leaders, this fully editable slide is compatible with PowerPoint, Keynote, and Google Slides.


10 diapositivas
Organizational Hierarchy Infographic Presentation
Clearly define your Organizational Hierarchy with this structured infographic template. Designed for business presentations, HR teams, and corporate strategy, this visual layout simplifies reporting structures, leadership roles, and team organization. Fully customizable and easy to edit in PowerPoint, Keynote, and Google Slides, making it perfect for internal communications and management reports.


4 diapositivas
Communication Model and Channels Presentation
Illustrate how your messages move through various channels using this clean, visual communication model slide. Ideal for team briefings, marketing workflows, or internal training, it simplifies how information is shared across platforms. Fully editable in Canva, PowerPoint, and Google Slides for seamless customization to match your branding and messaging goals.


5 diapositivas
Medical Services Infographics
Navigate the complexities of healthcare information with our medical services infographics. Rendered in a life-affirming palette of blue and red, these infographics elucidate various facets of medical services. The template serves as a lifeline for healthcare professionals, and public health advocates by providing a clear, visual narrative of services, processes, and advancements in the medical field. Compatible with Powerpoint, Keynote, and Google Slides. Its creative yet informative style, enhanced with relevant graphics and icons, ensure that critical information catches the eye, improves understanding, and encourages engagement.


8 diapositivas
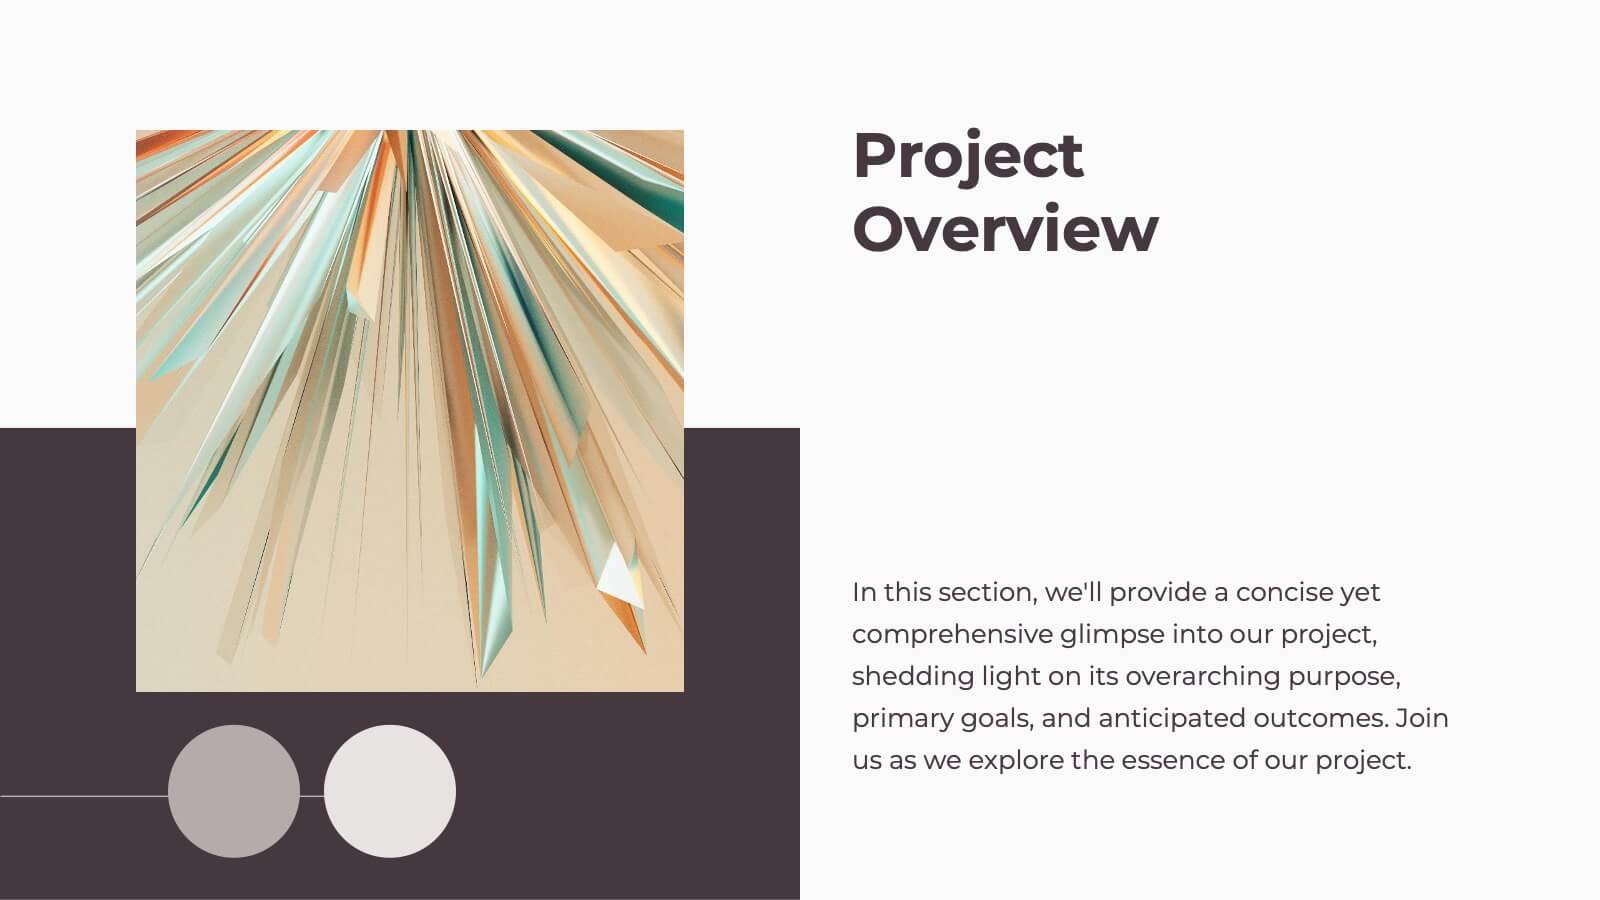
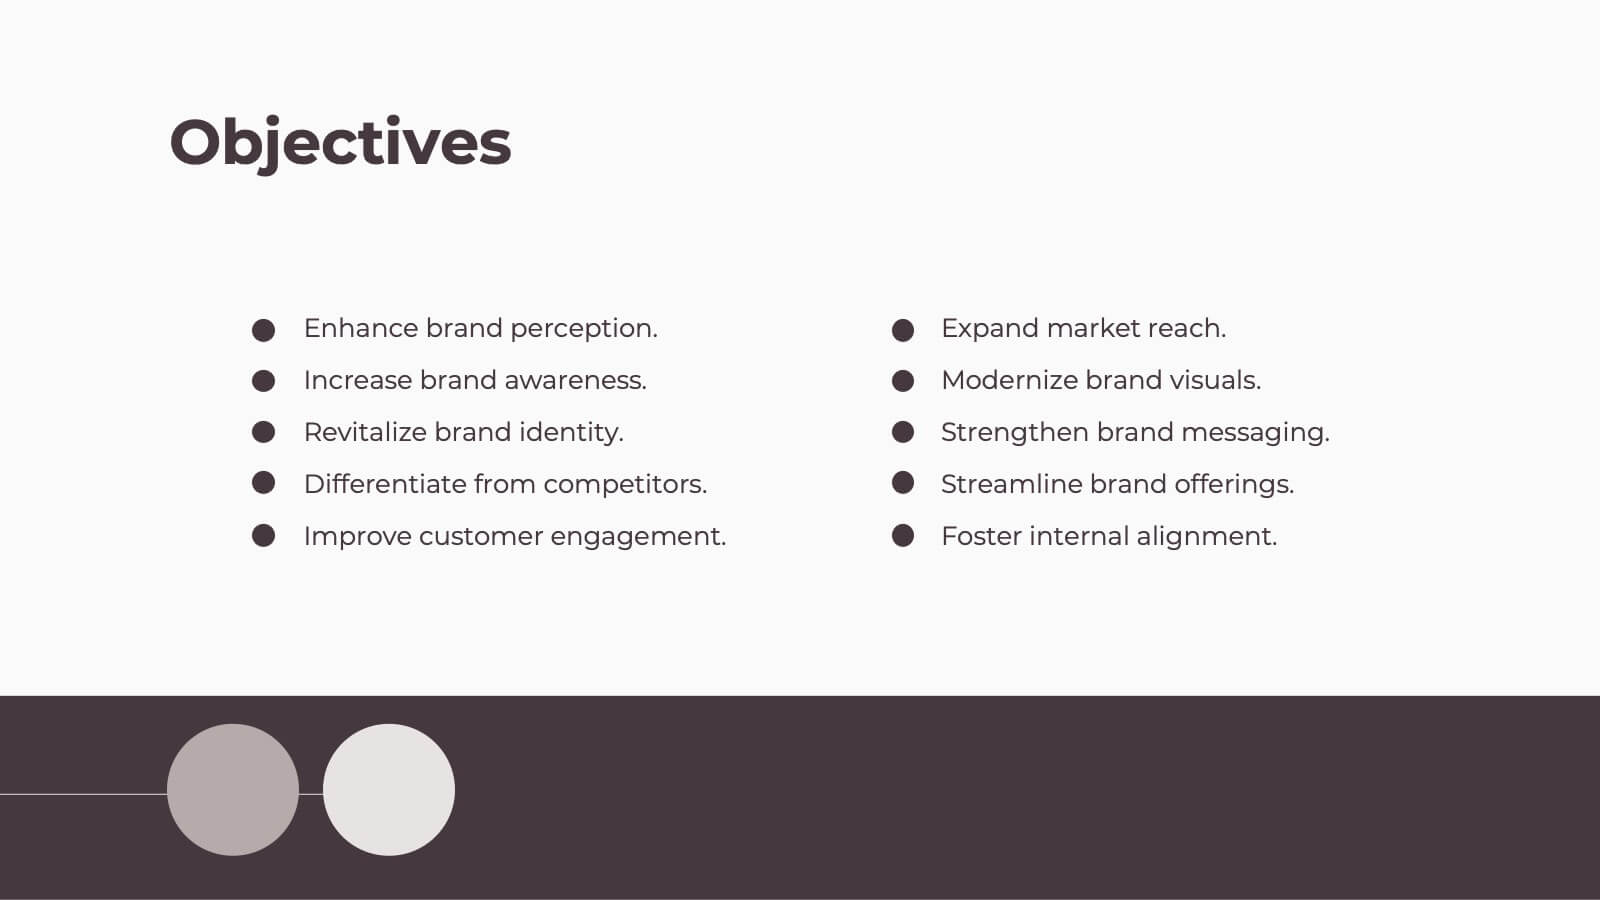
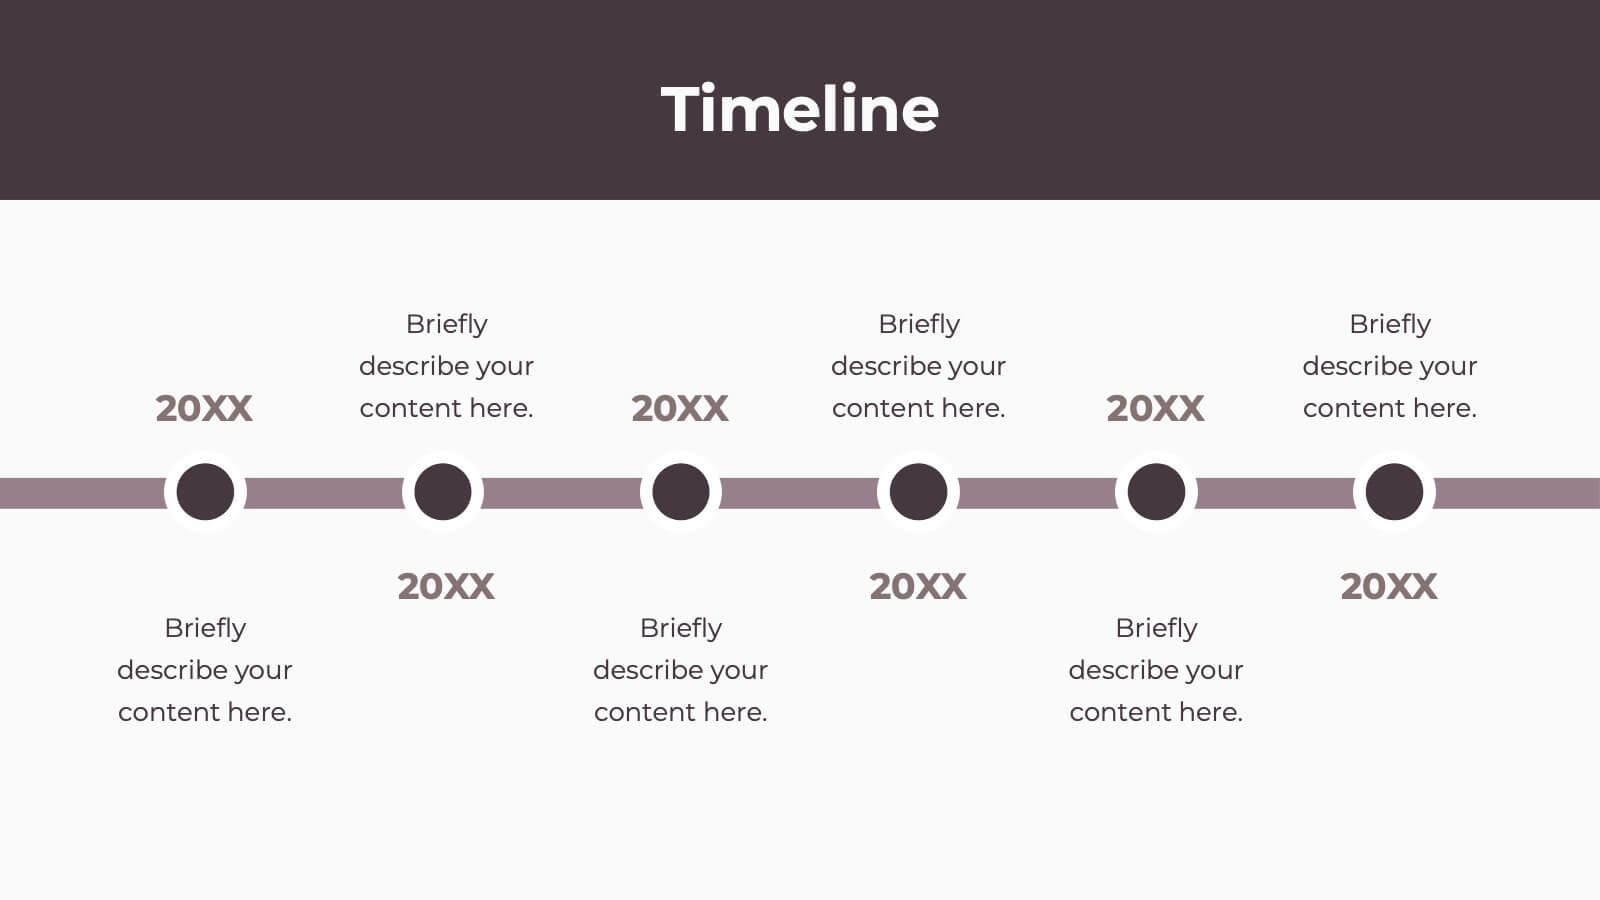
Project Timeline and Schedule Presentation
Keep your projects on track with this clear and professional timeline layout. This presentation is designed to help you outline tasks, milestones, and deadlines week by week. Easily visualize the flow of work, allocate resources efficiently, and ensure everyone stays aligned on the project schedule. Perfect for business meetings, project proposals, team updates, and academic planning. Fully editable and compatible with PowerPoint, Keynote, and Google Slides.


5 diapositivas
TAM SAM SOM Markets Analysis Presentation
Turn complex market insights into clear, visual storytelling with this dynamic layered presentation. Ideal for demonstrating market potential, target segments, and opportunity scope, it helps you communicate data with structure and impact. Fully compatible with PowerPoint, Keynote, and Google Slides for effortless editing and professional, presentation-ready results.


6 diapositivas
Problem Definition and Solution Path
Illuminate your strategy with this lightbulb-themed slide—ideal for mapping out challenges and presenting actionable solutions. Each bulb symbolizes a step on your path from problem to resolution. Fully editable in PowerPoint, Keynote, and Google Slides.


6 diapositivas
Phased Implementation Timeline Presentation
Visualize your project rollout in clear, progressive stages using this curved, multi-phase timeline. Perfect for strategic plans, implementation roadmaps, or development cycles. Includes 6 customizable points with labels, icons, and years. Ideal for business teams and consultants. Fully editable in PowerPoint, Keynote, and Google Slides. Clean, modern, and easy to adapt.


6 diapositivas
Achieving Career Success Presentation
Achieve your professional goals with the Achieving Career Success Presentation template. Designed for career coaches, professionals, and personal development strategists, this slide deck helps outline key milestones, success strategies, and growth trajectories in a visually compelling way. With a sleek, modern layout and clear step-by-step structure, this template is fully customizable and compatible with PowerPoint, Keynote, and Google Slides.


6 diapositivas
Market Segmentation by Demographics
Visually break down consumer behavior by gender with this clean, gender-split demographic chart. Ideal for marketing analysts and business strategists, this slide highlights key audience insights, purchasing trends, or engagement metrics. Fully editable in PowerPoint, Keynote, and Google Slides.


6 diapositivas
Risk Assessment Spider Chart Presentation
Clearly visualize risk exposure across multiple criteria with the Risk Assessment Spider Chart Presentation. This template is perfect for comparing key risk factors in a visual, easy-to-understand format. Ideal for project managers, risk analysts, and consultants. Fully customizable and works seamlessly with PowerPoint, Keynote, and Google Slides.


7 diapositivas
Humanistic Psychology Infographics
Explore the depths of human experience with our Humanistic Psychology Infographic, an essential tool for educators, students, and professionals in the field of psychology. This infographic is designed to visually communicate the principles and applications of humanistic psychology. Our infographic provides a snapshot of the core concepts of humanistic psychology, including self-actualization, the hierarchy of needs, and the importance of personal growth and fulfillment. It features sections on therapeutic techniques, the significance of empathy, and the focus on individual potential. With customizable graphics, you can illustrate the stages of personal development and the humanistic approach to well-being. This SEO-optimized infographic is tailored to convey the humanistic perspective effectively, making it an invaluable resource for presentations, educational materials, and mental health advocacy. Utilize this infographic to foster a deeper understanding of humanistic psychology and its role in promoting holistic mental health and human potential.


5 diapositivas
Team Roles and Responsibilities Matrix Presentation
Define accountability with this Team Roles and Responsibilities Matrix. Clearly map tasks to team members using RACI codes (Responsible, Accountable, Consulted, Informed). Ideal for project planning, cross-functional alignment, and team coordination. Fully editable and compatible with PowerPoint, Keynote, and Google Slides to suit any workflow or team structure.


21 diapositivas
Spectrum Project Timeline Presentation
Plan and execute your projects with precision using this detailed project plan template! Perfect for outlining objectives, timelines, and resource allocation. Ideal for project managers and teams aiming to ensure successful project delivery. Compatible with PowerPoint, Keynote, and Google Slides, this template keeps your project organized, clear, and on track. Ensure project success!