


Características


¿Tienes alguna pregunta?
Recomendar


7 diapositivas
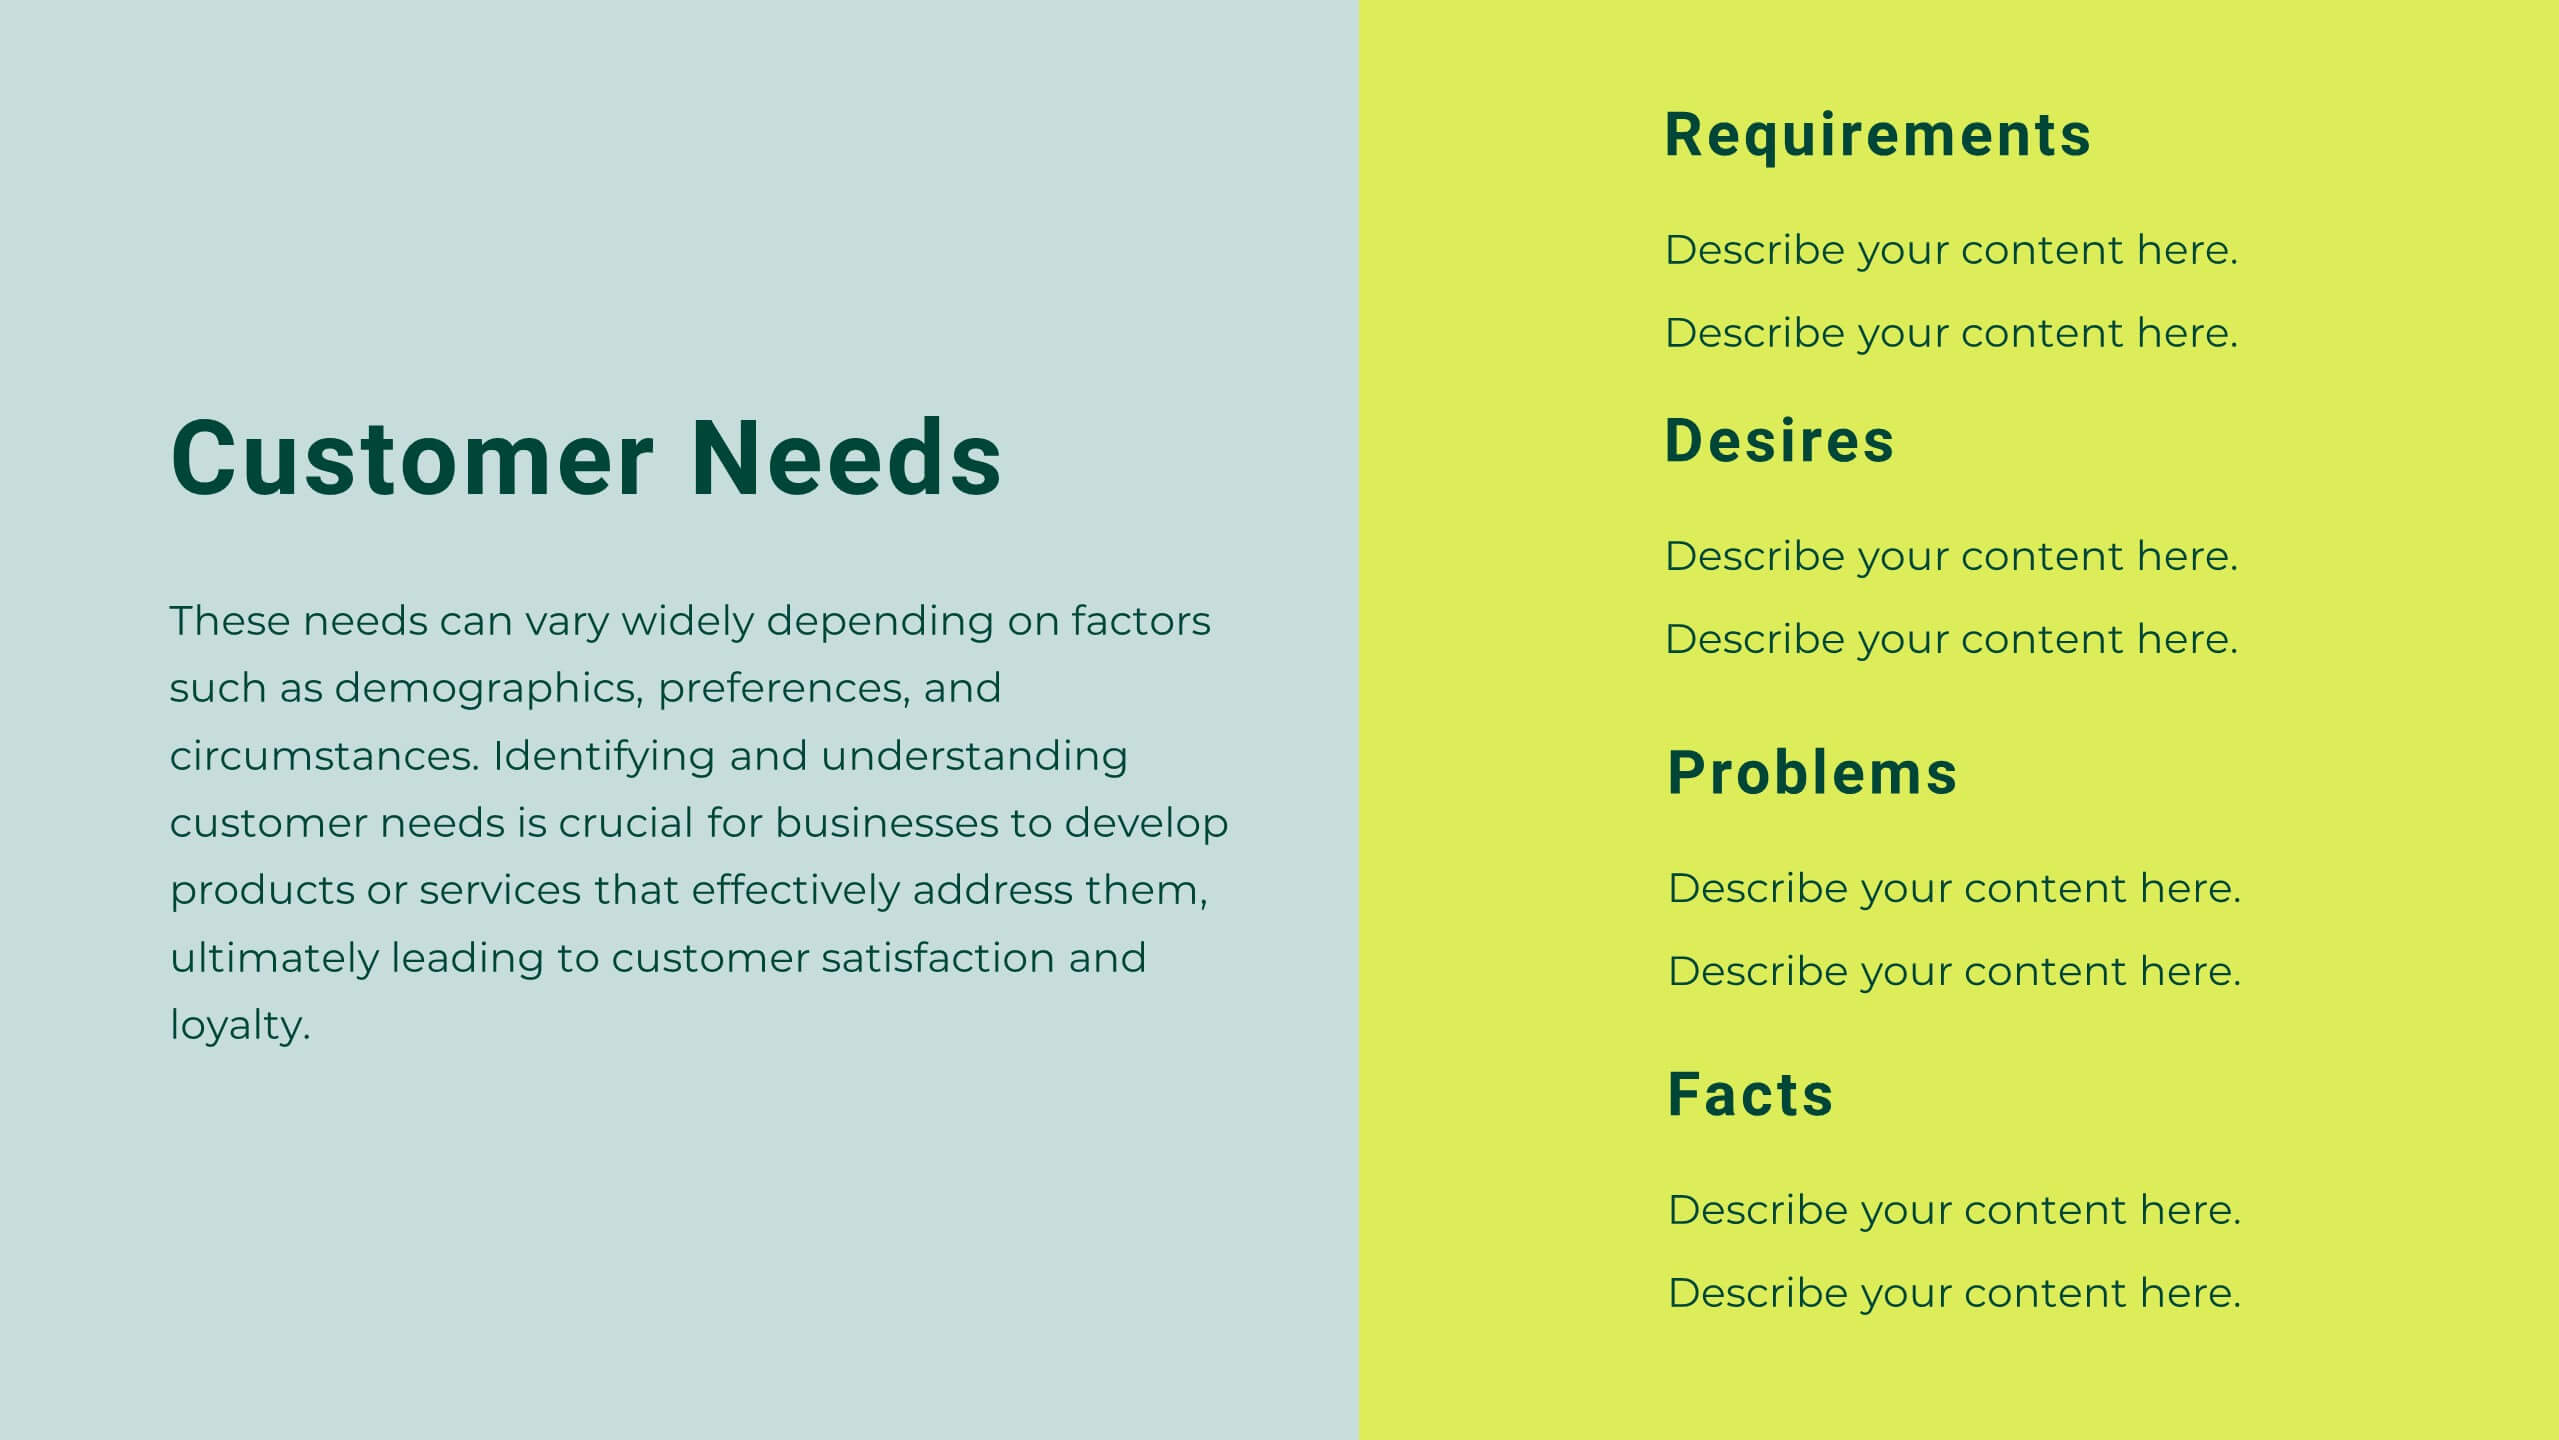
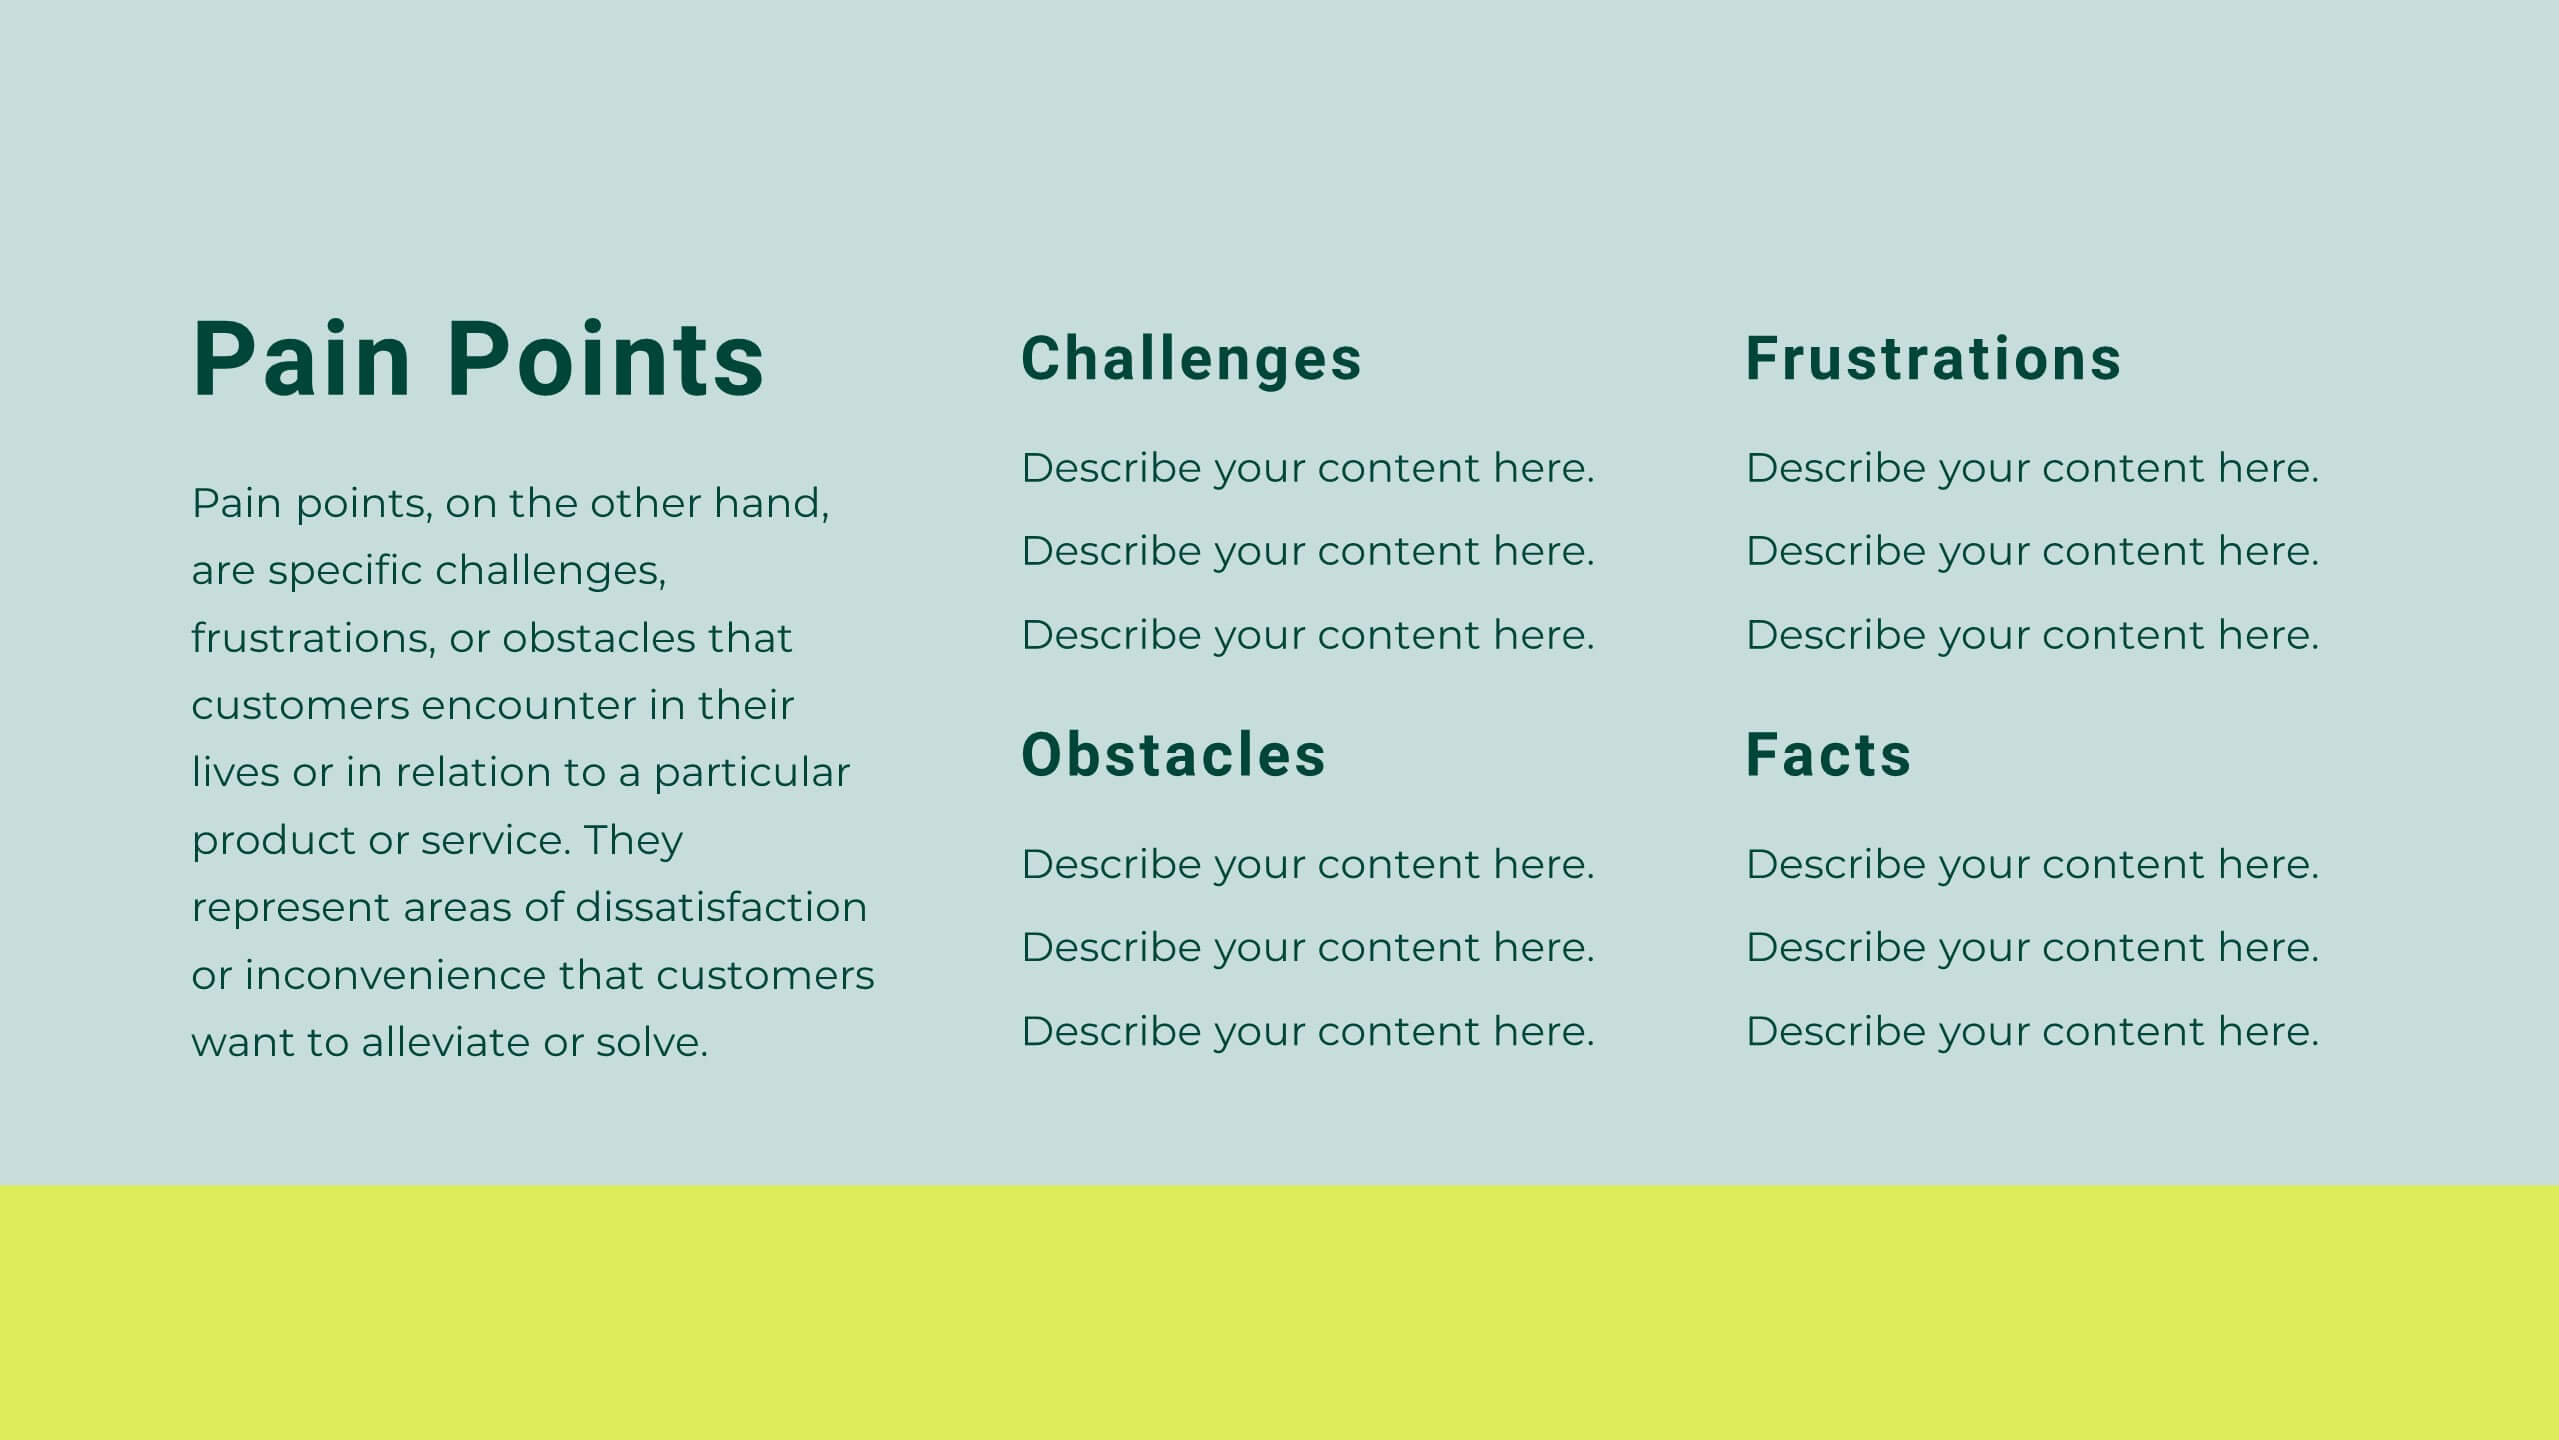
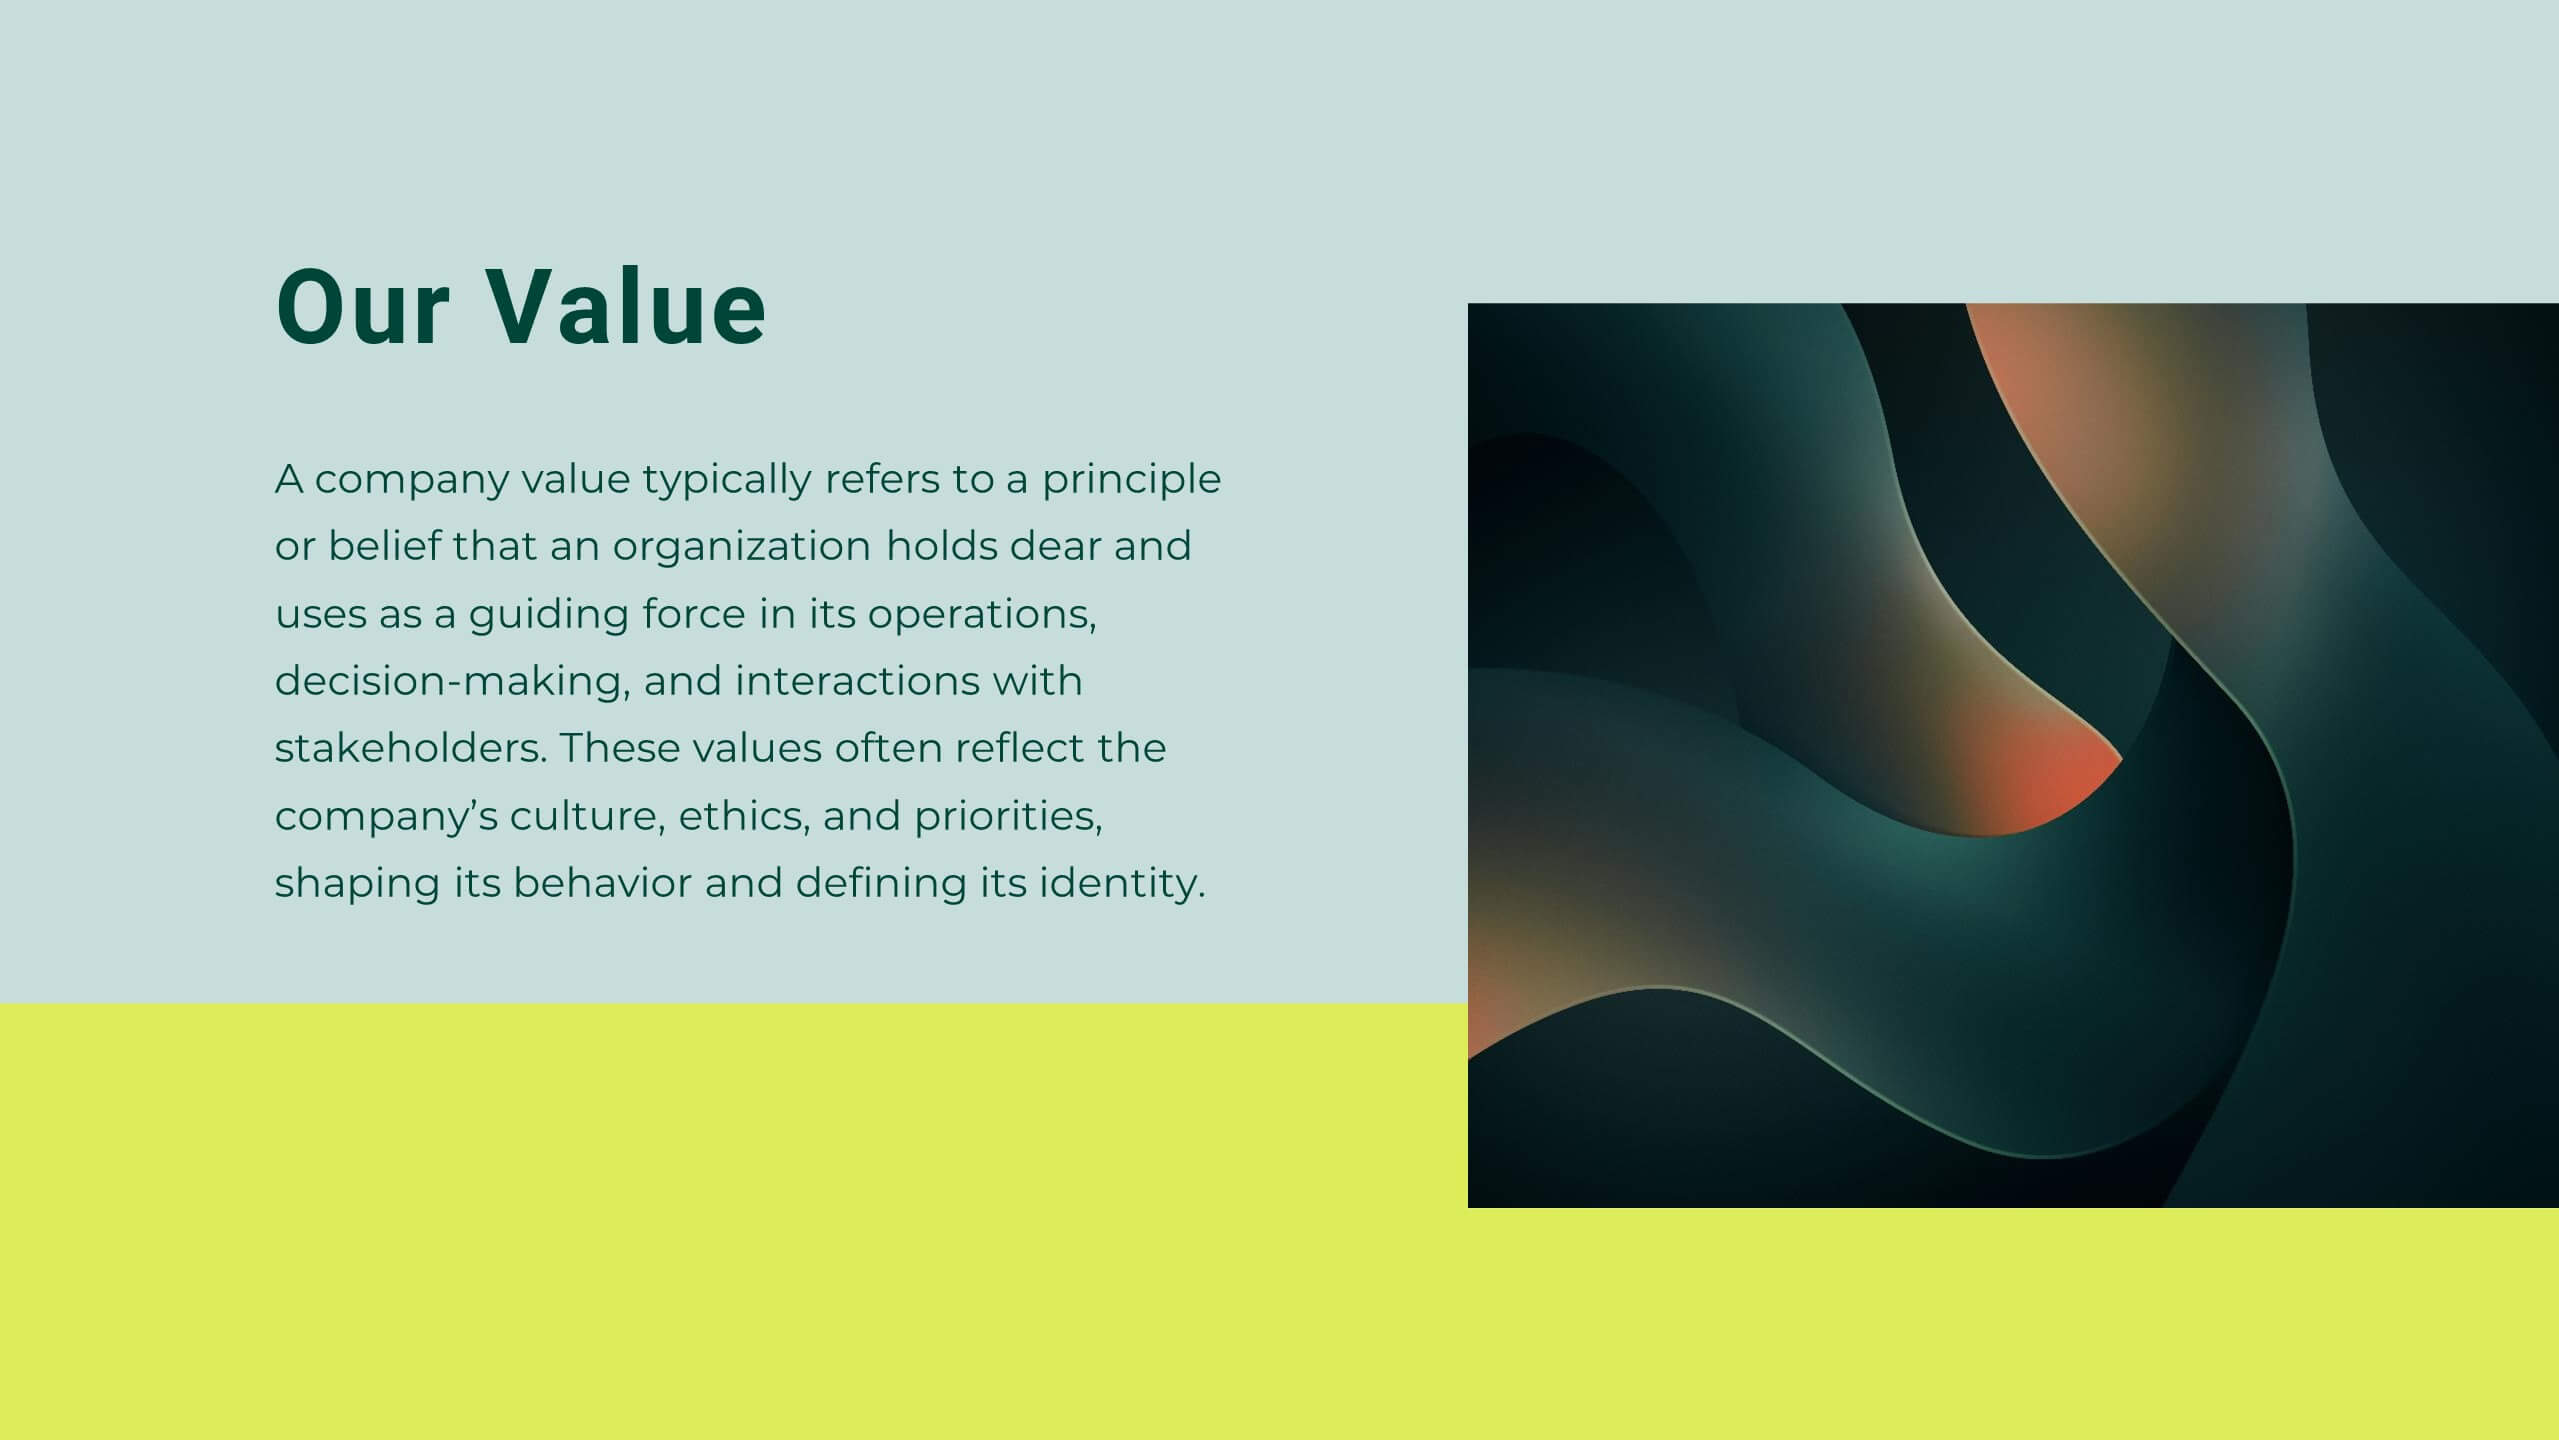
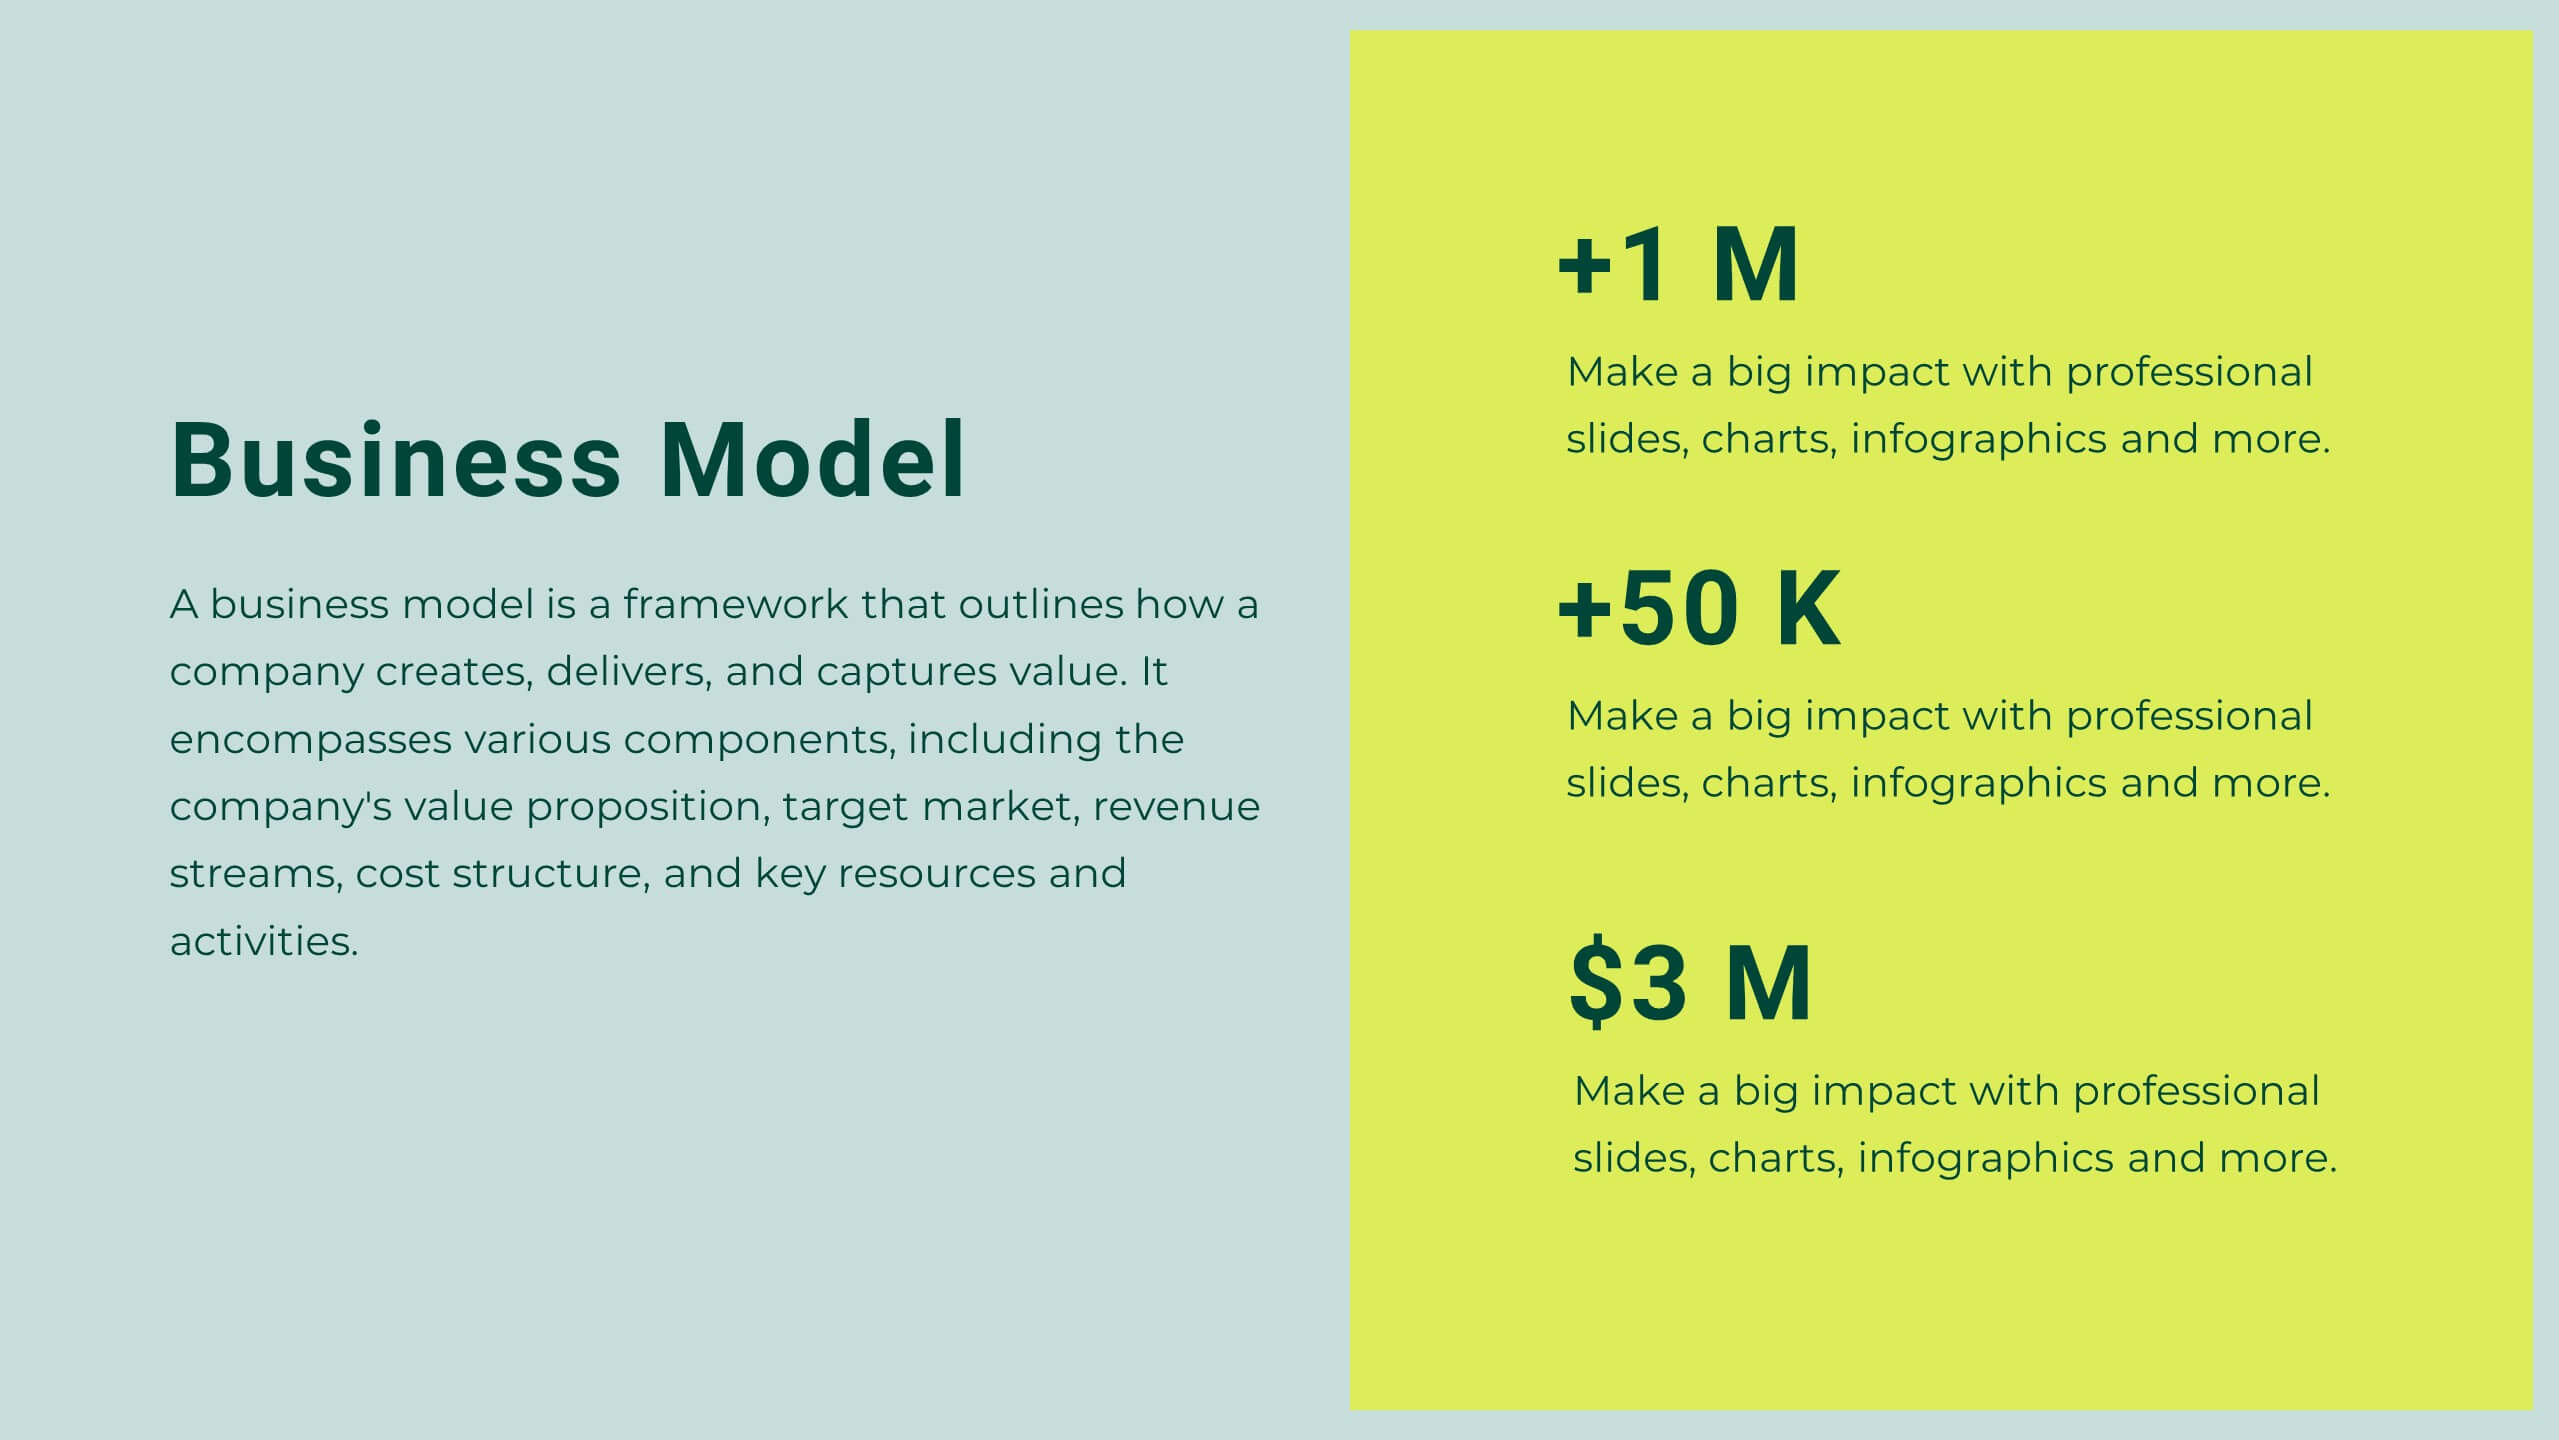
Iceberg Infographic Presentation Template
An Iceberg infographic is a powerful and eye-catching way to display information, it is a method for presenting complex information. This template is designed to be fully customizable and include all the elements you need to make an impact on your audience. The Iceberg can be used to visualize any concept that has a direct impact on your performance, from sales to customer retention, from how organizations are staffed to identifying the key players within teams. Use this template to create a detailed iceberg diagram of your business, its customers, and the things that impact them.


5 diapositivas
Importance of Sex Education Infographics
Sex Education is an important aspect of human development, but it can be a difficult topic to discuss. It is important for individuals to be knowledgeable about their own bodies and health, as well as understand healthy relationships and consent. These Infographics are visual tools designed to illustrate the need for sex education in schools and society. This template includes statistics, data, and facts about the benefits of sex education, including reducing the risk of sexually transmitted infections and unintended pregnancies, promoting healthy relationships, and empowering young people to make informed decisions about their sexual health.


6 diapositivas
Adapting to Change in Business Presentation
Effectively illustrate business adaptability with this dynamic domino-effect slide. Designed to visually represent cause-and-effect relationships, this template is ideal for change management, business strategy, and risk assessment presentations. The falling blocks symbolize challenges, interventions, and strategic adjustments to drive impactful decision-making. Fully editable—customize colors, text, and layout to match your needs. Compatible with PowerPoint, Keynote, and Google Slides for seamless use.


8 diapositivas
Risk Analysis Bowtie Diagram
Clarify your risk management strategy with the Risk Analysis Bowtie Diagram Presentation. This visual framework helps you analyze causes and consequences of a hazardous event using the bowtie model. The left side details potential causes and preventive controls, while the right outlines possible consequences and mitigating defenses. With bold "Before" and "After" labels, this slide makes complex risk pathways easy to understand. Fully editable in PowerPoint, Keynote, and Google Slides, with multiple highlighting variations to focus on either threats or outcomes.


6 diapositivas
Fishbone Concept Infographic
Dissect complex issues with our Fishbone Concept Infographic, ideal for Powerpoint, Google Slides, and Keynote. This infographic, also known as the Ishikawa or cause-and-effect diagram, is designed for problem-solving and root cause analysis. This template features a series of branching arrows leading to a central spine, enabling you to map out multiple cause-and-effect relationships. Each ‘bone’ represents a category of causes that you can customize to fit your specific analysis needs. With this fishbone infographic, you can effectively organize and present complex data, making it easier for your audience to understand and engage with the content of your presentation.


21 diapositivas
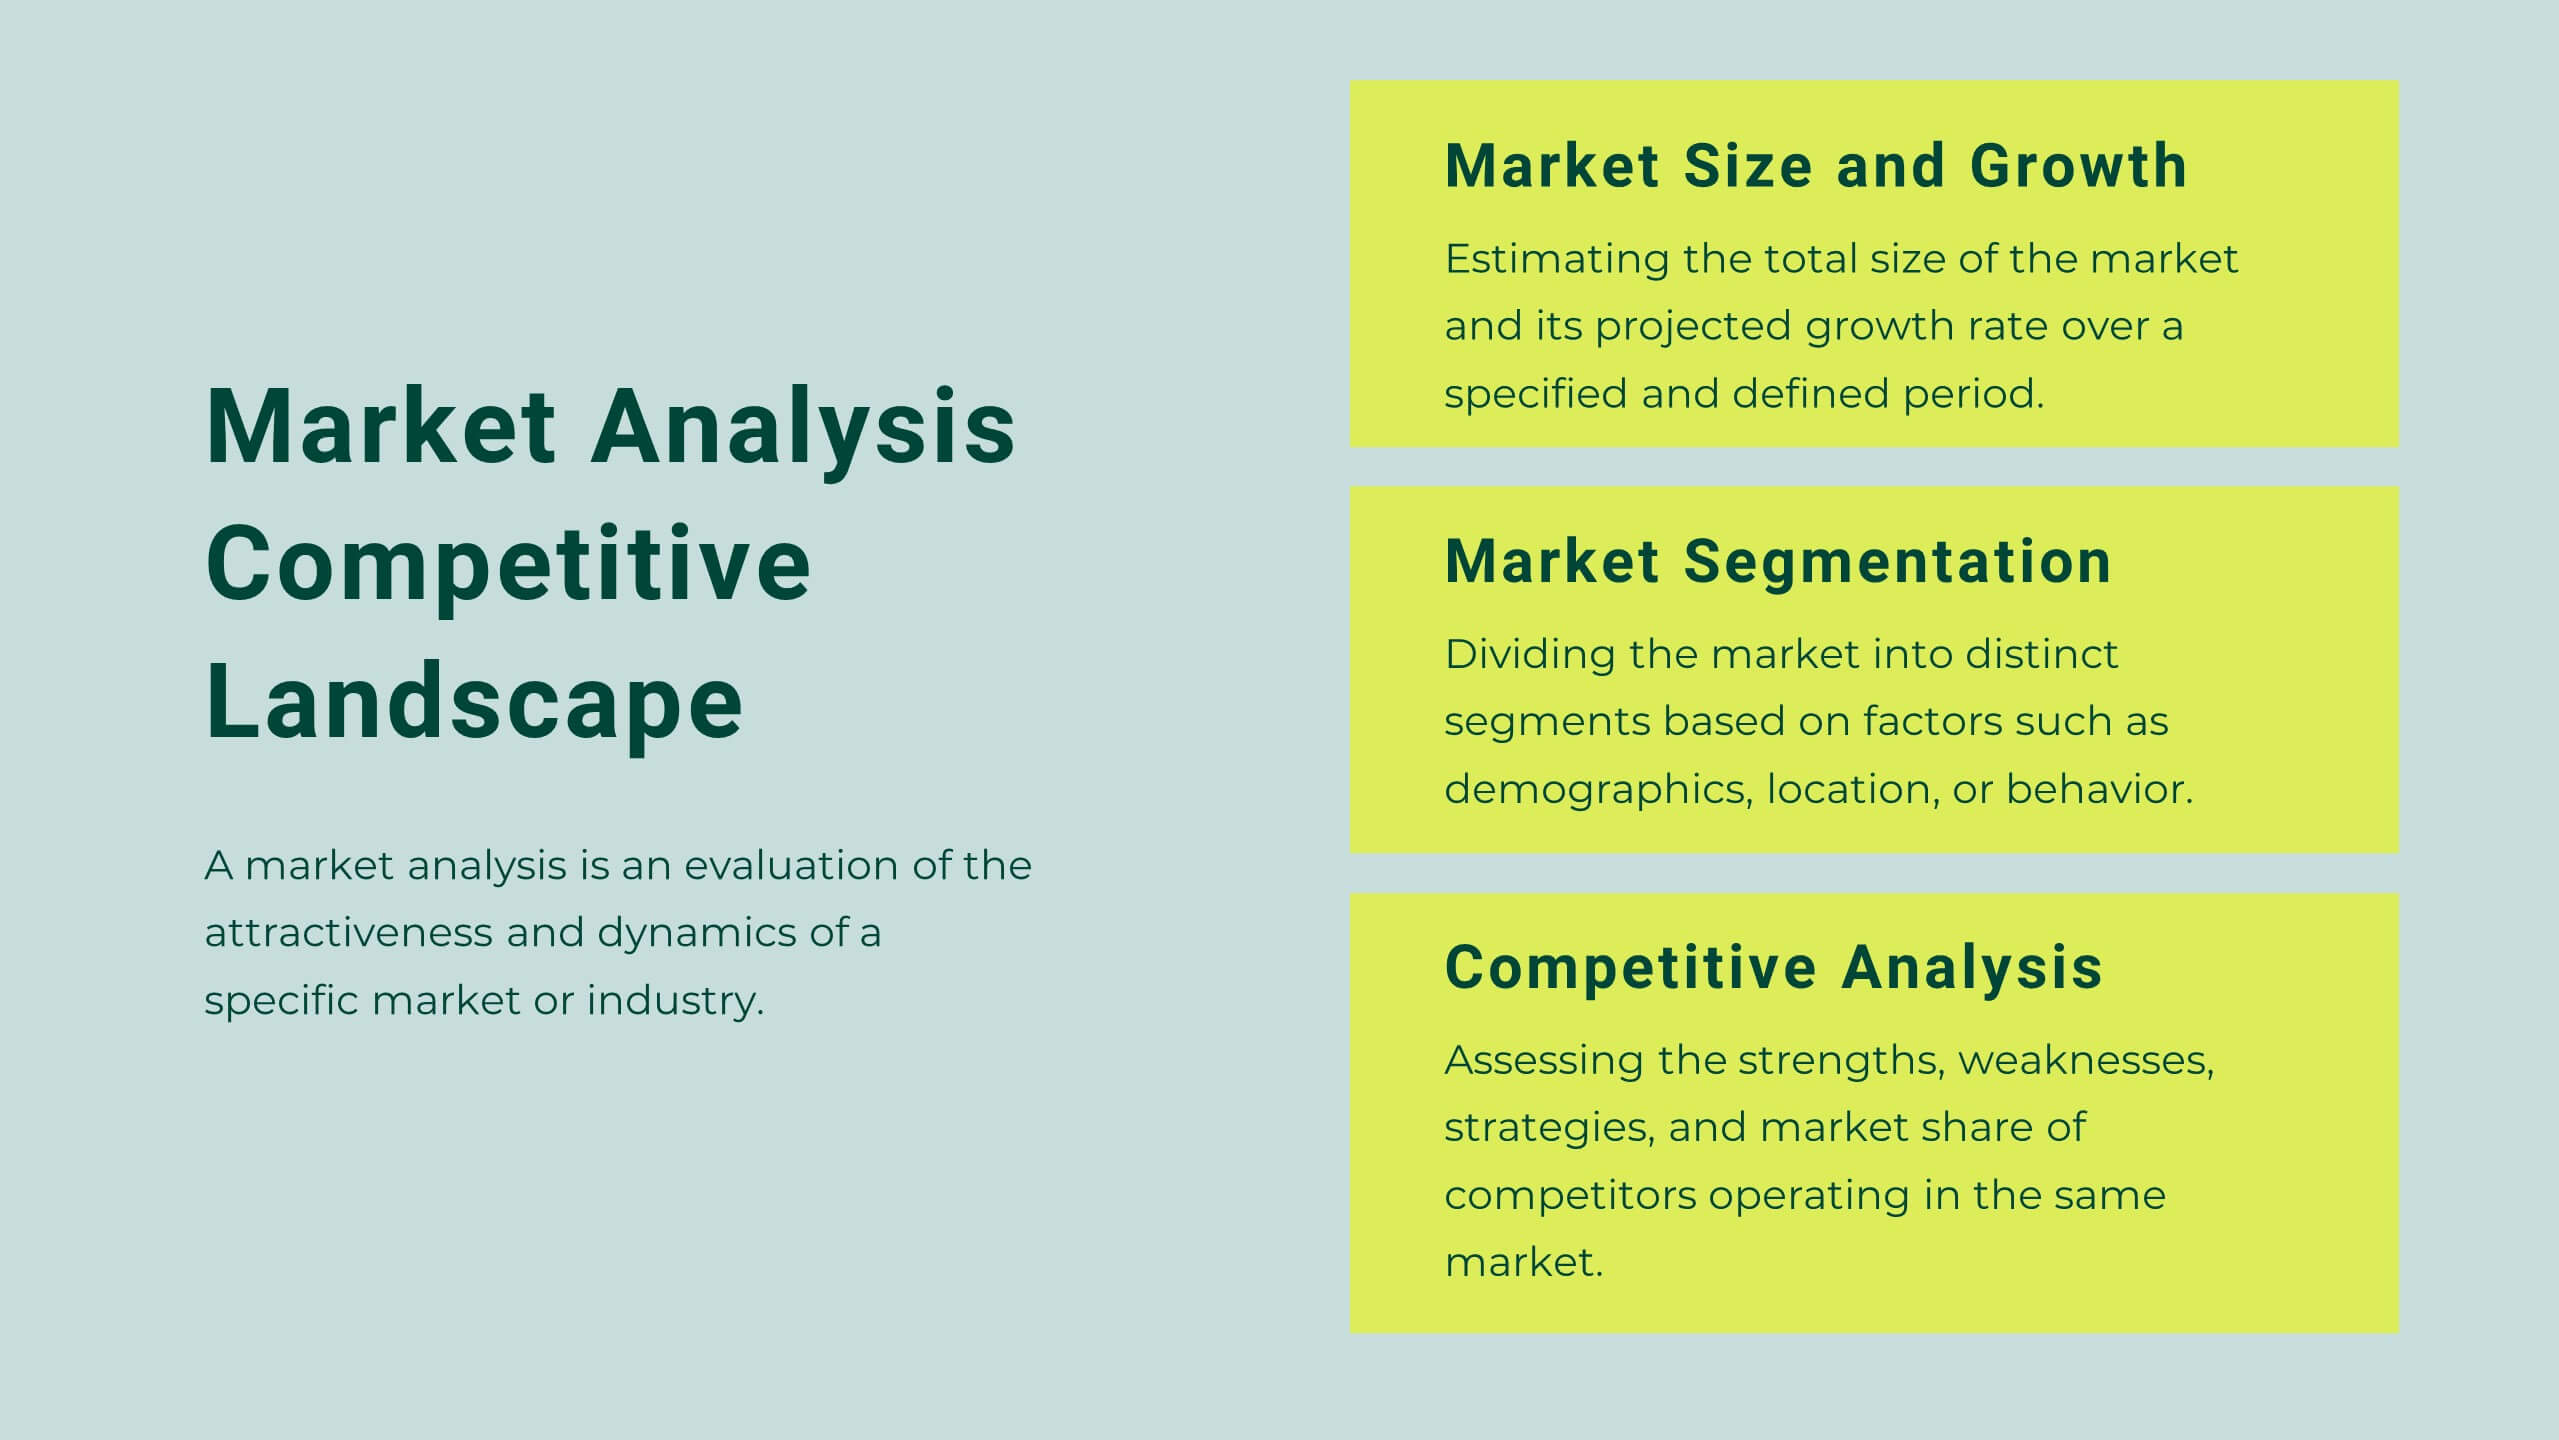
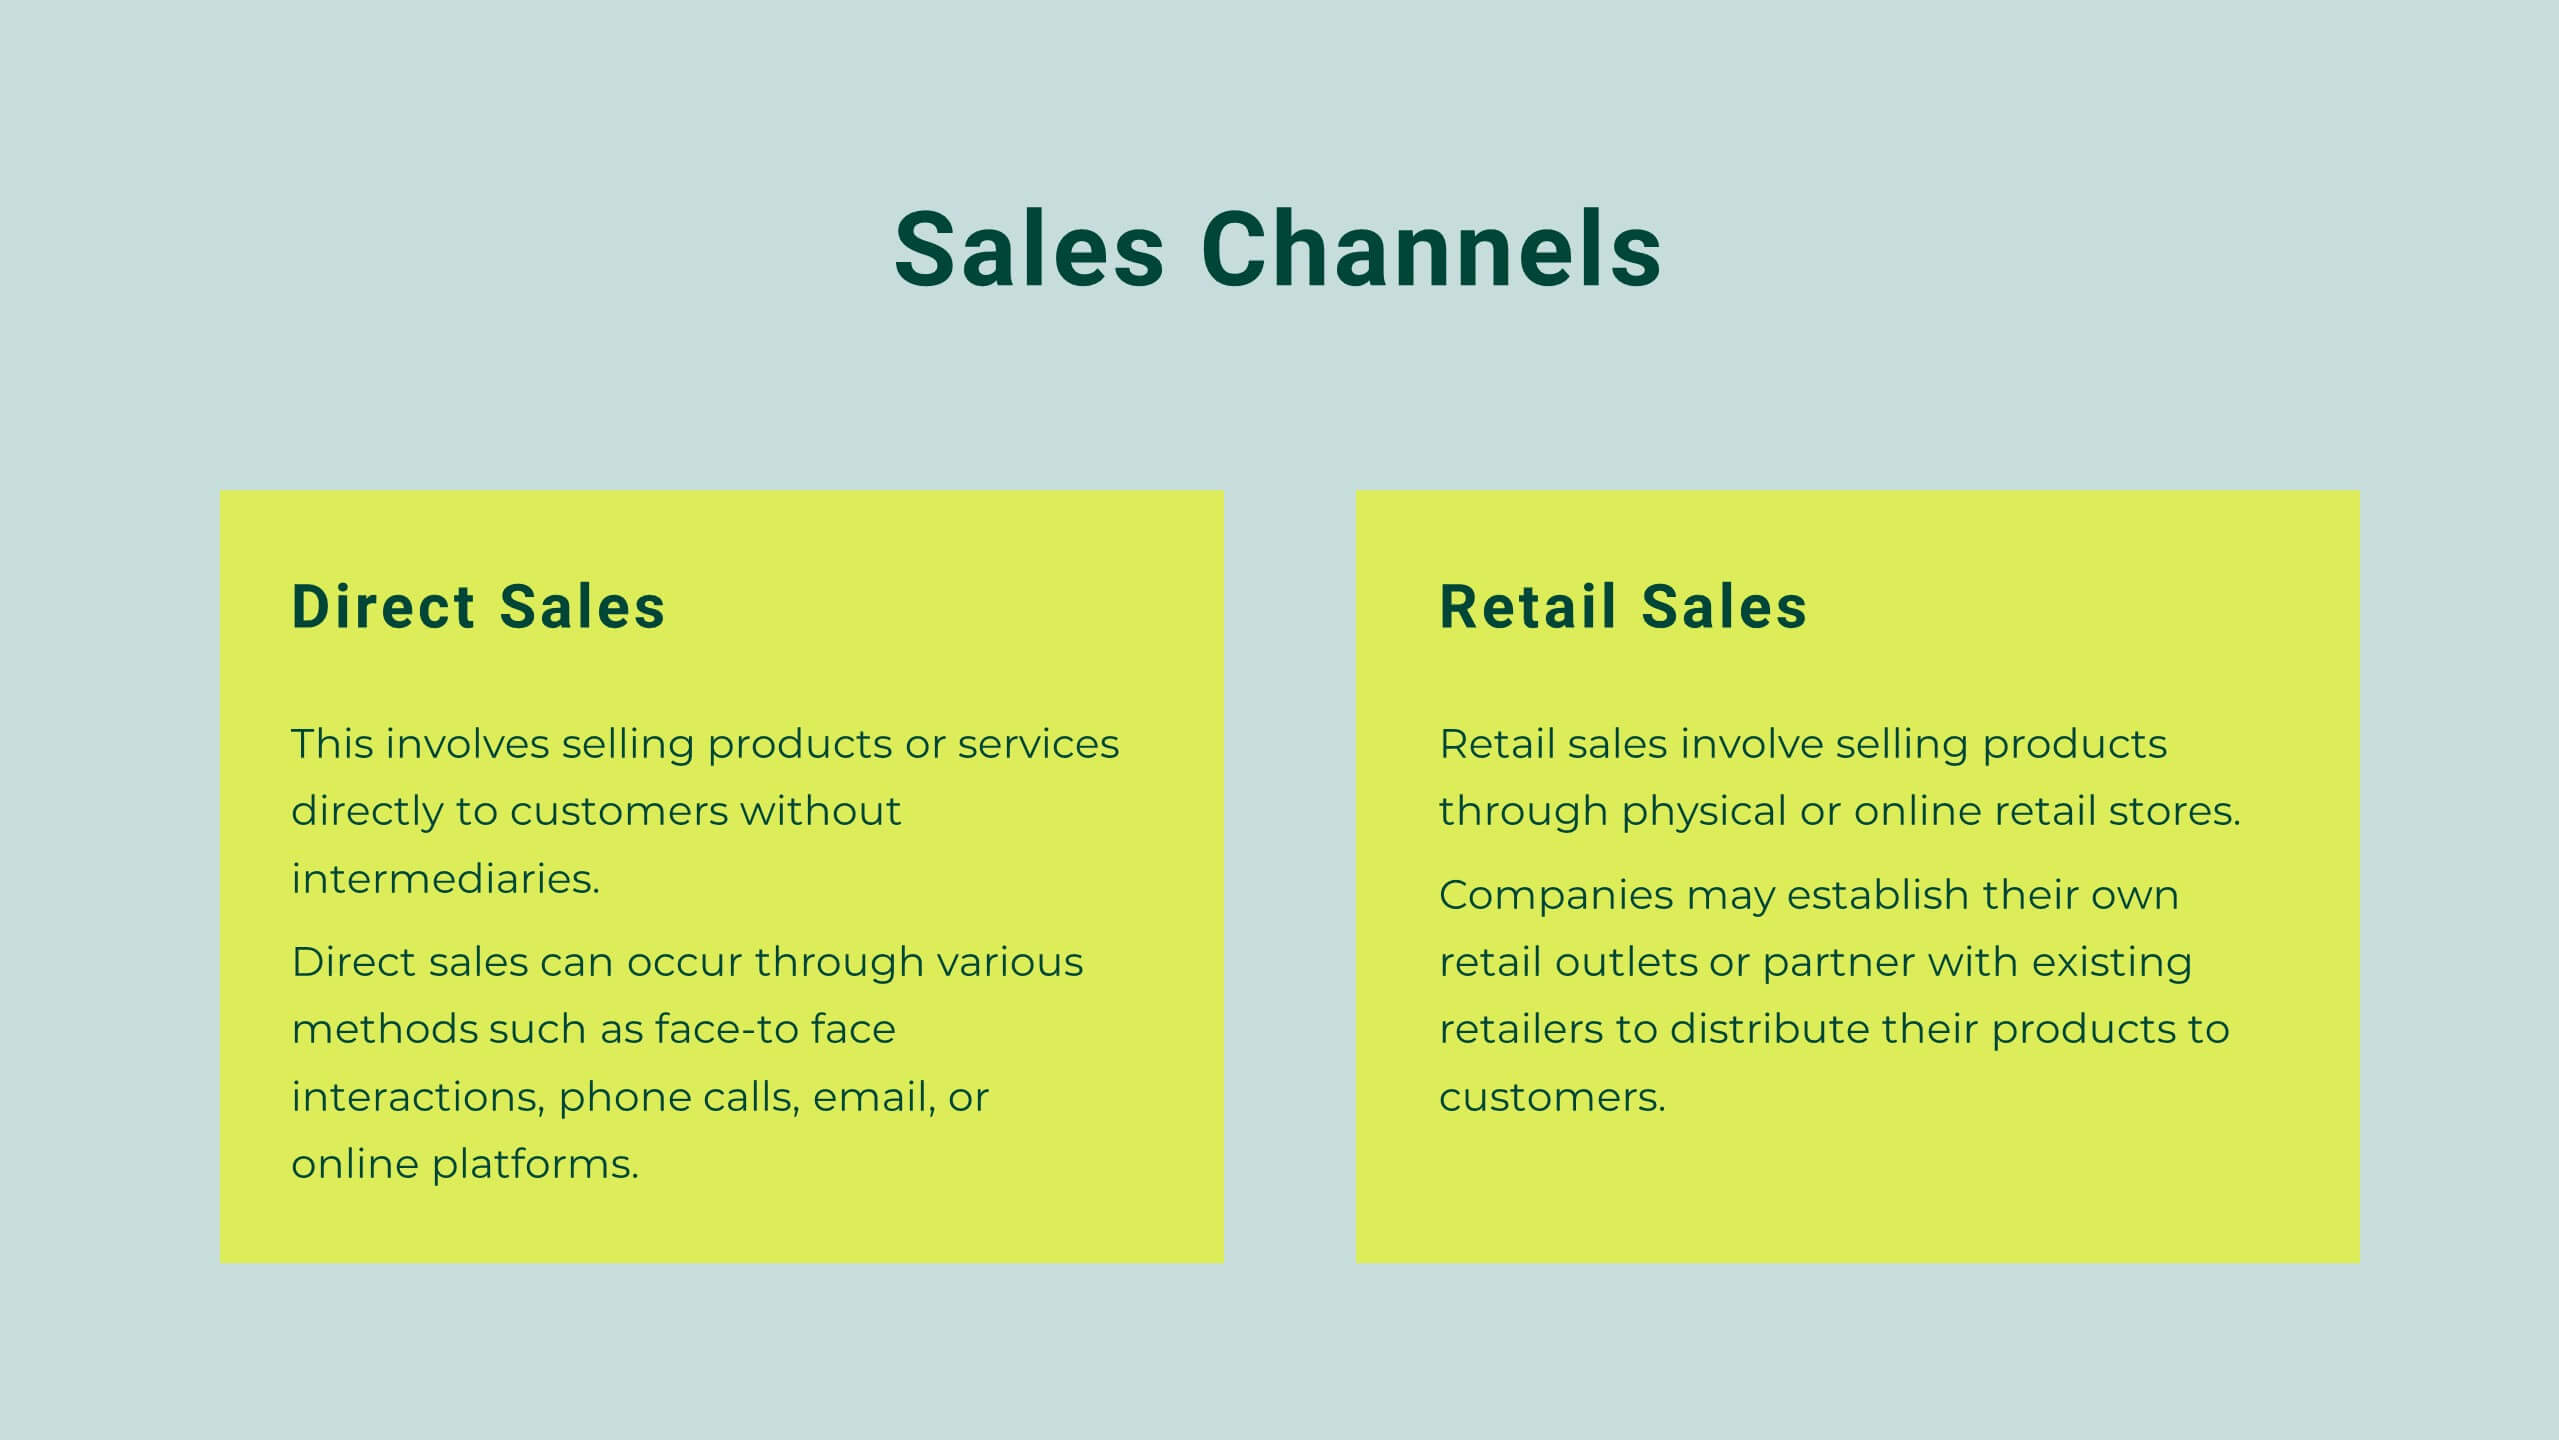
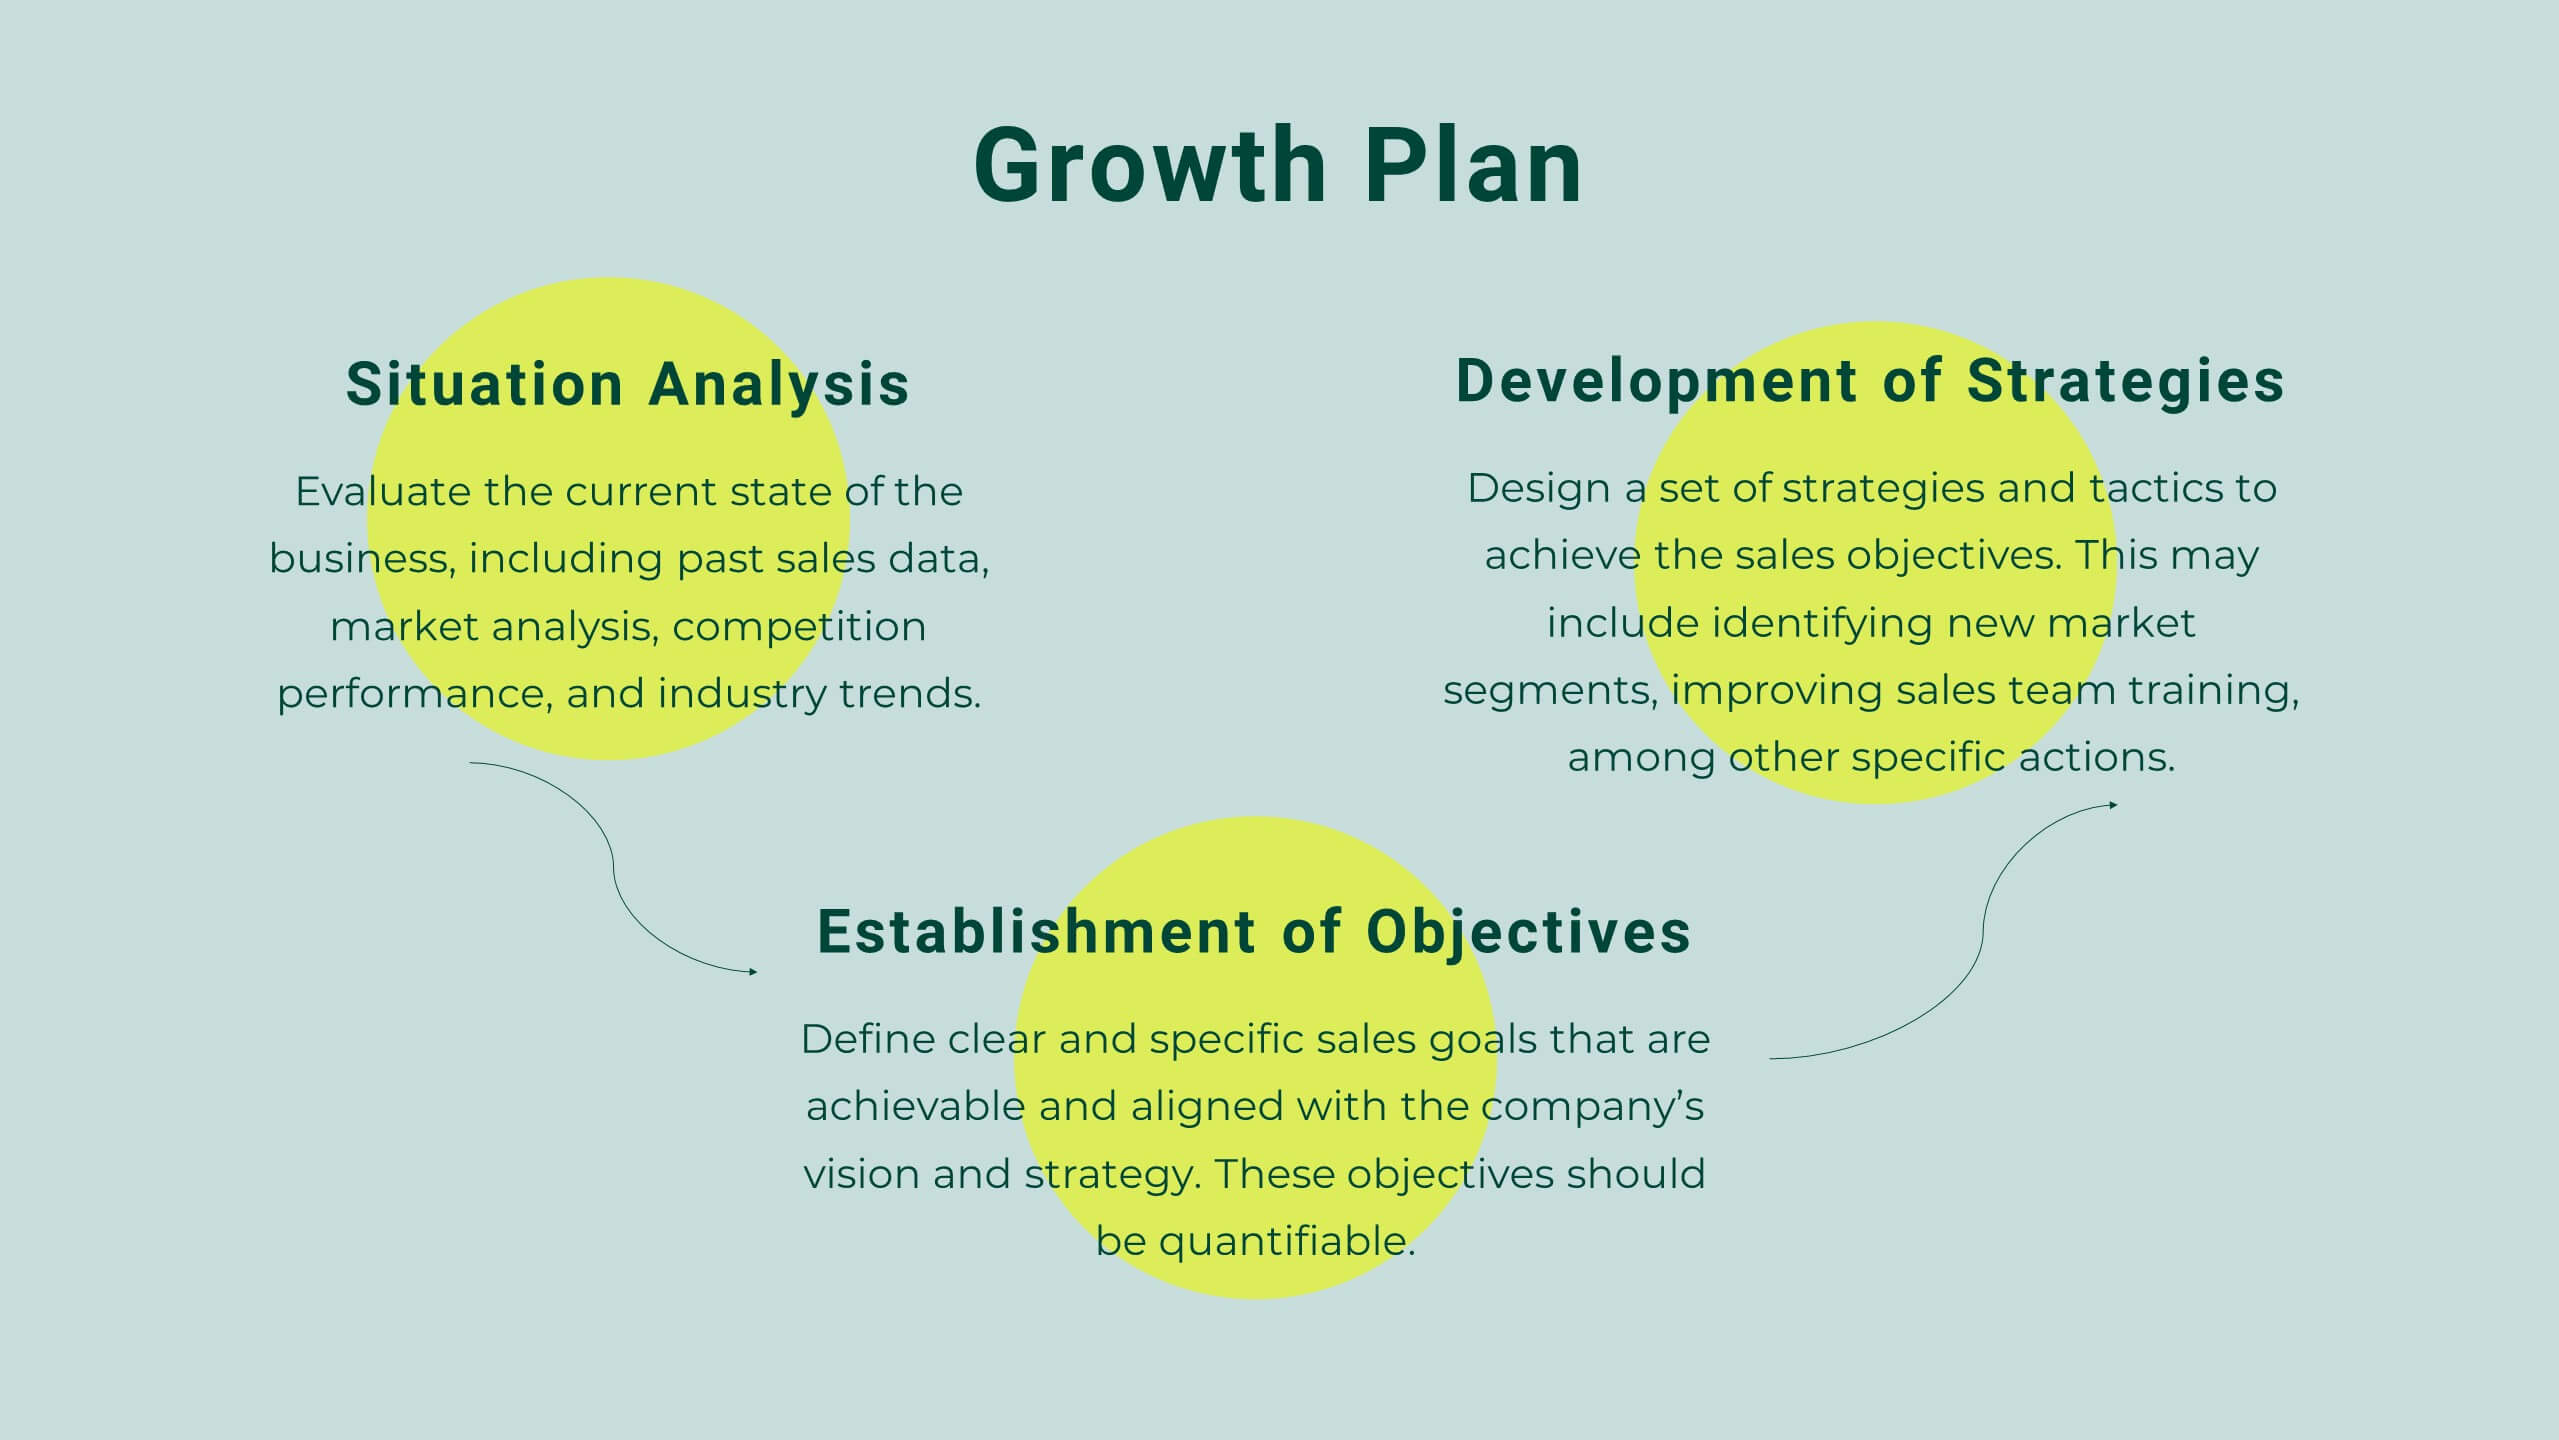
Nimbus Startup Growth Plan Presentation
Supercharge your startup's growth with this vibrant presentation template! Ideal for outlining your business plan, it includes slides for mission, market analysis, and financial overview. Capture investor attention with clear visuals and compelling content. Compatible with PowerPoint, Keynote, and Google Slides for a seamless presentation experience on any platform.


23 diapositivas
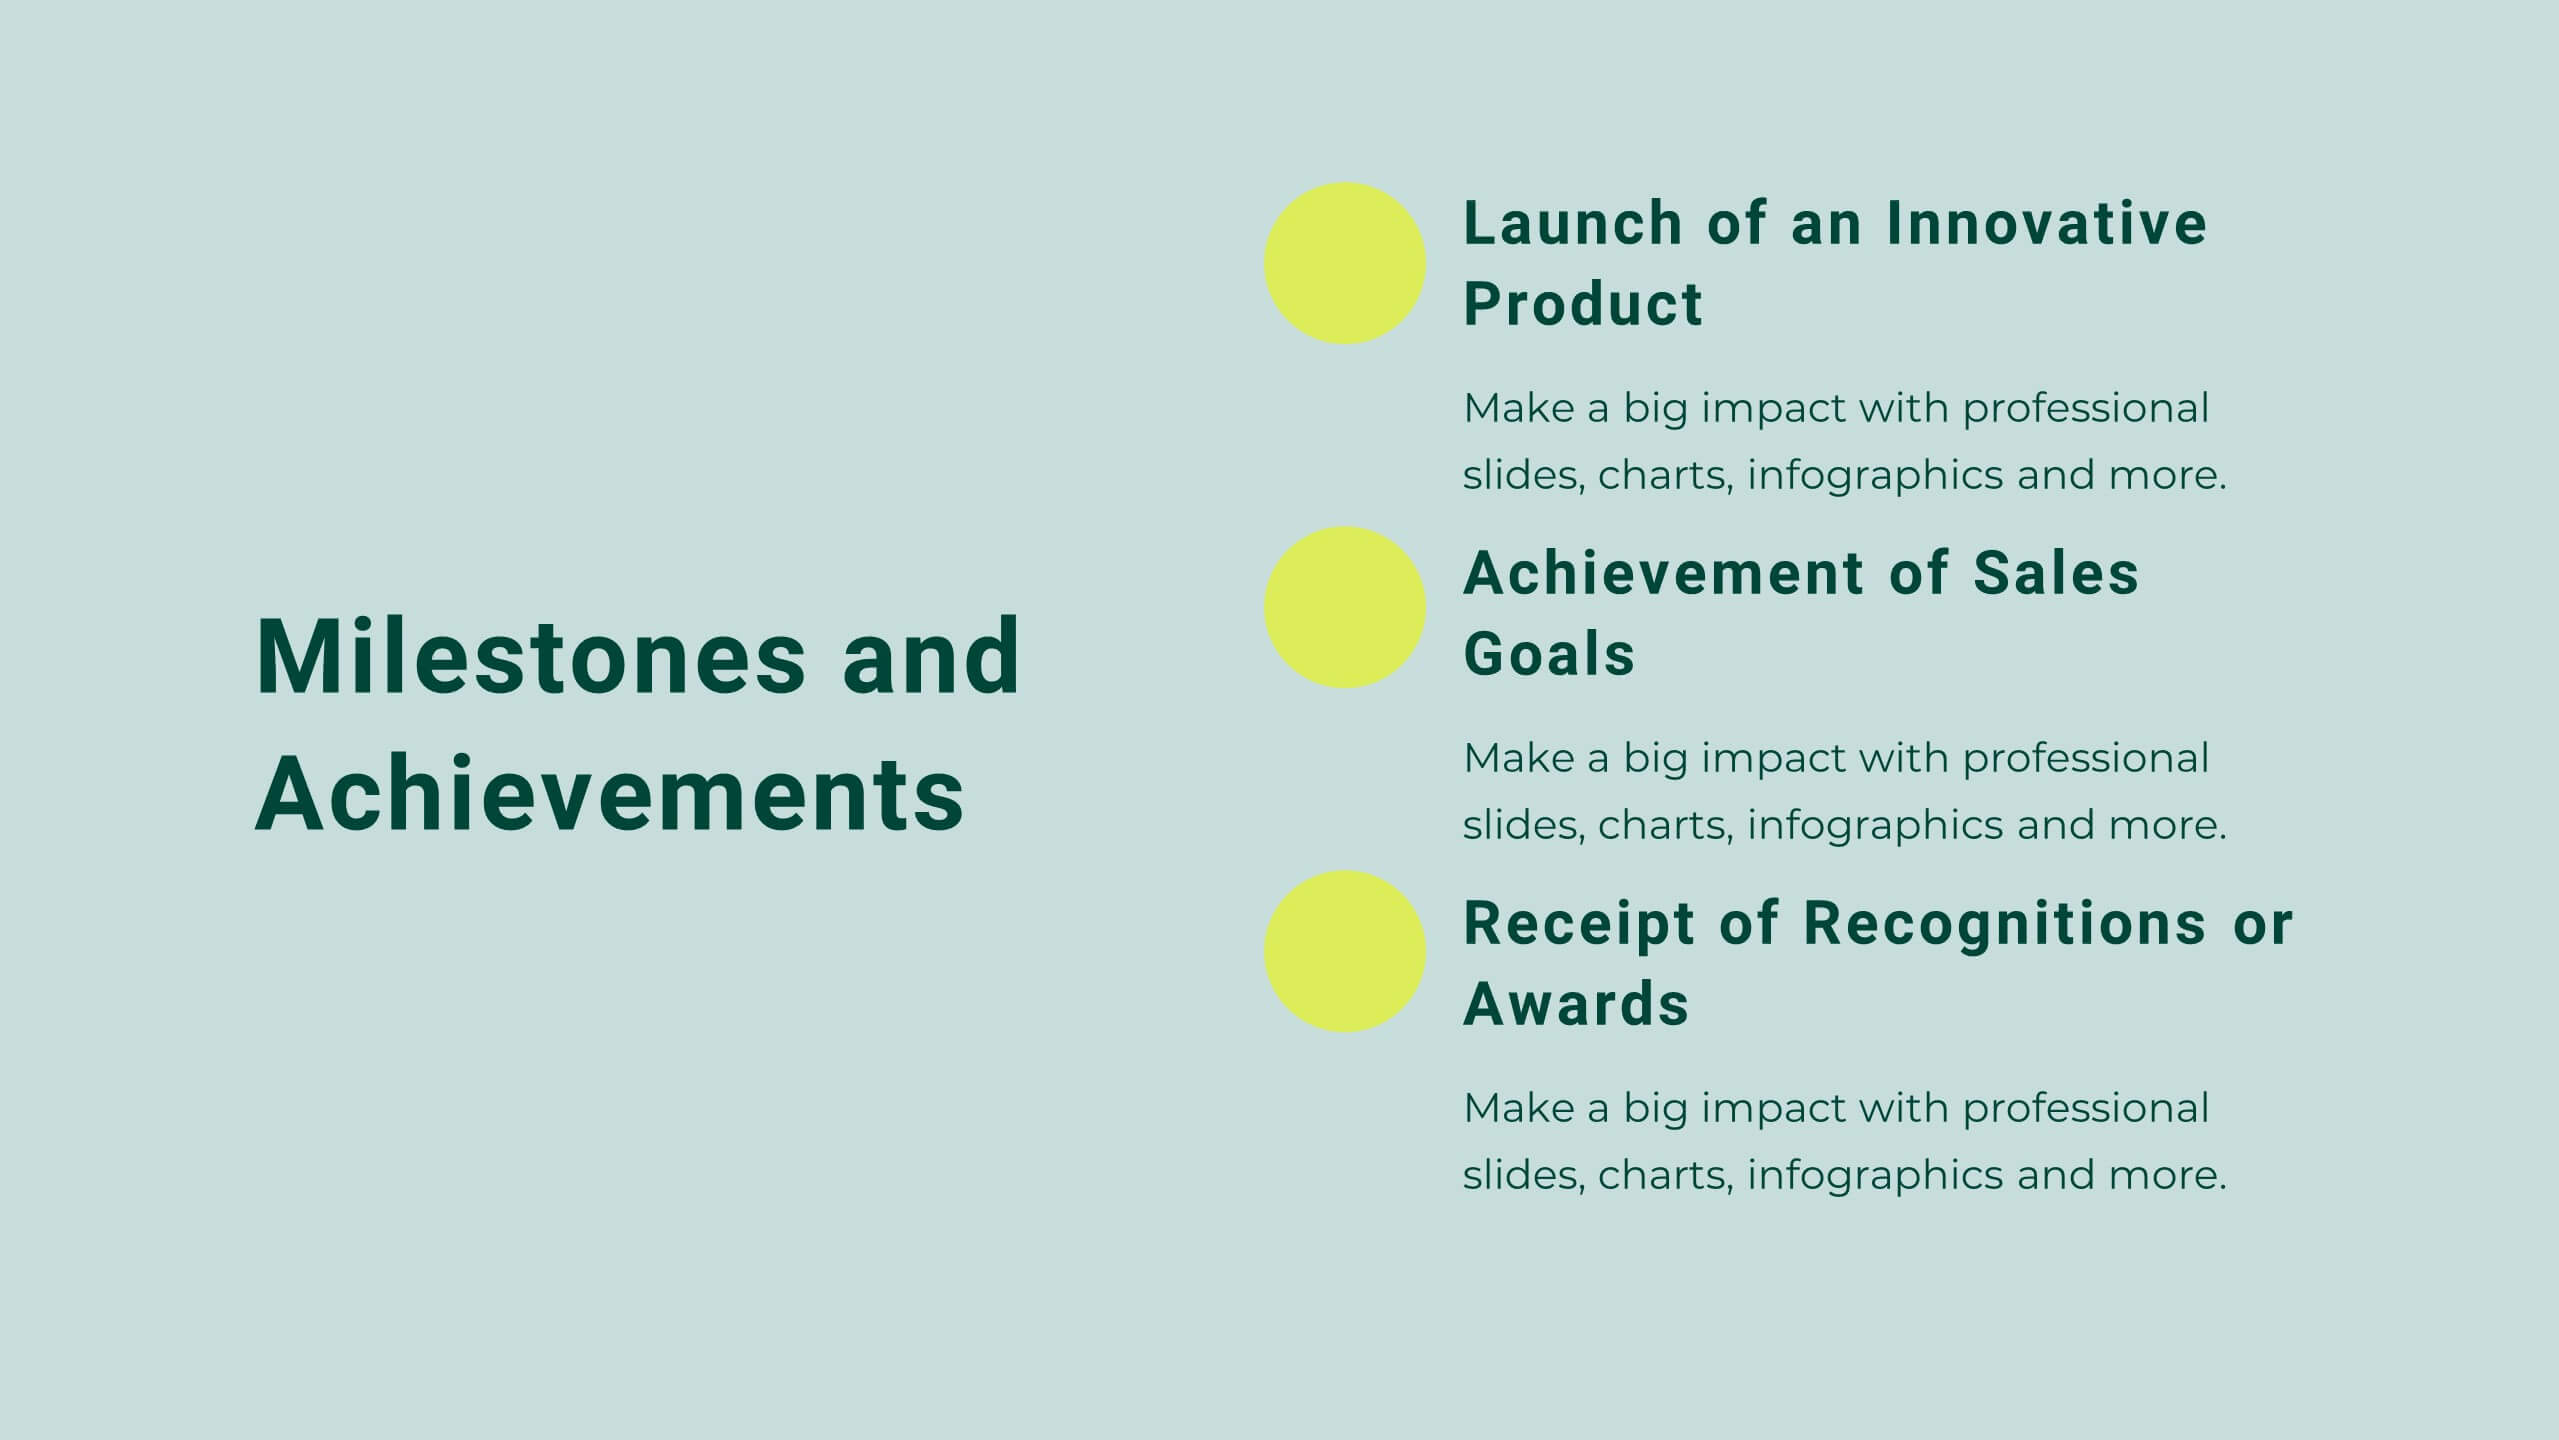
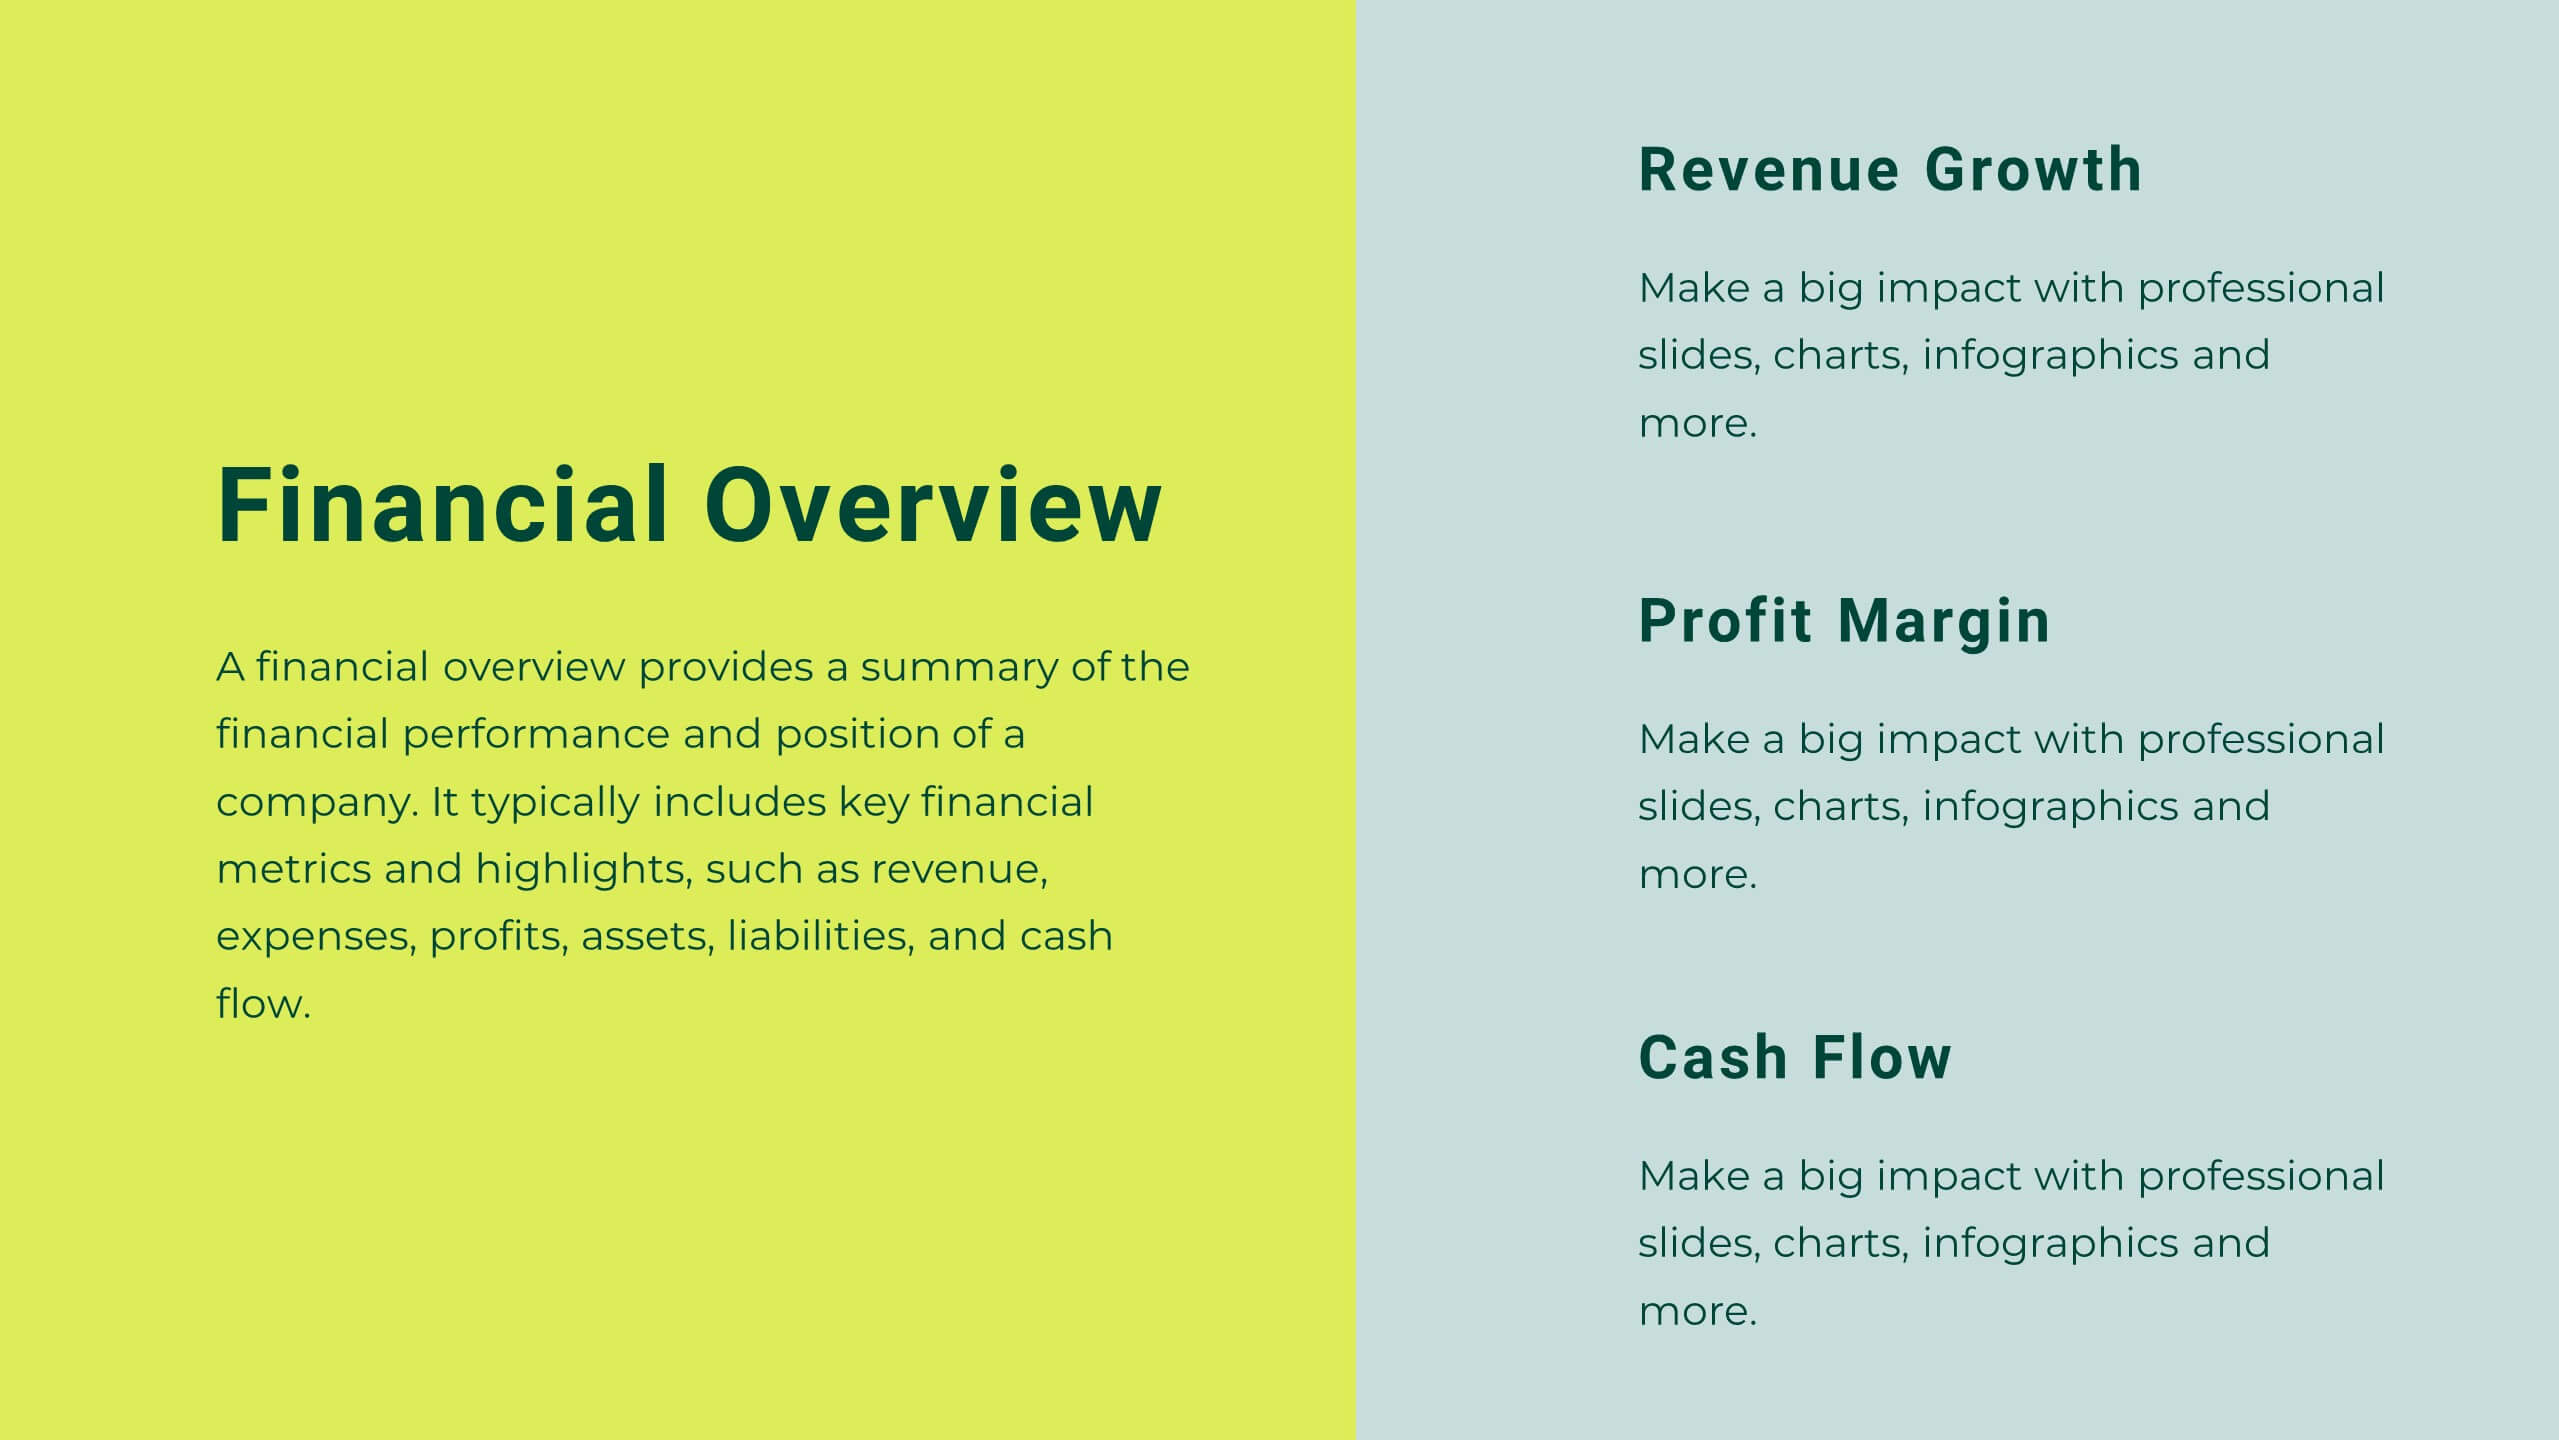
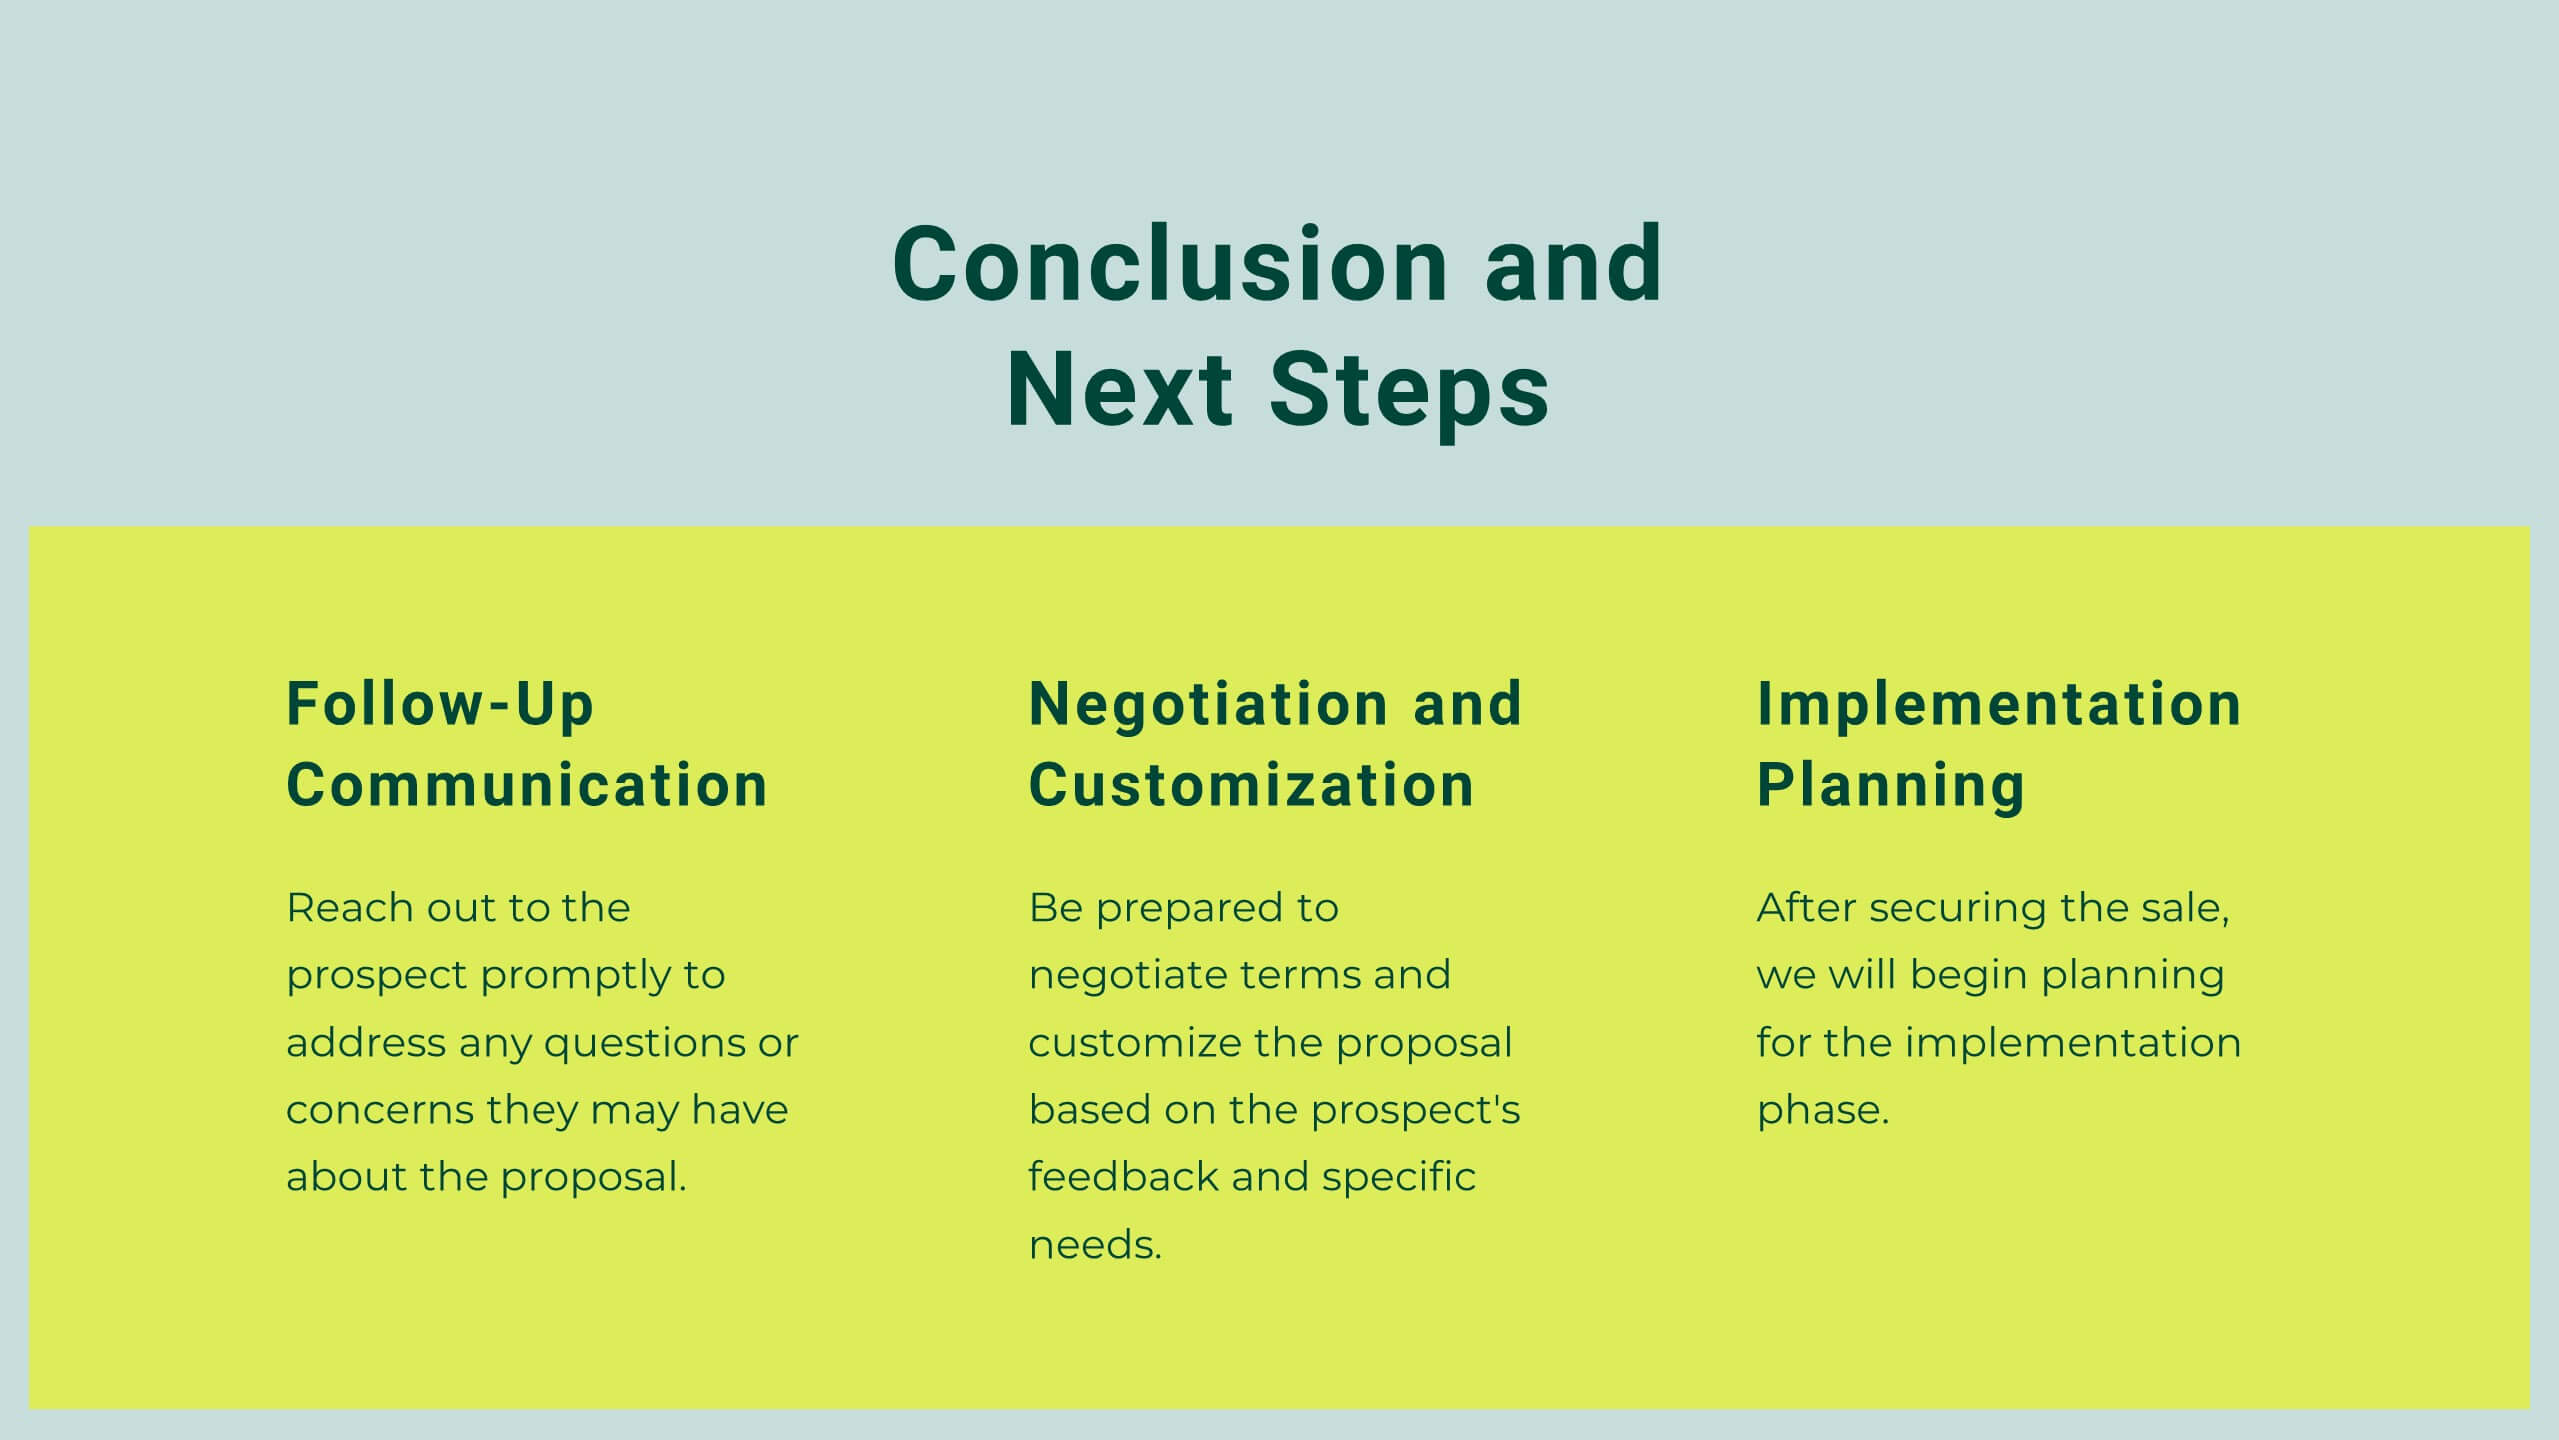
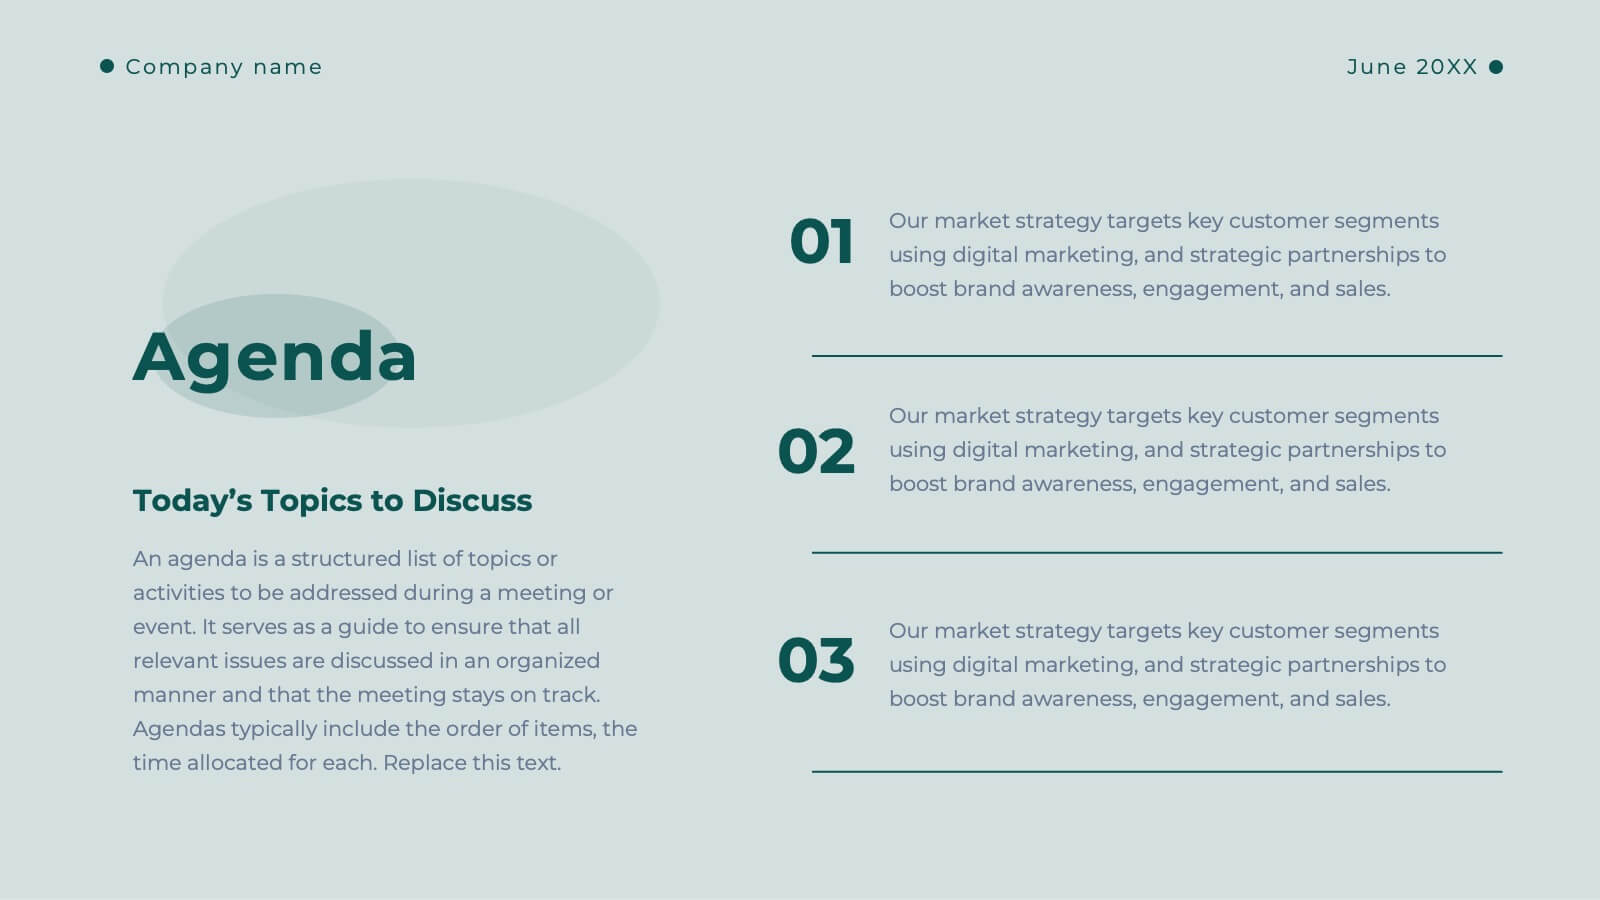
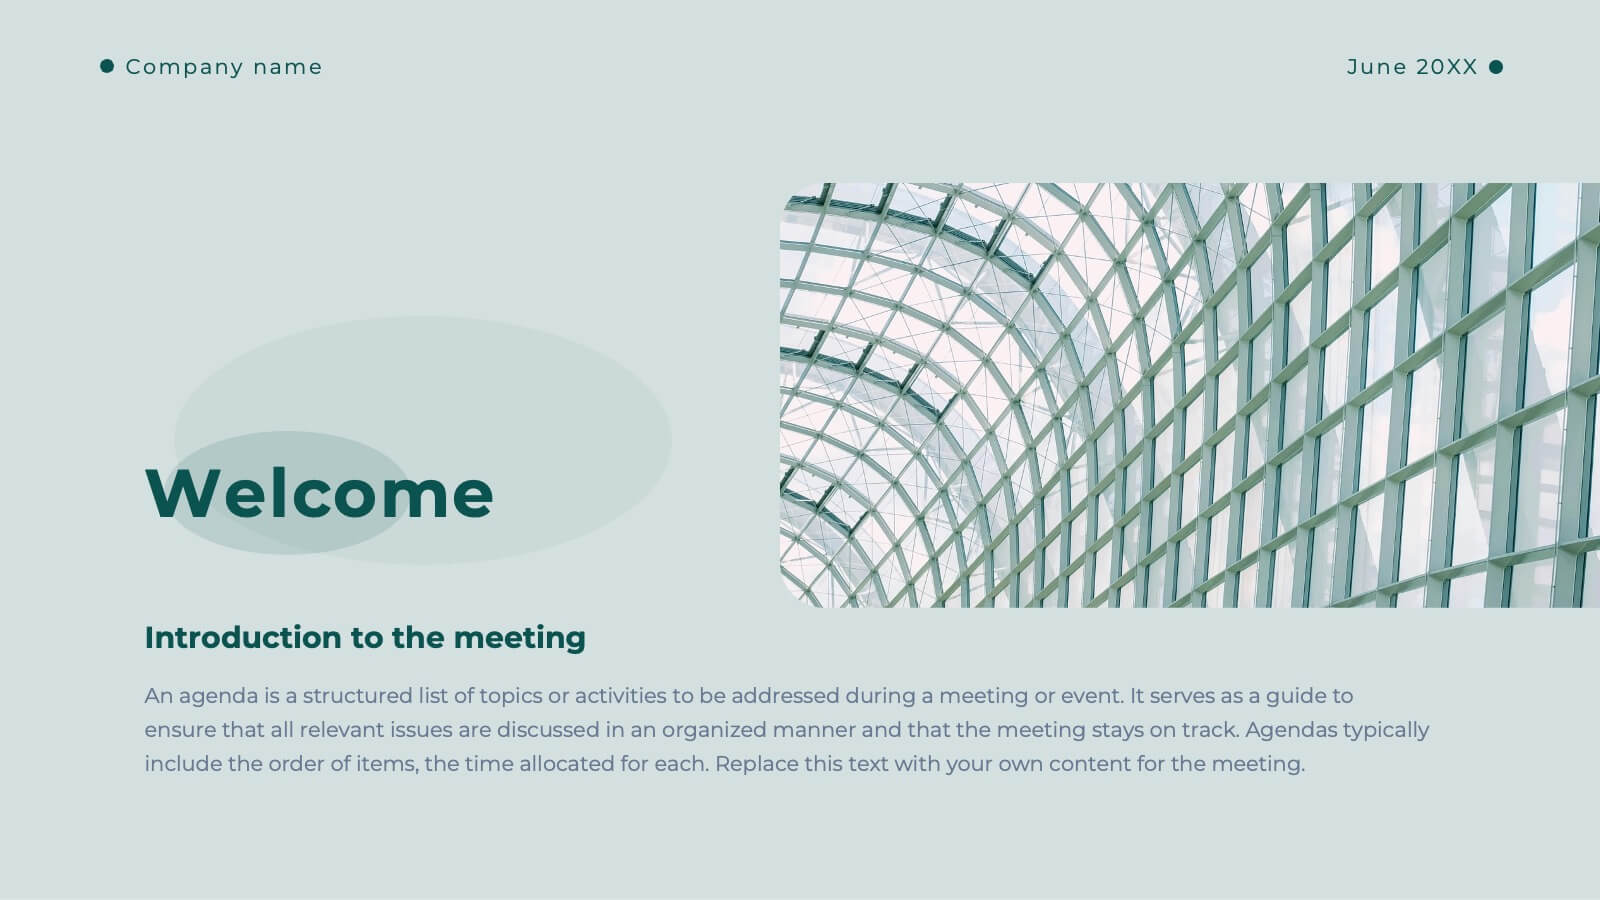
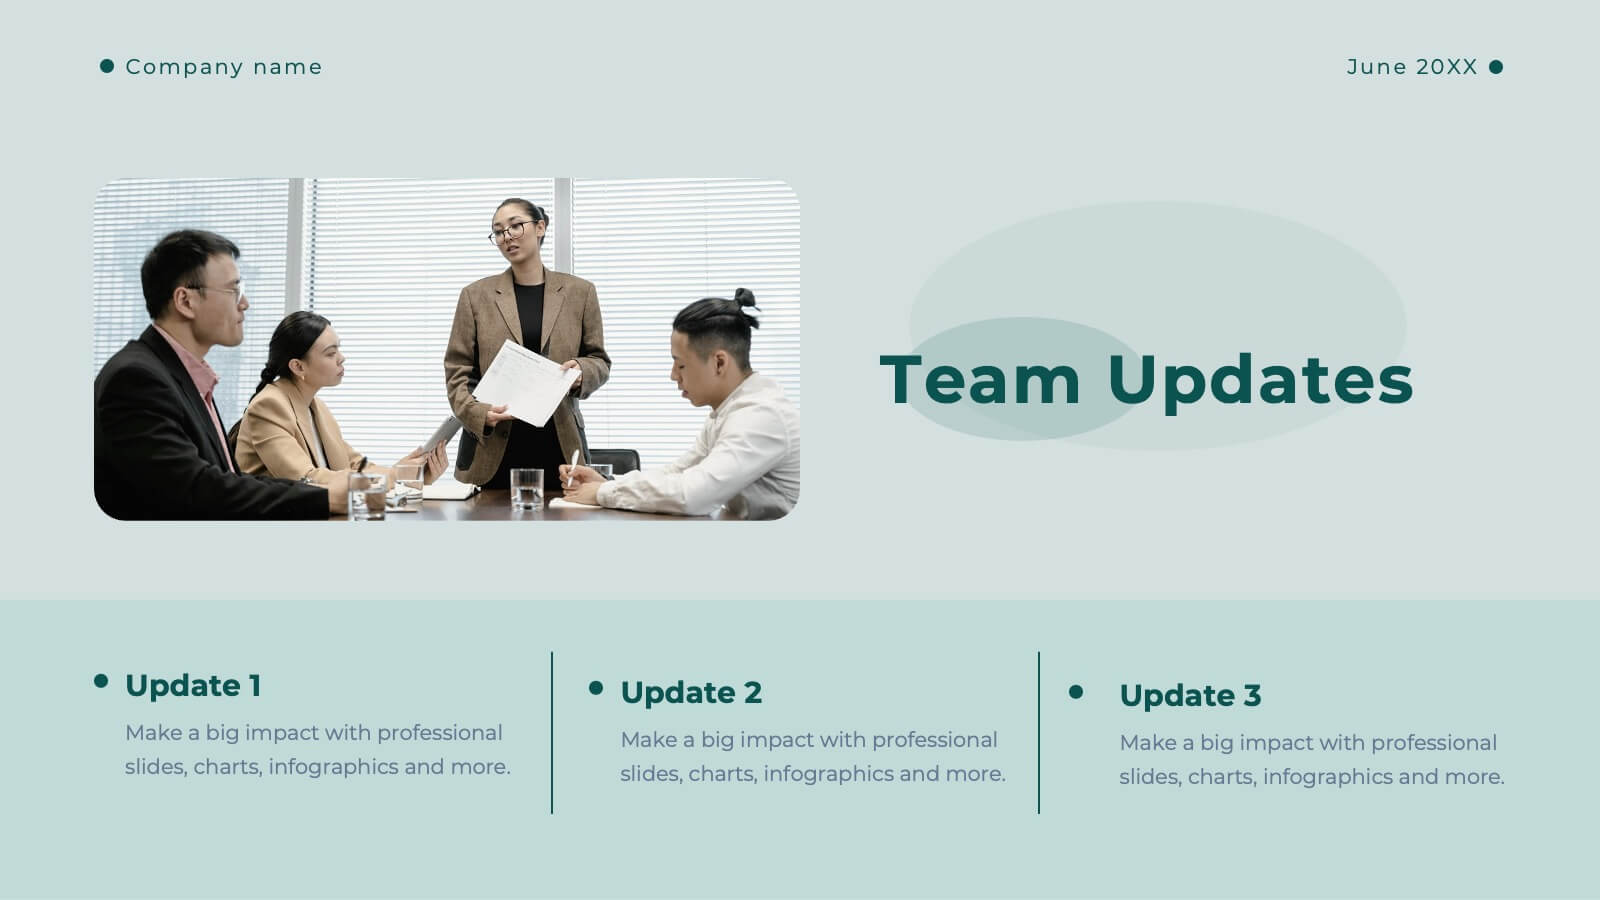
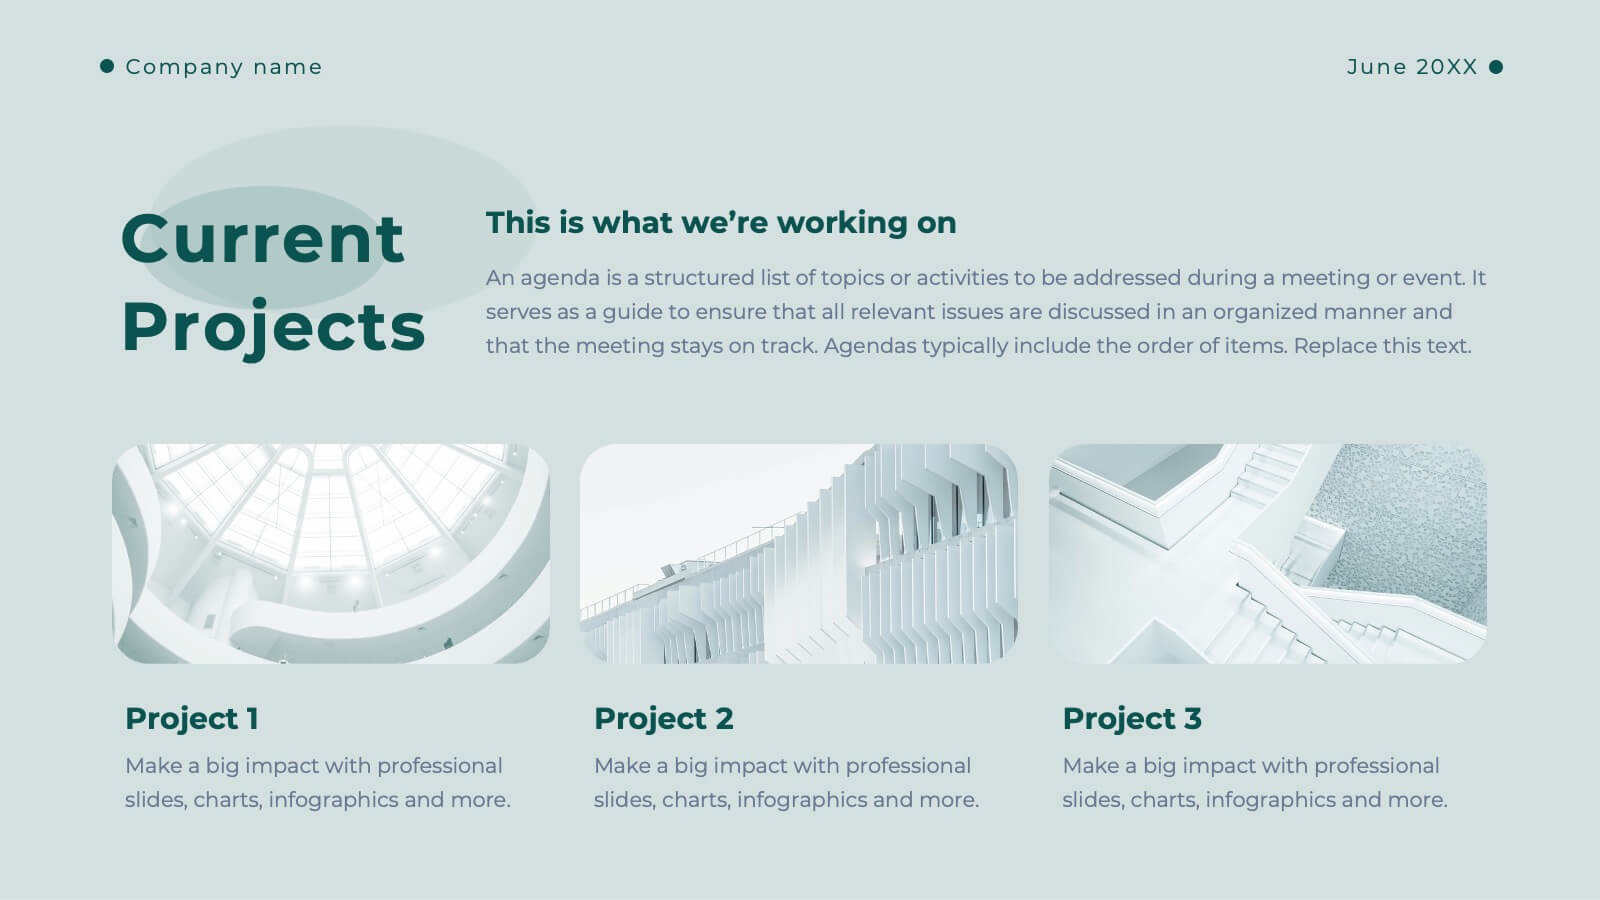
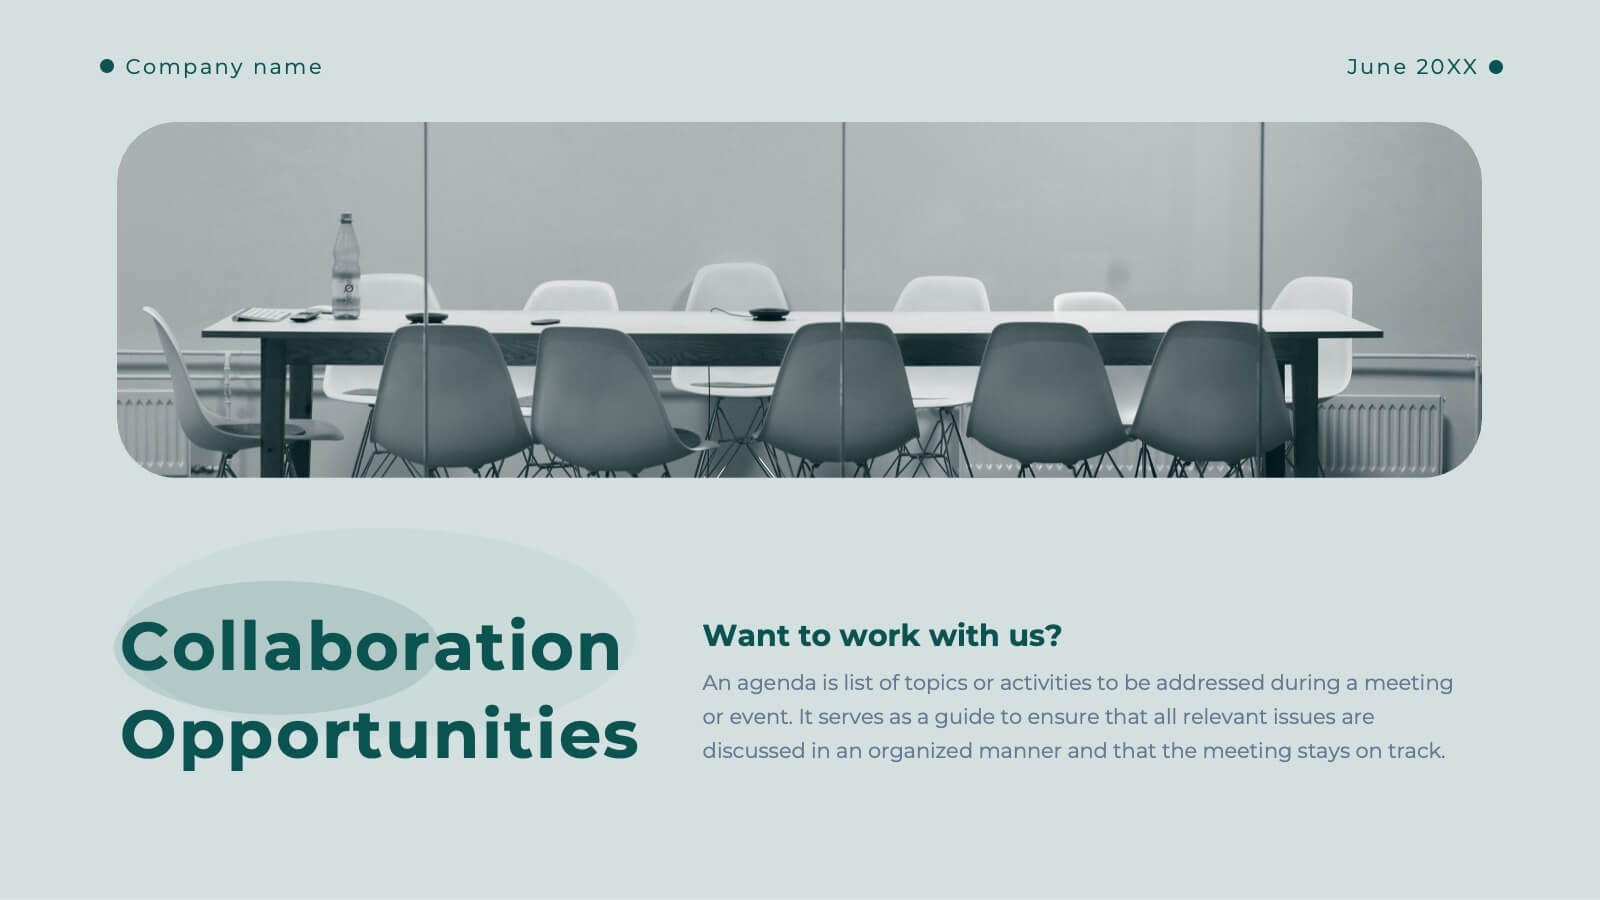
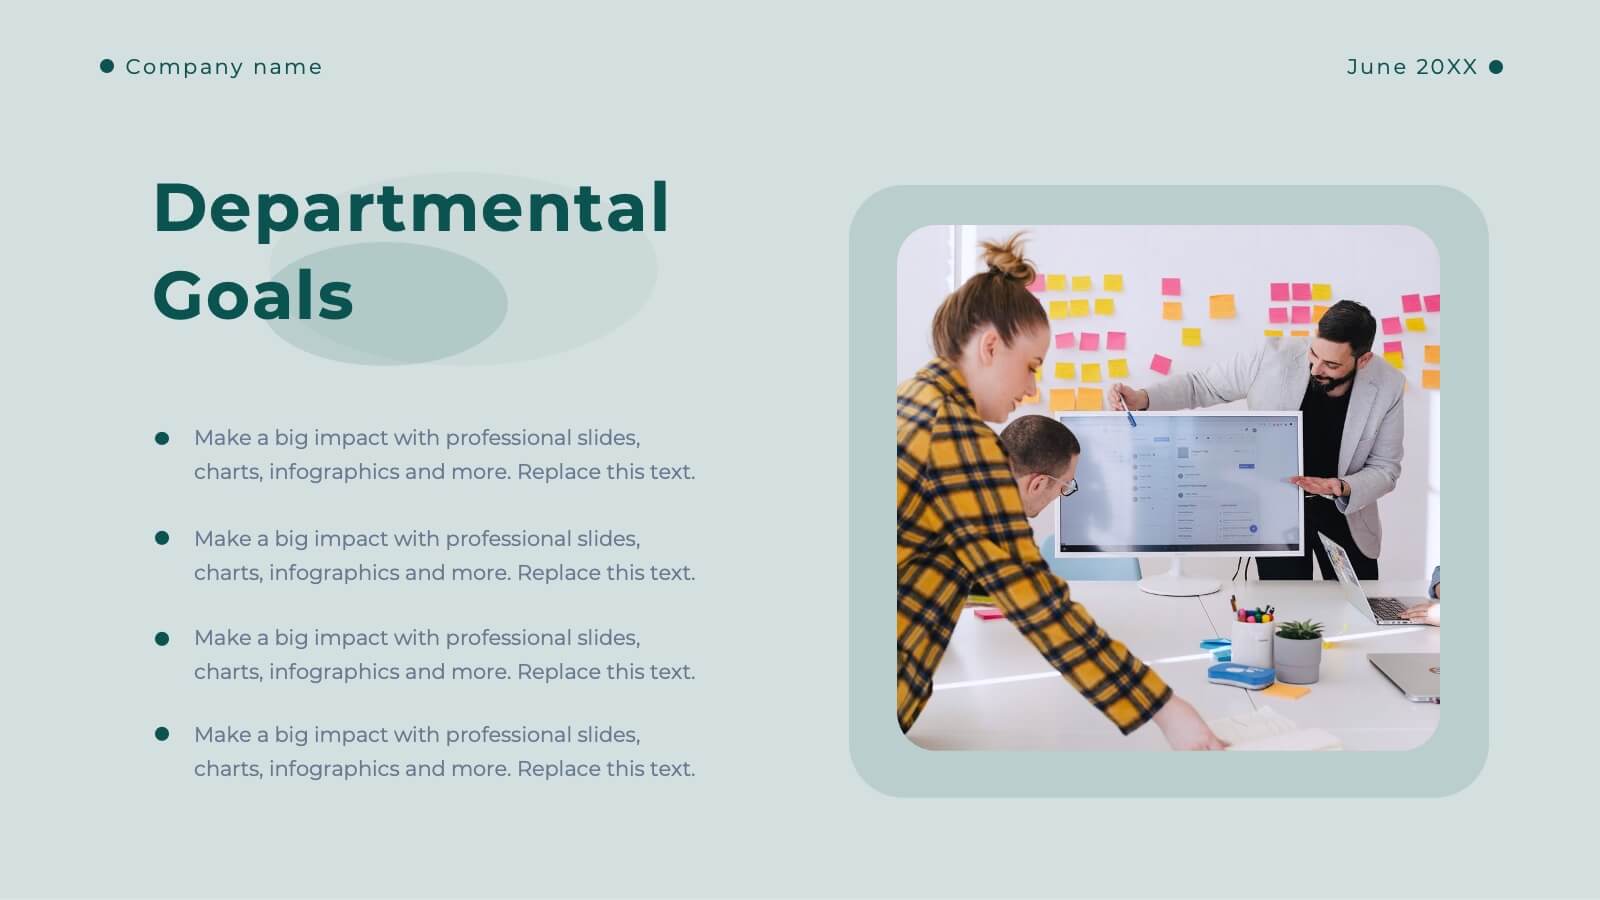
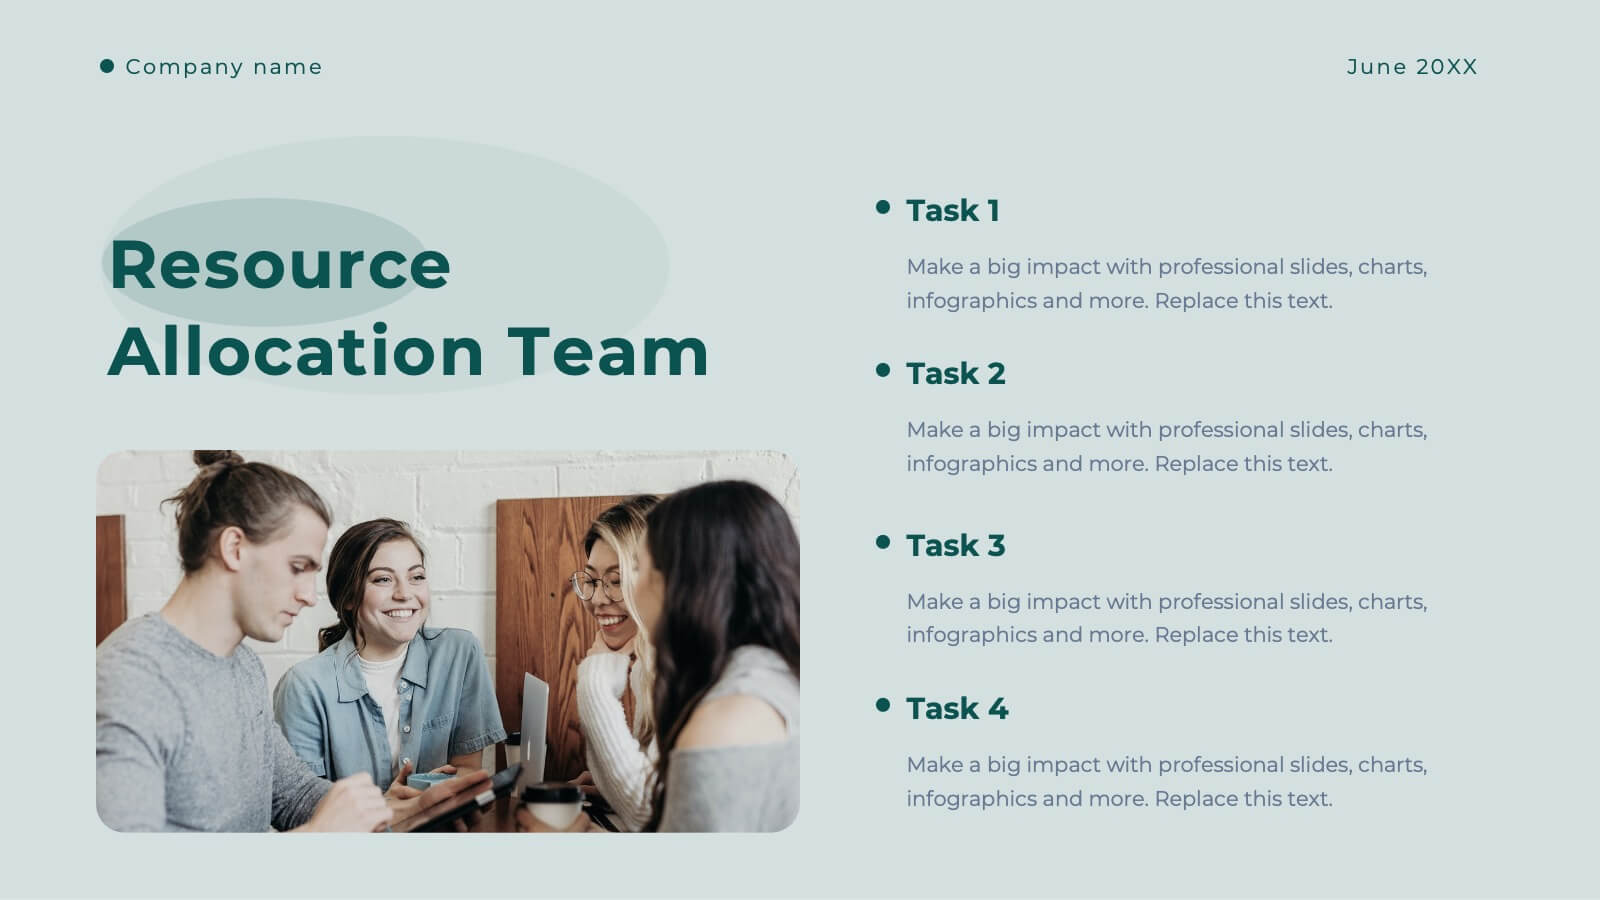
Clarity Business Operations Plan Presentation
Optimize your business operations with this sleek presentation template! Perfect for outlining team updates, key achievements, and performance metrics, it includes slides for departmental goals, process improvements, and upcoming events. Engage your team with clear visuals and detailed content. Compatible with PowerPoint, Keynote, and Google Slides for seamless presentations on any platform.


7 diapositivas
IT Architecture Infographics Presentation Template
Our IT Architecture Infographic template is designed to help you create a quick, easy and simple-to-understand presentation that explains your IT Architecture. This template will provide you with material to set out your ideas and give an overview of what’s important so that you can rapidly make progress in this area. This is a perfect choice to impress your clients, teachers, students, or employees. This presentation creates an extravagant feeling that will invite investors and clients to become invested in your project. This template is well-organized and perfect for your next presentation!


21 diapositivas
Carmenta Project Management Plan Presentation
Organize your projects with clarity using this comprehensive project management plan template. It includes slides for objectives, timelines, risk management, budget breakdowns, and team introductions. Ideal for efficient project presentations, it’s compatible with PowerPoint, Keynote, and Google Slides, offering a structured approach to showcase every project detail.


4 diapositivas
Workforce Adaptation Through Change Management Presentation
Show how your team evolves and thrives through transformation with this visual journey up the change curve. This template uses a clear mountain-climb illustration to highlight workforce progression and adaptation. Ideal for HR, change leaders, and organizational development professionals. Fully compatible with PowerPoint, Keynote, and Google Slides.


4 diapositivas
Management Levels Hierarchy
Illustrate your team’s structure using this modern pyramid-style hierarchy chart. Featuring space for names, roles, and profile photos, it’s ideal for highlighting top, middle, and lower-level management. Fully editable in PowerPoint, Keynote, and Google Slides.


10 diapositivas
Cause and Effect Fishbone Presentation
Visualize root causes and streamline analysis with this Cause and Effect Fishbone infographic. Ideal for identifying issues across categories, it helps present logical flows clearly. Fully editable and perfect for business, strategy, or process improvement discussions. Compatible with PowerPoint, Keynote, and Google Slides for effortless customization.


6 diapositivas
Children's Smile Rating Infographic
Smile Rating refers to a method of evaluating customer satisfaction or user experience by measuring the positive emotional response elicited, often in the form of a smile. This infographic template is a visually engaging way to showcase customer satisfaction or feedback using smiley faces to represent different levels of happiness or contentment. This type of infographic is commonly used in customer service, user experience, and feedback analysis. This can provide valuable insights into emotional engagement and satisfaction. This infographic is designed to focus on providing services or products that are intended to create a positive and enjoyable experience.


26 diapositivas
Corporate Culture Development Presentation
Embark on a journey to forge a vibrant corporate culture with this expertly designed presentation template, where every slide is a brushstroke in the larger picture of your company’s ethos. Orange and blue hues leap off the screen, infusing each slide with the energy and innovation that are the hallmarks of a thriving workplace. Use this template to paint a vivid narrative of your company’s values, mission, and people. Chart the growth of your organizational climate with data-driven graphics, celebrate the uniqueness of your team with personalized profiles, and map out the future with strategic infographics. This template is not just a collection of slides; it's a canvas for storytelling, perfect for HR visionaries and leaders dedicated to nurturing a workspace that breathes collaboration and creativity. Ready for action in your preferred software, it's the gateway to transforming the abstract concept of company culture into a tangible, inspiring reality.


7 diapositivas
SEO Strategy and Keyword Plan Presentation
Spark your marketing roadmap with a bold, idea-driven layout that makes every action step clear and memorable. This presentation helps you outline search goals, explore keyword opportunities, and map out strategic priorities in a simple, visual flow. Fully compatible with PowerPoint, Keynote, and Google Slides.


7 diapositivas
United States Market Map Infographic
Navigate the vastness of the United States with our meticulously designed map infographic. Rendered in a pristine white background, this template is adorned with the patriotic fervor of red, the tranquility of blue, and the charm of purple. Whether it's for market segmentation, regional data visualization, or a travel itinerary, the infographic seamlessly blends informative value with visual appeal. This US map, compatible with Powerpoint, Keynote, and Google Slides, offers custom-made icons and flexible image placeholders to suit varied purposes. Unfold stories from coast to coast, showcasing the diverse tapestry that is the United States.


6 diapositivas
AIDA Diagram
The AIDA Diagram is a simple and effective marketing tool used to guide the design of advertising and promotional materials with the goal of attracting and retaining customers. AIDA stands for Attention, Interest, Desire, and Action, and it represents the four stages a potential customer goes through when exposed to marketing content. This infographic template is a classic marketing and advertising framework used to understand and guide the consumer's journey through the buying process. This infographic is completely customizable and compatible with Powerpoint, Keynote, and Google Slides.