


Características


¿Tienes alguna pregunta?
Recomendar


5 diapositivas
Customer Profile and Persona Insights Presentation
Showcase your target audience with style using this modern persona insights deck. Highlight demographics, traits, and behaviors through visual cards and editable text placeholders. Perfect for marketing strategy, user research, or campaign planning. Fully customizable in PowerPoint, Keynote, and Google Slides to align with your branding and presentation needs.


26 diapositivas
Casey Presentation Template
Casey is a professionally designed modern, clean, and bold PowerPoint template that’s a great way to show off your data or highlight your services. This product is perfect for corporate customers who need an easy-to-edit template with bold colors and clean designs. With its easy to read charts, visible text, and bright colors this template will really captivate your audience. A perfect way to visualize your data and present your company in style to keep your audience engaged. Whether you are trying to get attention or just make your business stand out, this template will help you achieve that.


5 diapositivas
Risks Assessment Matrix Presentation
Visualize risk like never before with a clear, color-coded grid that helps you evaluate impact, likelihood, and priority in seconds. Perfect for project planning, compliance reviews, or business strategy sessions, this presentation makes complex assessments simple. Fully compatible with PowerPoint, Keynote, and Google Slides for effortless editing.


6 diapositivas
E-learning Tools for Modern Classrooms Presentation
Present digital learning strategies with this engaging, education-themed template. Ideal for teachers, trainers, or tech coordinators introducing e-learning tools. Includes labeled sections for highlighting key features and software benefits. Fully customizable and compatible with PowerPoint, Keynote, and Google Slides—perfect for virtual classrooms, workshops, or academic tech presentations.


5 diapositivas
Investment and Wealth Planning Presentation
Visualize your financial strategy with this creative piggy bank diagram layout. Each quadrant highlights a different element of your investment plan—from savings and risk management to asset growth and long-term wealth goals. Perfect for financial advisors, business consultants, or educators. Fully editable in PowerPoint, Keynote, and Google Slides for easy customization


13 diapositivas
Simple Sales Proposal Presentation
This proposal template provides a streamlined approach for presenting sales strategies and solutions. Starting with a visually striking cover slide, it sets the scene for an engaging pitch. The template meticulously organizes content from the initial problem identification to the presentation of real numbers that underscore the proposal's validity. Each section, from the elucidation of the problem to the detailed solutions and real-world case studies, is laid out for maximum impact and understanding. Personable touches are incorporated through the 'Meet Our Team' segment, bolstering the proposal with credibility. The template culminates with a strong call to action, urging the audience to seize the collaborative opportunity, and is rounded off with a polite 'Thank You' to leave a lasting impression. This template is a boon for sales professionals seeking to communicate their value proposition with clarity and persuasiveness.


6 diapositivas
Tiered Pricing Plan Layout Presentation
Clearly compare features across your service levels with this Tiered Pricing Plan Layout Presentation. Ideal for showcasing Basic, Regular, and Premium options in a side-by-side table with checkmarks and pricing. Great for SaaS, product subscriptions, or membership tiers. Fully editable in Canva, PowerPoint, Google Slides, and Keynote.


6 diapositivas
IT Architecture Enterprise Infographics
Gain insights into Enterprise IT Architecture with our customizable infographic template. This template is fully compatible with popular presentation software like PowerPoint, Keynote, and Google Slides, allowing you to easily customize it to illustrate and communicate various aspects of enterprise IT architecture. The Enterprise IT Architecture infographic template offers a visually engaging platform to explore and explain the architectural components, frameworks, and strategies used in large organizations. Whether you're an IT professional, business leader, or simply interested in enterprise technology, this template provides a user-friendly canvas to create informative presentations and educational materials. Enhance your knowledge of Enterprise IT Architecture with this SEO-optimized infographic template, thoughtfully designed for clarity and ease of use. Customize it to highlight key principles, architectural layers, integration strategies, and best practices, ensuring that your audience gains a comprehensive understanding of this critical field. Start crafting your personalized infographic today to delve into the world of Enterprise IT Architecture.


3 diapositivas
Corporate Sustainabilitiy Management Strategy Presentation
Drive your company’s future with a presentation that blends strategy, innovation, and sustainability. Designed to communicate eco-friendly initiatives and long-term business goals, it helps visualize performance, impact, and growth clearly. Fully customizable and compatible with PowerPoint, Keynote, and Google Slides for seamless, professional, and engaging sustainability presentations.


10 diapositivas
Work Schedule and Task Management Presentation
Enhance your project management with the Work Schedule and Task Management template, expertly designed to organize and visualize tasks efficiently, ensuring productivity and clarity in your workflow. It features distinct icons and color-coded stages to delineate project phases, ideal for tracking progress and ensuring team alignment. This versatile template is compatible with PowerPoint, Keynote, and Google Slides, allowing for seamless integration into any presentation workflow.


6 diapositivas
Supply Chain and Logistics Strategy Presentation
Streamline complex logistics workflows with this bold, dual-loop arrow layout. Ideal for showcasing the full cycle of sourcing, distribution, warehousing, and returns, this diagram lets you visualize forward and reverse logistics processes side by side. Customizable icons, clear progression, and ample space for key data make this a must-have for operations managers, procurement teams, and logistics planners. Fully compatible with PowerPoint, Keynote, and Google Slides.


5 diapositivas
Cryptocurrency Market Trends Presentation
Navigate the dynamic world of digital finance with our "Cryptocurrency Market Trends" presentation templates. Perfect for analysts and enthusiasts alike, these templates provide a clear, visual representation of market movements and trends. They are fully compatible with PowerPoint, Keynote, and Google Slides, making them an excellent resource for anyone keen on the pulse of cryptocurrency markets.


7 diapositivas
Pillar Points Infographic Presentation
A Pillar Infographic presents information on a specific topic or subject in a clear and organized manner. It consists of several sections or "pillars" that are interconnected and support the overall message of the infographic. In this template each pillar can be used to represent different aspects of the topic being discussed. Each section contains relevant data, statistics, and other information that illustrates the aspect. This can be used in marketing and advertising to promote products or services, as well as in education and journalism to explain complex ideas in a visually appealing way.


7 diapositivas
Flow Chart Diagram
A flowchart diagram is a visual representation that illustrates a process or system by using different symbols and shapes to depict the steps, decisions, and actions involved. Our flow chart diagram infographic is the compass to navigate your concepts into concrete actions. It's a visual roadmap that simplifies complex processes, helping you illustrate the steps in a sequence. This Infographic is your trusted tool for transforming processes into a visually appealing and understandable journey. This tool is designed to be used in various fields, including software development, business process analysis, education, and more, to depict the logical flow.


22 diapositivas
Inspirae Project Status Report Presentation
This sleek and modern project status report presentation template is designed to help you effectively communicate progress, challenges, and key insights. It covers essential sections such as performance metrics, sales performance, risk assessments, and strategic initiatives, ensuring a comprehensive overview. Compatible with PowerPoint, Keynote, and Google Slides for seamless customization.


5 diapositivas
Market Economy Infographics
A market economy is an economic system where the production, distribution, and pricing of goods and services are determined by the interactions of individuals and businesses in the market. These vertical infographics are visually compelling design that explains the fundamental principles and characteristics of a market economy. This infographics is ideal for economists, business analysts, educators, and anyone looking to educate others about how market economies work and their impact on society. The infographics incorporate relevant statistics and data to support the information presented. Compatible with Powerpoint, Keynote, and Google Slides.


21 diapositivas
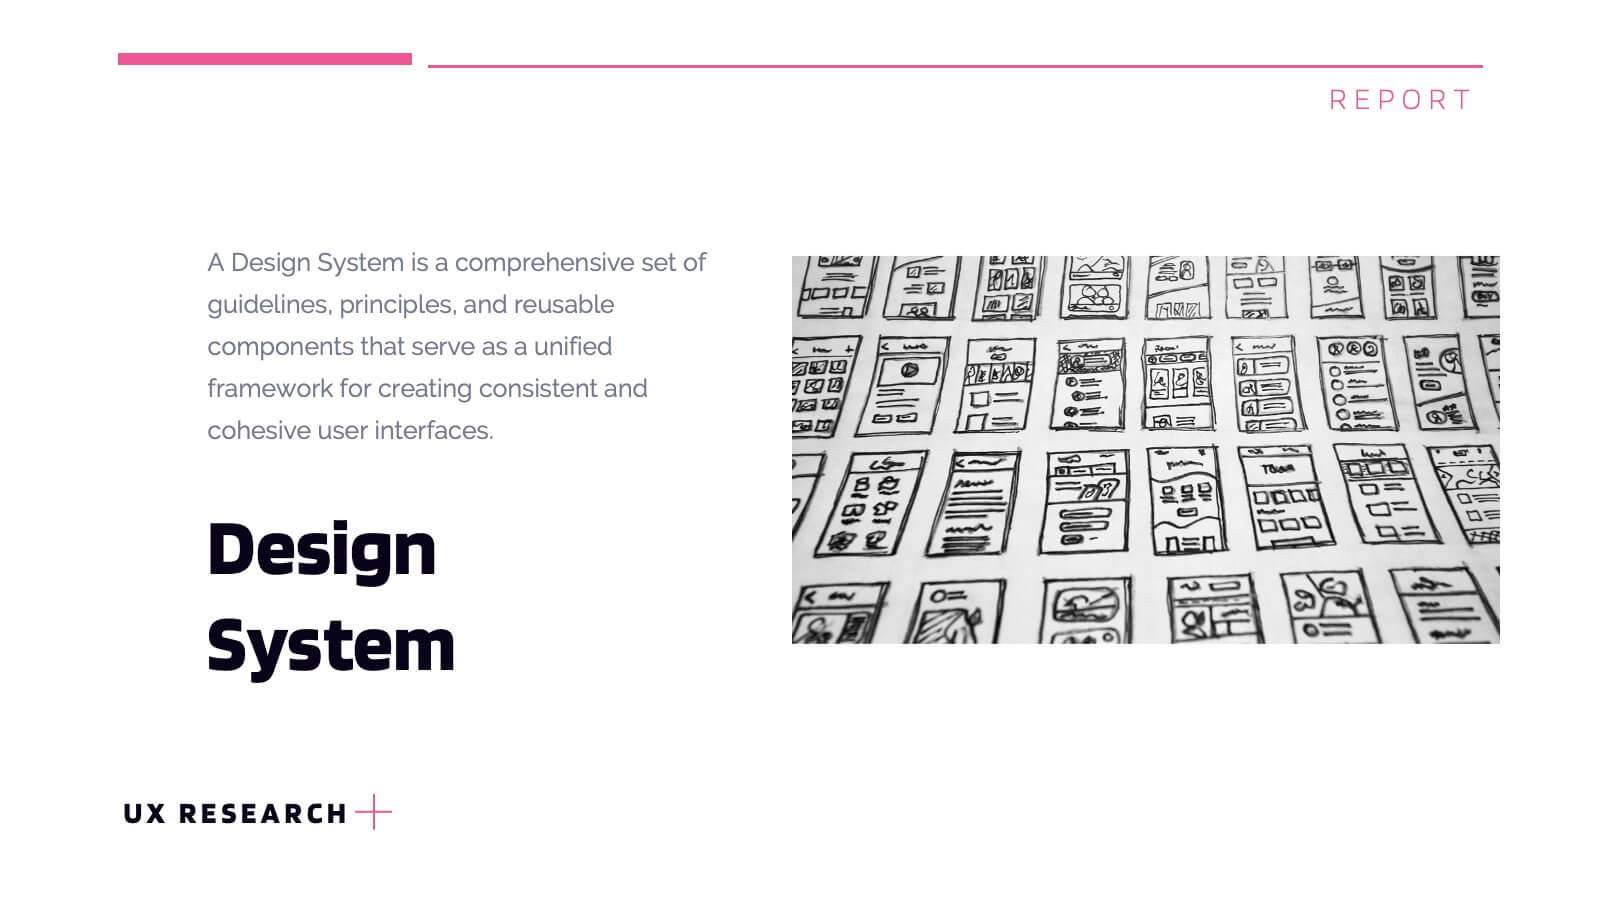
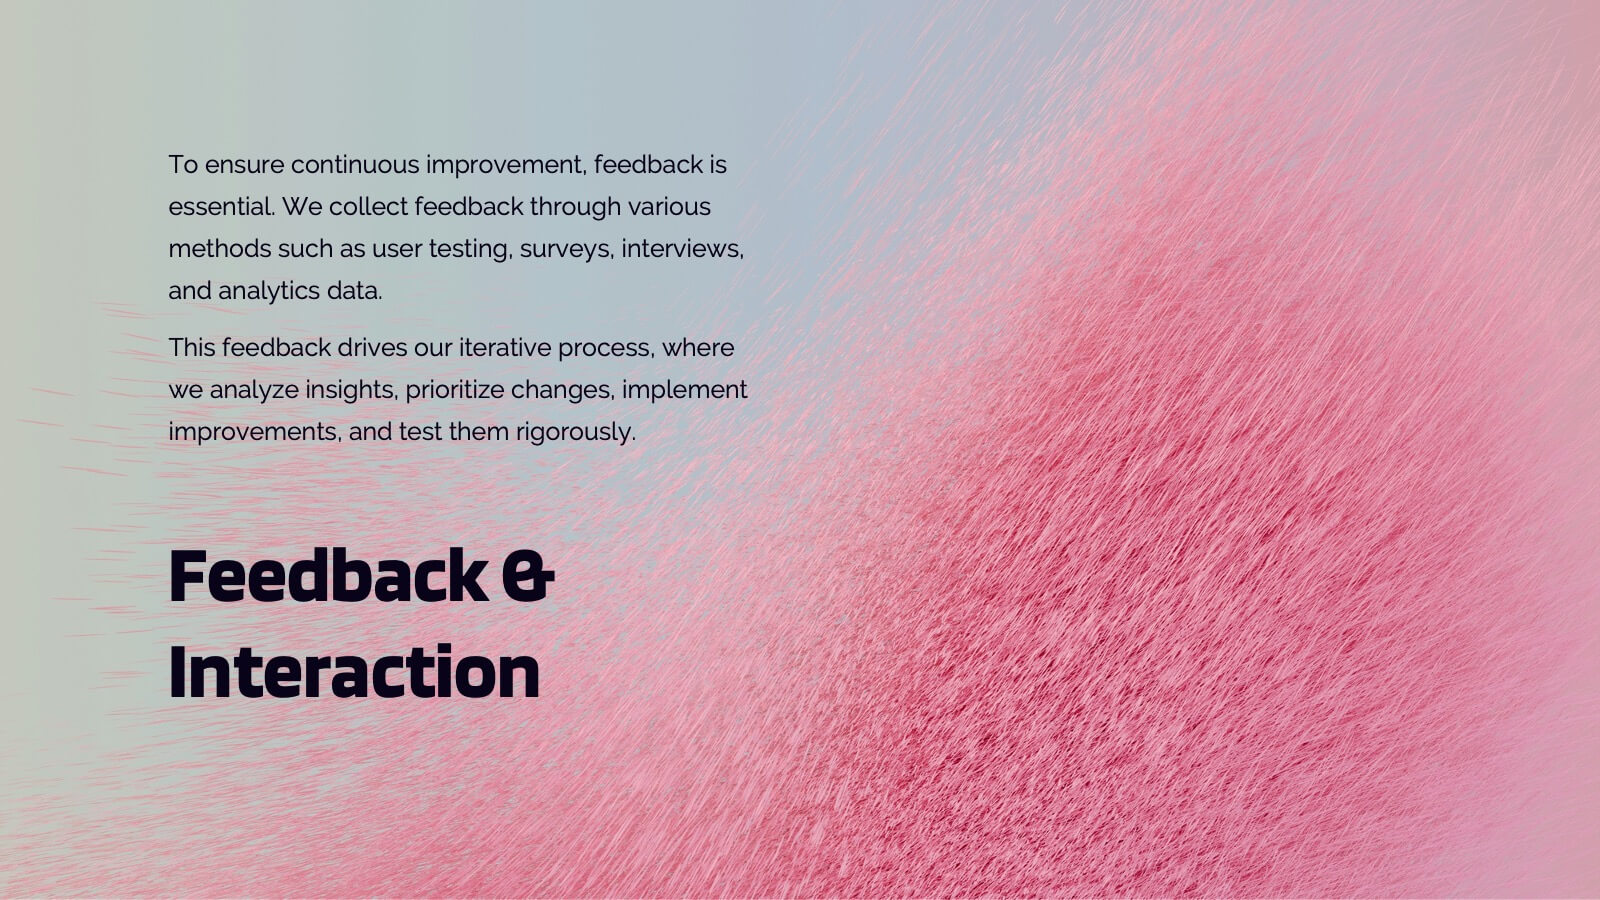
Lumascend UX Research Report Presentation
Present your UX research findings with clarity using this engaging and organized template! Covering key areas like user personas, wireframes, testing, and interaction design, it ensures all aspects of your design process are communicated effectively. Perfect for UX teams, stakeholders, or client presentations, this template works seamlessly with PowerPoint, Keynote, and Google Slides.