


Características


¿Tienes alguna pregunta?
Recomendar


22 diapositivas
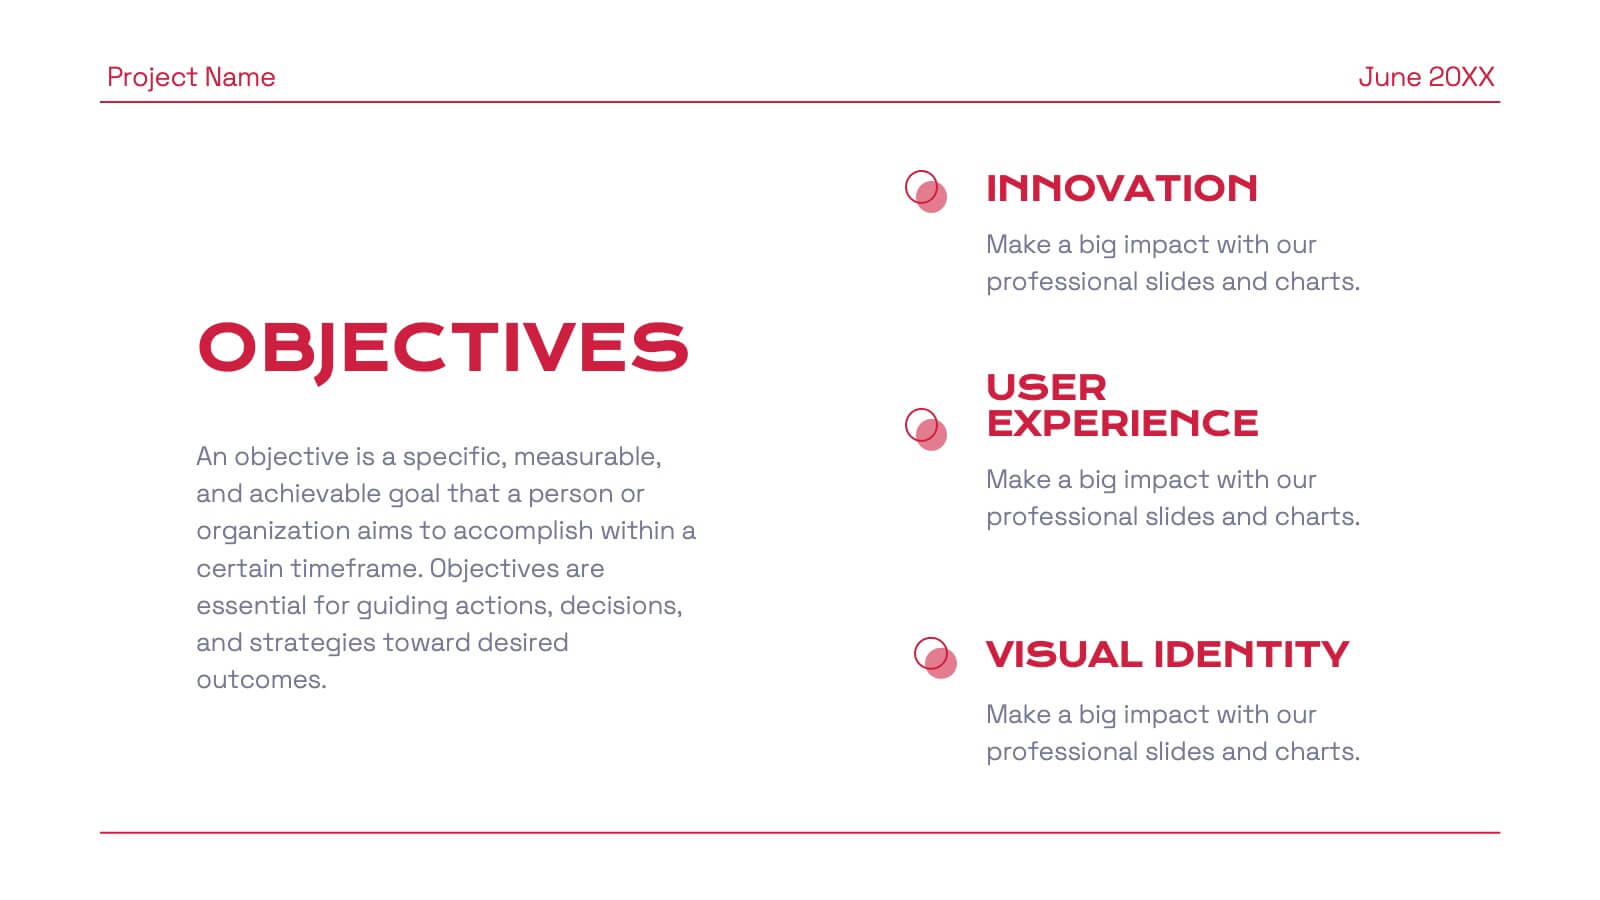
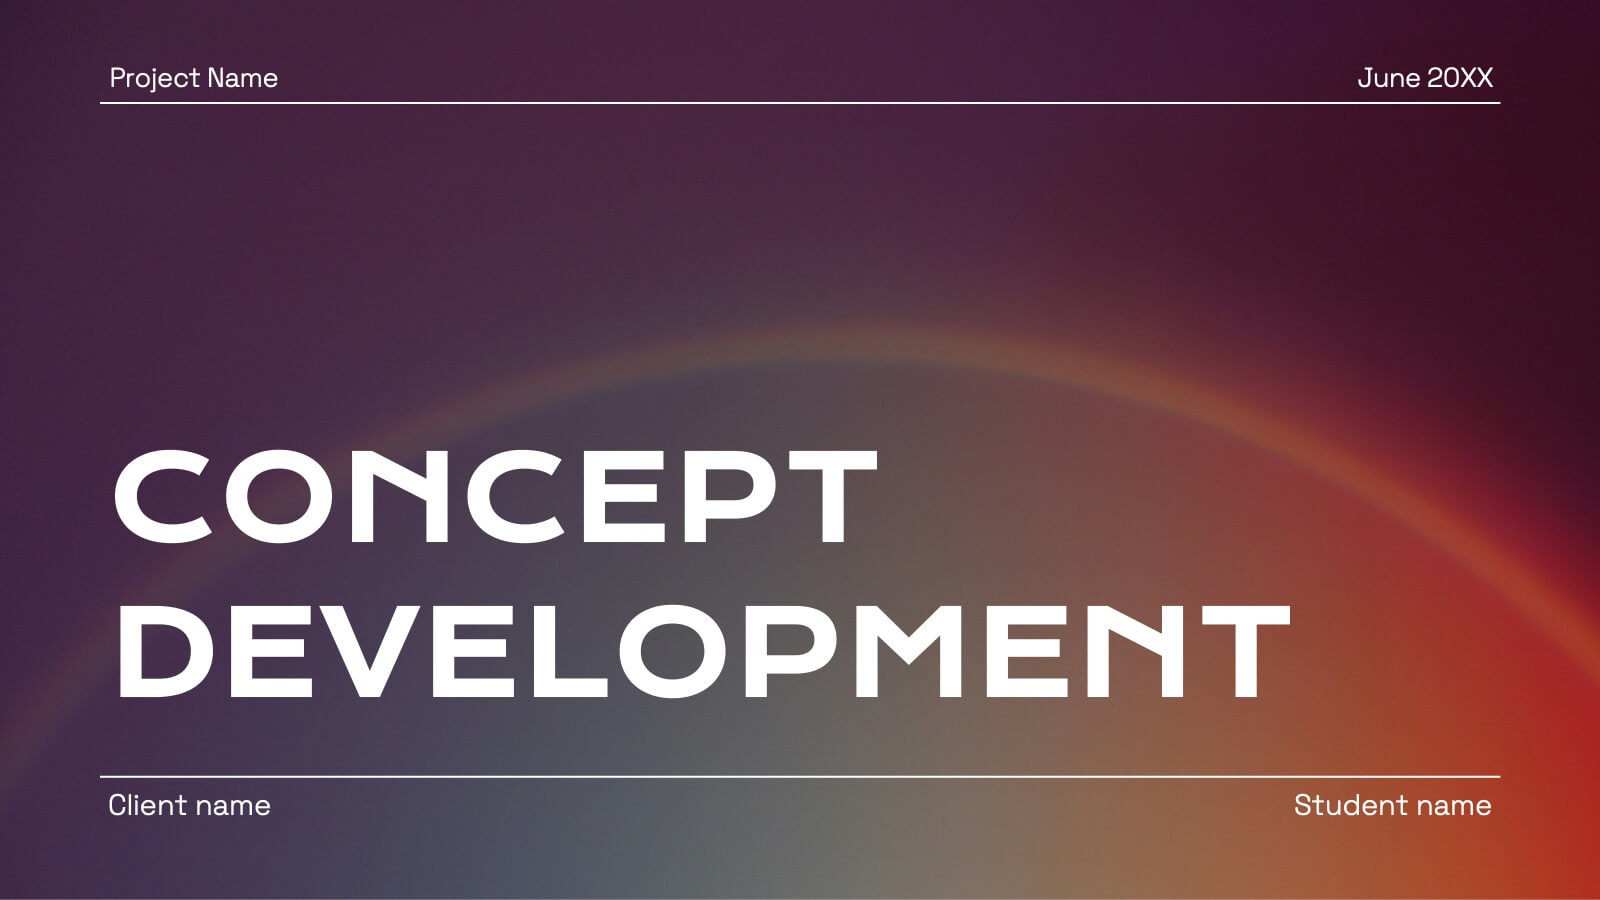
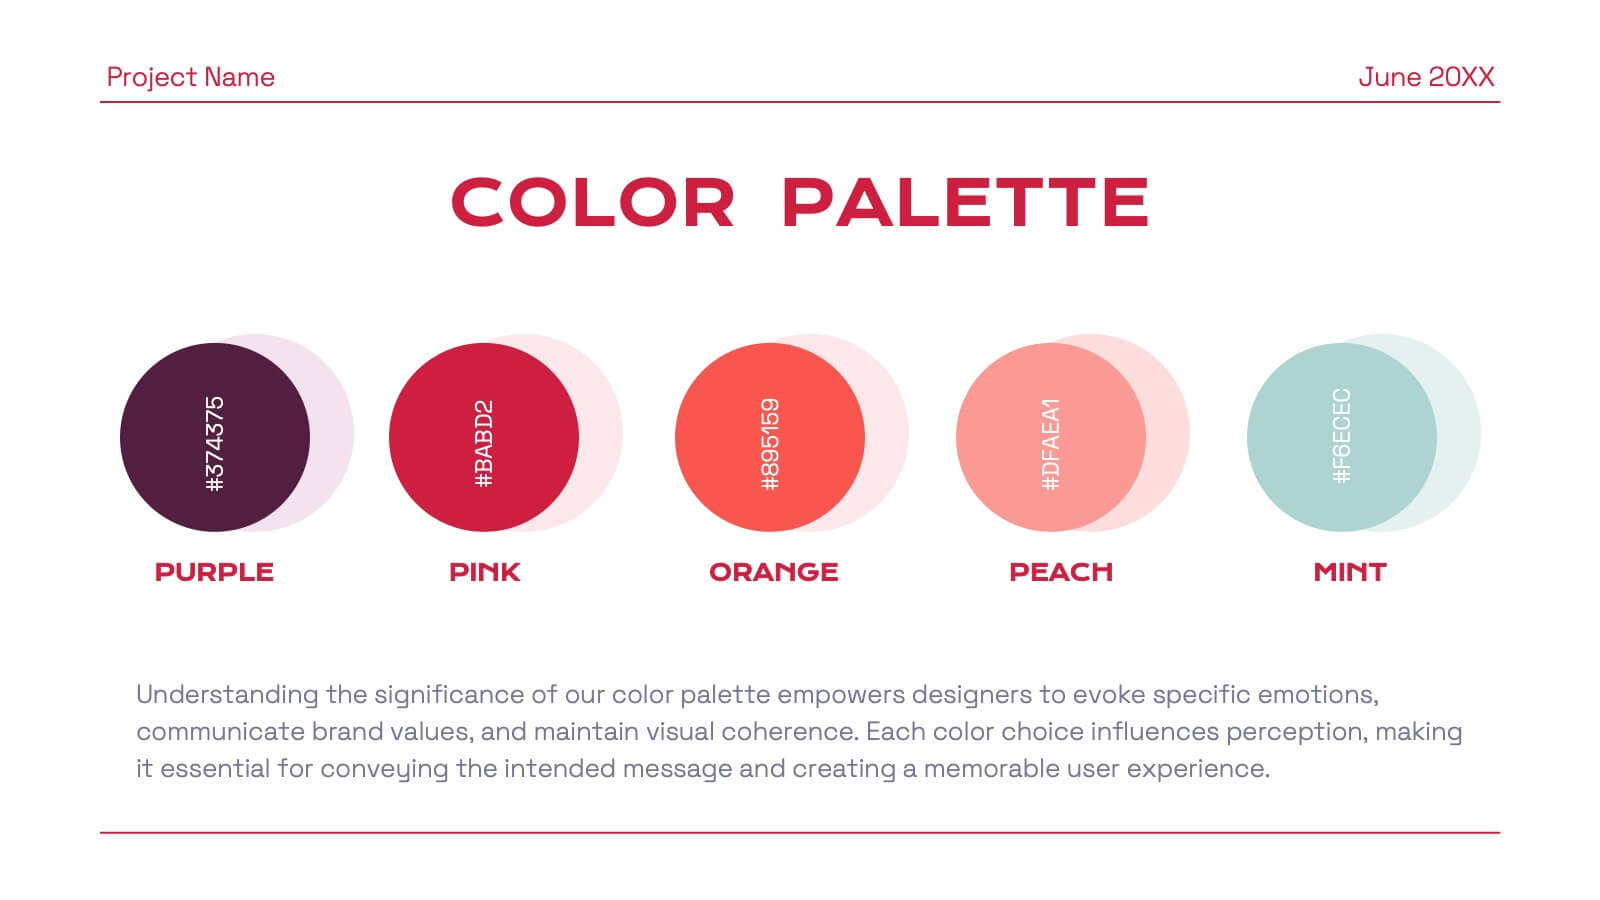
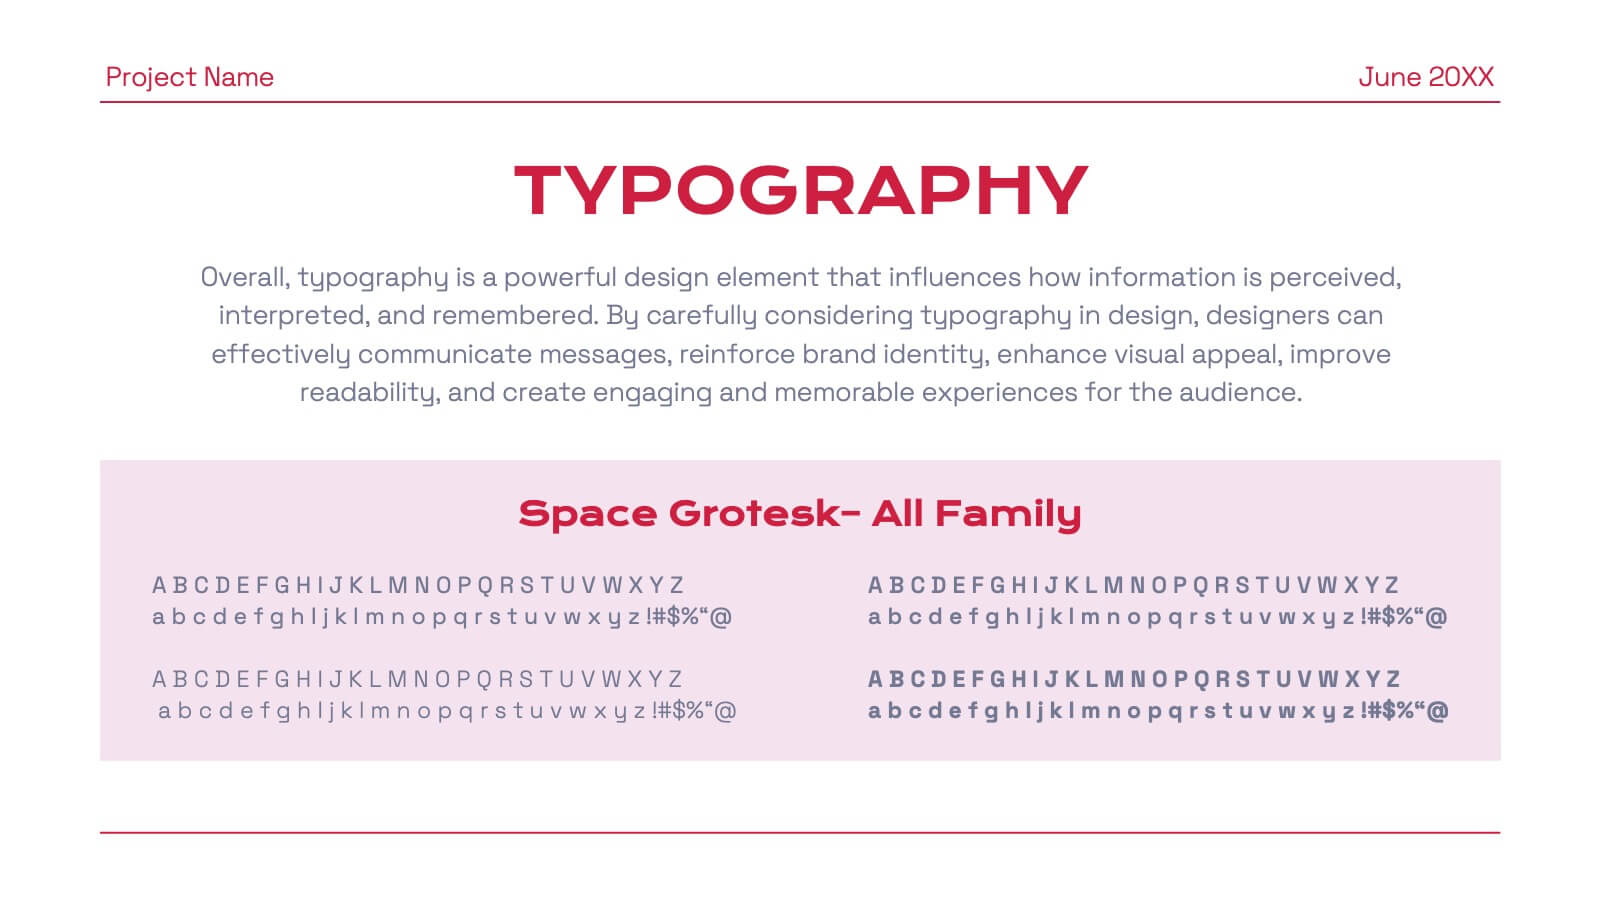
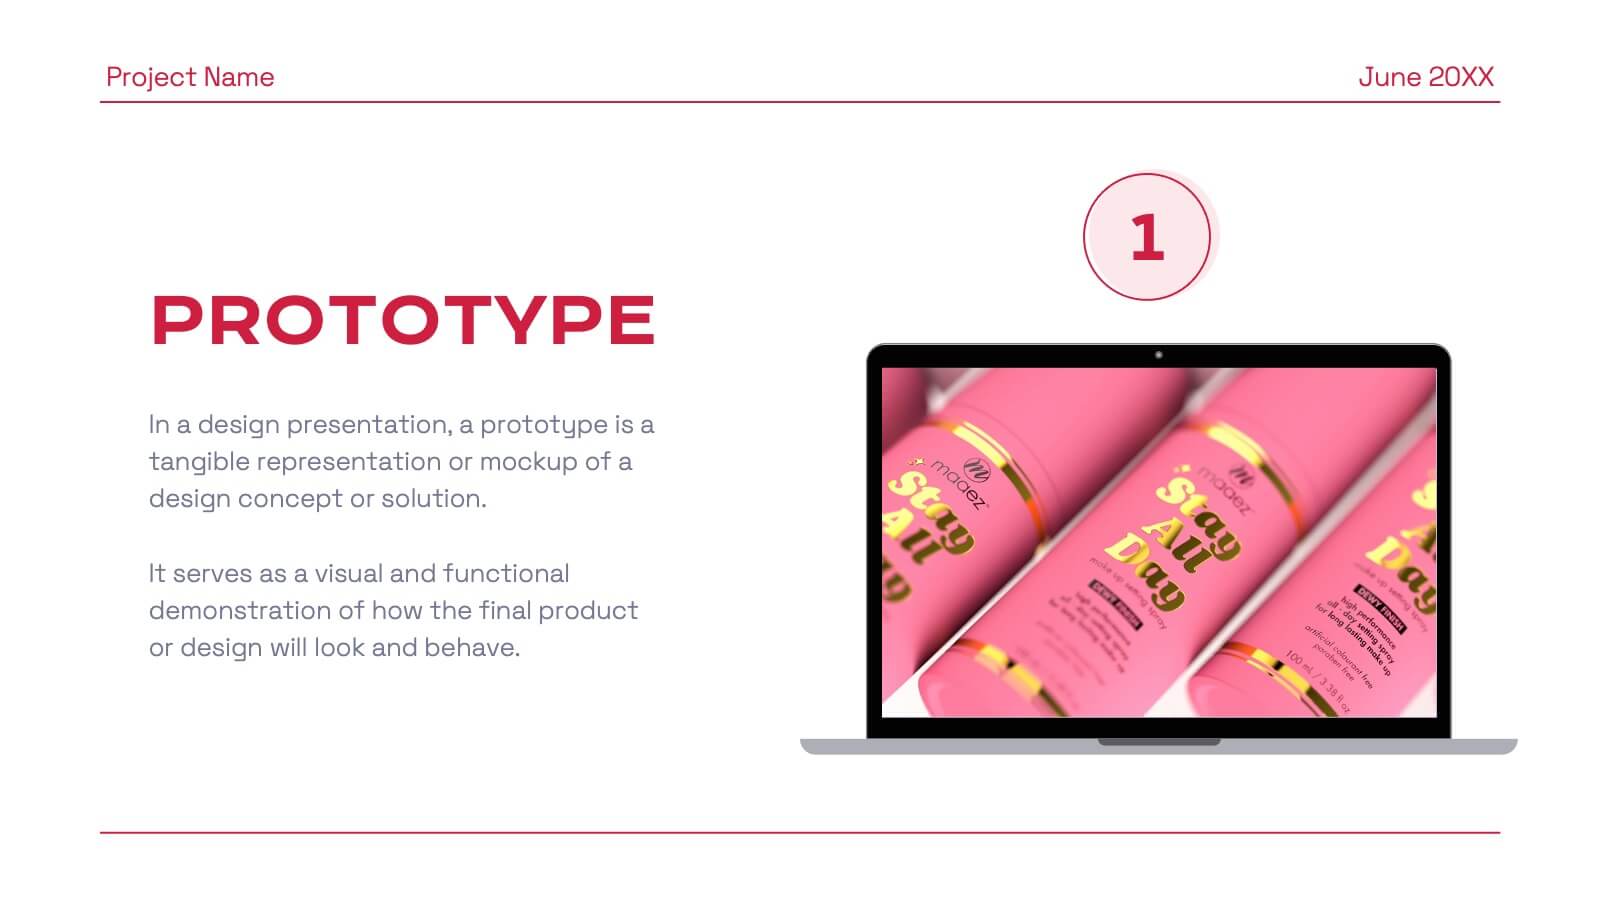
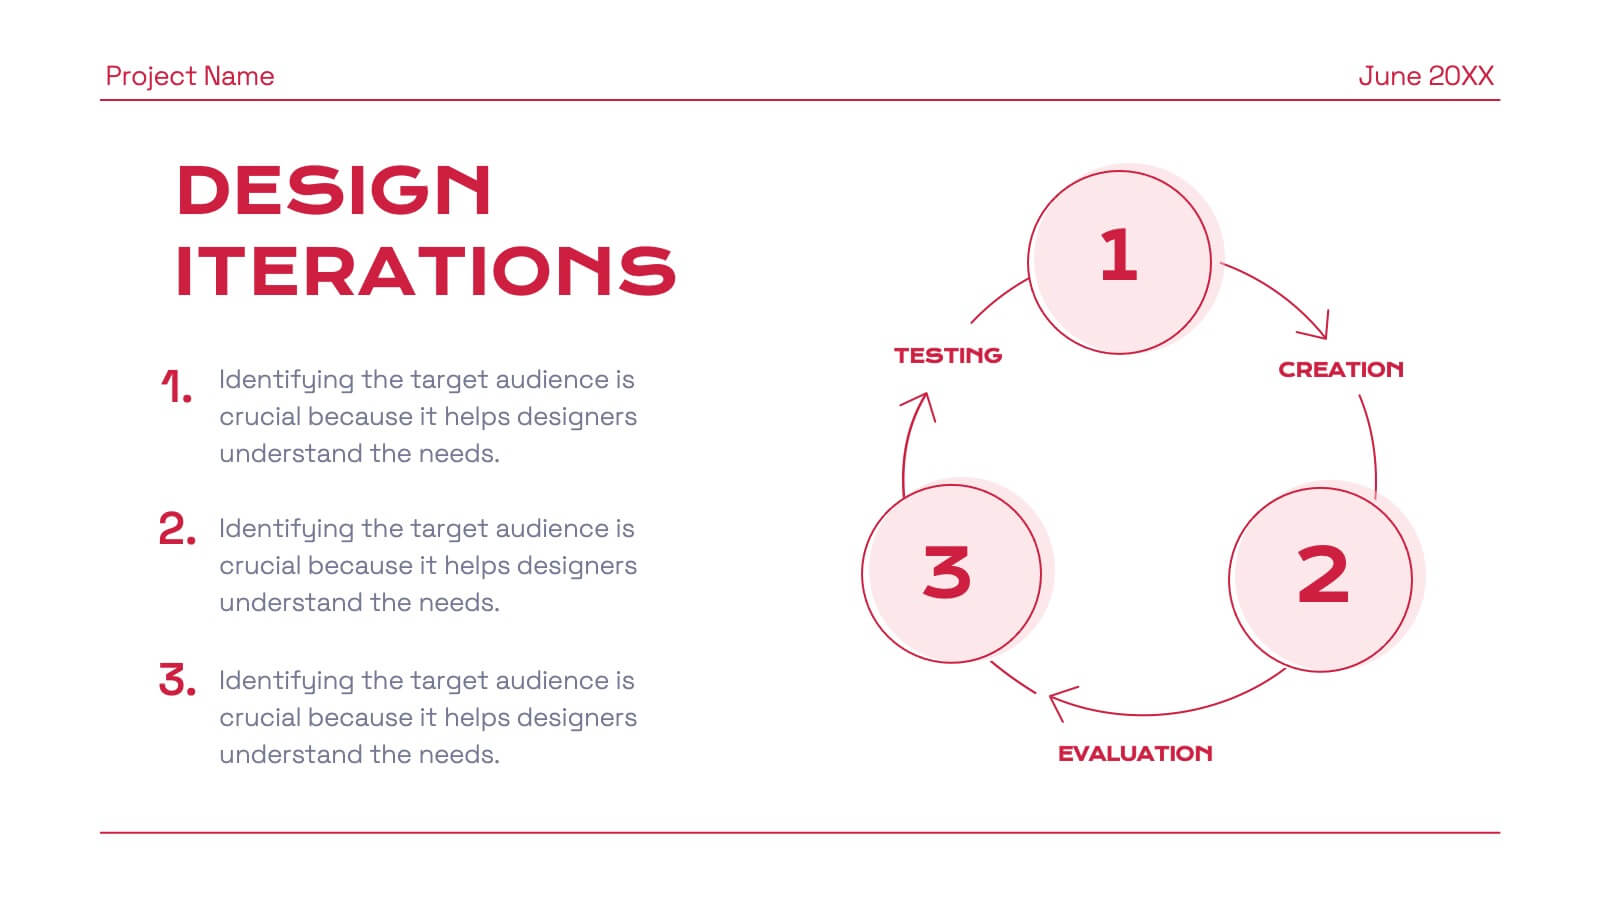
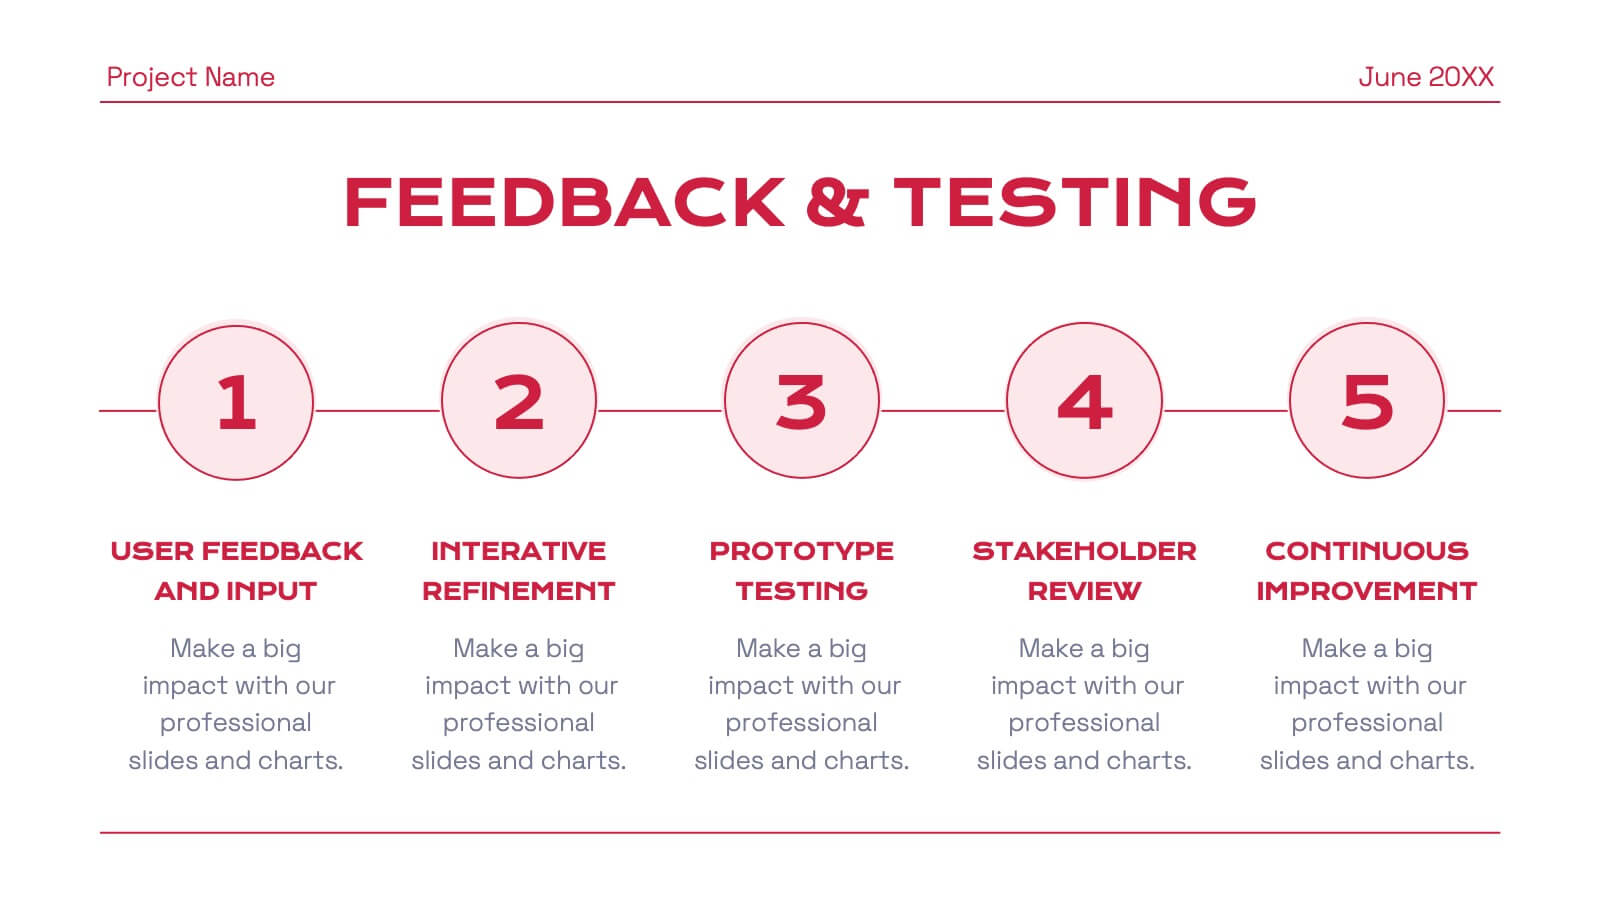
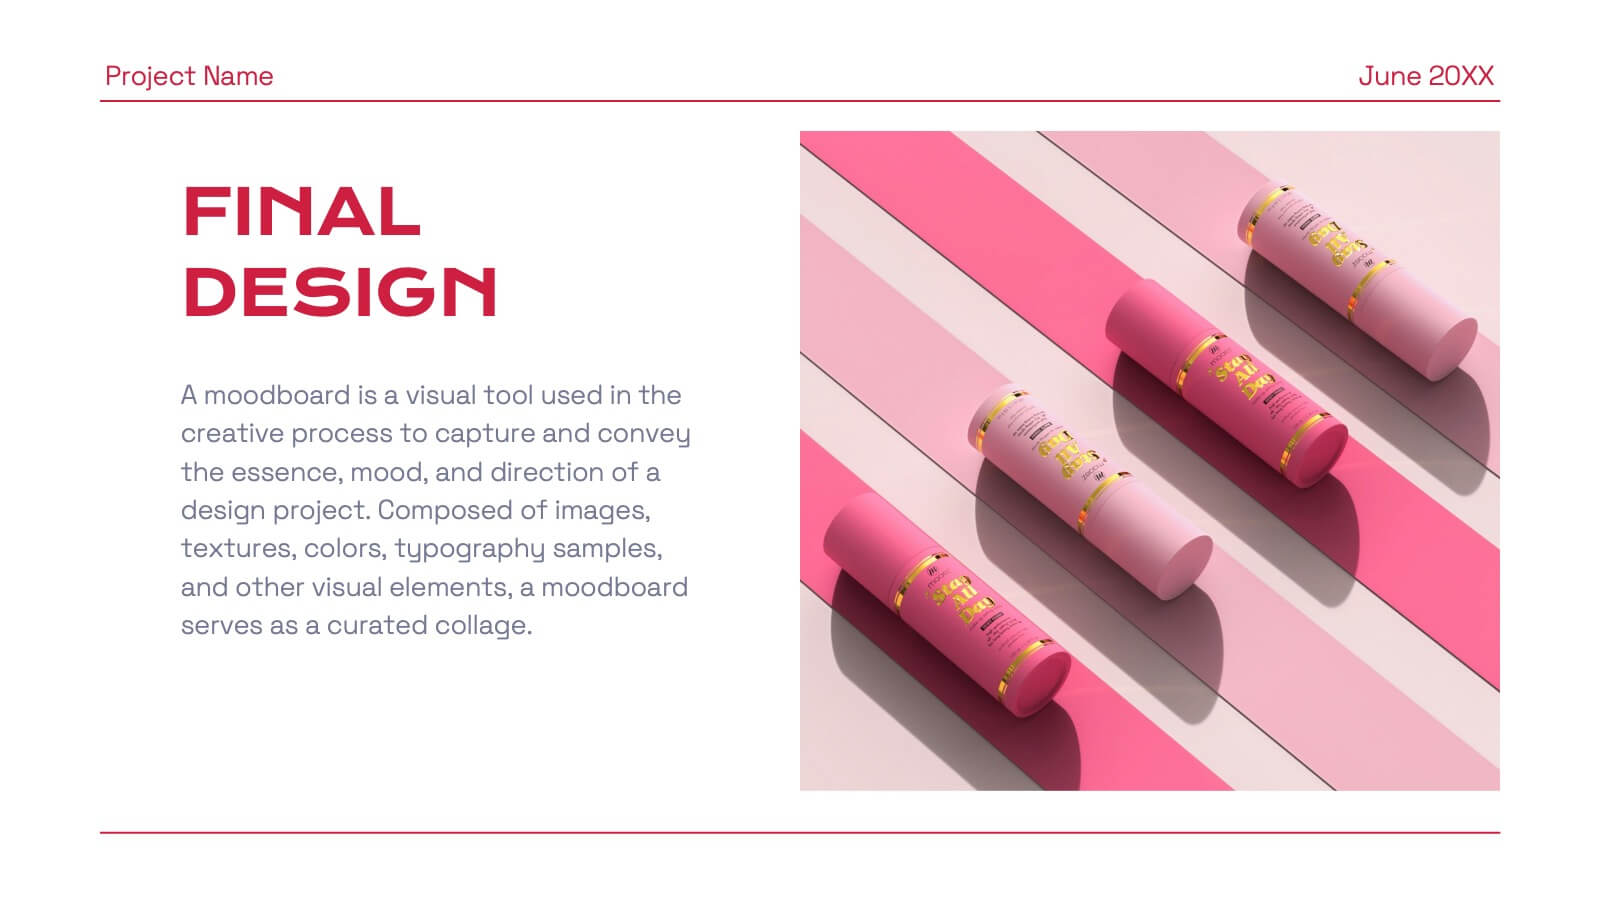
Sky Drop Full-Service Agency Project Plan Presentation
Step into the world of strategic creativity with the Sky Drop Agency Project Plan template! Designed for modern agencies looking to impress clients and stakeholders, this template offers a sleek and professional design that highlights your agency's strengths, processes, and successes. With dedicated sections for mission and vision, team introduction, services, and client testimonials, this template provides a comprehensive overview of your agency's capabilities. It's perfect for showcasing case studies, market analysis, and future outlooks, helping you to build trust and establish credibility. Whether you're presenting a new project plan or updating clients on progress, this template ensures your information is communicated clearly and effectively. Fully customizable and compatible with PowerPoint, Keynote, and Google Slides, the Sky Drop template is your go-to for creating presentations that leave a lasting impact. Impress your audience and elevate your agency's brand with this powerful presentation tool!


7 diapositivas
Africa Population Infographic Presentation
An Africa Map infographic is a visual representation of the African continent, highlight its geography, population, culture, history, and other relevant information. This template provides a quick and easy way to understand complex information about the continent and make data more accessible and engaging to your audience. Use this template to include information about Africa's major cities, landmarks, natural resources, and cultural traditions. This template can be easily customized and modified to suit your specific needs, edit and highlight specific countries, regions, or data points.


5 diapositivas
Customer Behavior and Demographics Presentation
Break down customer segments with clarity using this behavior and demographics infographic set. Featuring colorful cylinder diagrams and intuitive labels, these slides are ideal for presenting consumer insights, age groups, behavior trends, and buyer types. Fully editable in PowerPoint, Keynote, and Google Slides—perfect for marketers, analysts, and business development teams.


5 diapositivas
Crypto Investment Trends and Insights Presentation
Stay ahead of the digital asset curve with the Crypto Investment Trends and Insights presentation template. This slide features a visually compelling mining cart illustration filled with cryptocurrency symbols, perfect for presenting market data, blockchain innovations, or digital asset strategies. Highlight three core insights using customizable text areas and icons. Ideal for crypto analysts, fintech professionals, and investment briefings. Fully editable in PowerPoint, Keynote, and Google Slides.


4 diapositivas
Leadership Training Framework Presentation
Inspire growth and guide your team toward success with this clear and modern presentation layout. Designed to illustrate leadership principles, development stages, and coaching strategies, it helps communicate training goals with professionalism and ease. Fully customizable and compatible with PowerPoint, Keynote, and Google Slides for seamless use across platforms.


7 diapositivas
Social Media Marketing Infographic
Social Media Marketing refers to the use of social media platforms and networks to promote a product, service, or brand. This fully editable, infographic template looks great on all devices and contains all complete set of slides shown above. You can use this colorful infographic to features tips on how to use social media posts, videos, chats and websites along with a brief explanation of each. Add your logo, banner images and call to action. The template is compatible with Powerpoint, Keynote and Google Slides, so you can easily add in your custom data for a professional finish.


6 diapositivas
Six Sigma Certification Infographics
Explore the world of Six Sigma Certification with our customizable infographic template. This template is fully compatible with popular presentation software like PowerPoint, Keynote, and Google Slides, allowing you to easily customize it to illustrate and communicate various aspects of Six Sigma certification and its benefits. The Six Sigma Certification infographic template offers a visually engaging platform to outline the different levels of certification, the DMAIC methodology, and the impact of Six Sigma on quality improvement within organizations. Whether you're a quality professional, project manager, or someone looking to enhance your process improvement skills, this template provides a user-friendly canvas to create informative presentations and educational materials. Deepen your knowledge of Six Sigma Certification with this SEO-optimized infographic template, thoughtfully designed for clarity and ease of use. Customize it to showcase the certification requirements, training options, project success stories, and the potential for career advancement, ensuring that your audience gains valuable insights into the world of Six Sigma. Start crafting your personalized infographic today to explore the realm of Six Sigma Certification.


5 diapositivas
Infographic Business Charts Presentation
Bring your data to life with a bold, visual storytelling layout designed to make insights instantly clear and impossible to ignore. This presentation highlights key metrics using clean, modern business charts that simplify comparisons and trends for any audience. Fully compatible with PowerPoint, Keynote, and Google Slides.


10 diapositivas
Business Performance Metrics Presentation
Track and display your business metrics effectively with the "Business Performance Metrics" presentation templates. These visually engaging slides are designed to help you present key performance indicators in a clear and structured manner, enhancing understanding and decision-making. Ideal for corporate presentations, these templates are fully compatible with PowerPoint, Keynote, and Google Slides, ensuring seamless integration into your workflow.


21 diapositivas
Velocity Startup Growth Plan Presentation
Accelerate your startup's growth with this dynamic plan template! Perfect for outlining your mission, vision, business model, and marketing strategy. Ideal for entrepreneurs aiming to secure funding and drive success. Compatible with PowerPoint, Keynote, and Google Slides, this template ensures your growth plan is clear, professional, and compelling. Achieve your startup goals today!


7 diapositivas
Lean Business Model Infographic
Step into the dynamic world of lean startup methodology with our lean business model infographic. Utilizing a striking palette of oranges, blacks, and other vivid colors, this infographic simplifies the intricate components of the lean canvas. It's an invaluable asset for entrepreneurs, business educators, and startup enthusiasts. By offering a bird's-eye view of a startup's proposition, it ensures stakeholders align their strategies efficiently. Regardless of the platform - be it PowerPoint, Keynote, or Google Slides - this infographic seamlessly adapts, enhancing your presentation's professional appeal.


8 diapositivas
Modern Pricing Table Design Presentation
Turn heads and highlight value with this sleek, modern layout that makes pricing clear and compelling. Perfect for showcasing service tiers or subscription plans, this clean design uses bold icons and structured comparisons to guide decisions. Fully compatible with PowerPoint, Keynote, and Google Slides for easy customization and professional pricing presentations.


5 diapositivas
Physical Science Infographics
Immerse in the realm of physical sciences with our physical science infographics template. Set against a deep cosmos of blues and purples, this template serves as a bridge between complex scientific principles and audiences, ideal for educators, students, and science communicators. The design, balancing creativity and informativeness, integrates stunning graphics and icons, turning data and facts into captivating visual stories. This dark-themed, visually engaging layout is not just an educational tool, but a spark that ignites curiosity and exploration in classrooms, scientific presentations, or educational content, making science both profound and accessible.


6 diapositivas
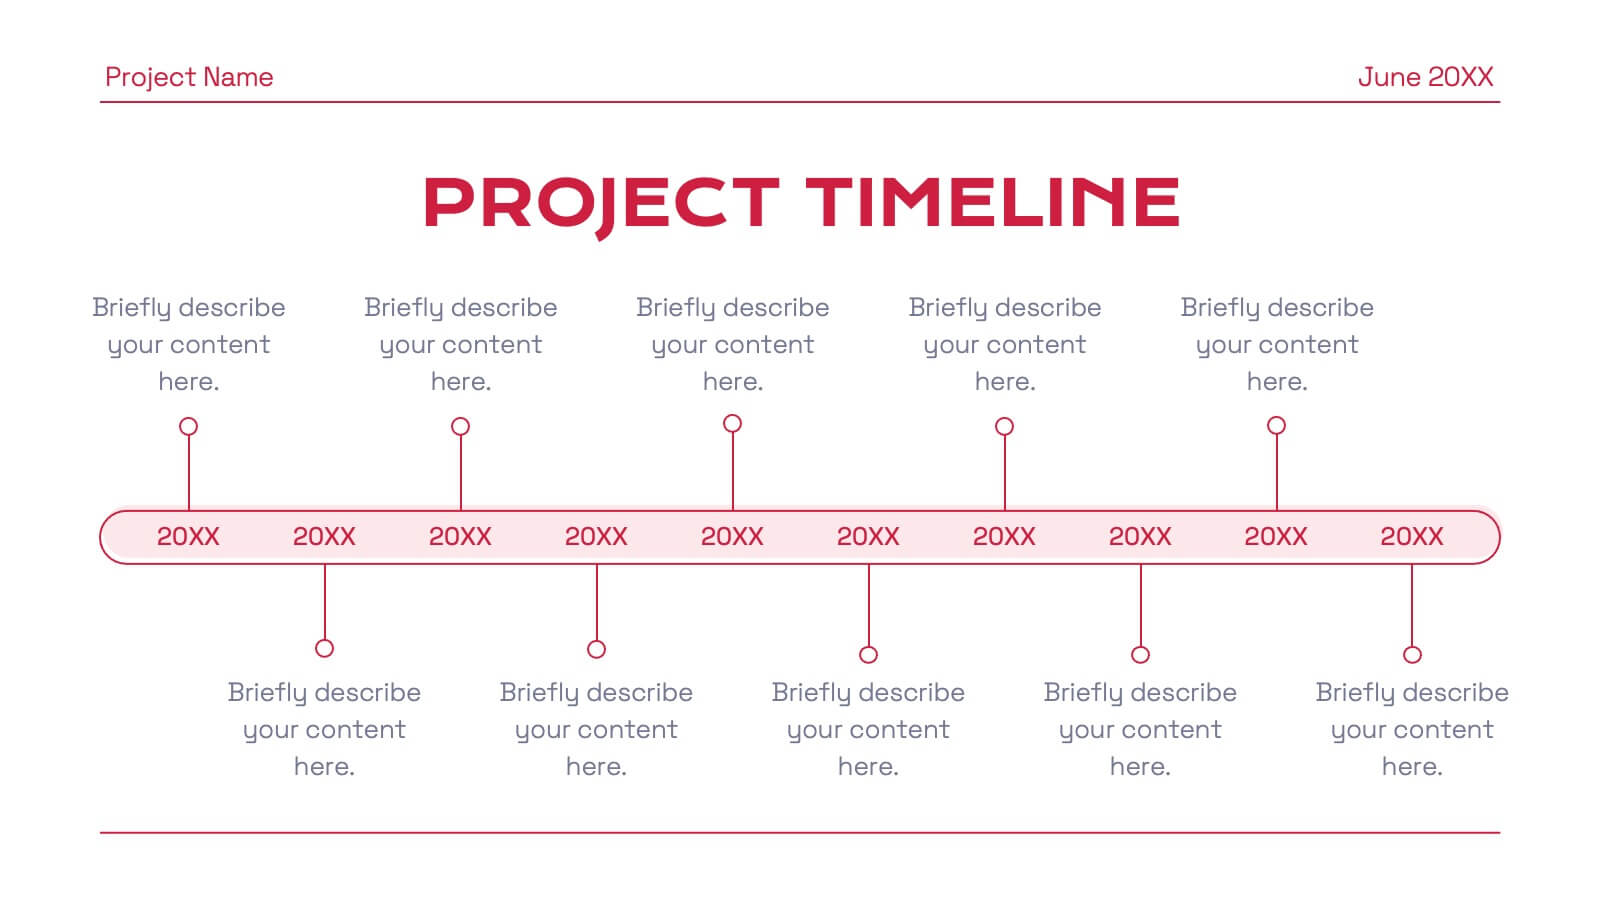
Project Milestone Infographic
A project milestone is a significant event or point of progress during the execution of a project. This infographic template represents the completion of a specific phase or task and can be used as a reference point to track the project's progress and measure its success. This template will help project teams stay on track, align their efforts, and provide stakeholders with a clear understanding of the project's status. The infographic is designed to help project managers, team members, and stakeholders track and understand the project's development at a glance. This template is compatible with Powerpoint, Keynote, and Google Slides.

22 diapositivas
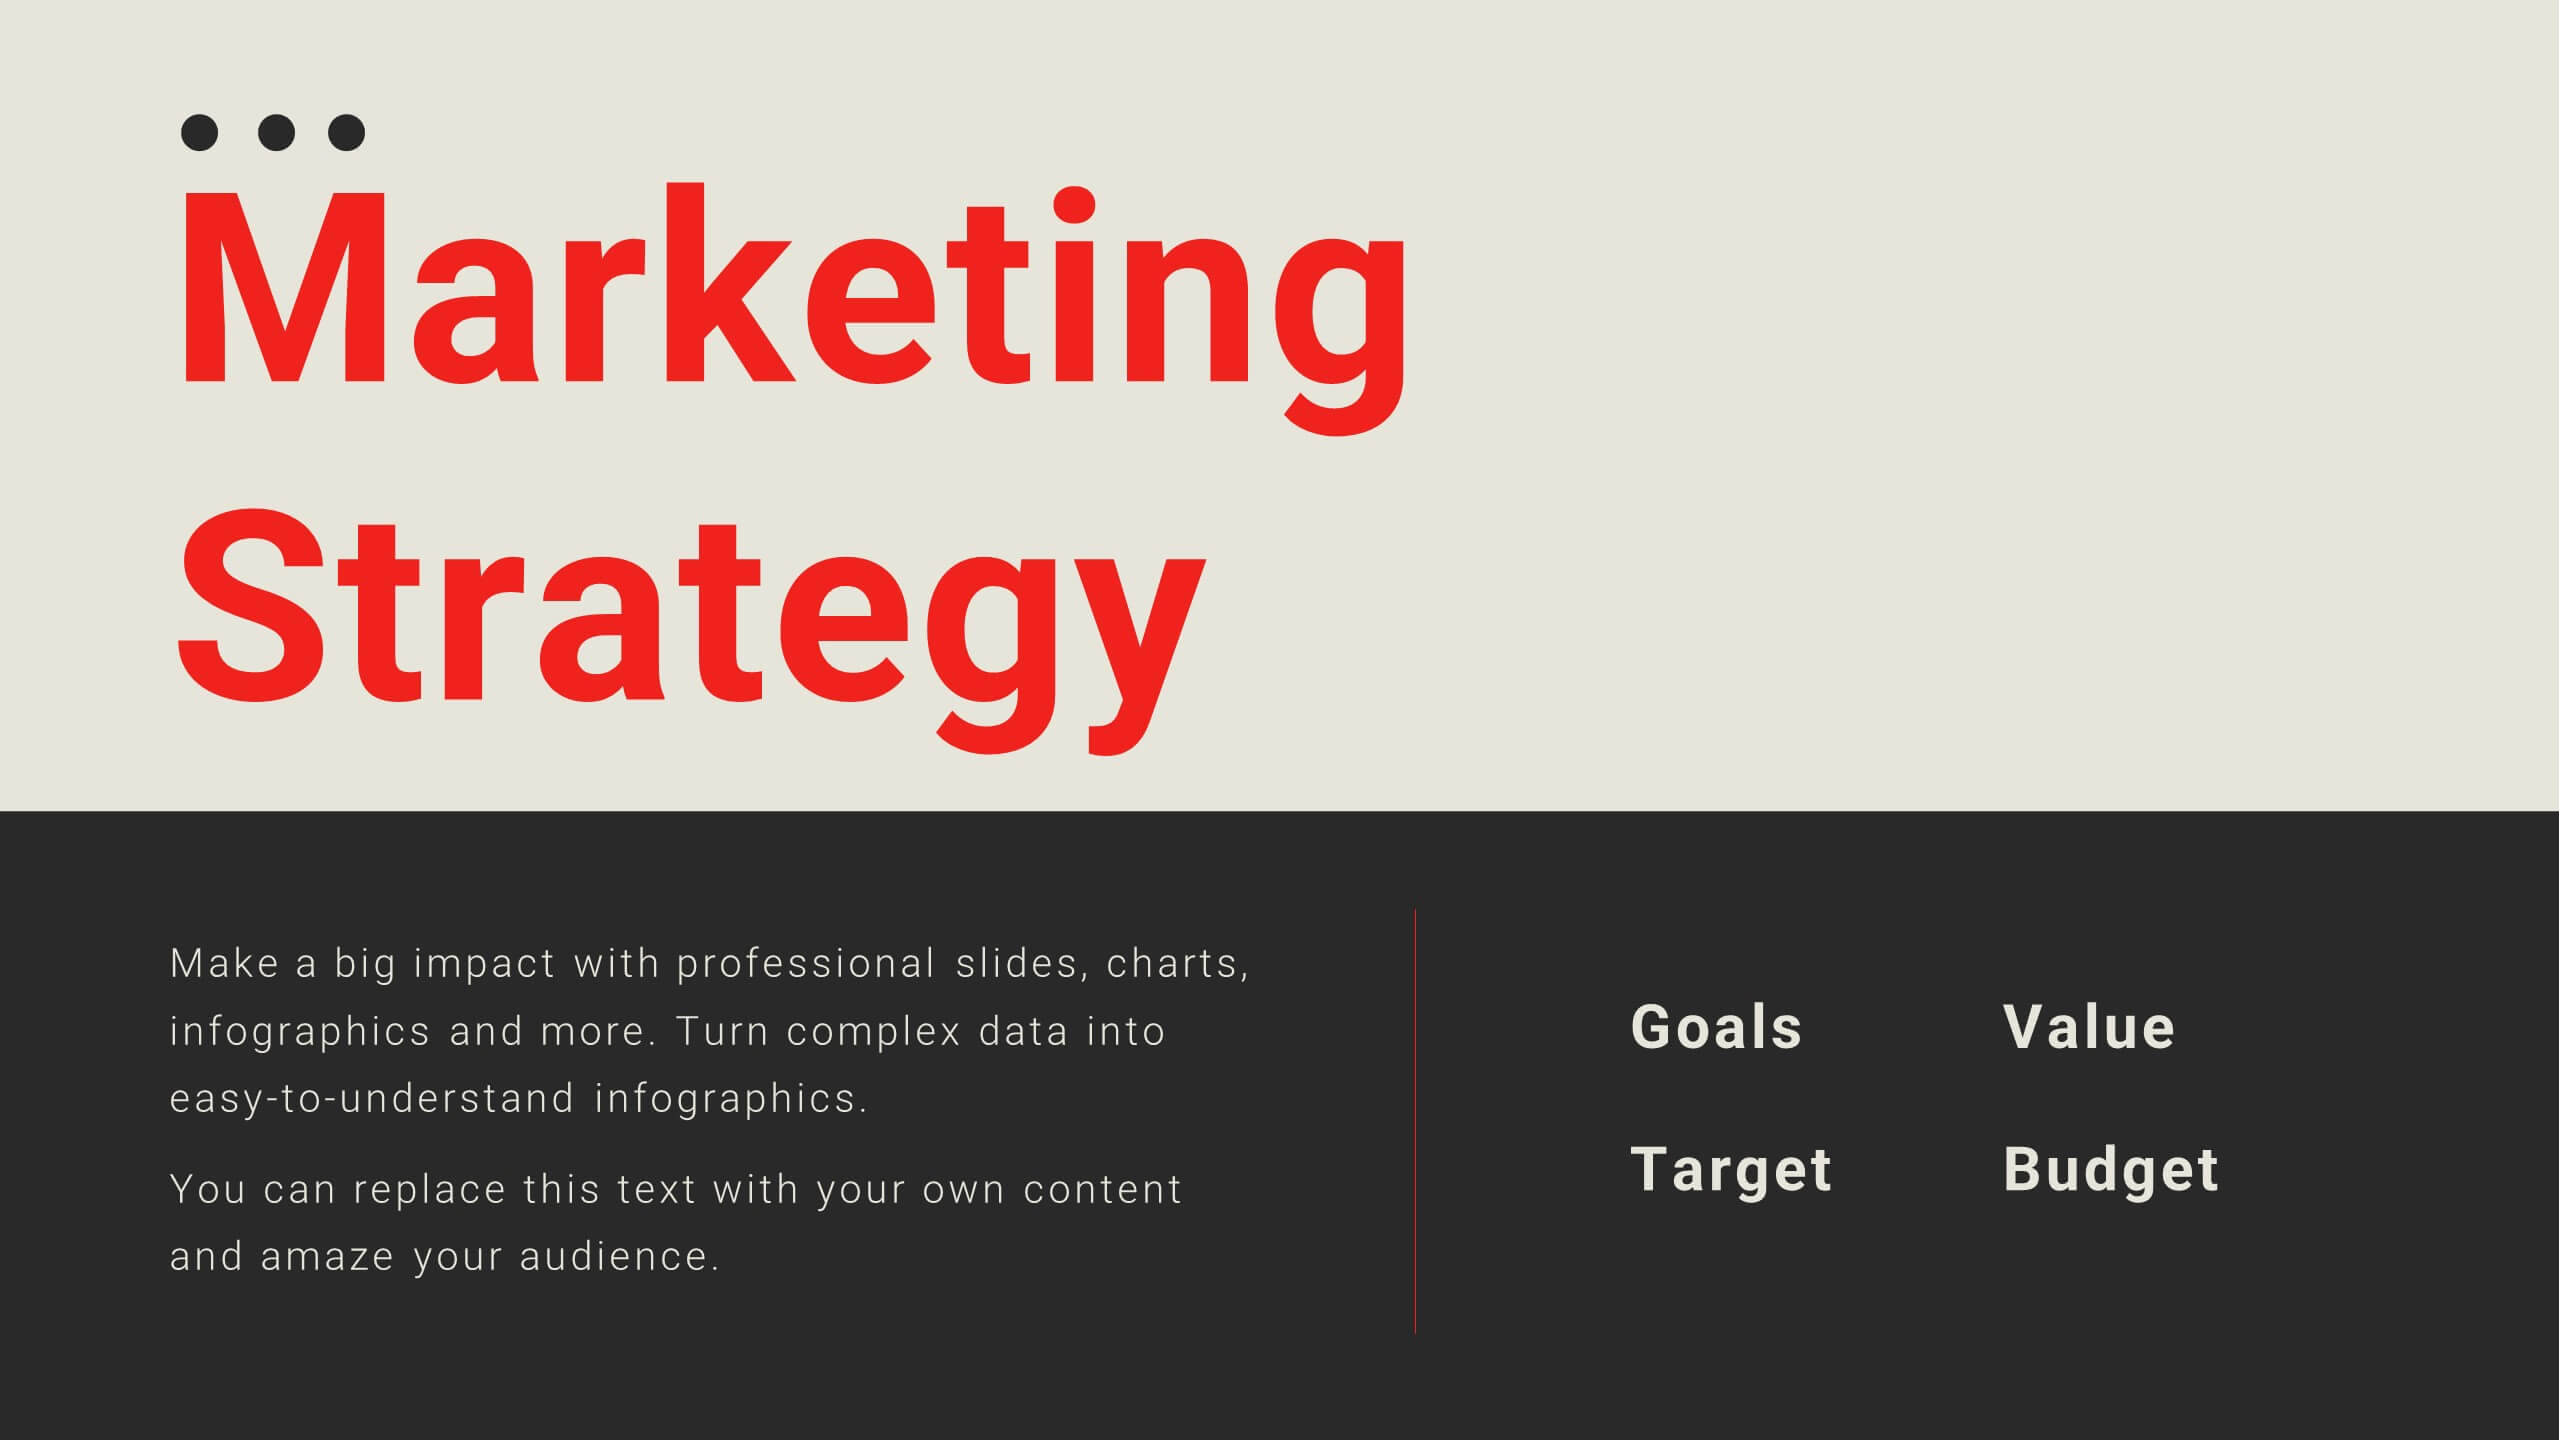
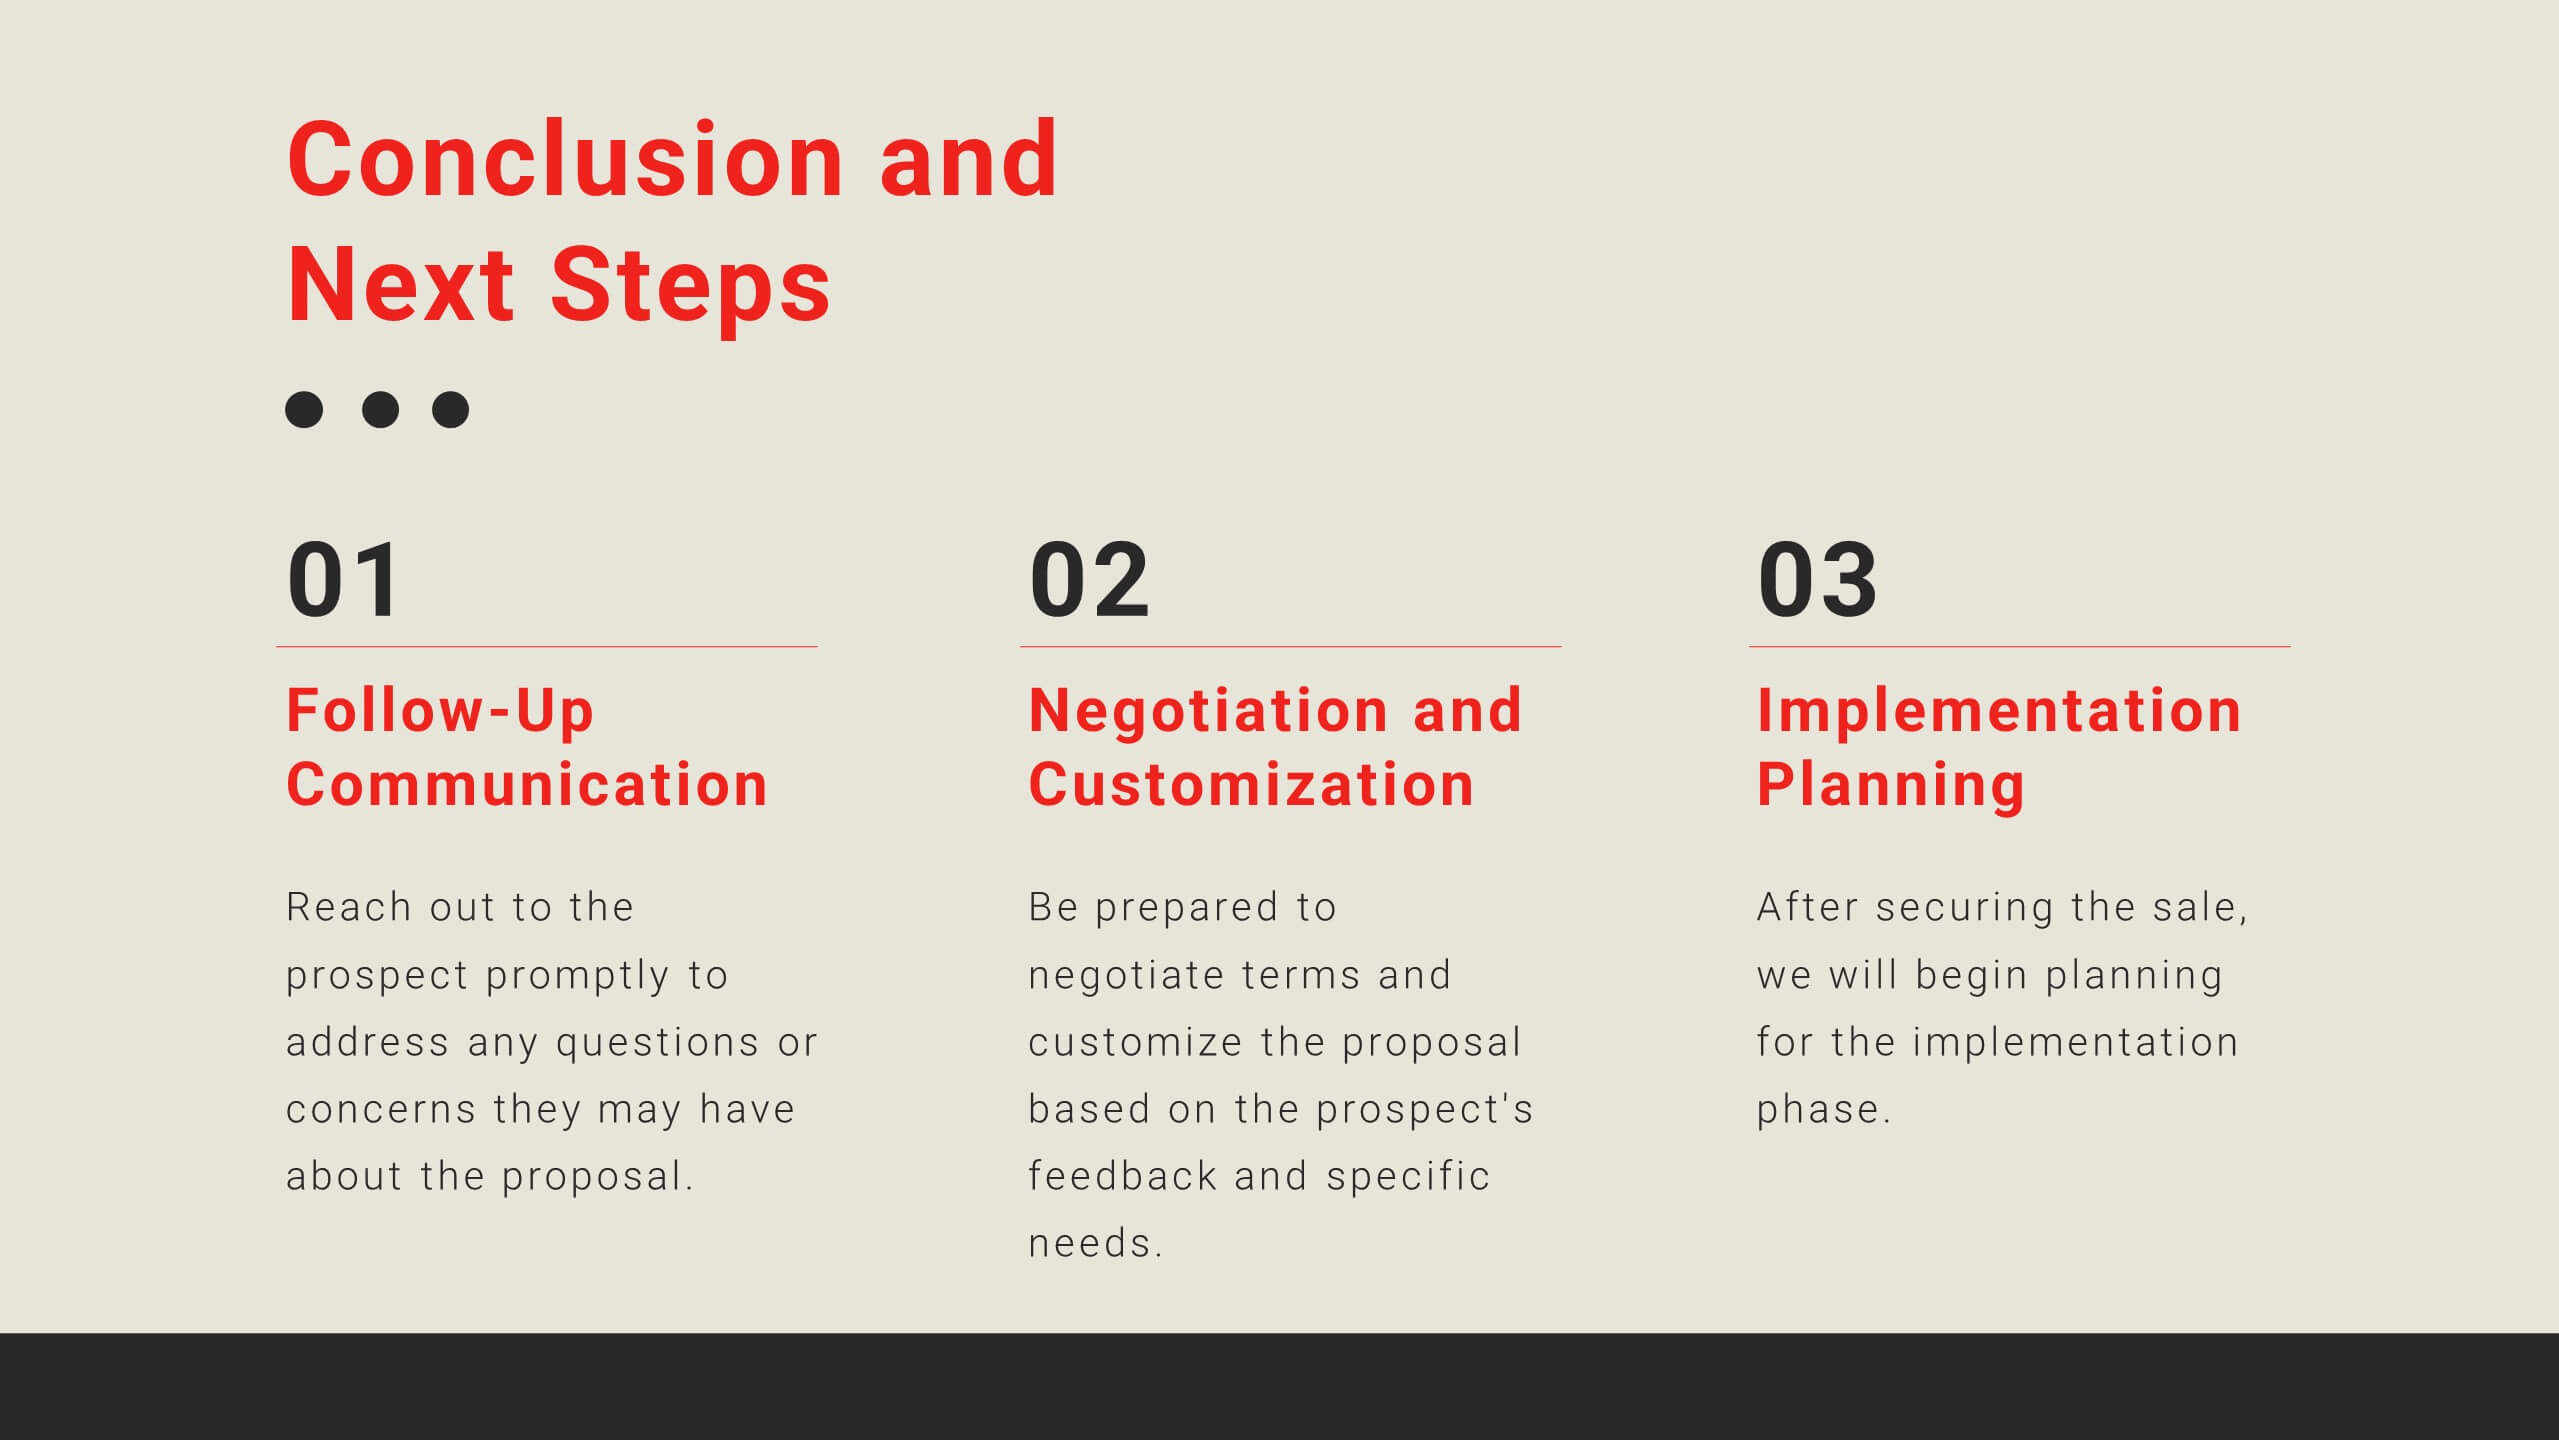
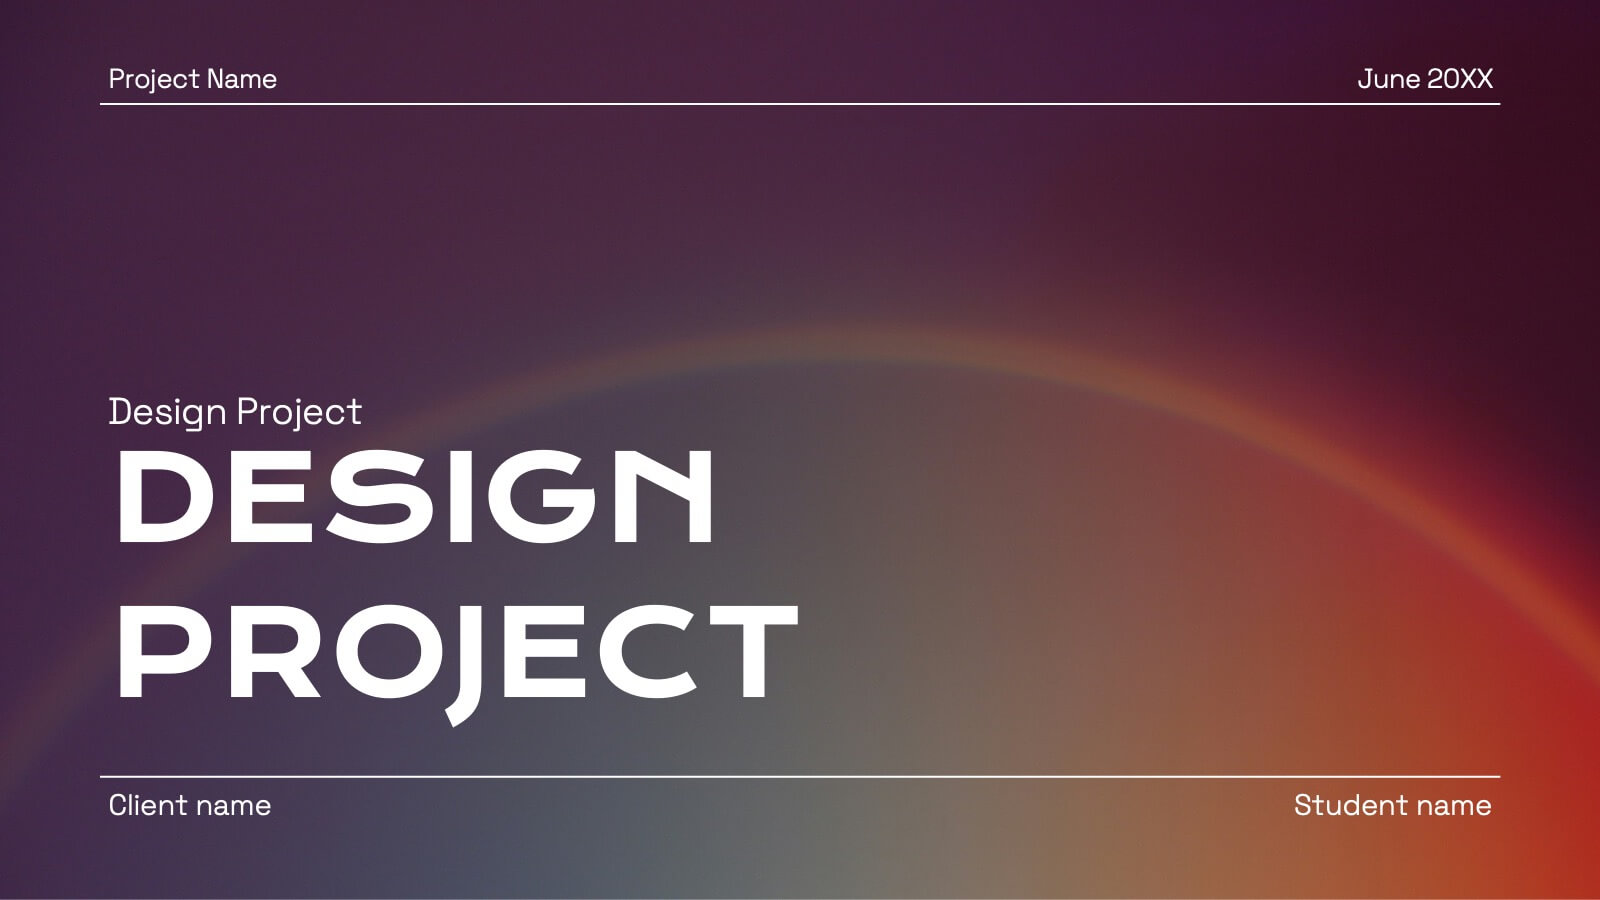
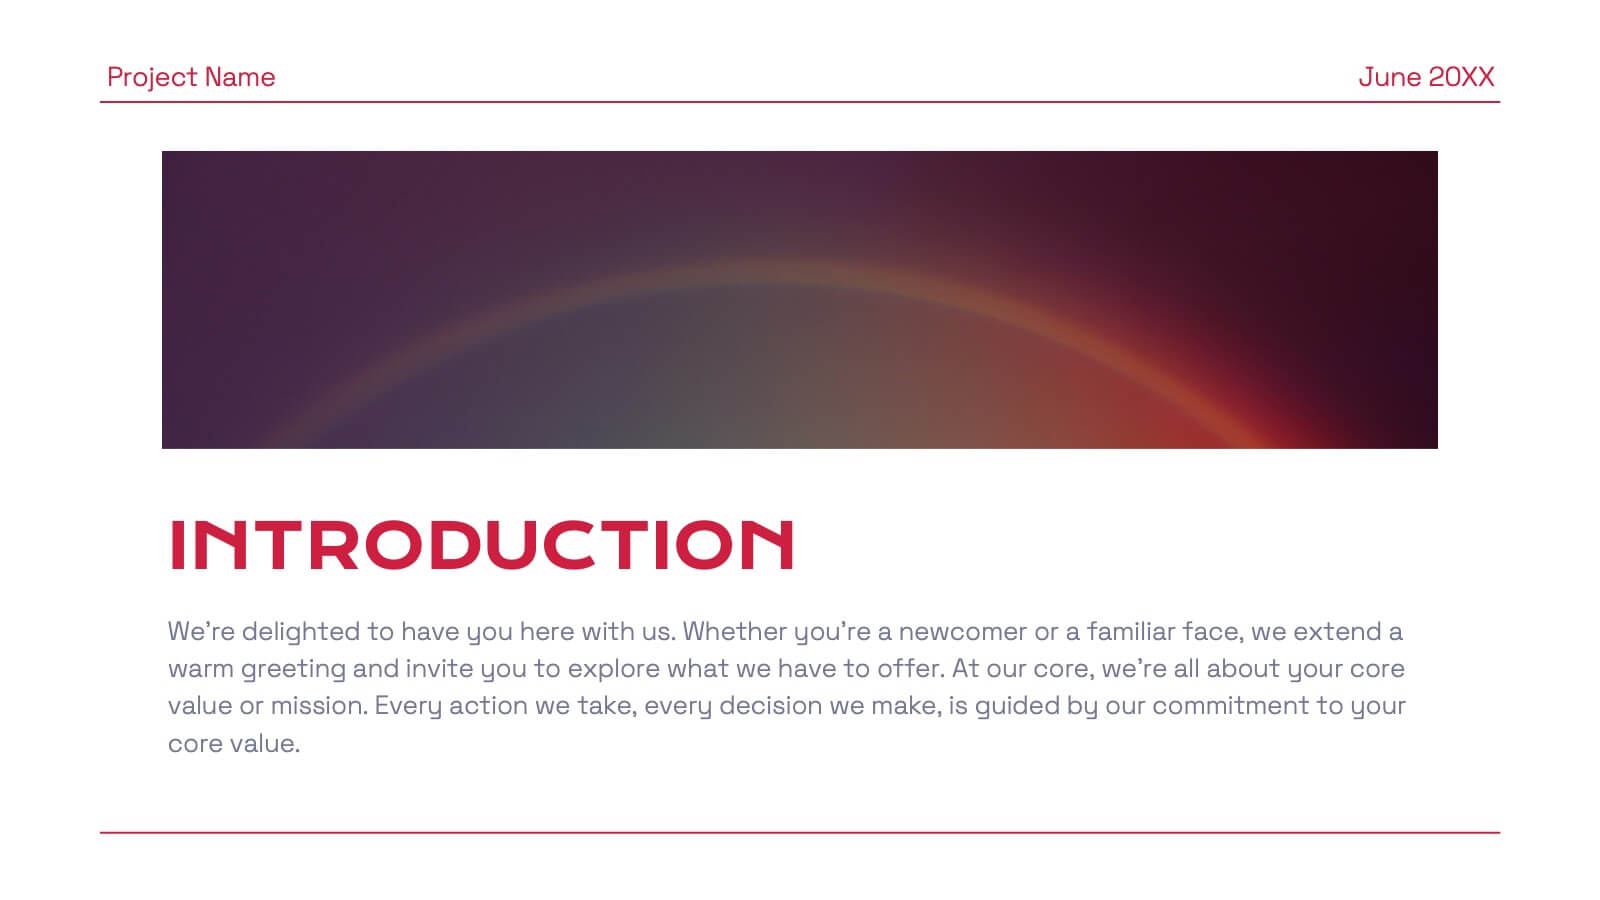
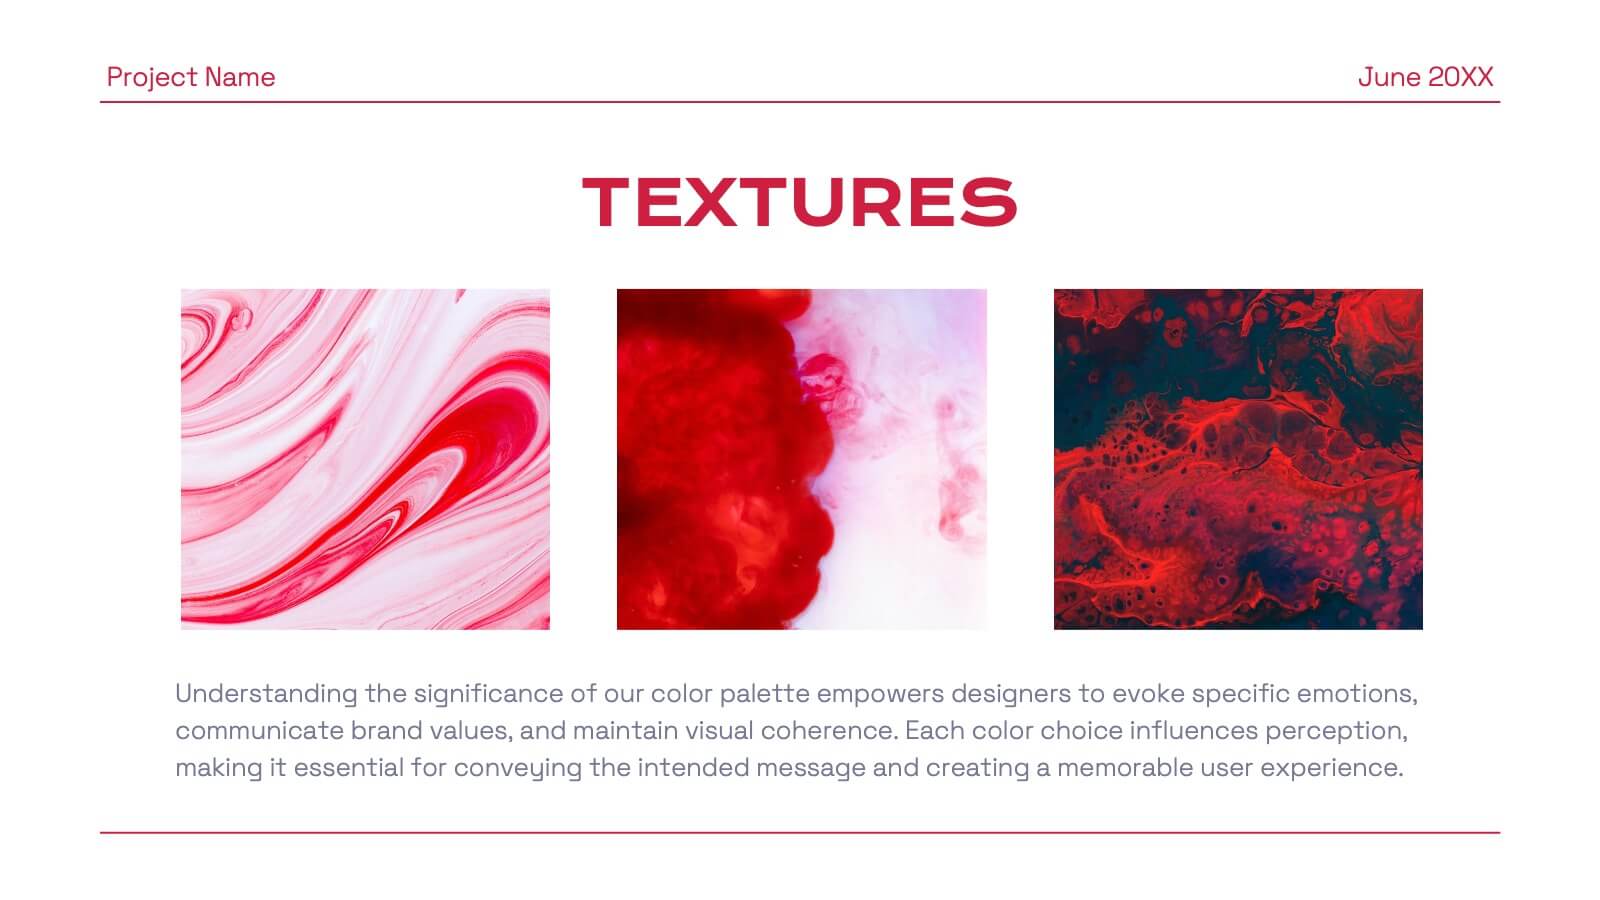
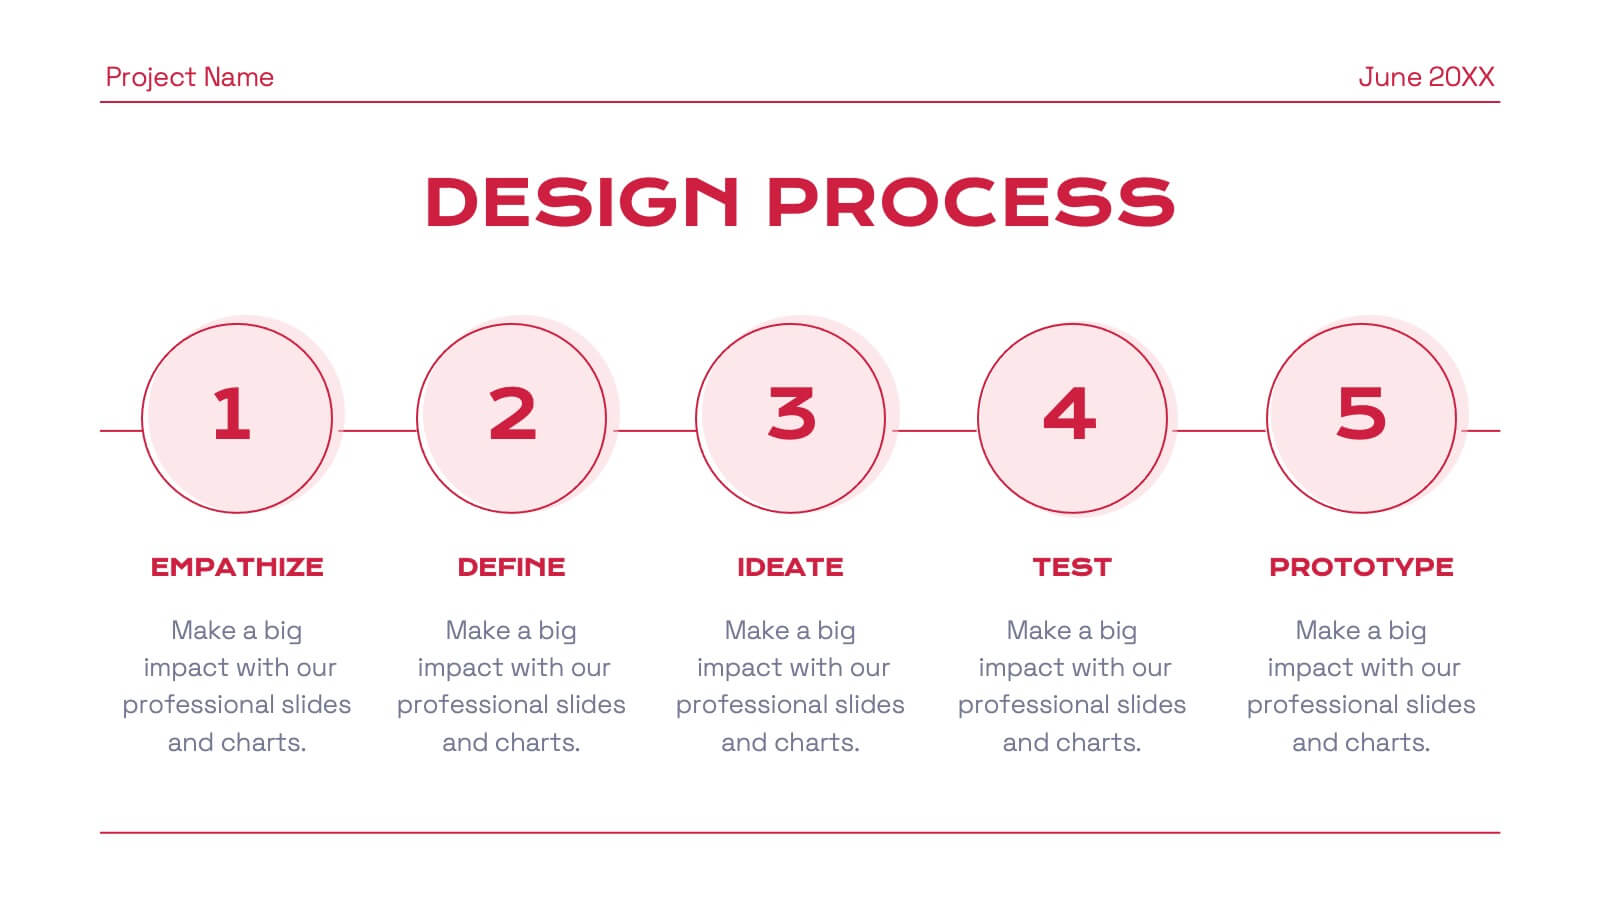
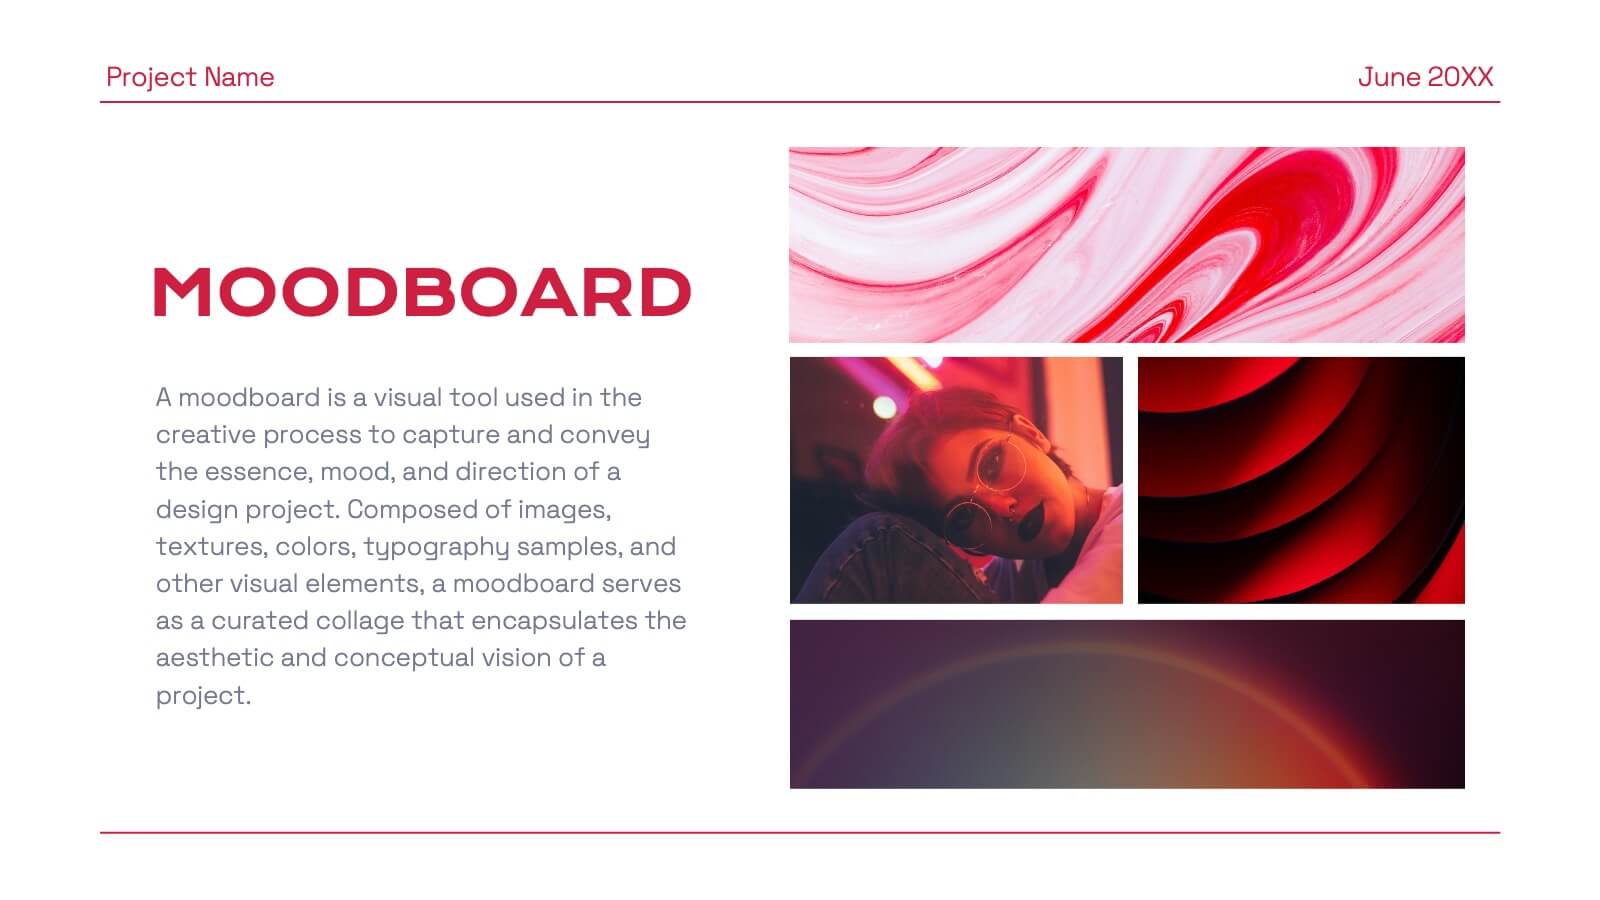
Eclipse Graphic Design Project Plan Presentation
Develop a winning marketing strategy with this dynamic template. Dive into current trends, consumer behavior, and innovative techniques. Perfect for social media, influencer marketing, and data-driven campaigns. Fully compatible with PowerPoint, Keynote, and Google Slides.


7 diapositivas
Mind Map Program Infographic Presentation
Mind Maps are appealing visuals that are easy to follow. Use our high quality template to create a mind map infographic that explains your concepts, or use it to highlight the benefits of your product in an educational way. Map out your ideas and create a visual that can be explored from many different directions. This template is suitable for both business and educational applications, so you can use it at work, school or as part of your portfolio. It’s easy to customize and compatible with PowerPoint, Keynote and Google Slides. Easily create a dynamic and engaging project in just minutes!


5 diapositivas
Cognitive Psychology Framework Presentation
Unlock insights in the most visual way possible with this bold, brain-powered slide! This presentation template helps simplify complex ideas behind how we think, reason, and remember—perfect for research, education, or team workshops. Fully customizable and compatible with PowerPoint, Keynote, and Google Slides for seamless editing across platforms.