


Características


¿Tienes alguna pregunta?
Recomendar


6 diapositivas
Asia Map Population Infographic
Explore the demographic dynamics of Asia with our collection of infographic slides, designed to illustrate the population statistics across the continent. These templates are an essential tool for educators, demographers, and business analysts, providing detailed visualizations of population distribution, density, and growth trends. Each infographic combines the map of Asia with engaging graphical elements such as bar graphs, pie charts, and statistical callouts that emphasize key data points like total population, urban versus rural distribution, and demographic forecasts. The color-coding and spatial arrangements on the map effectively highlight variations and trends across different countries and regions, making complex data easy to understand and visually compelling. Fully customizable, these templates allow you to adjust the data presentation to suit specific needs or focuses, such as comparing population growth rates or highlighting demographic challenges. Whether used in presentations, reports, or educational materials, these slides offer a comprehensive and accessible way to communicate the demographic landscape of Asia.


5 diapositivas
Social Media Analytics and Metrics Presentation
Track performance across platforms with this sleek analytics dashboard. Visualize paid vs. organic reach, audience engagement, and conversion data in one view. Ideal for reporting social insights to clients or teams. Compatible with PowerPoint, Keynote, and Google Slides—fully editable to fit any social media strategy, campaign review, or content report.


6 diapositivas
Customer Conversion Funnel
Visualize every stage of your customer journey with the Customer Conversion Funnel Presentation. This layered funnel diagram breaks down the conversion process into five clear levels—from awareness to action—making it easy to explain how leads are captured and converted. Ideal for digital marketers, sales teams, and consultants presenting campaign performance, lead nurturing, or CRM workflows. Compatible with PowerPoint, Keynote, and Google Slides.


4 diapositivas
Survey Response Data Visuals Presentation
Present your survey data clearly with this radial icon-based layout. Show response percentages alongside descriptive titles and modern visuals. Ideal for feedback analysis or research summaries. Fully editable in Canva, PowerPoint, or Google Slides, this template offers a clean, professional look to highlight key insights with ease.


5 diapositivas
Artificial Intelligence Categories Infographics
Artificial Intelligence has the potential to revolutionize industries and create new opportunities for businesses and individuals. These infographic templates provide an overview of the different categories of artificial intelligence based on their functionality and applications. These infographics feature futuristic designs with icons and illustrations to represent each category of AI. The categories in this template are described with a short summary and corresponding icon or illustration. The infographic is designed with a vertical layout and uses a blue color scheme throughout. This template is perfect to introduce the basics of AI to an audience.


6 diapositivas
Section Breakdown Table of Content Presentation
Present your topics in a clear, structured way with the Section Breakdown Table of Content template. Featuring a two-column layout with colorful icons and labeled sections, it’s perfect for outlining multiple categories. Fully editable in Canva, PowerPoint, and Google Slides to match your brand style and improve presentation flow.


4 diapositivas
Content Calendar and Engagement Plan Presentation
Plan and track content effectively with this calendar-style engagement layout. Visualize posting frequency, engagement goals, and campaign performance in a single view. Ideal for content strategists and marketers managing social or editorial schedules. Fully editable in PowerPoint, Keynote, or Google Slides to suit your unique workflow and branding needs.


12 diapositivas
Real Estate House Market Trends Presentation
Analyze Real Estate House Market Trends with this insightful presentation template. Featuring a house-shaped hexagonal layout, this design helps illustrate key factors such as market demand, property values, investment opportunities, and housing policies. Ideal for real estate professionals, investors, and analysts looking to present market insights with clarity and impact. Fully customizable and compatible with PowerPoint, Keynote, and Google Slides.


8 diapositivas
30-60-90 Day Business Plan Presentation
Set clear goals and track progress effortlessly with this 30-60-90 day business plan template! Designed for professionals, managers, and entrepreneurs, this structured layout helps outline priorities, set milestones, and ensure a smooth transition from planning to execution. Fully customizable and compatible with PowerPoint, Keynote, and Google Slides for seamless presentations.


4 diapositivas
Team and Department Setup Structure Presentation
Organize your team with clarity using the Team and Department Setup Structure Presentation. This template is perfect for showcasing internal team hierarchies, departmental layouts, or functional groupings in a clean and professional layout. Each slide is fully customizable, allowing you to edit icons, titles, and structure to suit your organization. Compatible with Canva, PowerPoint, Keynote, and Google Slides.


21 diapositivas
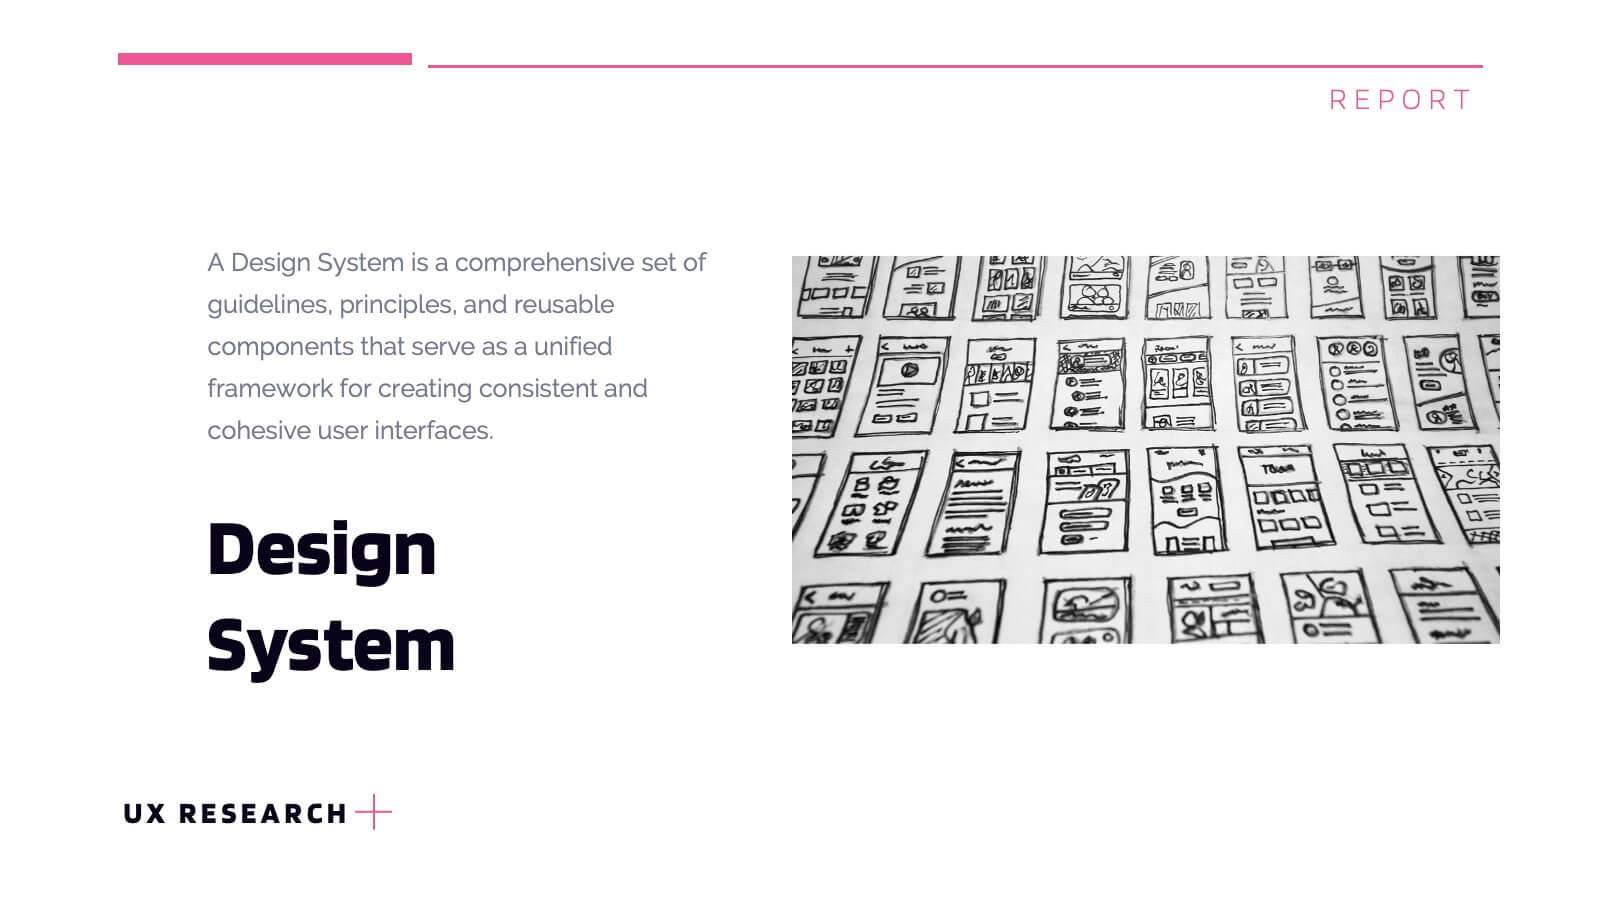
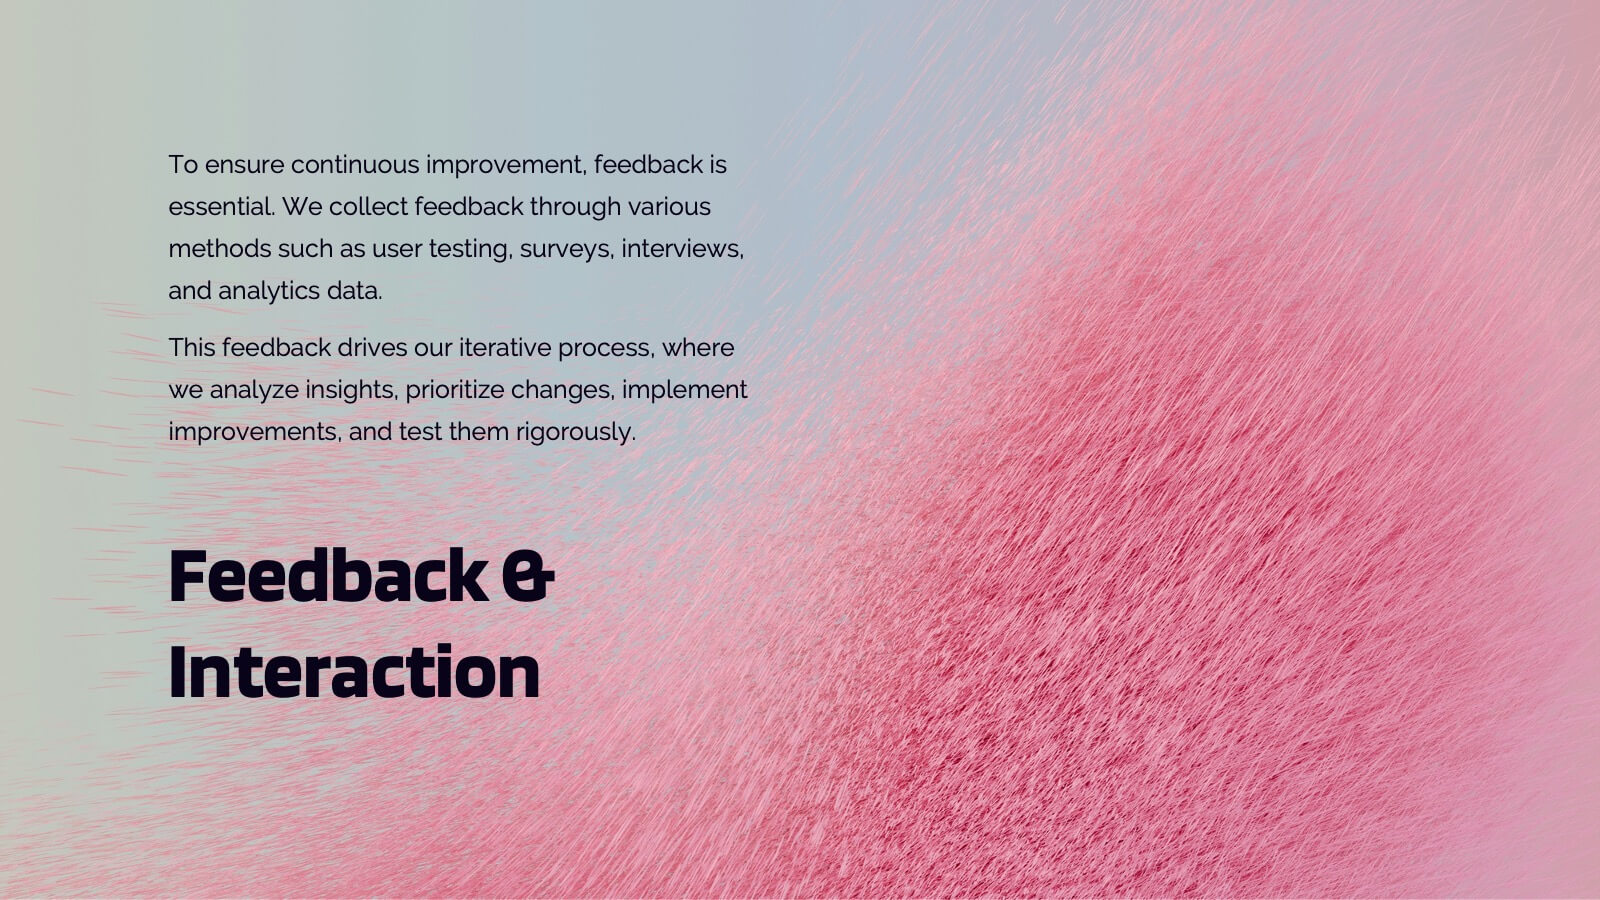
Lumascend UX Research Report Presentation
Present your UX research findings with clarity using this engaging and organized template! Covering key areas like user personas, wireframes, testing, and interaction design, it ensures all aspects of your design process are communicated effectively. Perfect for UX teams, stakeholders, or client presentations, this template works seamlessly with PowerPoint, Keynote, and Google Slides.


21 diapositivas
Goldenshadow Professional Portfolio Showcase Presentation
A refined portfolio presentation template crafted to highlight professional achievements and expertise. Showcase featured projects, collaborations, and client testimonials with a sleek, modern design. Includes sections for services offered, awards, pricing, and contact information. Fully customizable and compatible with PowerPoint, Keynote, and Google Slides for impactful portfolio presentations.


4 diapositivas
Attention-Interest-Desire-Action Sales Strategy Presentation
Highlight each phase of your sales journey with this clean and modern AIDA model layout. Designed for clarity, it uses bold semicircle visuals and directional arrows to guide your audience from capturing attention to driving action. Perfect for sales teams, marketers, and consultants. Fully editable in PowerPoint, Keynote, and Google Slides.


10 diapositivas
Startup Pitch Deck Presentation
Make your big idea impossible to ignore with a sleek, investor-ready design that tells your startup’s story with clarity and confidence. This presentation helps you outline your vision, market potential, and business strategy in a compelling way. Fully compatible with PowerPoint, Keynote, and Google Slides for effortless customization.


6 diapositivas
Project Timeline Infographic
A project timeline is a visual representation of the planned schedule and key milestones of a project. This infographic is designed to outline the sequence of activities, tasks, and events that need to be completed within a specific timeframe to achieve your project goals. This allows you to showcase the timeline of a project, from its inception to completion. It provides a clear and concise overview of the project's major milestones, tasks, and deadlines, enabling viewers to understand the project's progress at a glance. Compatible with Powerpoint, Keynote, and Google Slides.


4 diapositivas
Organizational Mission Strategy Presentation
Stand tall with this mountain-themed layout—perfect for showcasing the pillars of your organizational mission strategy. Each peak represents a strategic objective or core value, guiding your team toward a shared goal. Fully compatible with PowerPoint, Keynote, and Google Slides.


6 diapositivas
Business Milestone Timeline Presentation
Showcase key achievements and future goals with the Business Milestone Timeline Presentation. This visually engaging template allows you to highlight crucial company events, project phases, or strategic plans in a clear, structured format. Ideal for corporate reporting, business growth tracking, and investor presentations. Fully customizable and compatible with PowerPoint, Keynote, and Google Slides.