


Características


¿Tienes alguna pregunta?
Recomendar

21 diapositivas
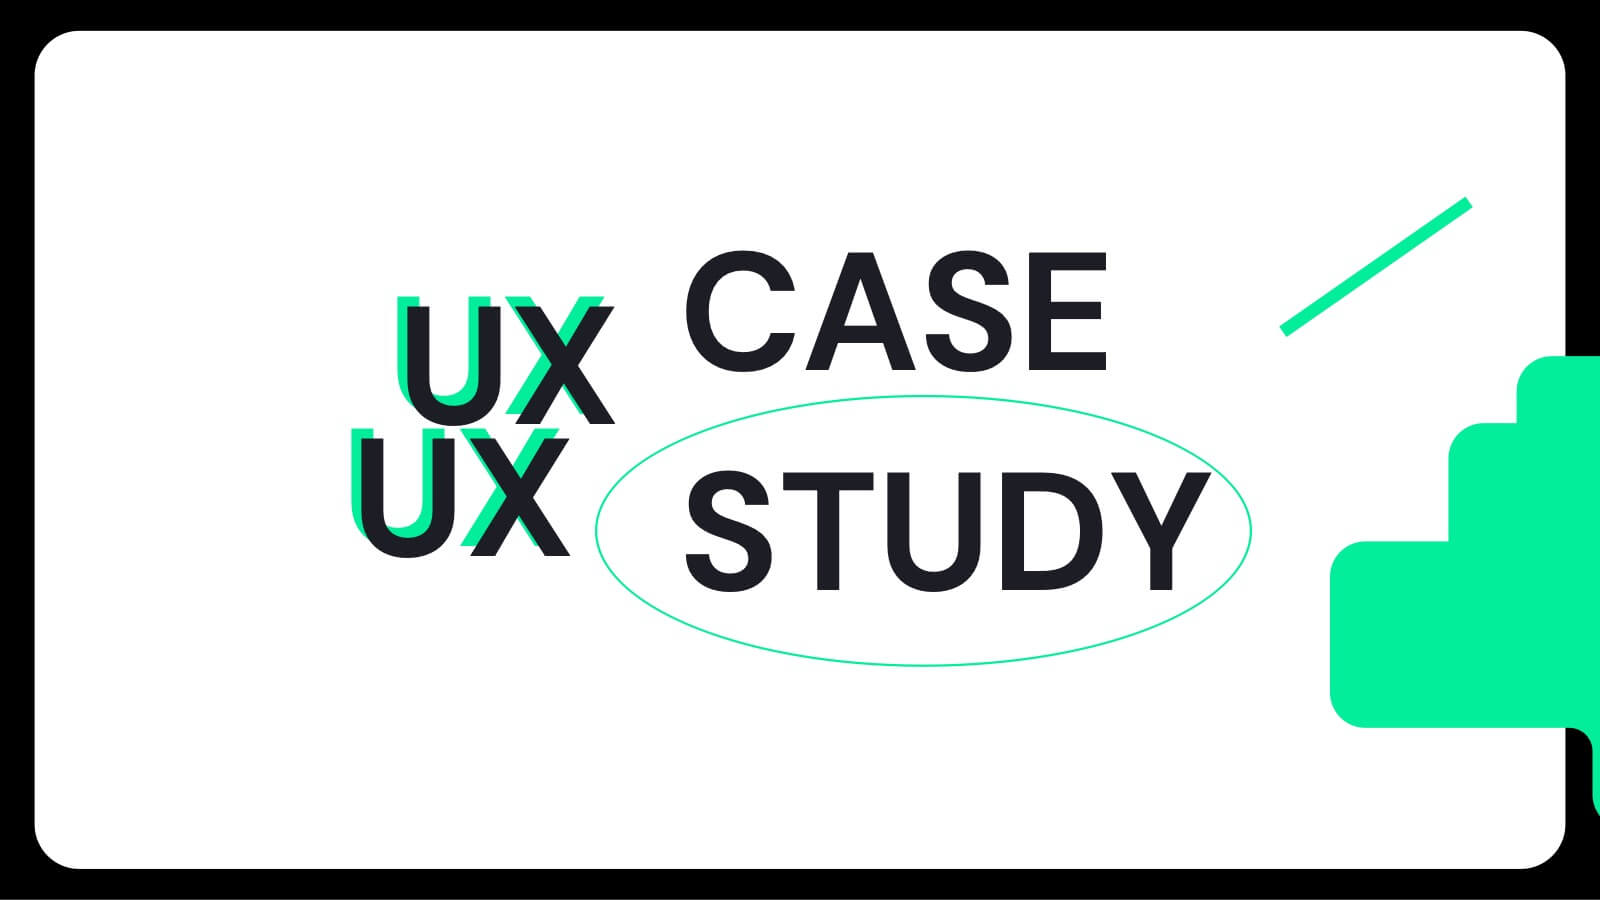
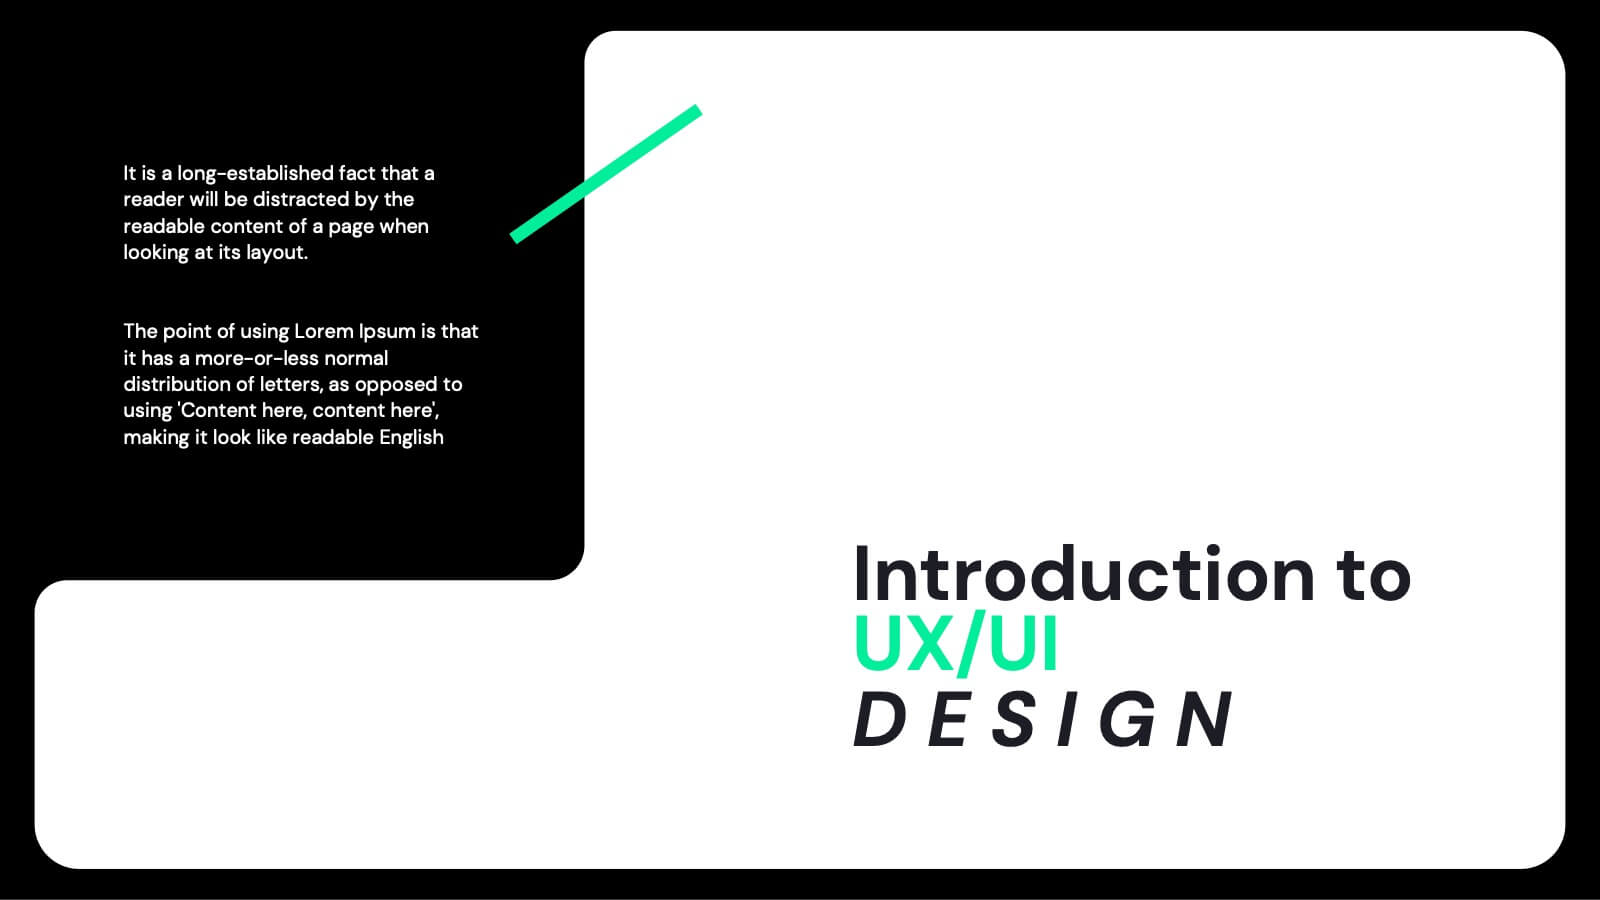
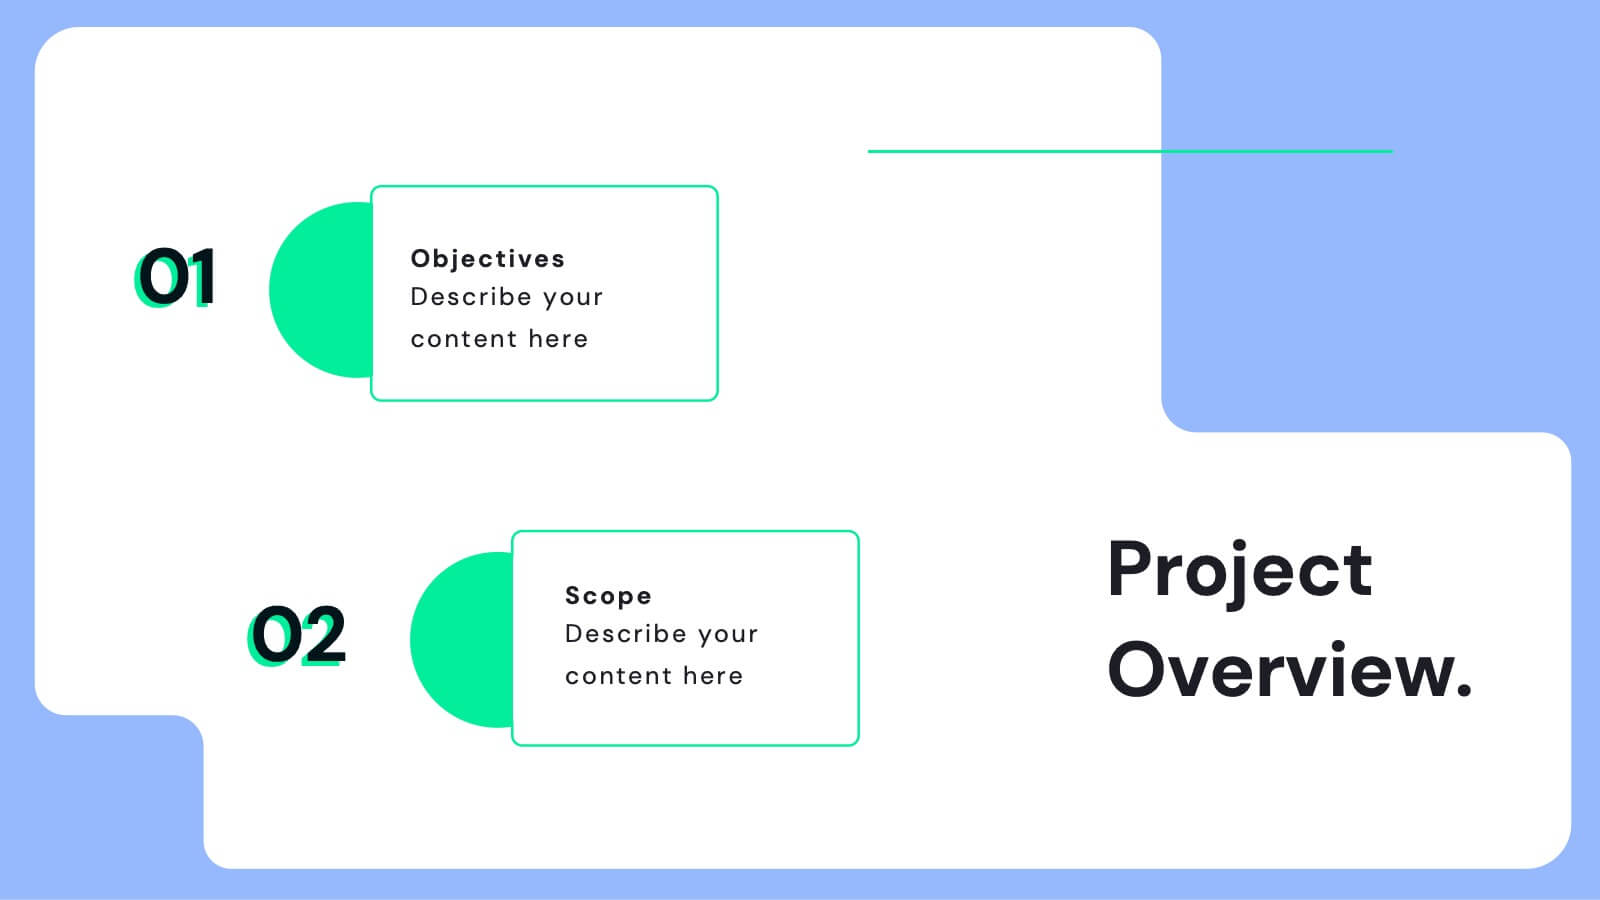
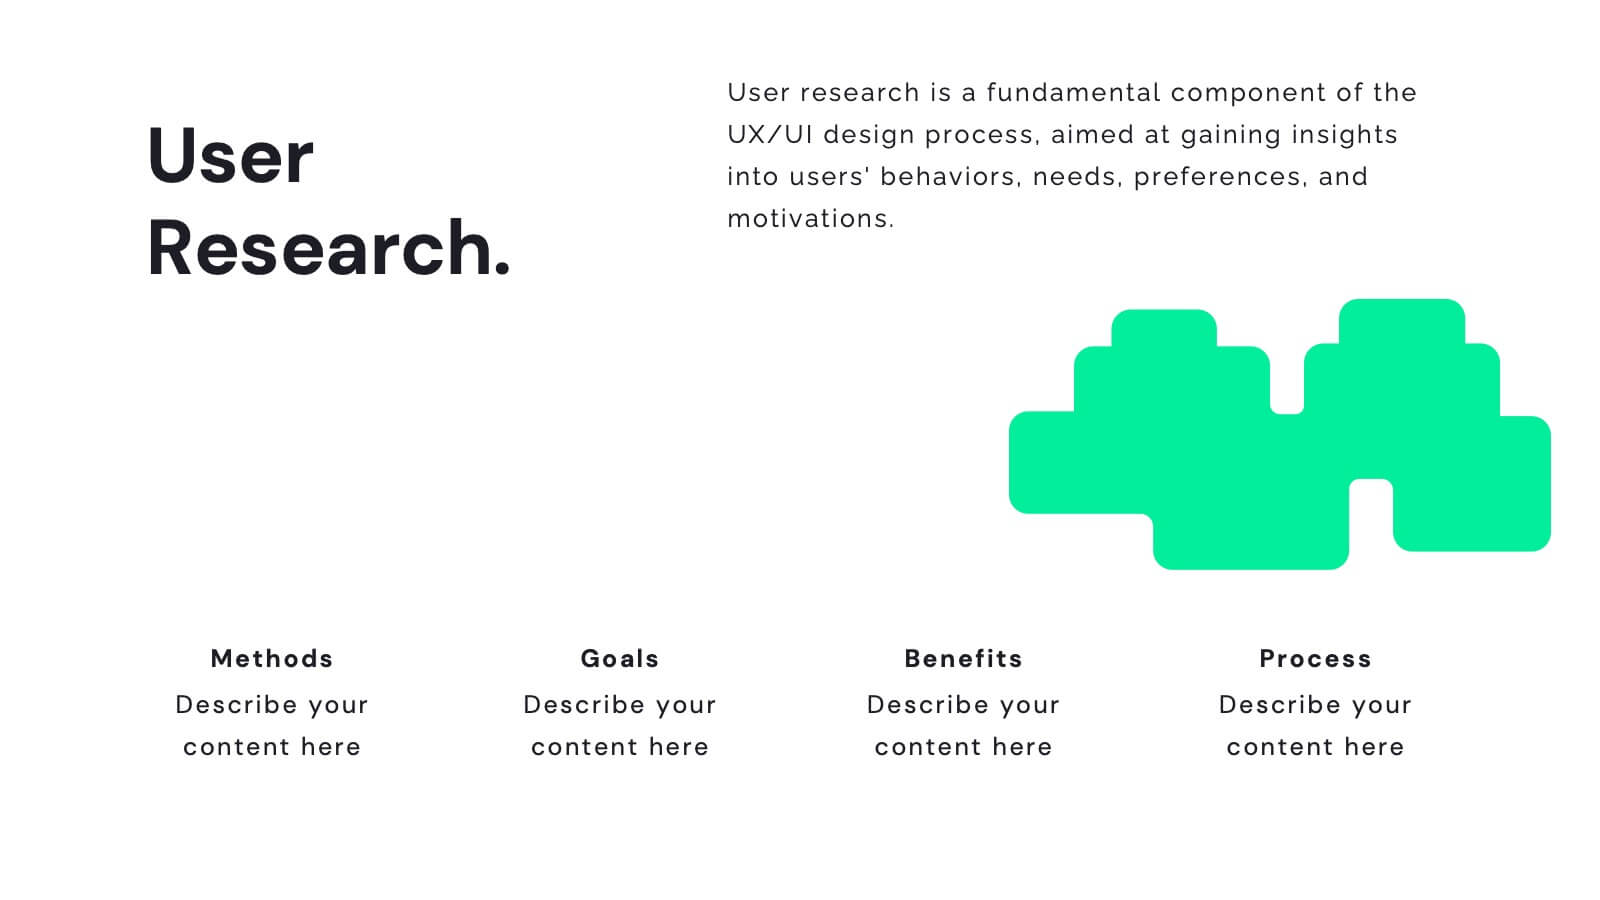
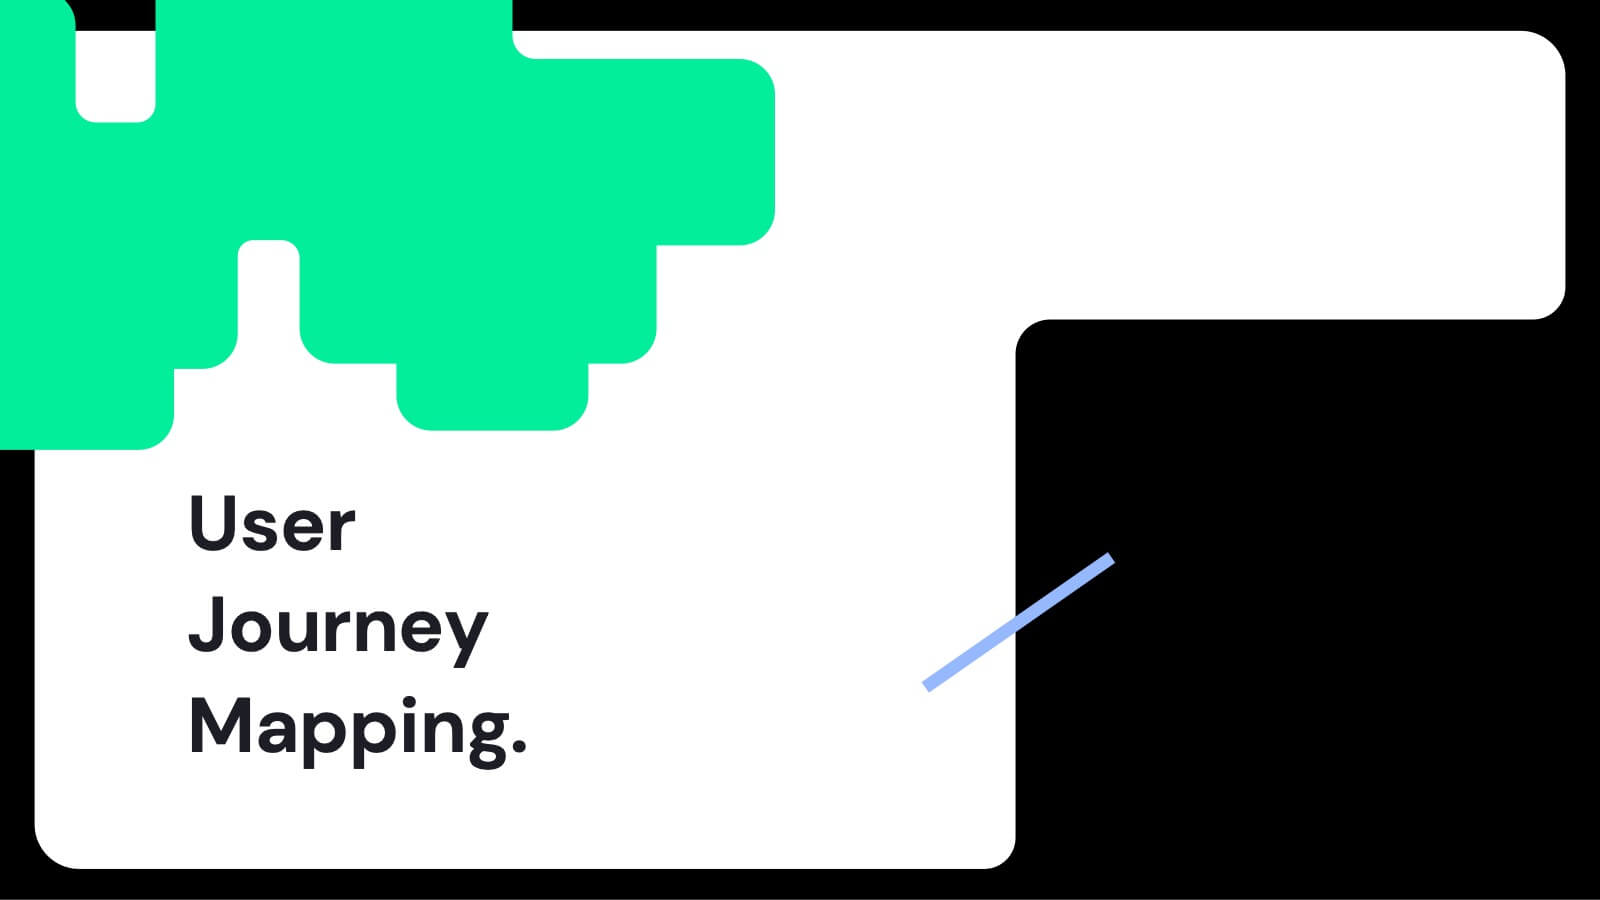
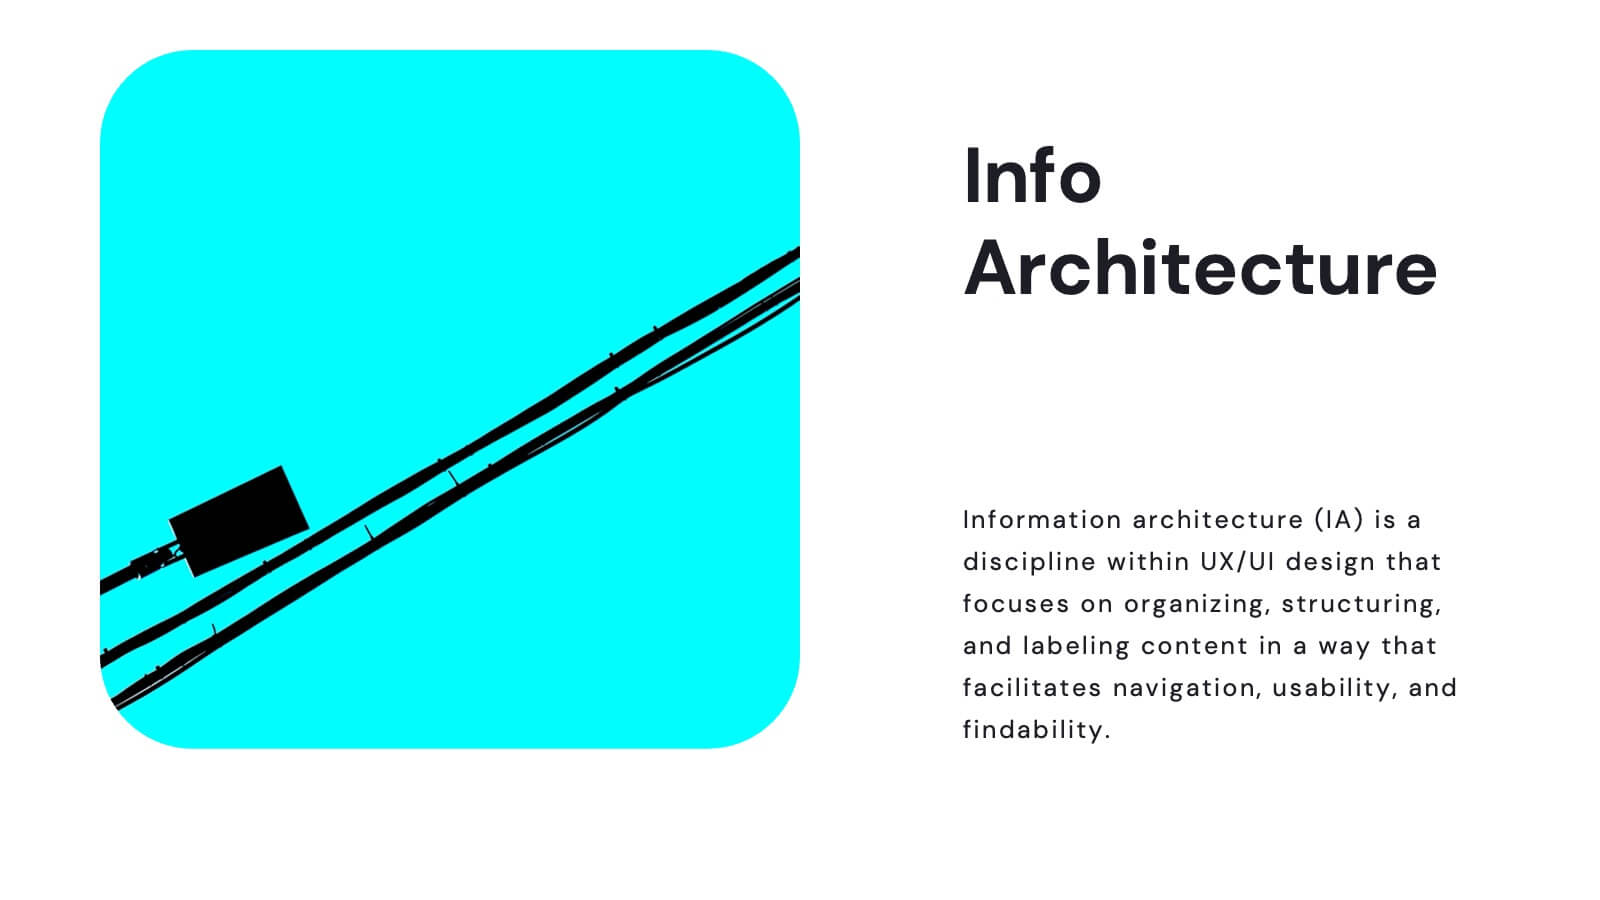
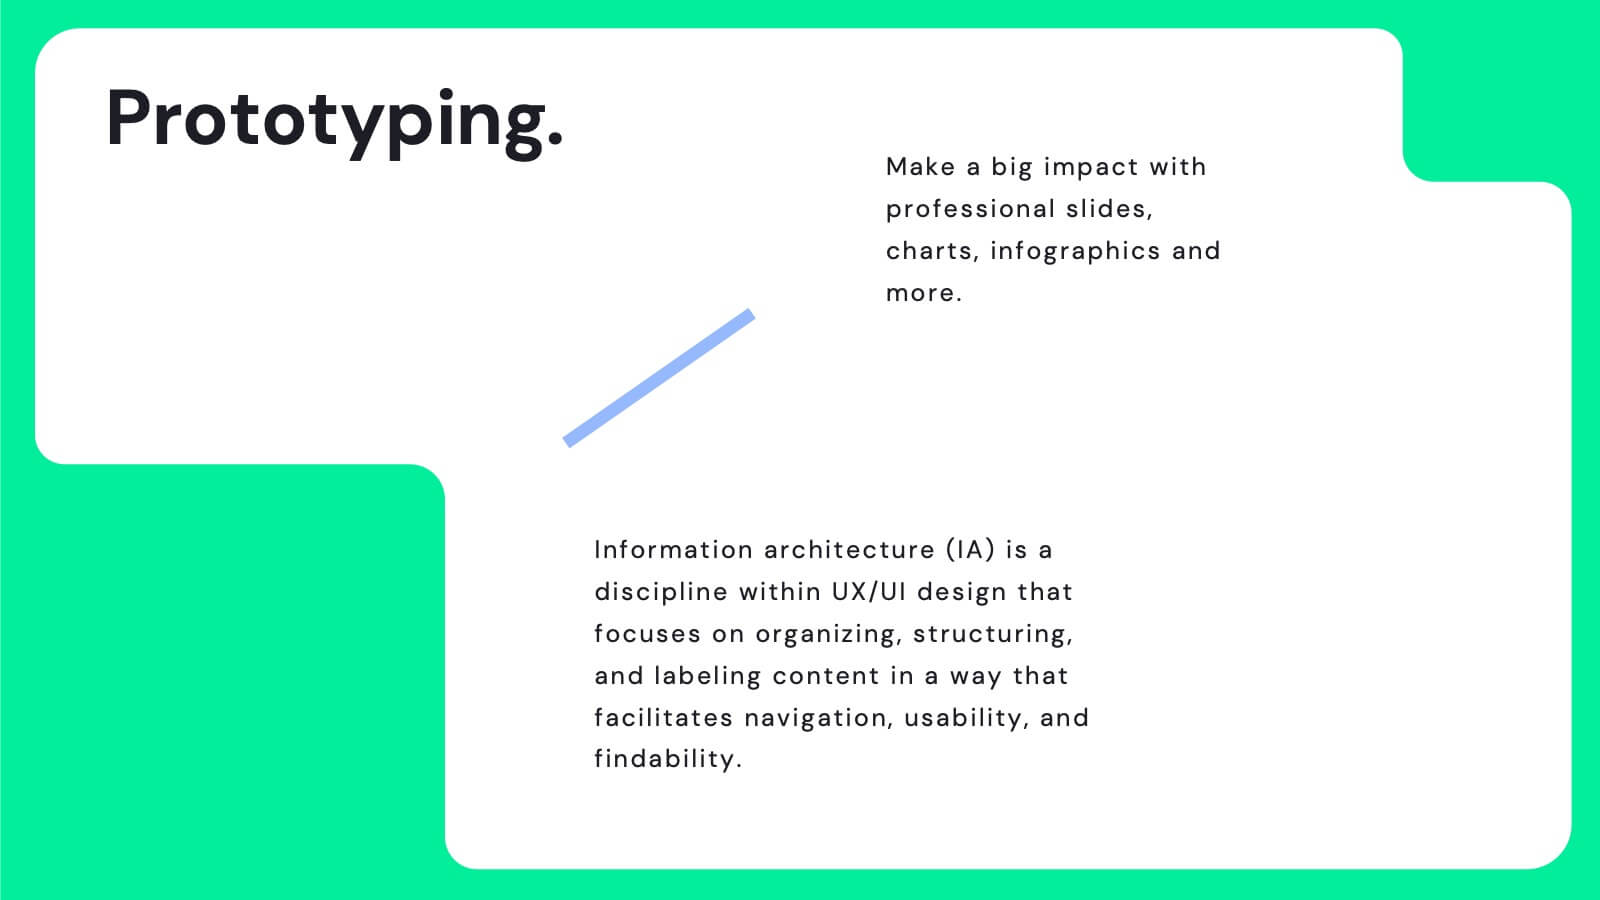
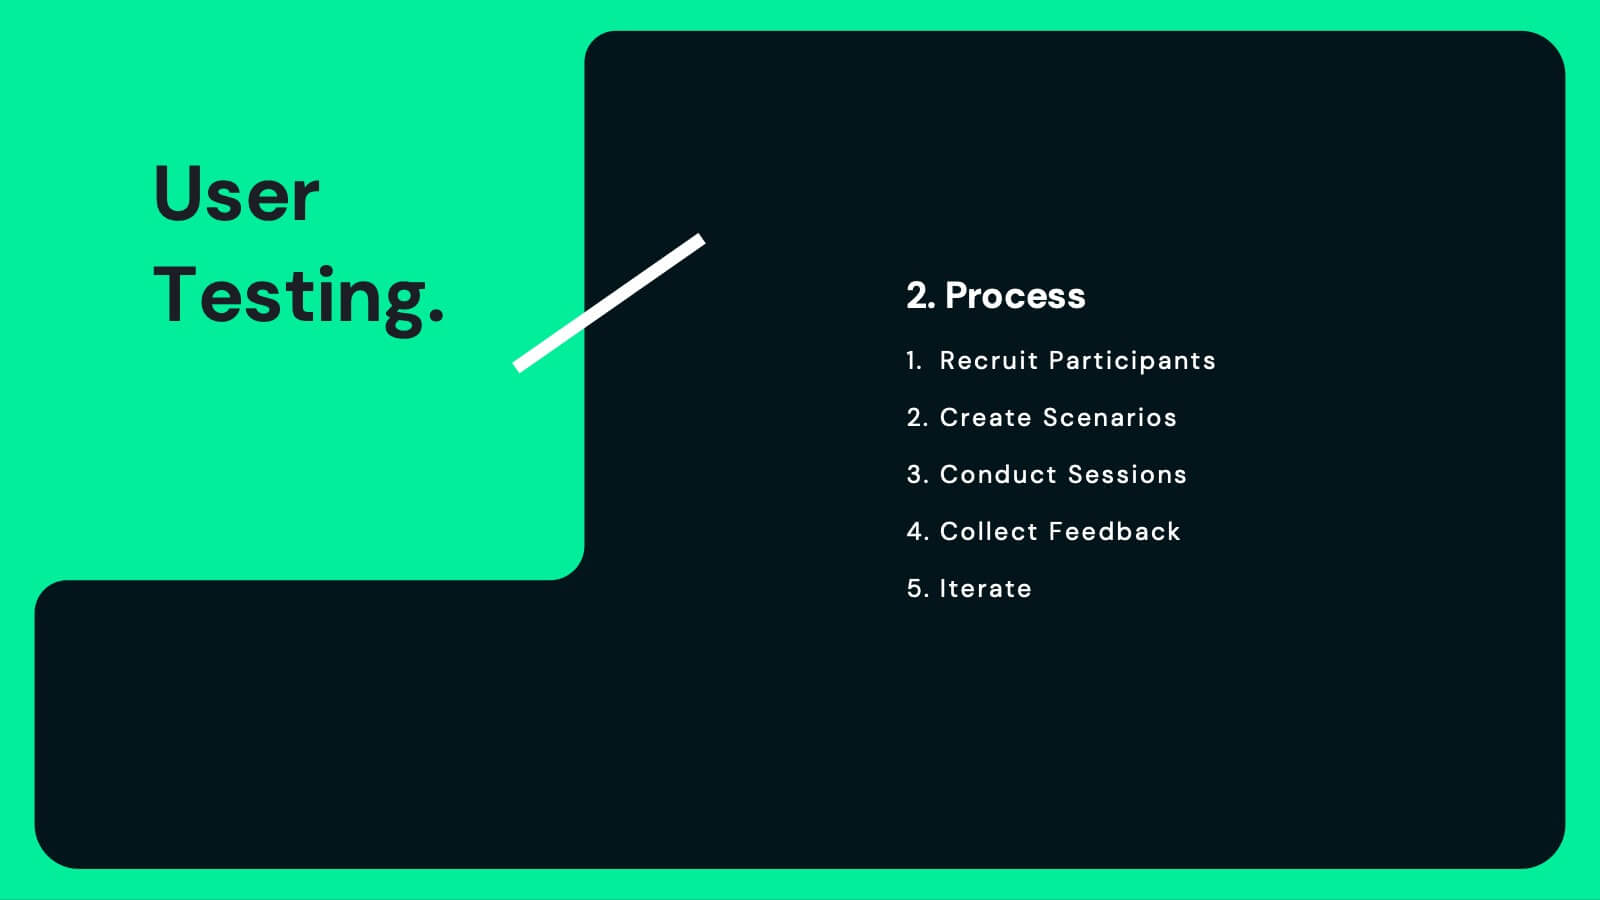
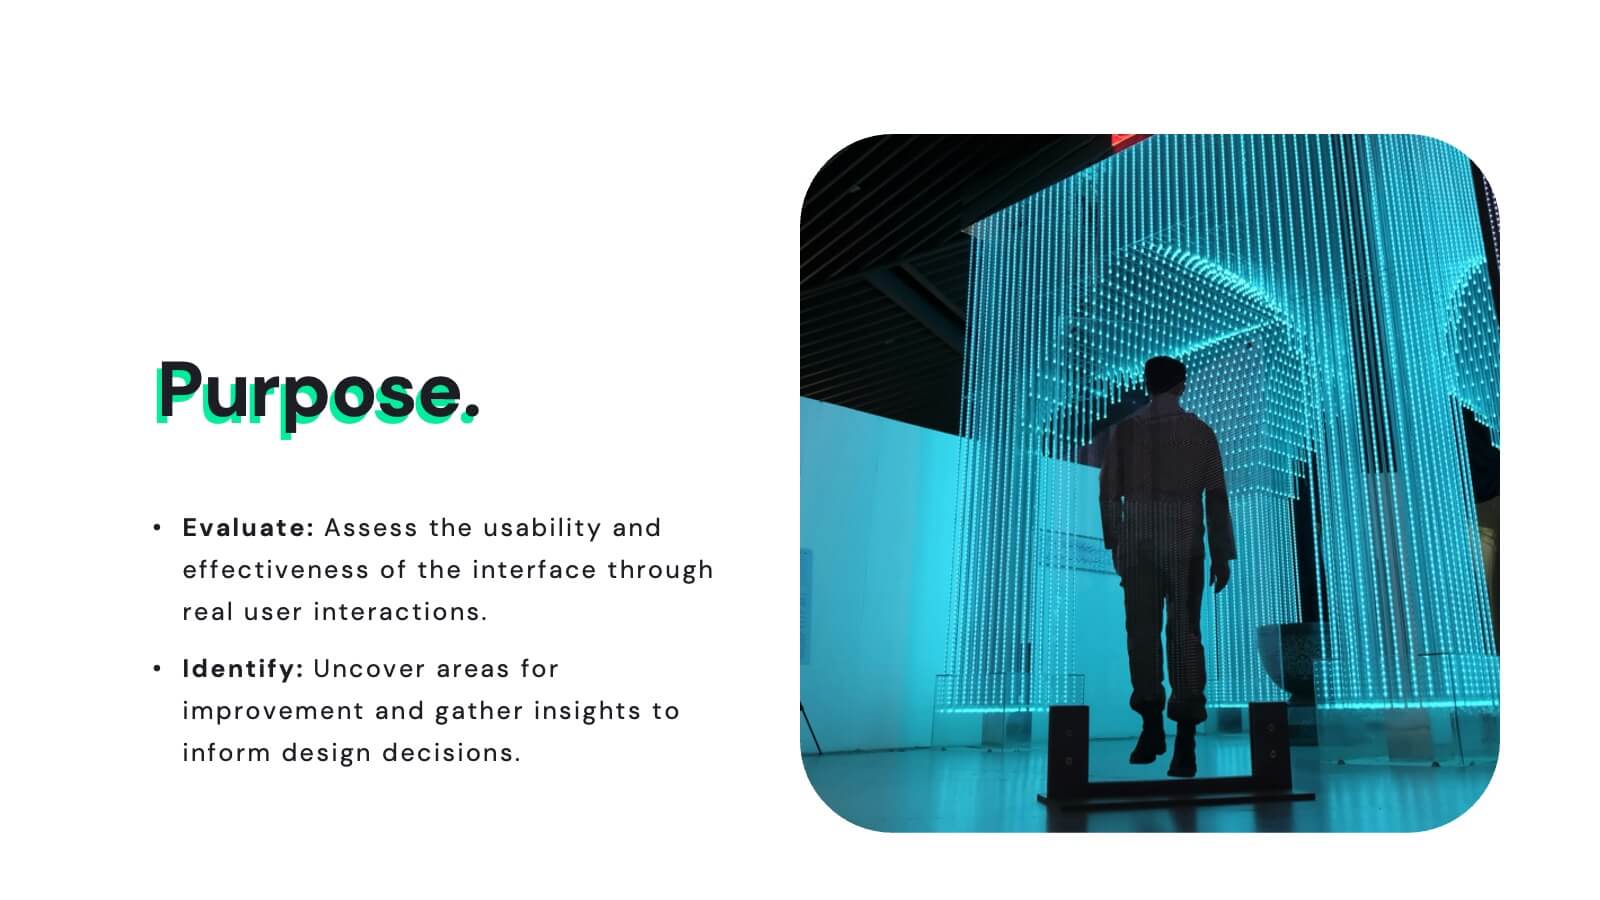
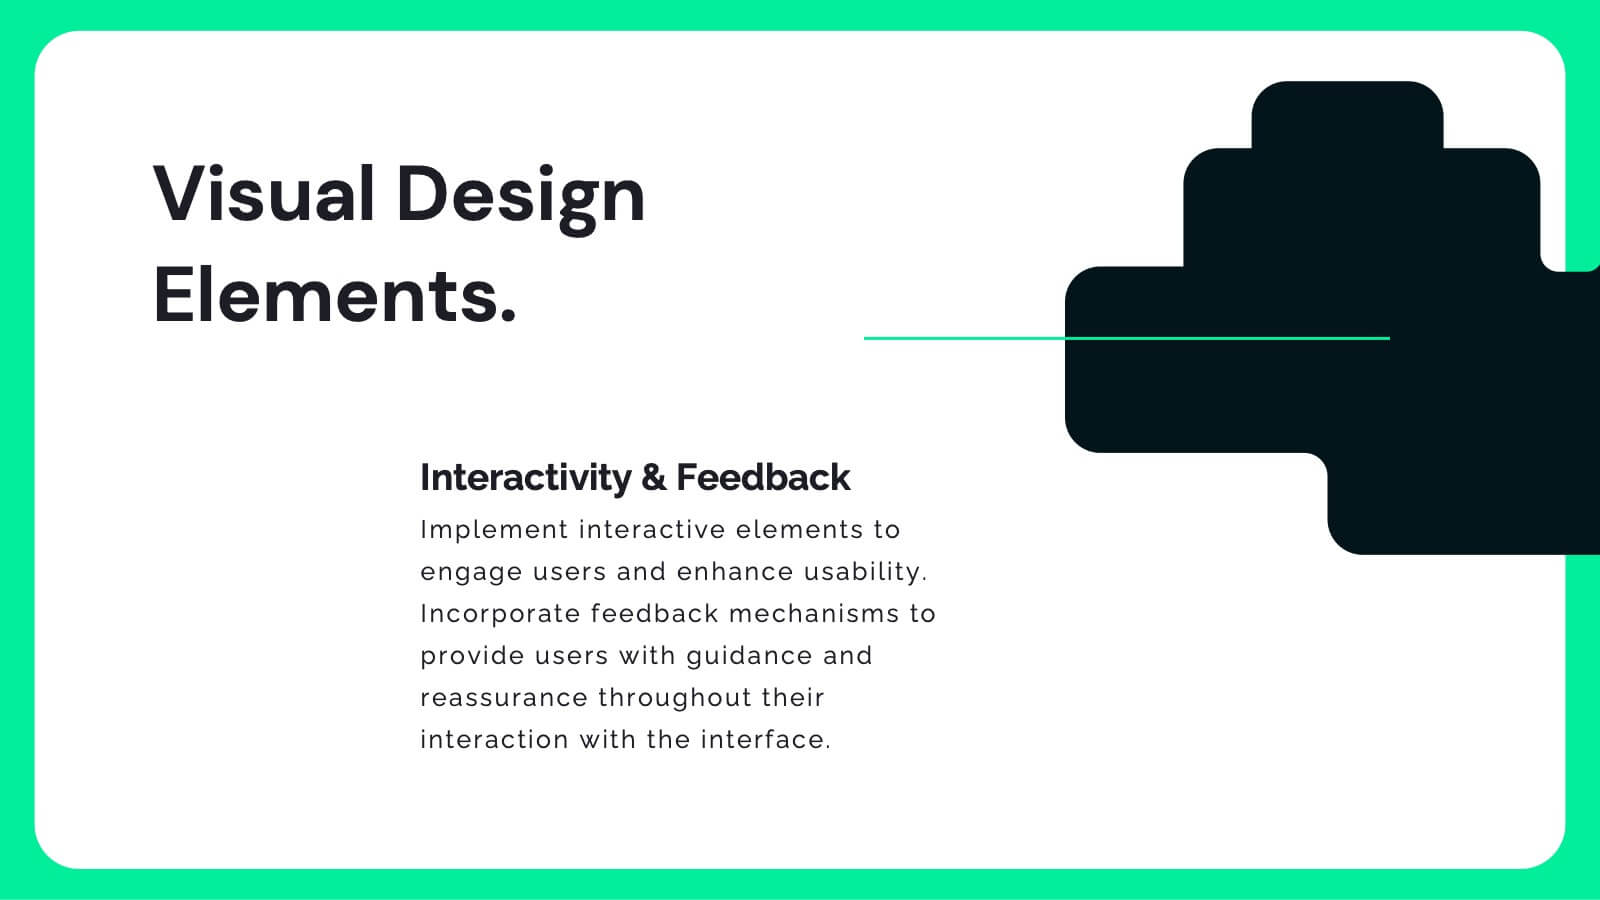
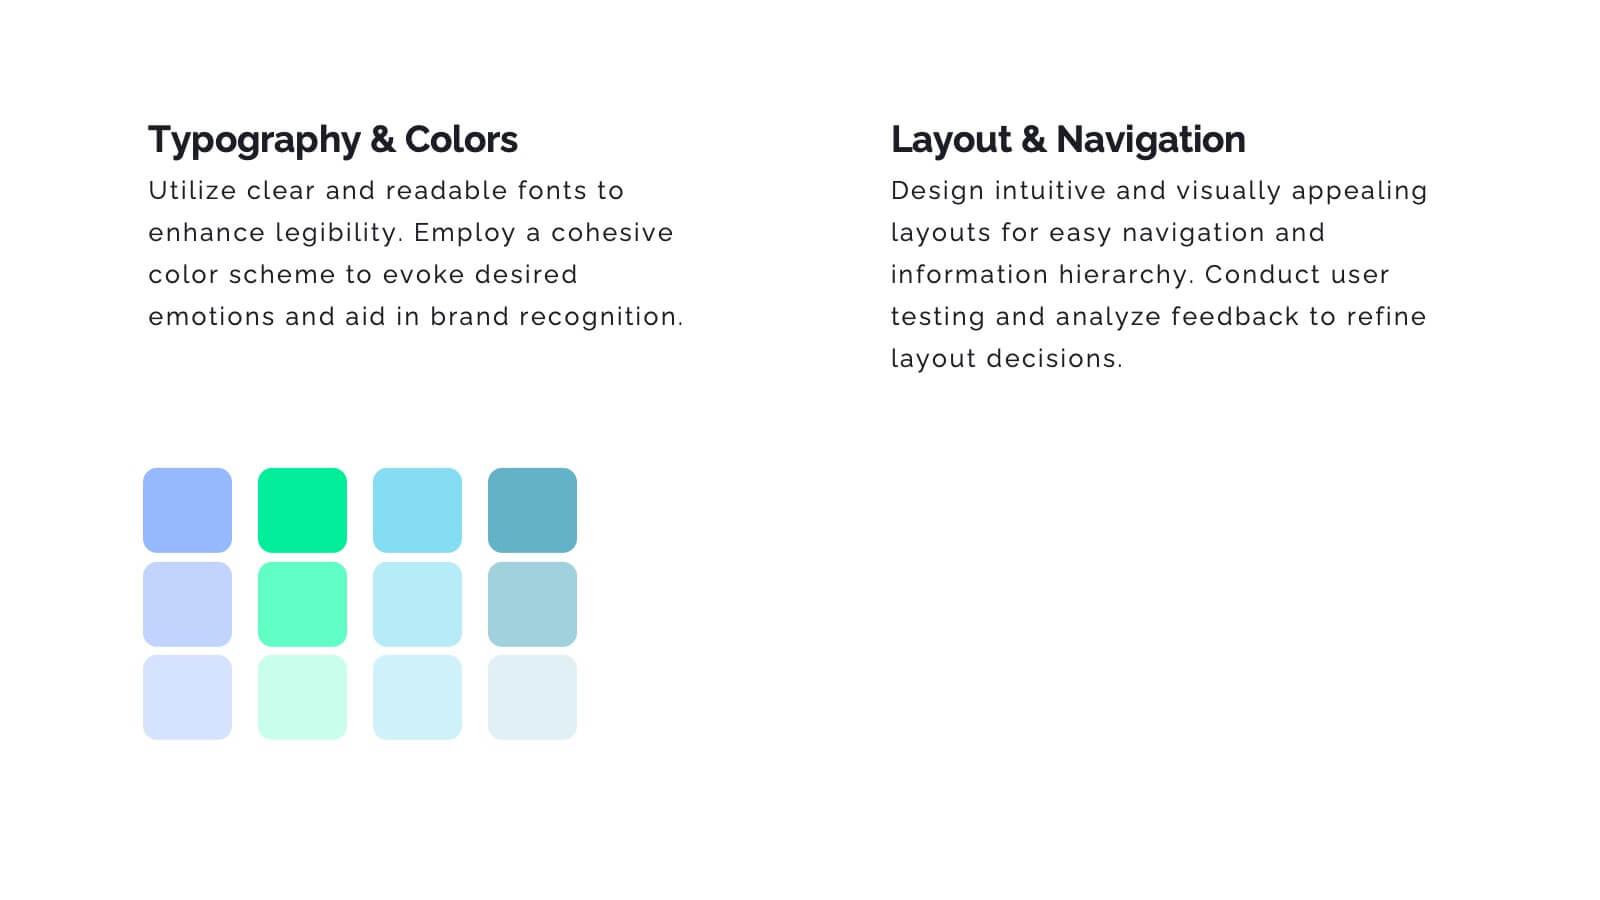
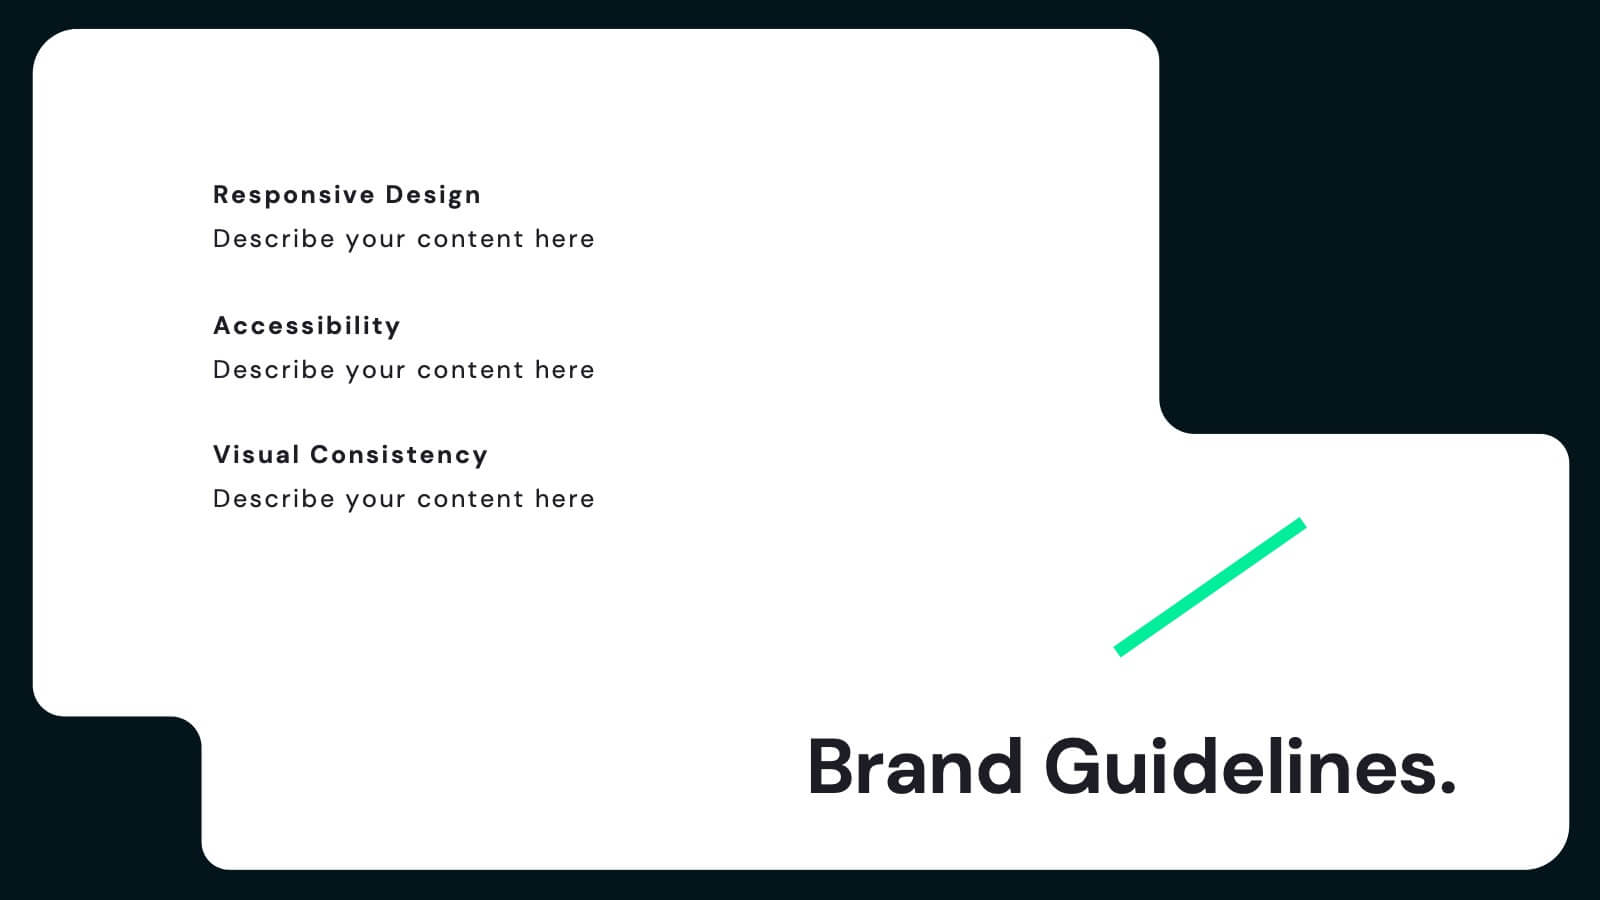
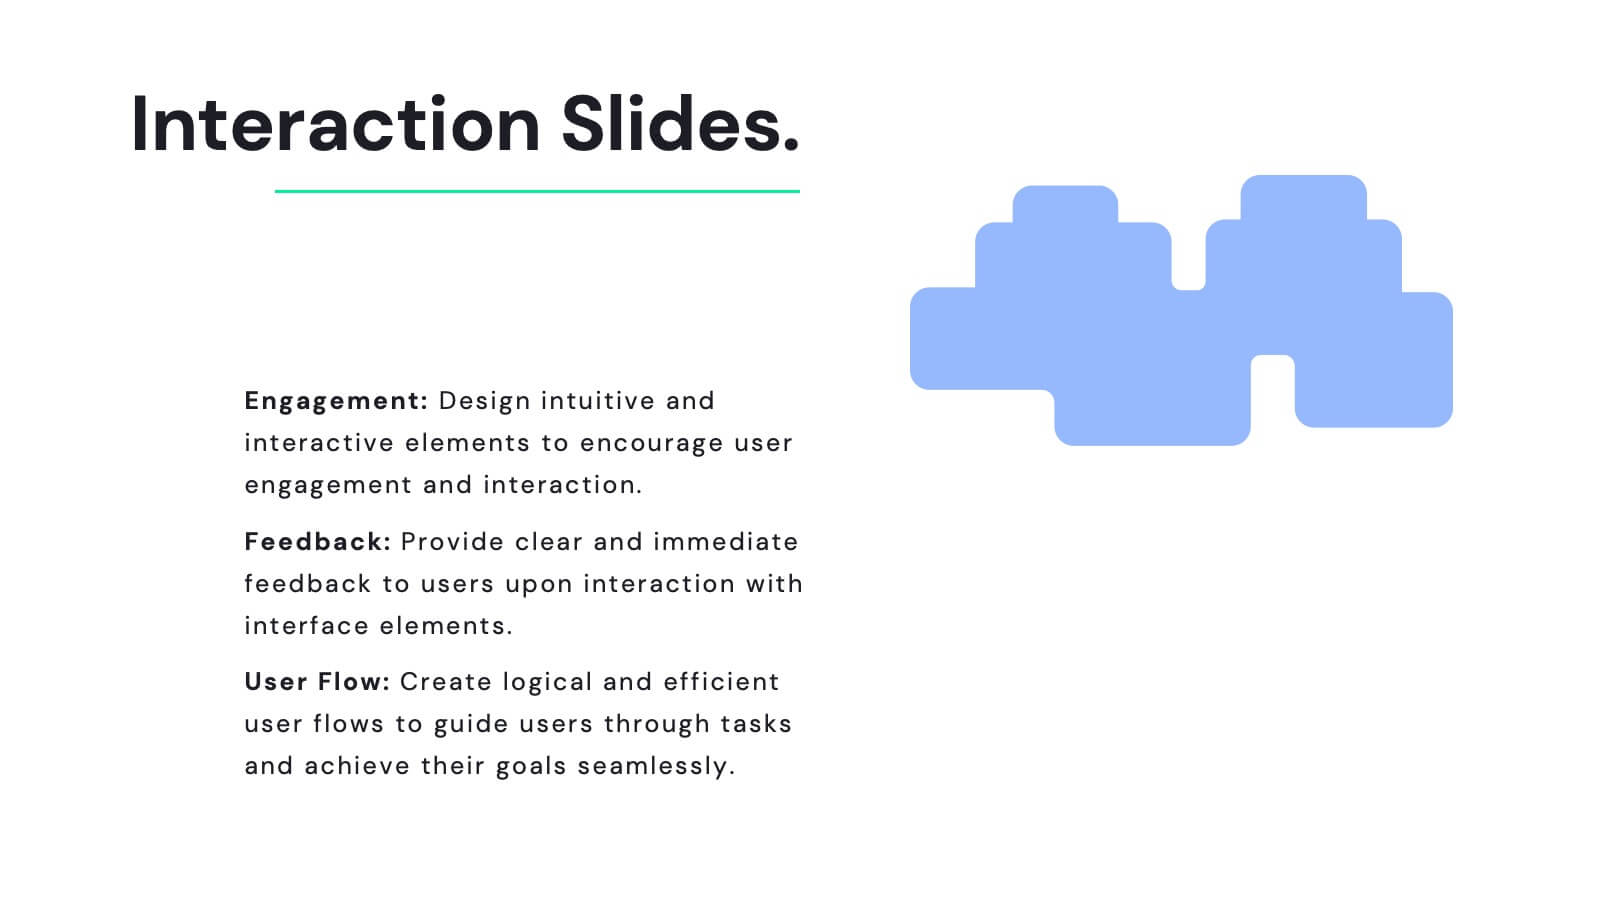
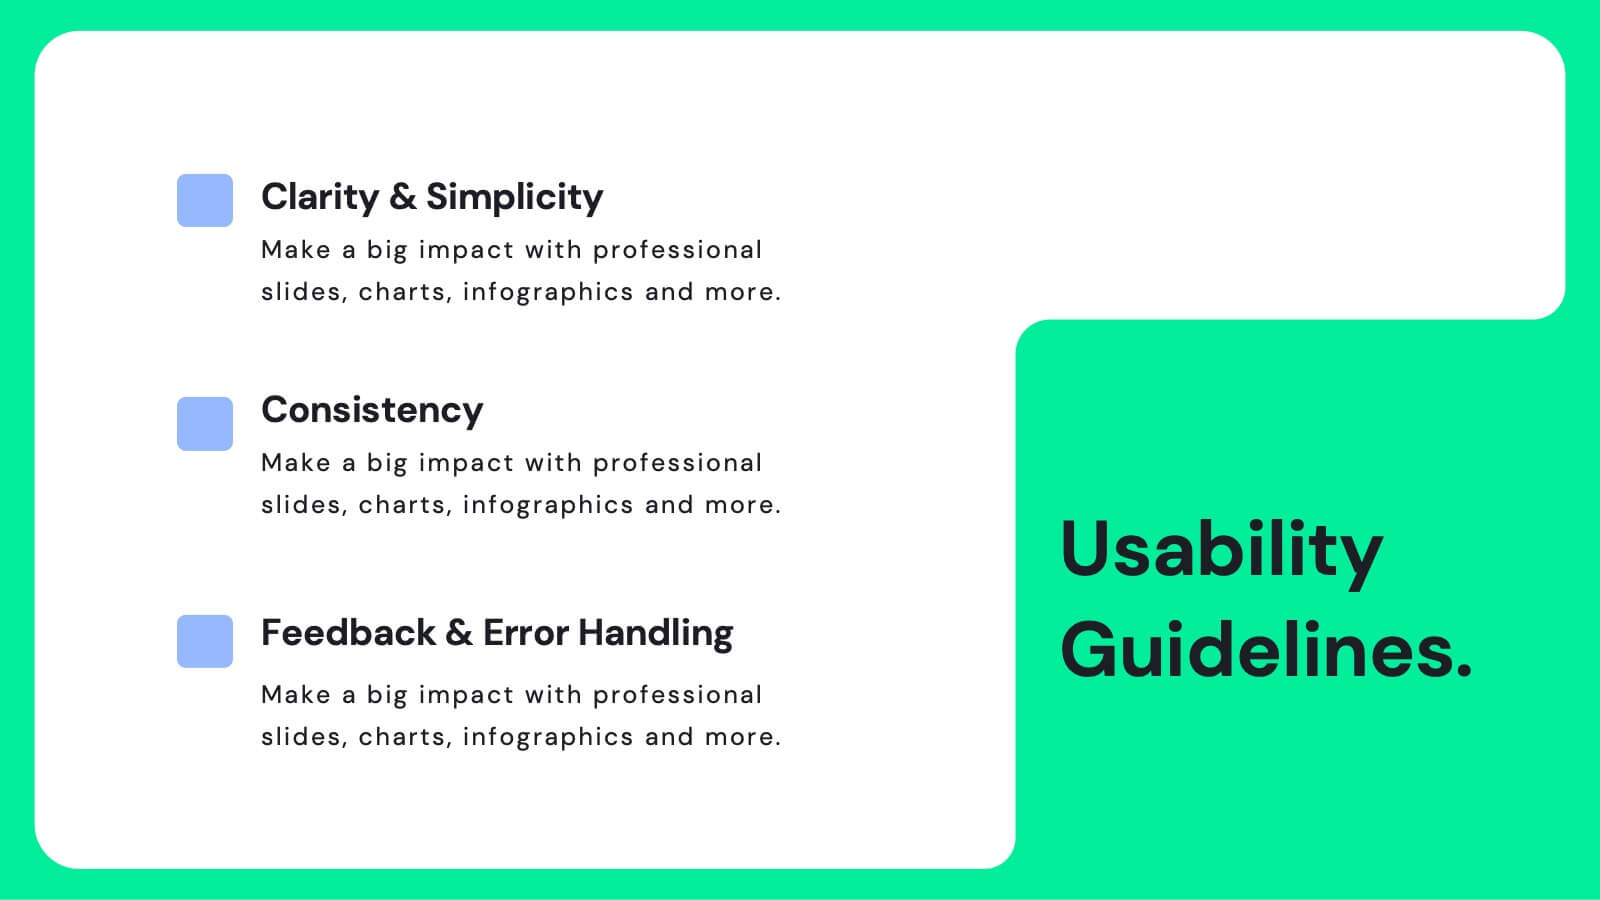
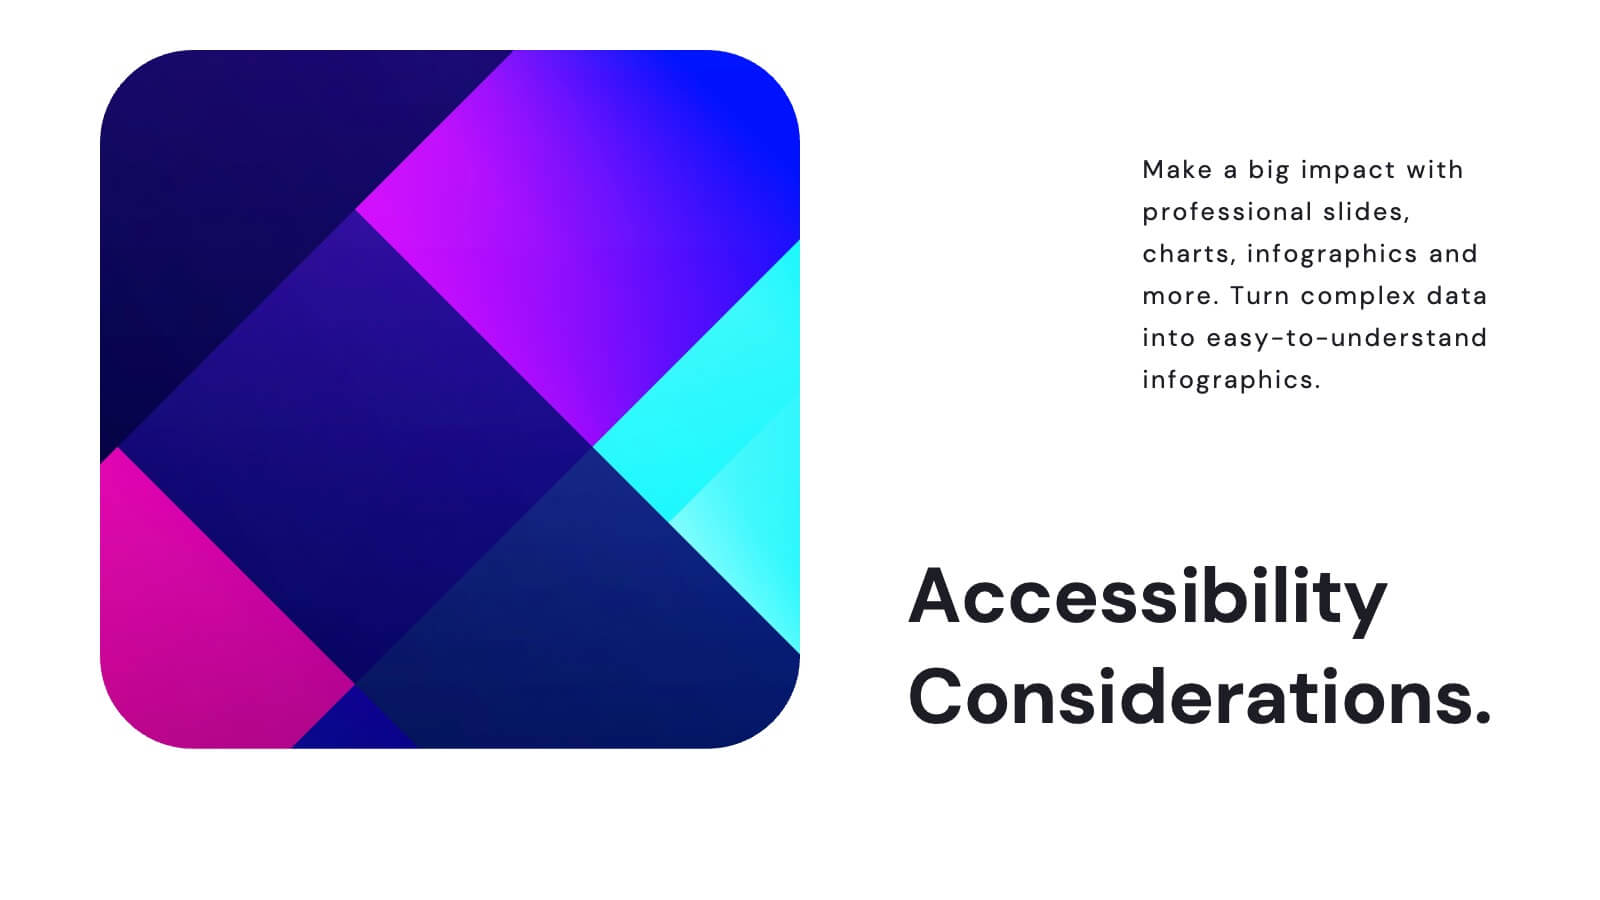
Juno UX Case Study Presentation
Enhance your UX presentations with this sleek, user-friendly template designed for showcasing detailed case studies and user research. With a modern layout and clear sections for user journey mapping, prototyping, and usability guidelines, this template ensures a professional and engaging presentation. Compatible with PowerPoint, Keynote, and Google Slides, it's perfect for any platform.


7 diapositivas
RACI Matrix Process Infographic Presentation
A RACI matrix is a project management tool that is used to clarify and define roles and responsibilities for project tasks and deliverables. Use this template to help you quickly create RACI charts for your next project. Made up of strategic box with shapes, colors, numeric value and text boxes that can be edited easily. This Template is a multipurpose slide as it can be used to present data visually, build a discussion on the topic and influence your audience to take action. Save time and energy with this infographic template, compatible with Powerpoint, Keynote and Google Slides.


4 diapositivas
Project Task Ownership with RACI Chart Presentation
Assign roles clearly with the Project Task Ownership with RACI Chart Presentation. This template simplifies responsibility mapping across tasks using the RACI framework (Responsible, Accountable, Consulted, Informed). With a clean matrix layout, it's perfect for project planning, stakeholder alignment, and workflow transparency. Fully editable in PowerPoint, Canva, and Google Slides.


26 diapositivas
Treye Presentation Template
Are you looking for your next template? Treye is a fun professional presentation that includes a lot of patterns and fun shapes. This template is perfect for marketing, social media managers and content creators. It has charts, profit slides and venn diagrams, thus providing you with all the slides needed for an awesome presentation. This templates features a high-impact color scheme that will grab the attention of your audience. Its simple yet fun design makes this template stand out and at the same time keep your audience engaged. Get started creating your next report today with Treye!


5 diapositivas
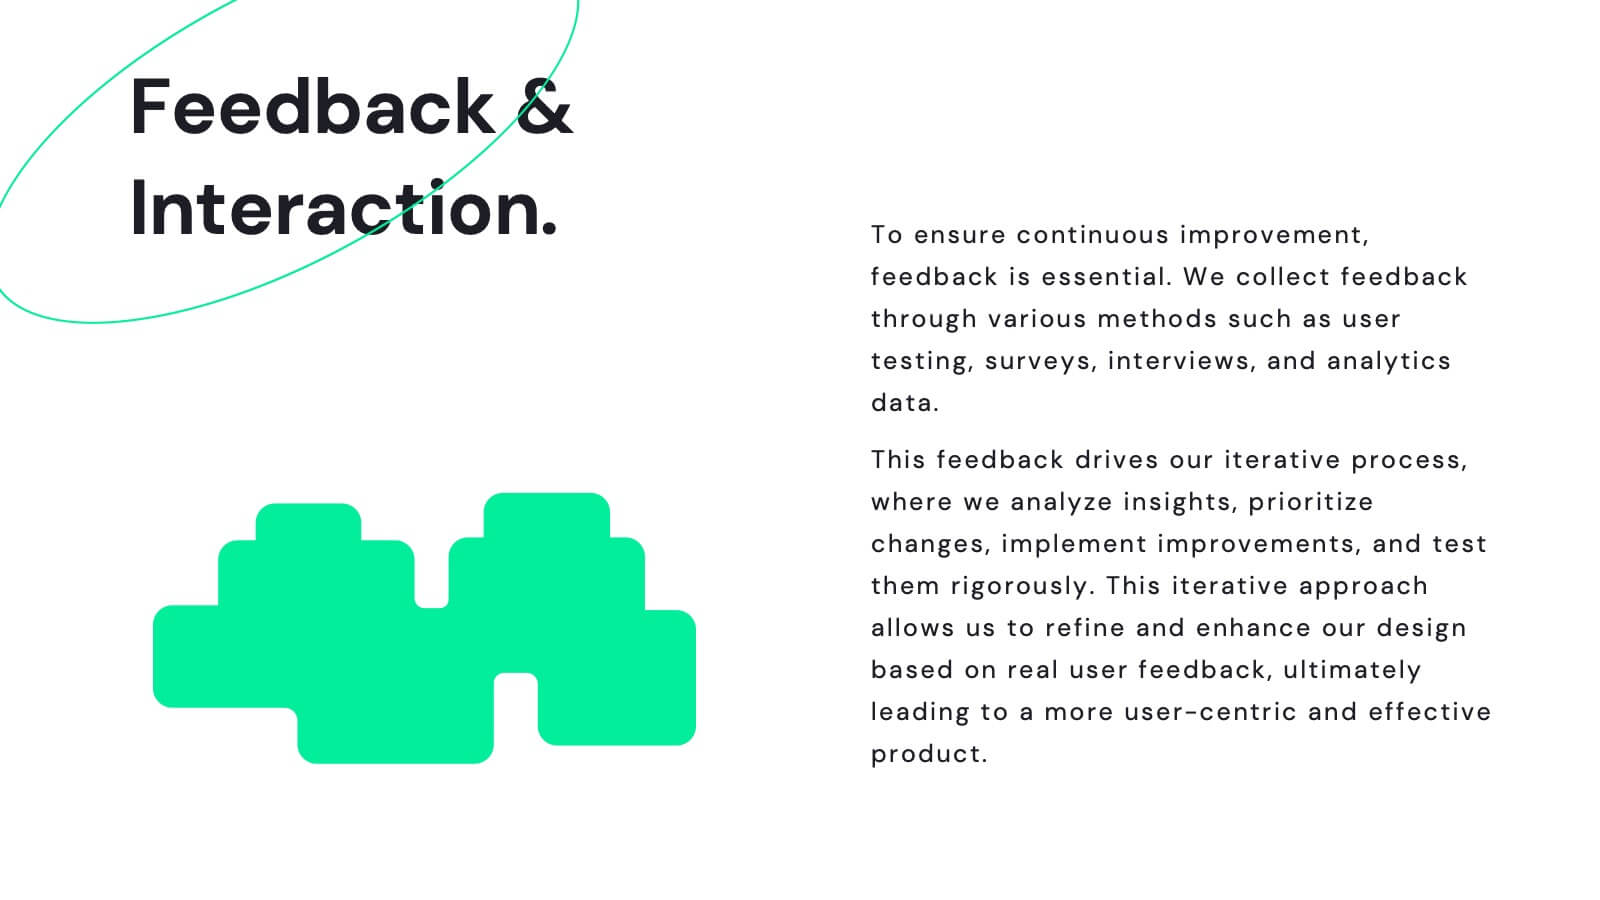
Feedback Collection Strategy Presentation
Engage your audience with a dynamic visual that simplifies how feedback is gathered and turned into meaningful action. This presentation helps illustrate communication loops, data flow, and process improvements with clarity and style. Fully editable and compatible with PowerPoint, Keynote, and Google Slides for seamless customization and professional delivery.


23 diapositivas
Sunstone Investor Pitch Presentation
Captivate investors with this professionally crafted pitch deck, showcasing sections for company overview, problem and solution, market opportunity, revenue model, competitive landscape, and growth projections. Present your team, financials, milestones, and funding requirements effectively. Ideal for securing investment and support. Fully customizable for PowerPoint, Keynote, and Google Slides.


5 diapositivas
Body System Overview Presentation
Visually explain key human body systems with this clean and modern slide. Each section highlights a different organ with labeled points (A–D) for easy reference. Ideal for health education, medical briefings, or anatomy lessons. Fully editable in PowerPoint, Keynote, or Google Slides to suit any professional or academic need.


7 diapositivas
Agile Project Management Approach Presentation
Illustrate iterative planning and delivery cycles with this Agile Project Management Approach Presentation. The dynamic circular graphic paired with a horizontal flow arrow highlights six core steps in agile workflows. Ideal for scrum teams, product owners, or project leads, each phase is clearly labeled with editable titles and content placeholders. Fully customizable and compatible with PowerPoint, Keynote, and Google Slides.


5 diapositivas
Performance Metrics Dashboard Presentation
Turn complex data into clear, engaging visuals with a clean, modern dashboard layout that highlights performance results at a glance. Perfect for tracking KPIs, progress, and team outcomes, this template brings structure and clarity to reports. Easily editable in PowerPoint, Keynote, and Google Slides for professional presentations.


4 diapositivas
Revenue and Expense Forecasting Overview Presentation
Easily illustrate financial trade-offs with the Revenue and Expense Forecasting Overview Presentation. This clean, visual slide design features a seesaw-style balance graphic to help communicate proportional budgeting between revenue, balance, and expenses. Ideal for finance updates, annual reports, and planning meetings. Fully editable in PowerPoint, Google Slides, Keynote, and Canva.


7 diapositivas
Asia Map Economy Infographic
Delve into the economic landscape of Asia with our series of infographic slides designed to outline key economic indicators across the continent. These templates provide a comprehensive visual representation of various economic data, including GDP growth, trade volumes, and sector-specific performance, making them invaluable for analysts, educators, and business professionals. Each infographic features a detailed map of Asia, annotated with data points and statistics that highlight economic trends and disparities between nations. The use of contrasting colors and clear, legible fonts ensures that the information is accessible and engaging. Graphs and charts are integrated within the map, offering a dynamic overview of the economic health of the region. These templates are fully customizable, allowing you to tailor the content to specific presentations or reports. Whether used in academic environments, corporate settings, or public presentations, these slides help to communicate complex economic concepts in a visually appealing and straightforward manner.


5 diapositivas
Healthcare Facts Infographics
Healthcare facts help promote health literacy, empower individuals to make informed decisions, and contribute to improved healthcare outcomes for individuals and communities. These infographic templates are designed to present key healthcare facts and statistics in a clear and concise manner. These are perfect for creating educational materials, presenting research findings, or raising awareness about healthcare issues, this template will help you effectively communicate important information. Compatible with Powerpoint, Keynote, and Google Slides you can ensures that your healthcare infographics are visually compelling and impactful.


4 diapositivas
Company Long-Term Vision Presentation
Craft your company's roadmap with our "Company Long-Term Vision" presentation template. This design lets you vividly showcase your strategic direction and future goals through a modern, image-centric layout. Ideal for board meetings and stakeholder briefings, it supports PowerPoint, Keynote, and Google Slides, ensuring you can reach your audience on any platform. Utilize this template to clearly communicate your vision and drive your organization forward.


7 diapositivas
Demographic Segmentation Infographic Presentation
A Demographic Infographic is designed to provide a quick and easy-to-understand snapshot of the key demographic trends and insights. This Template is easy to edit and intuitive, so you can create a stunning presentation in minutes. With this template, you can focus on your content and the design. It's a multipurpose template which means it can be used for different topics: business, education, marketing, and more. You can use this as a template to explain concepts related to your studies, statistics or market research. This template is compatible with Powerpoint, Keynote and Google Slides.


10 diapositivas
Work-Life Balance and Time Planning Presentation
Showcase strategies for harmony and productivity with this scale-themed presentation template. Designed to highlight balance, prioritization, and goal-setting, this visual layout divides your content into four clear parts—perfect for wellness initiatives, HR planning, or personal productivity talks. Fully editable in PowerPoint, Keynote, and Google Slides.


3 diapositivas
Remote Work Culture and Guidelines Presentation
Bring remote teamwork to life with visuals that speak your culture. This presentation template simplifies how you communicate expectations, structure, and values for virtual teams. Perfect for onboarding, policy updates, or outlining collaboration tools, it’s designed to keep your message clear and consistent. Fully compatible with PowerPoint, Keynote, and Google Slides.


5 diapositivas
Strategic Vision for Long-Term Growth
Turn big goals into clear milestones with this upward path-style layout—perfect for illustrating your company’s strategic vision and long-term growth plan. Use each step to highlight priorities, phases, or guiding principles along the journey. Fully compatible with PowerPoint, Keynote, and Google Slides.