


Características


¿Tienes alguna pregunta?
Recomendar


4 diapositivas
Daily Plan and Talking Points Agenda Presentation
Stay aligned and focused with this Daily Plan and Talking Points Agenda presentation. Perfect for team standups or morning meetings, this layout organizes discussion into three clear sections: Yesterday, Today, and Blockers. Fully editable in Canva, PowerPoint, and Google Slides—customize effortlessly to keep your team in sync


6 diapositivas
End-to-End Value Chain Process Presentation
Visualize every link in your process with the End-to-End Value Chain Process Presentation. This modern chain diagram helps illustrate each stage of your business or production flow—from initial input to final output. It's ideal for strategy, supply chain, and operational planning. Fully editable in PowerPoint, Keynote, Canva, or Google Slides.


10 diapositivas
Farming Technologies and Crop Management
Present cutting-edge insights with the Farming Technologies and Crop Management Presentation. This visually compelling slide uses wind turbine illustrations to symbolize innovation in agriculture. Ideal for showcasing smart farming tools, sustainable practices, and crop optimization strategies. Fully editable and compatible with PowerPoint, Keynote, and Google Slides.


6 diapositivas
STEM Education and Discovery Presentation
Showcase your STEM insights with this vibrant puzzle-piece infographic. Each piece highlights a key point in science, technology, engineering, or math—perfect for lesson plans, research summaries, or discovery processes. Fully customizable in PowerPoint, Keynote, and Google Slides, making it ideal for educators, researchers, or curriculum developers.


6 diapositivas
IT Operations Workflow Presentation
Visualize your IT processes with a sleek, structured flow that highlights every operational step from start to finish. Ideal for presenting systems management, network operations, or support frameworks, this presentation brings clarity to technical workflows. Fully compatible with PowerPoint, Keynote, and Google Slides for easy customization and seamless presentation delivery.


7 diapositivas
Target Market Segmentation Infographic Presentation
A Target Market refers to a specific group of customers or consumers that a company or organization aims to sell its products or services too. This template has a design that can compliment your company's or organization's branding elements to make it a professional looking presentation. This template is perfect for the audience with in-depth knowledge of marketing; the template allows you to include important facts and statistics that will make it easily understandable by all types of audiences. The template comes with different chart slides, nice color combinations and graphs!
8 diapositivas
3-Step Arrow Diagram Presentation
Streamline your presentations with the 3-Step Arrow Diagram Presentation. Designed for process flows, strategic planning, and step-by-step guides, this visually engaging template simplifies complex ideas into clear, structured steps. Customize colors, text, and icons effortlessly to match your brand. Fully compatible with PowerPoint, Keynote, and Google Slides for seamless editing and professional results.


5 diapositivas
Strategic Objectives and Goals Presentation
Bring your strategy to life with a clear, forward-moving layout that makes every milestone feel achievable. This presentation guides audiences through key objectives, breakthrough goals, and measurable progress, helping teams stay aligned and inspired. Fully editable and easy to adapt, it works seamlessly with PowerPoint, Keynote, and Google Slides.


7 diapositivas
SEO Strategy and Keyword Plan Presentation
Spark your marketing roadmap with a bold, idea-driven layout that makes every action step clear and memorable. This presentation helps you outline search goals, explore keyword opportunities, and map out strategic priorities in a simple, visual flow. Fully compatible with PowerPoint, Keynote, and Google Slides.


25 diapositivas
Keystone Market Research Presentation
Present your market research with confidence using this stylish, contemporary template. Perfect for detailing research objectives, data collection, and key findings, it features a sleek design with vibrant colors. Highlight critical aspects like market trends, results interpretation, and recommendations to captivate your audience. Compatible with PowerPoint, Keynote, and Google Slides, it ensures seamless presentations on any platform.


6 diapositivas
Biology Tree Diagram Infographic
Tree diagrams in biology are graphical representations that show the hierarchical relationships and evolutionary history of different organisms, species, or biological traits. This infographic template is designed to simplify complex biological information and show the interconnectedness between different biological topics or classifications. This infographic is a visual representation of various biological concepts and relationships in a hierarchical tree structure. This template color codes the different branches to distinguishing between the different categories and make the infographic easier to navigate.


7 diapositivas
Company Insurance Infographic Presentation
An Insurance Infographic is a visual representation of data related to the insurance industry. You can educate consumers on insurance policies, coverage options, and industry trends. This template includes a combination of data, statistics, and graphics that help explain key concepts related to insurance. You can use this infographic to include information on different types of insurance policies, claims, premiums, and industry-specific trends. Designed in Powerpoint, Keynote, and Google Slides this is a powerful tool for communicating complex insurance concepts in a simple and engaging way.


5 diapositivas
Optimized Process Flow Diagram Presentation
Streamline workflows with the Optimized Process Flow Diagram. This professional template visualizes key business processes for efficient decision-making and execution. Designed for project managers, analysts, and strategists, it ensures a clear, structured overview of sequential steps. Fully editable and compatible with PowerPoint, Keynote, and Google Slides.


5 diapositivas
Product Launch Pitch Deck Presentation
Launch your product with impact using this Product Launch Pitch Deck template. Designed to outline key strategies, market positioning, and product benefits, this template helps you deliver a compelling presentation. Engage stakeholders with clear, structured visuals. Fully compatible with PowerPoint, Keynote, and Google Slides for seamless customization.


10 diapositivas
Corporate Skills Training Program
Empower your team with a well-rounded visual guide to skill development using this sleek circular training program slide. Each segment highlights core corporate training areas—compliance, leadership, product knowledge, and employee growth—making it easy to communicate learning pathways. Fully editable and compatible with PowerPoint, Keynote, and Google Slides for seamless use.


2 diapositivas
Professional Thank You Slide Presentation
End your presentation with a clean, modern slide that leaves a polished final impression. This layout gives you space to share closing notes, contact details, or key reminders in a clear and visually balanced style. Fully editable and compatible with PowerPoint, Keynote, and Google Slides.


20 diapositivas
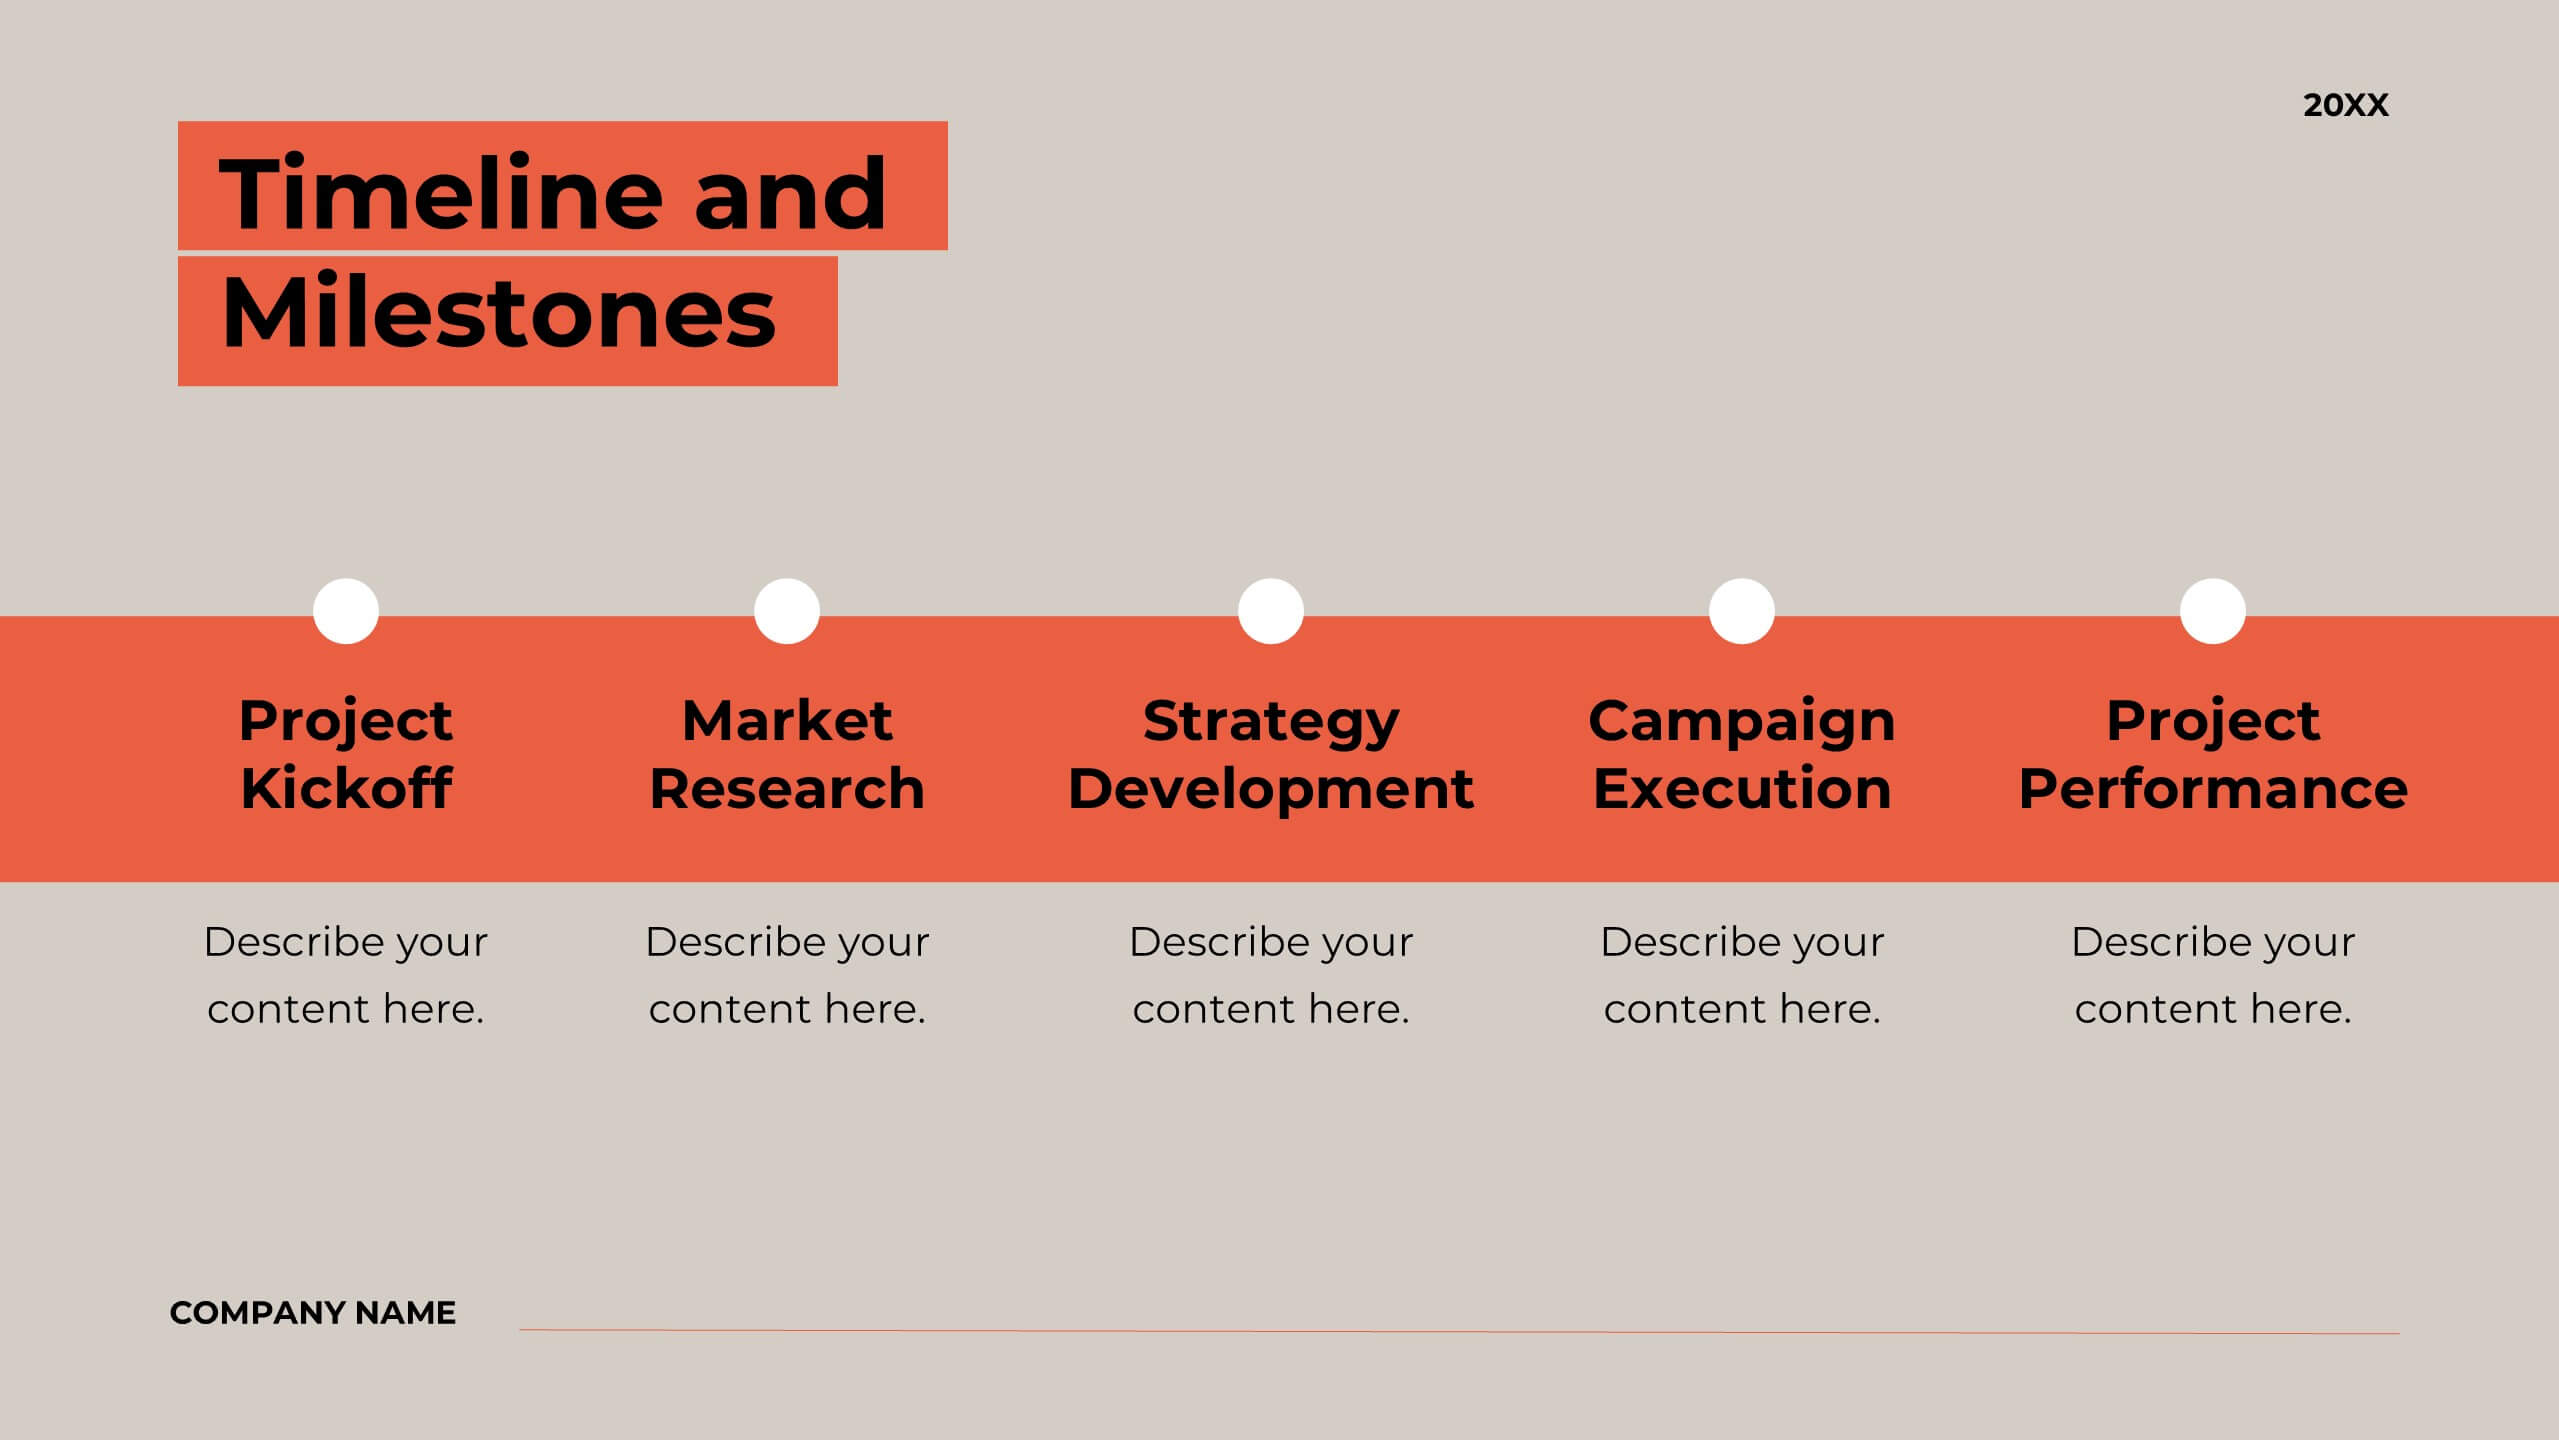
Bentom Marketing Proposal Presentation
This marketing proposal template is crafted to communicate your strategy with impact. With sections covering company overview, project summary, objectives, methodology, budget breakdown, and deliverables, it provides a professional layout for presenting key details to clients. Tailor it to fit your needs, and present confidently using PowerPoint, Keynote, or Google Slides.