


Características


¿Tienes alguna pregunta?
Recomendar


12 diapositivas
Employee Roles and Professional Profiles
Break down team structure and highlight individual strengths with this modern hub-and-spoke layout—perfect for showcasing employee roles, departments, or professional profiles. Whether you're onboarding, presenting org charts, or outlining responsibilities, this slide keeps it all clear and cohesive. Fully compatible with PowerPoint, Keynote, and Google Slides.


20 diapositivas
Galaxion Marketing Proposal Presentation
This Marketing Proposal Presentation template offers a comprehensive structure to showcase your strategies, goals, and financial plans effectively. Covering key sections such as objectives, budget breakdown, and timeline, it's perfect for making a strong impression. Fully customizable and compatible with PowerPoint, Keynote, and Google Slides for seamless adaptation to your needs.


5 diapositivas
North America Business Landscape Map Presentation
Explore the business terrain with the "North America Business Landscape Map" template, which delivers a comprehensive visualization of business data across various regions. Designed for strategic presentations, it enables clear communication of market insights and data points, crucial for decision-making. This template is compatible with PowerPoint, Keynote, and Google Slides, enhancing its utility for professionals in diverse fields.


6 diapositivas
Sales Performance Slide Presentation
Get ready to showcase your results with a slide that makes progress feel genuinely exciting. This presentation highlights key sales metrics, performance stages, and growth insights in a clean, visual format that’s easy to follow and great for reports or team updates. Fully compatible with PowerPoint, Keynote, and Google Slides.


7 diapositivas
Thank You Infographic
Express your gratitude in style with this beautifully designed template, perfect for adding a touch of elegance and personalization to your messages of appreciation. Featuring a range of versatile layouts—from minimalist designs to vibrant color schemes and eye-catching typography—each slide offers a unique way to say thank you, whether it’s to clients, team members, or partners. Customize the visuals to align with your brand or personal style by integrating your own photos, logos, and text, making each expression of gratitude uniquely yours. Ideal for corporate settings, personal use, or charitable events, this template helps you create memorable, heartfelt thanks that resonate deeply with recipients, and is perfect for use in presentations, emails, or as special tokens of appreciation to leave a lasting impression.


21 diapositivas
Thunderbird Small Business Pitch Deck Presentation
Take flight with this dynamic Thunderbird-inspired presentation, perfect for pitching your small business! Designed to highlight your business model, market potential, and financial projections, this template ensures your pitch is clear, compelling, and professional. Its bold visuals will help you soar. Compatible with PowerPoint, Keynote, and Google Slides.


6 diapositivas
Business Roadmap Strategy Presentation
Map your path to success with this Business Roadmap Strategy template. Designed for clarity and impact, it helps you outline goals, milestones, and timelines in a visual journey. Ideal for team planning, strategy meetings, and pitches. Compatible with PowerPoint, Keynote, and Google Slides for seamless editing.
22 diapositivas
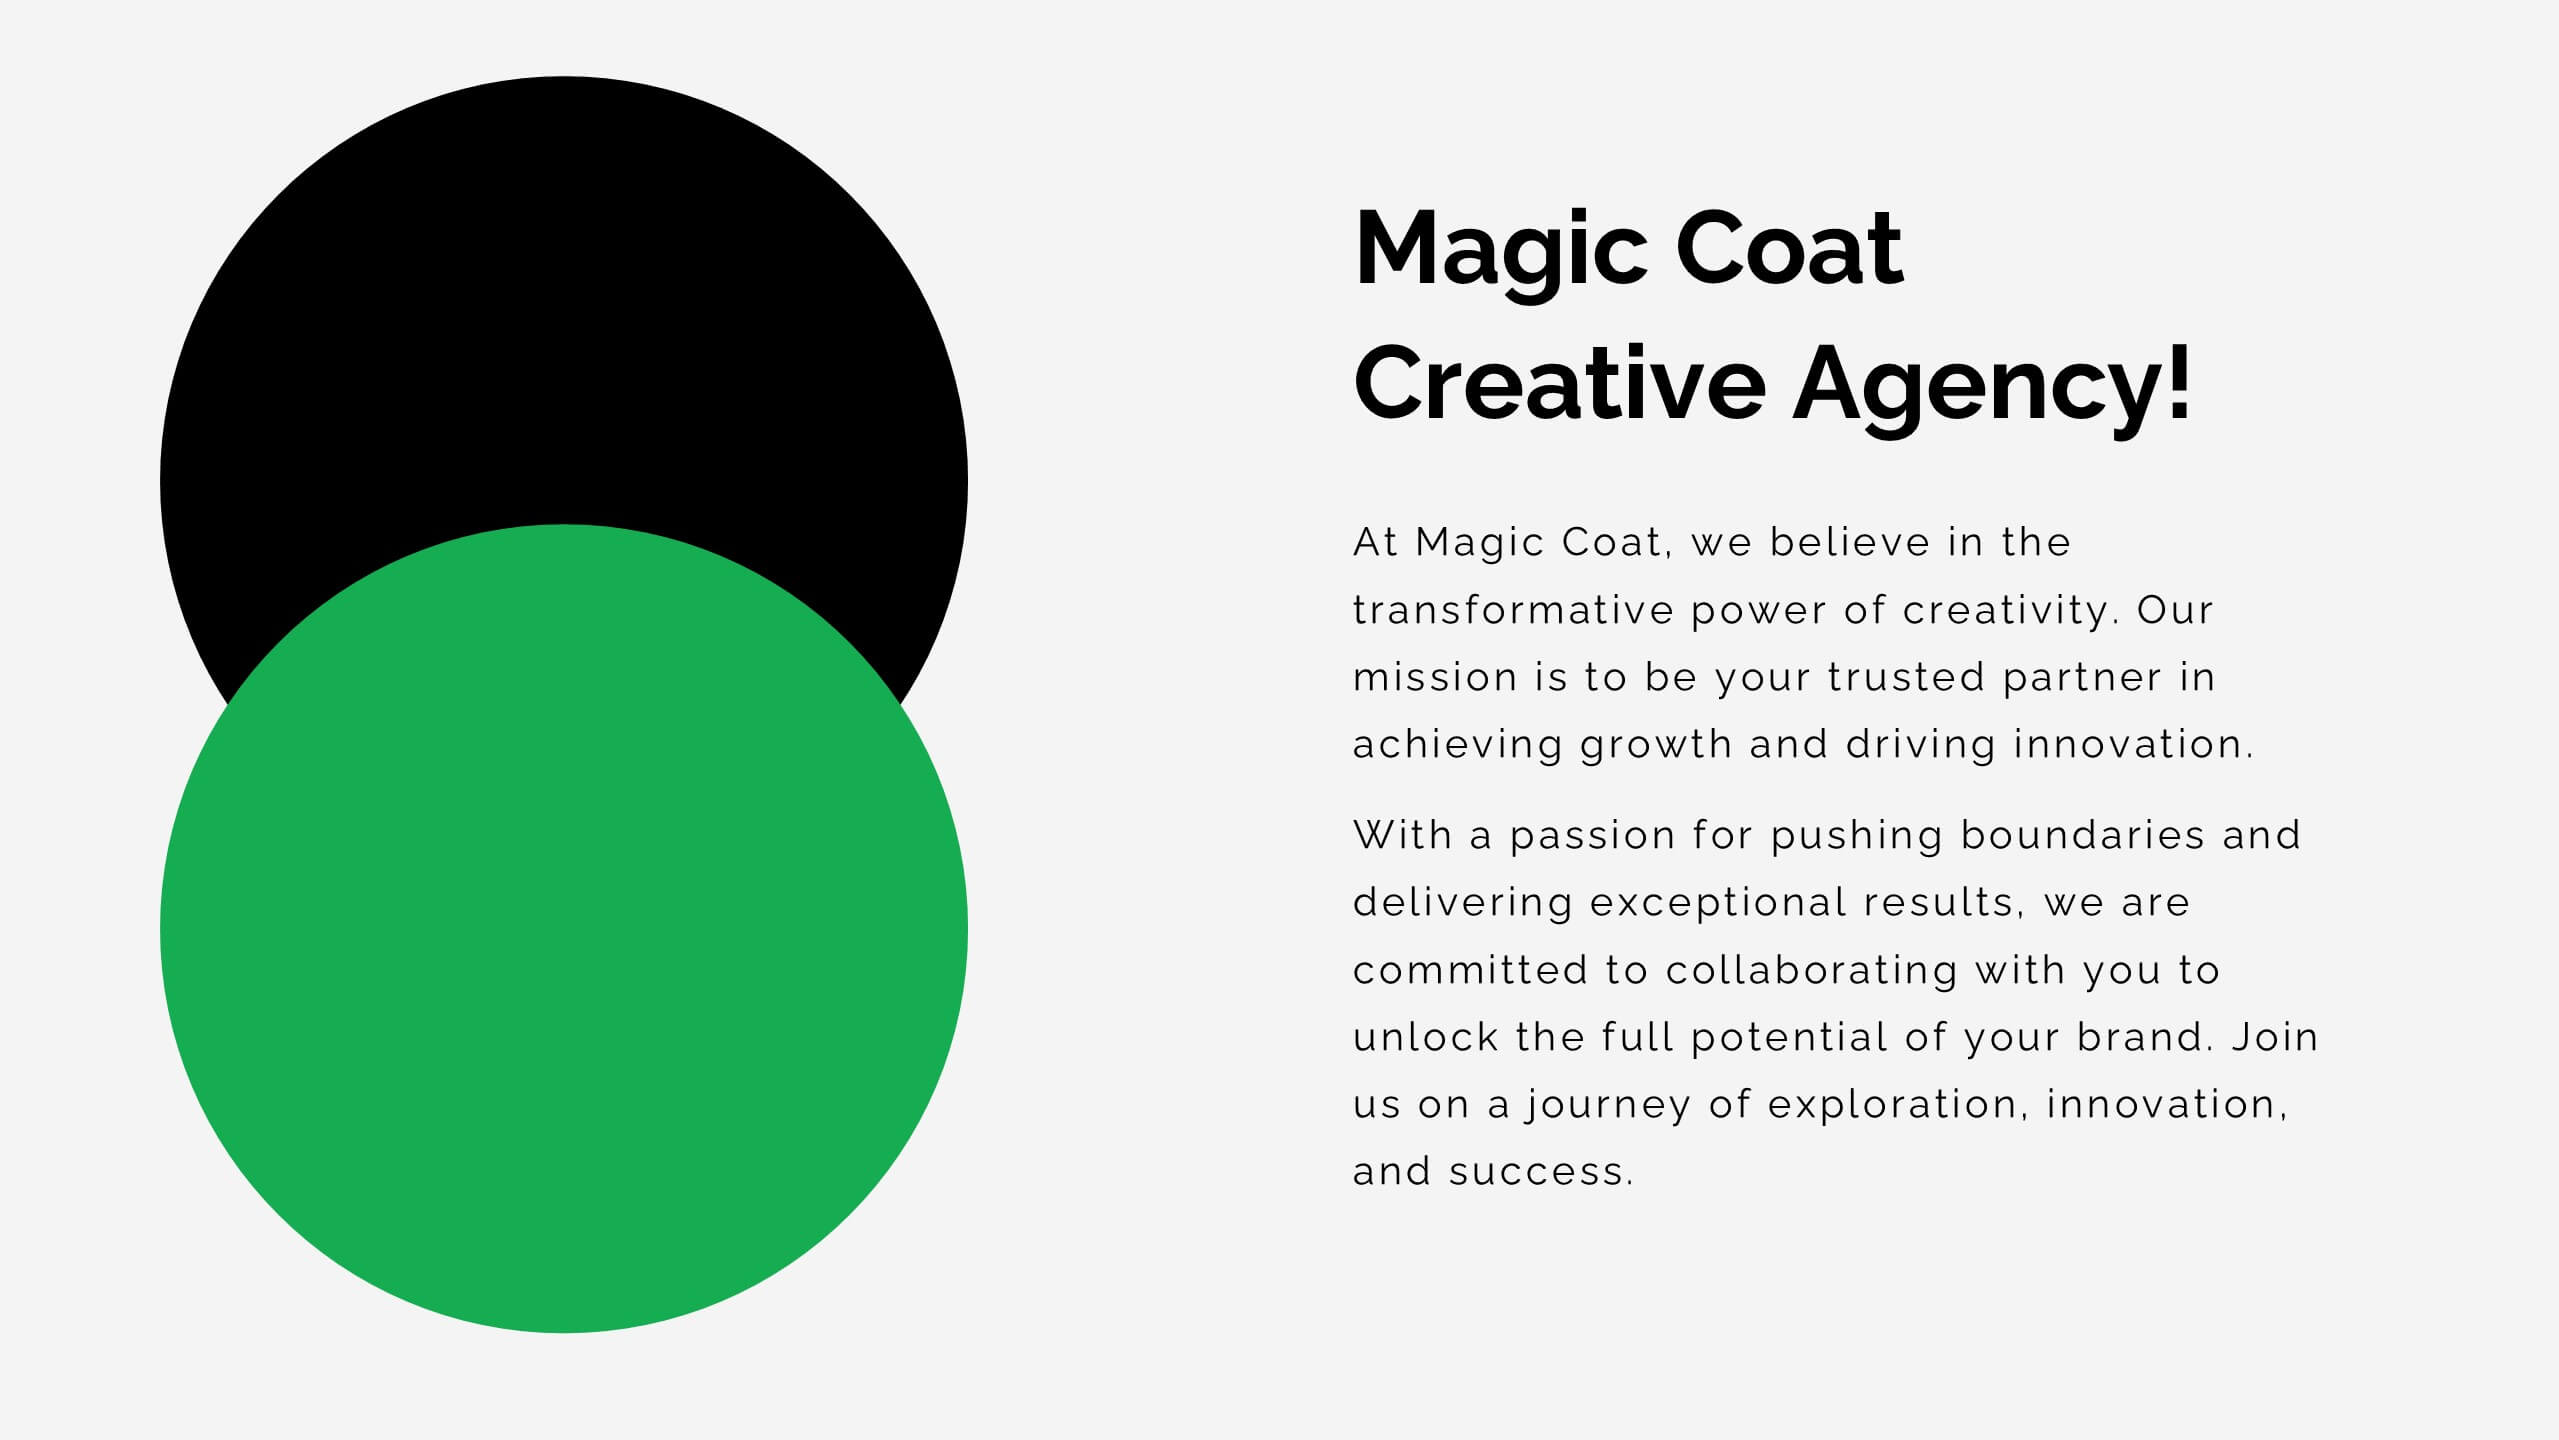
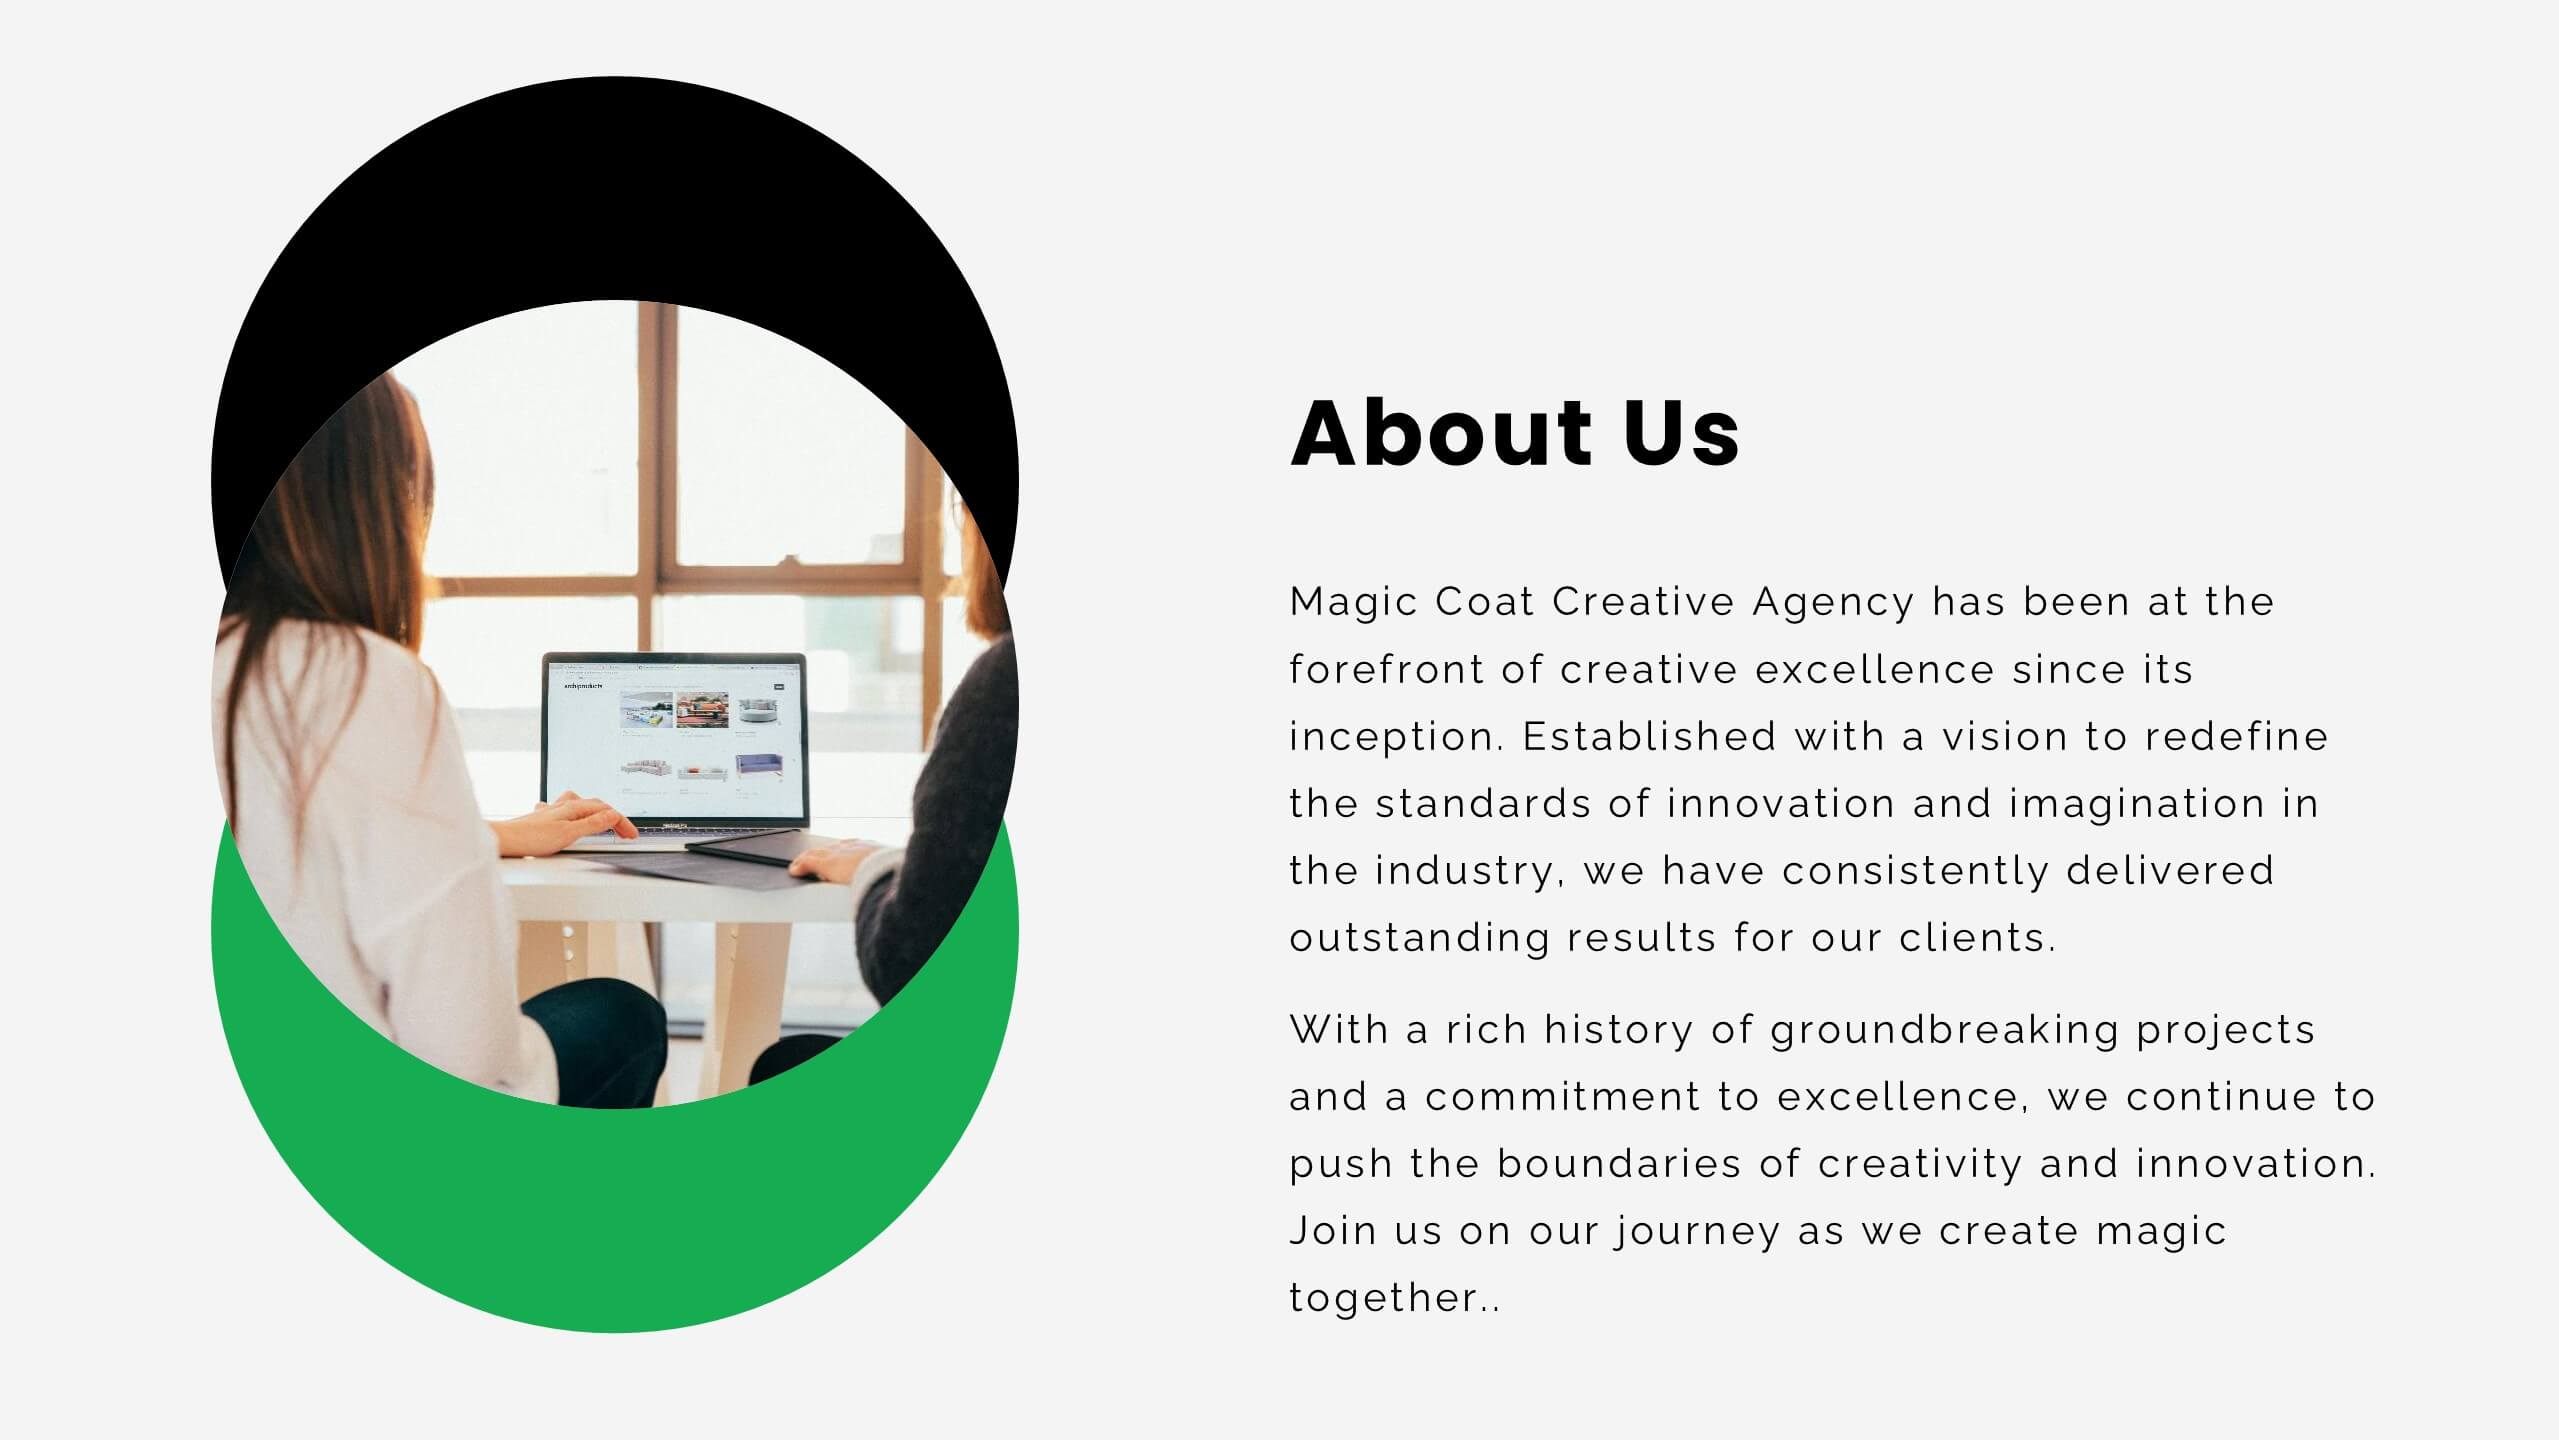
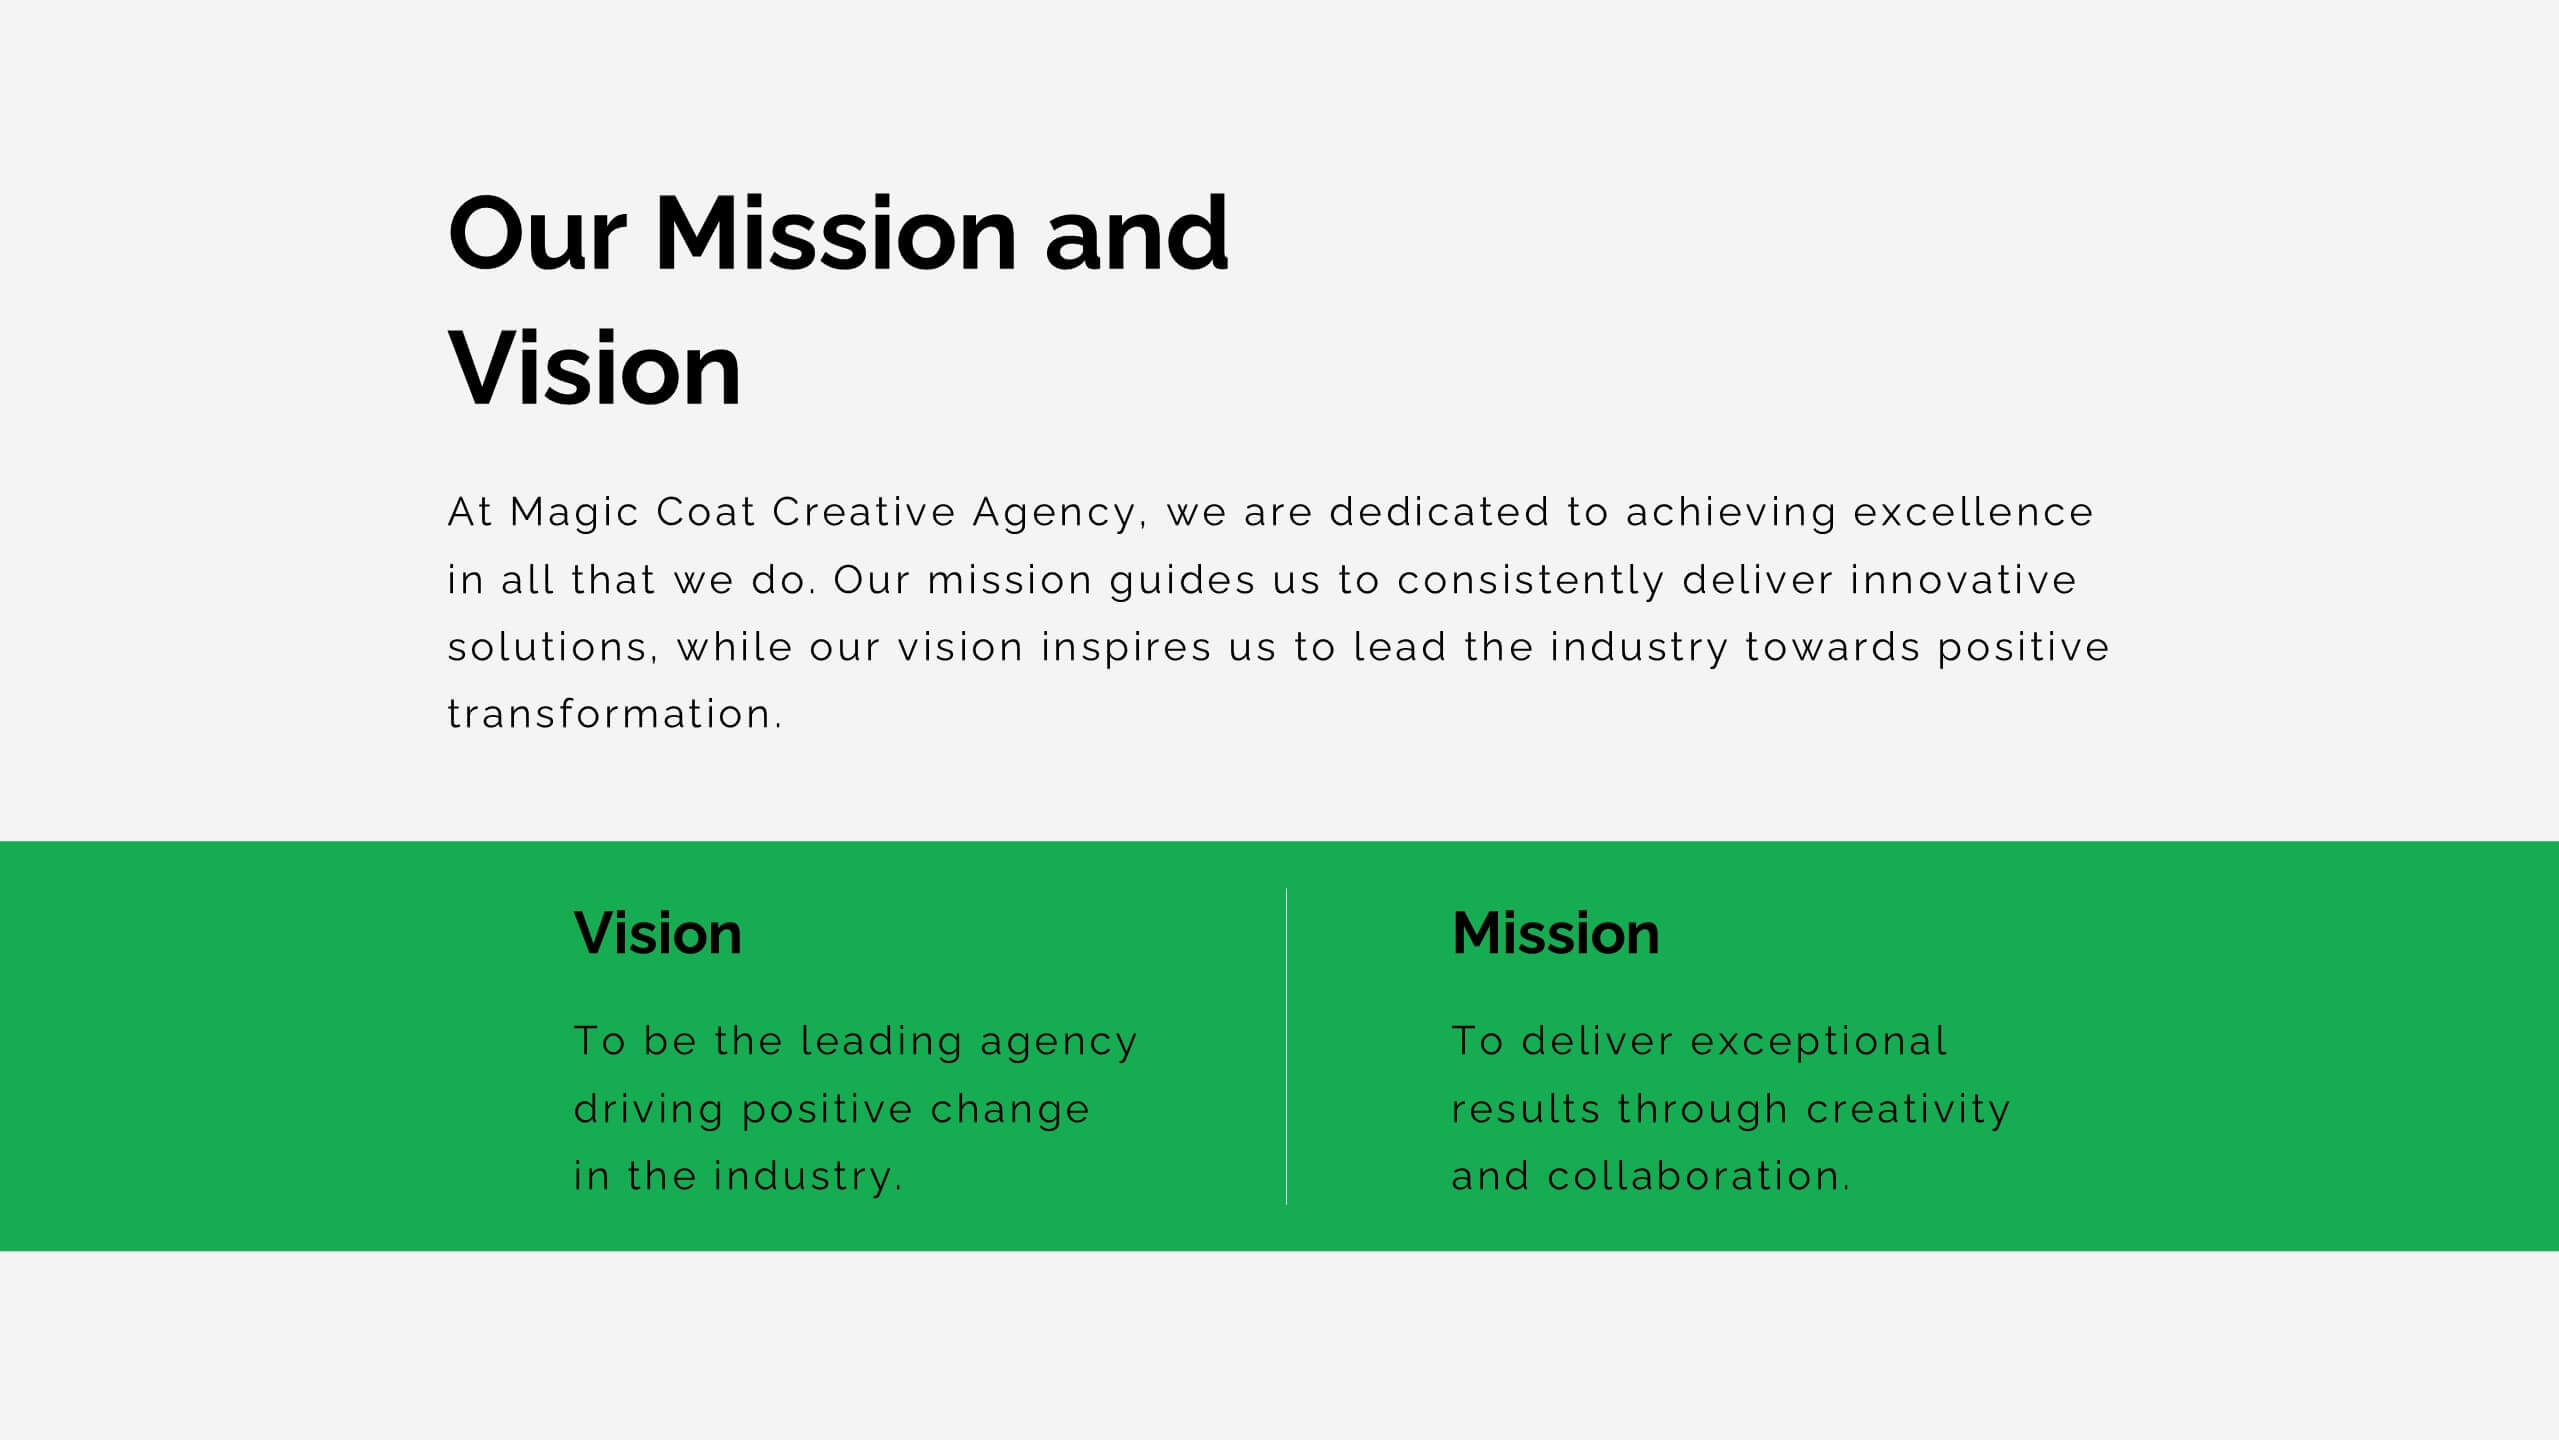
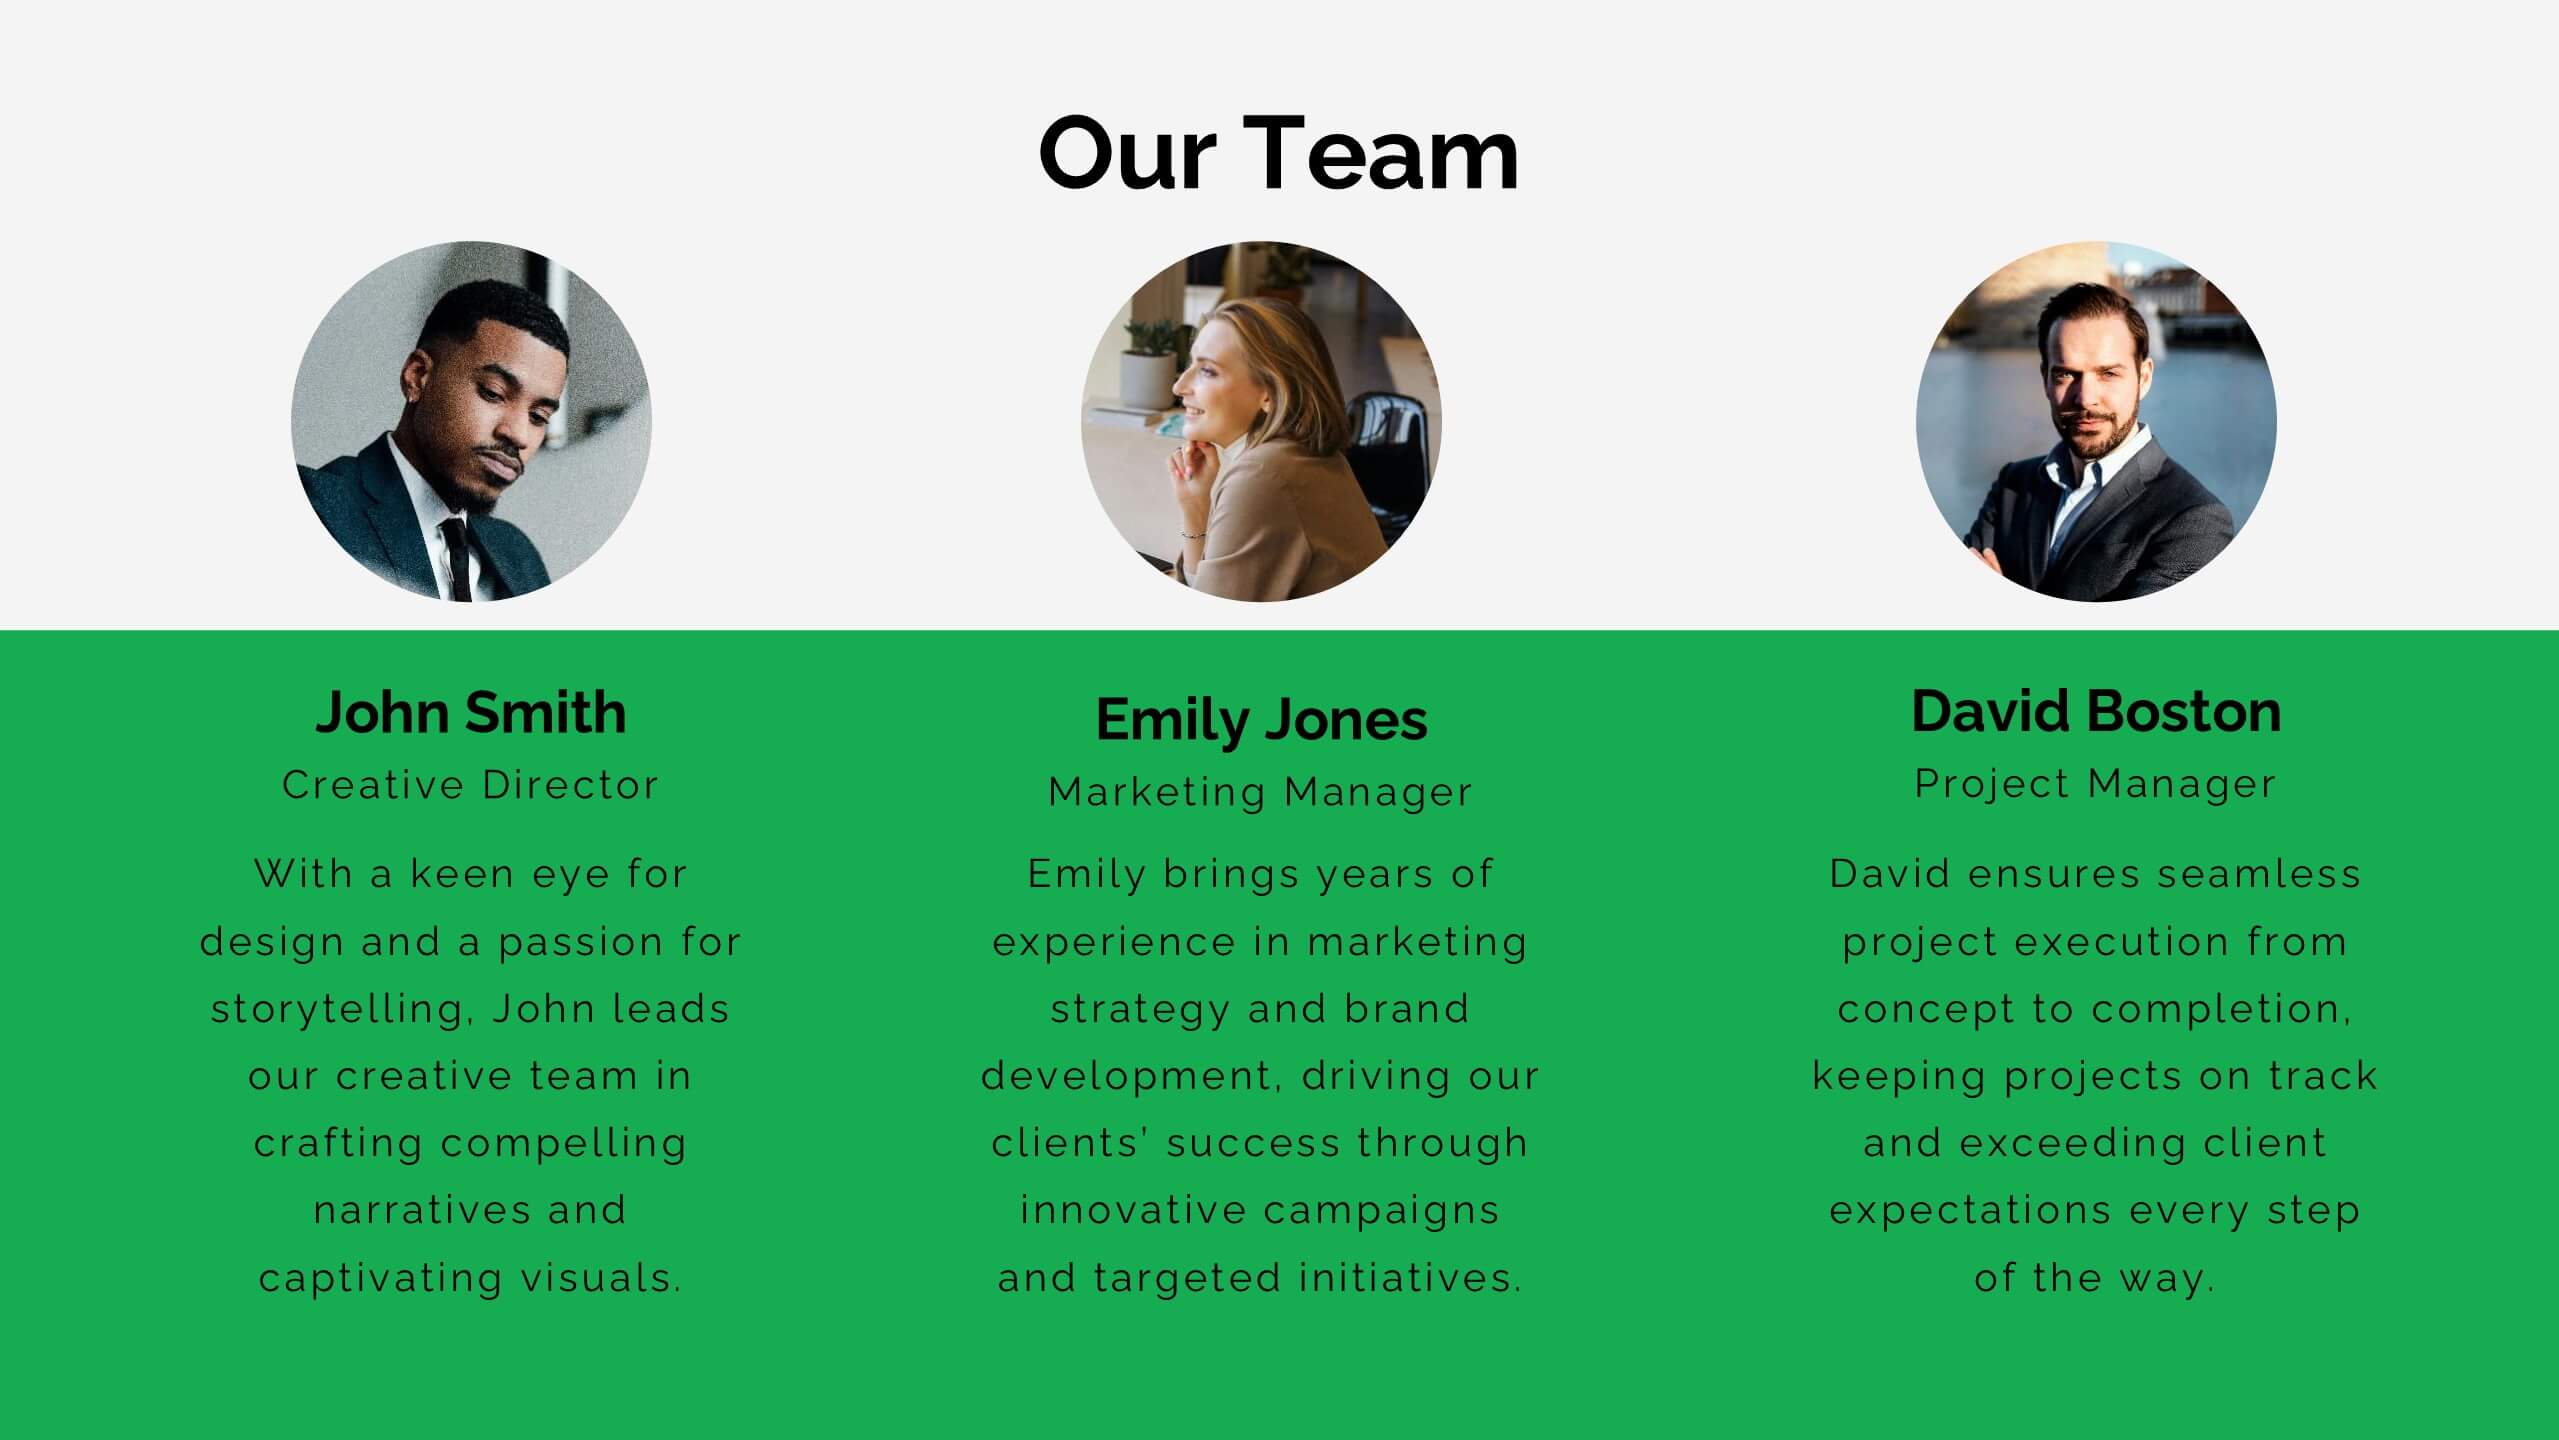
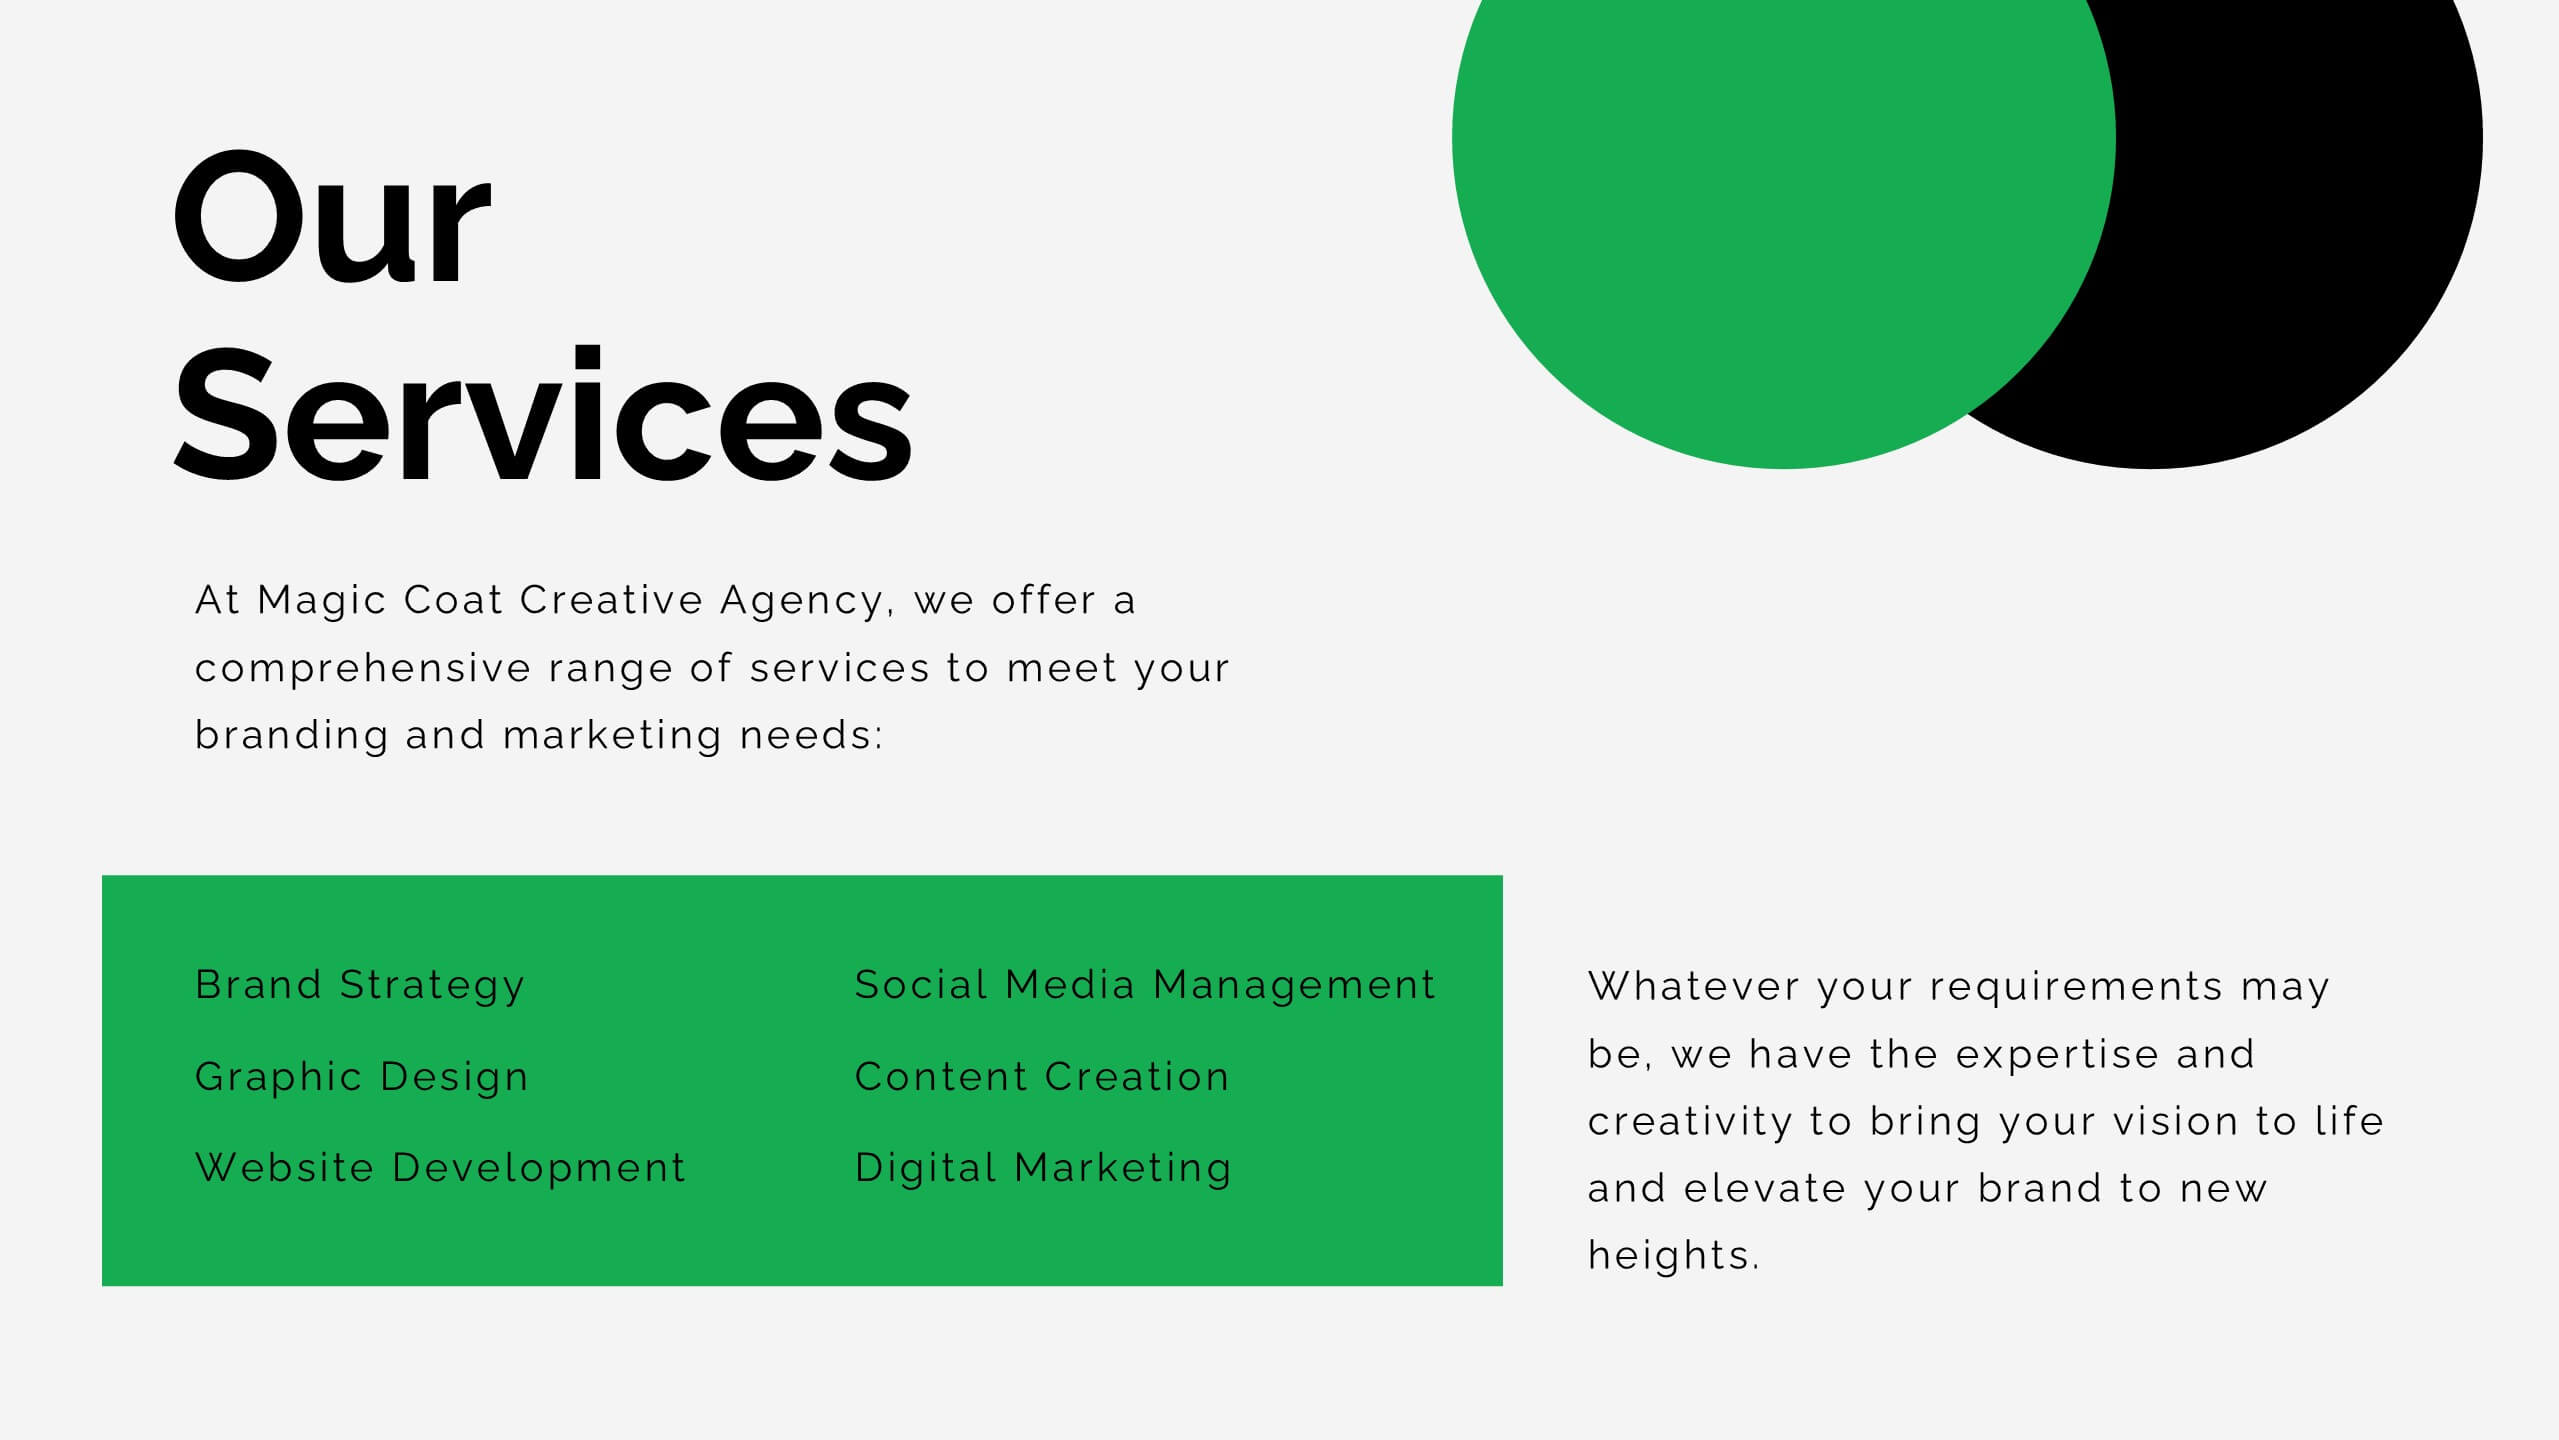
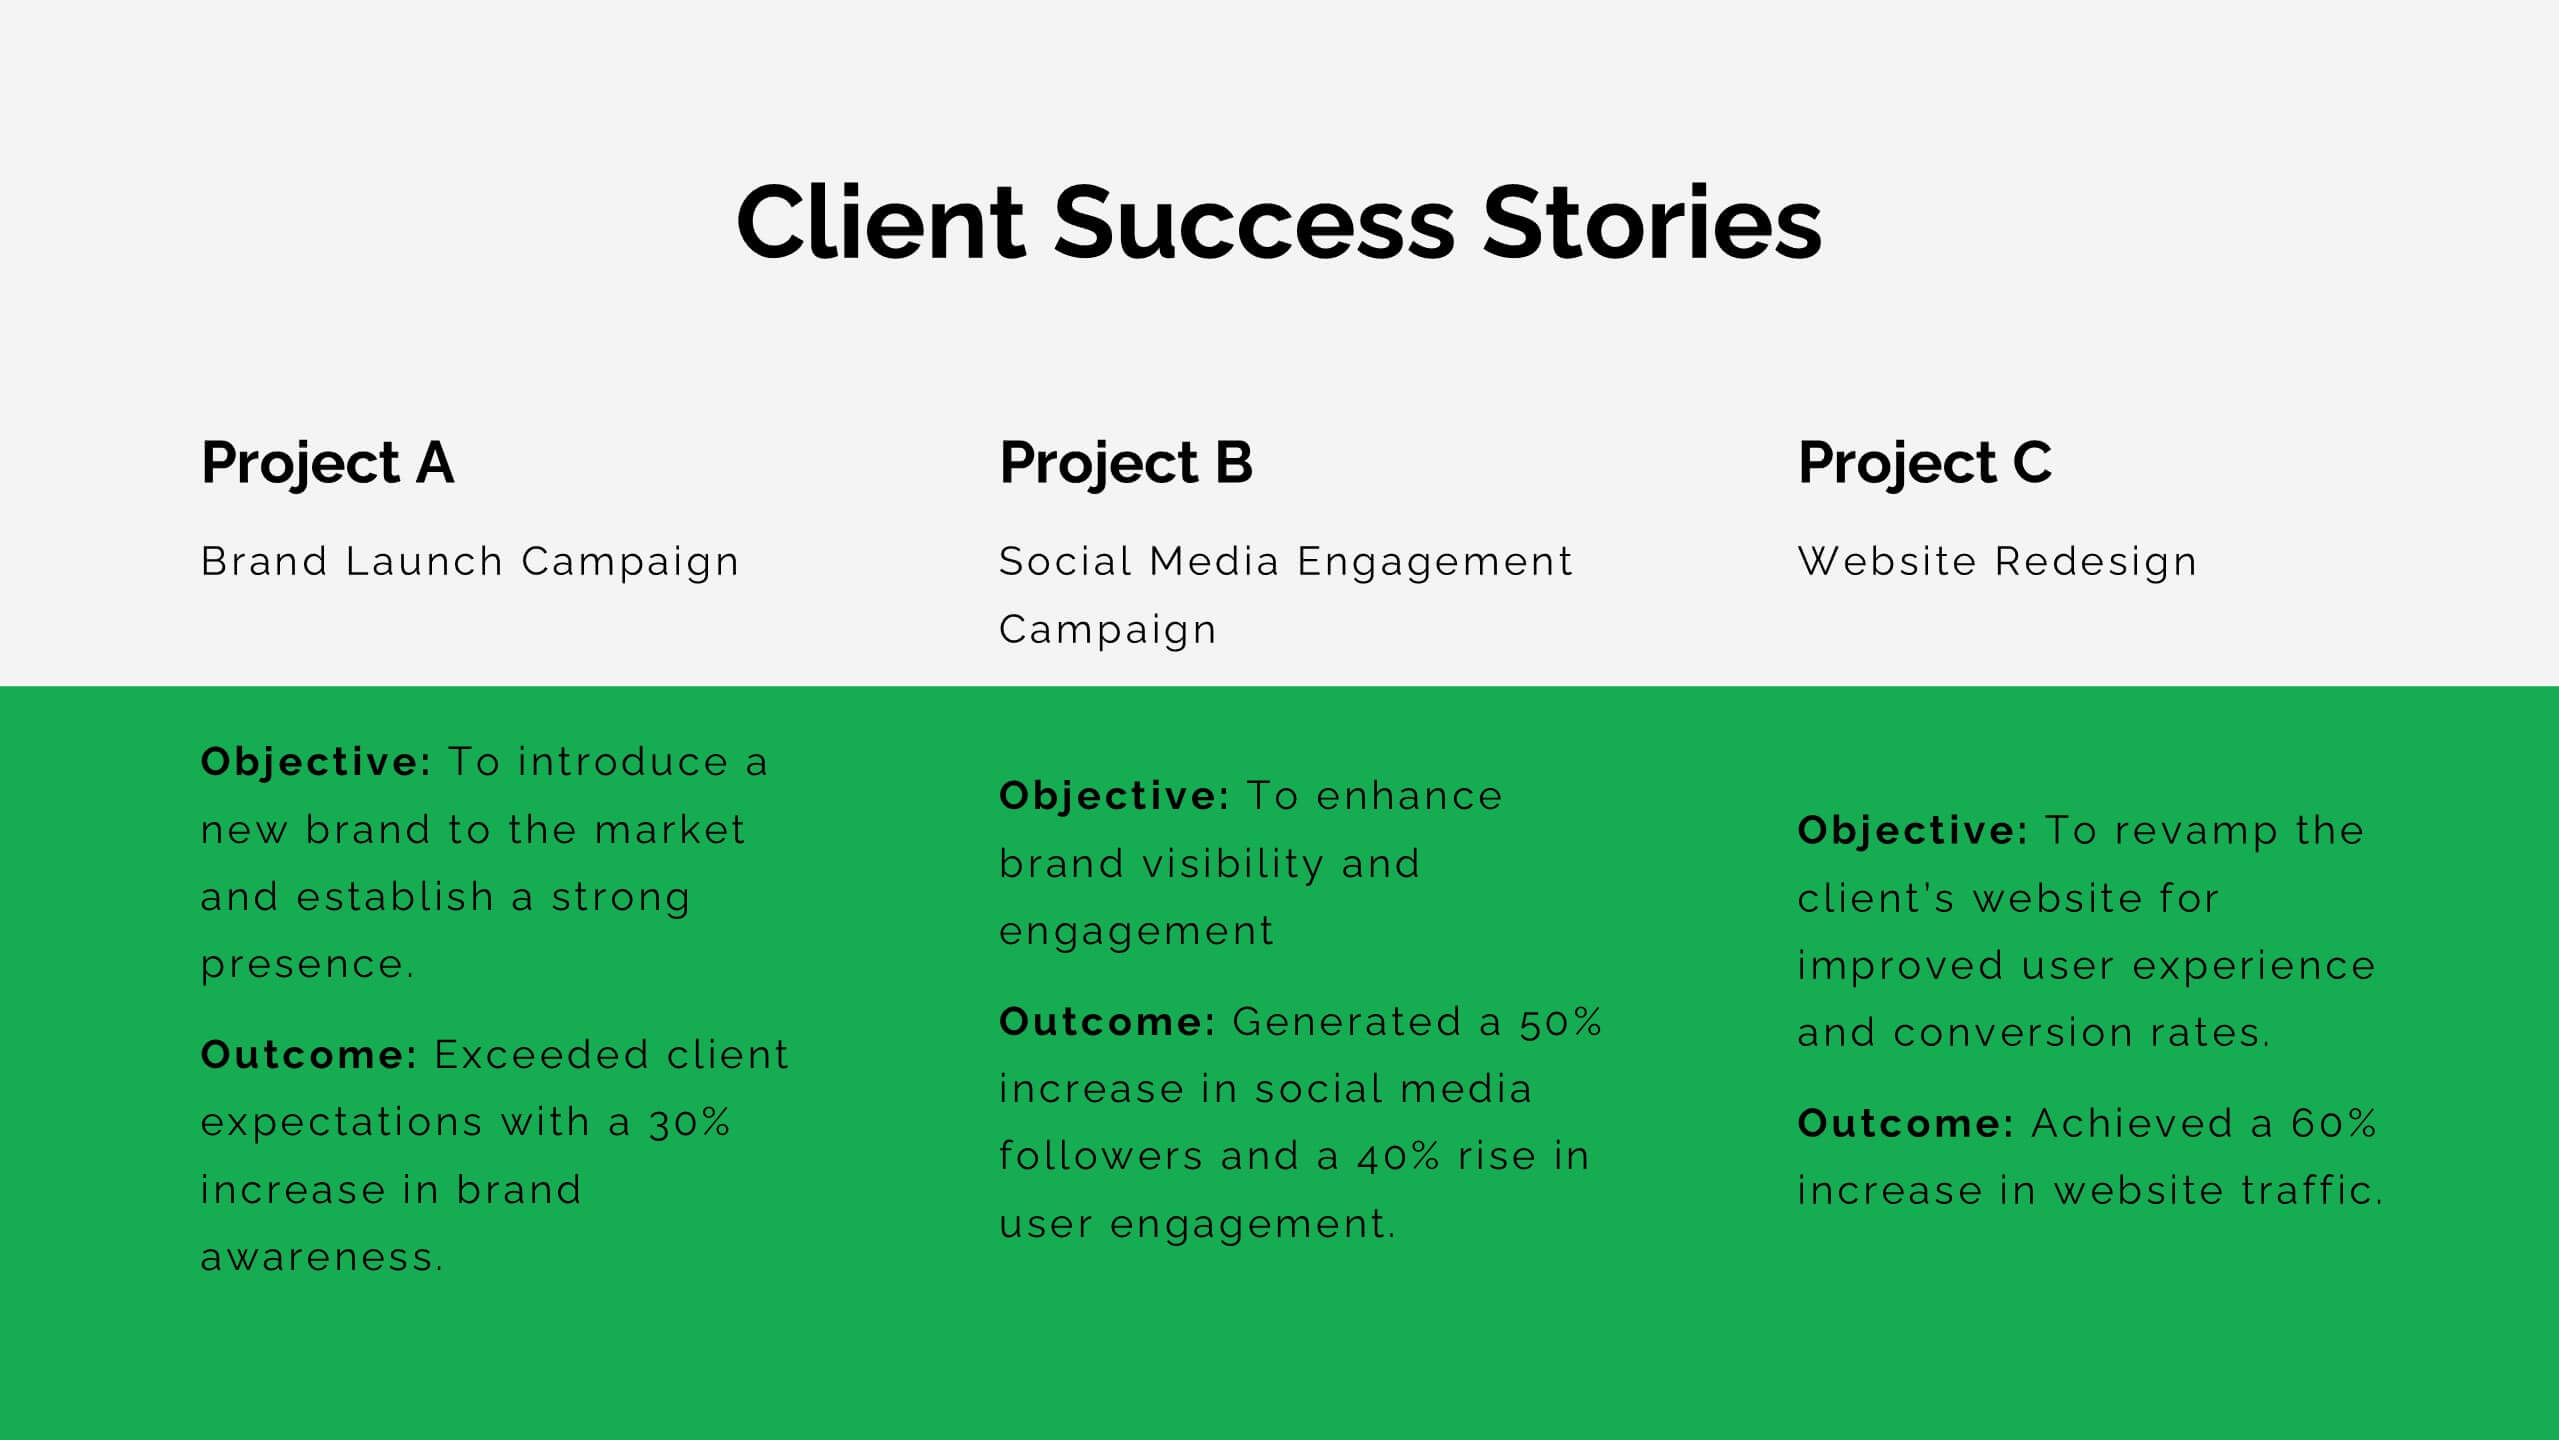
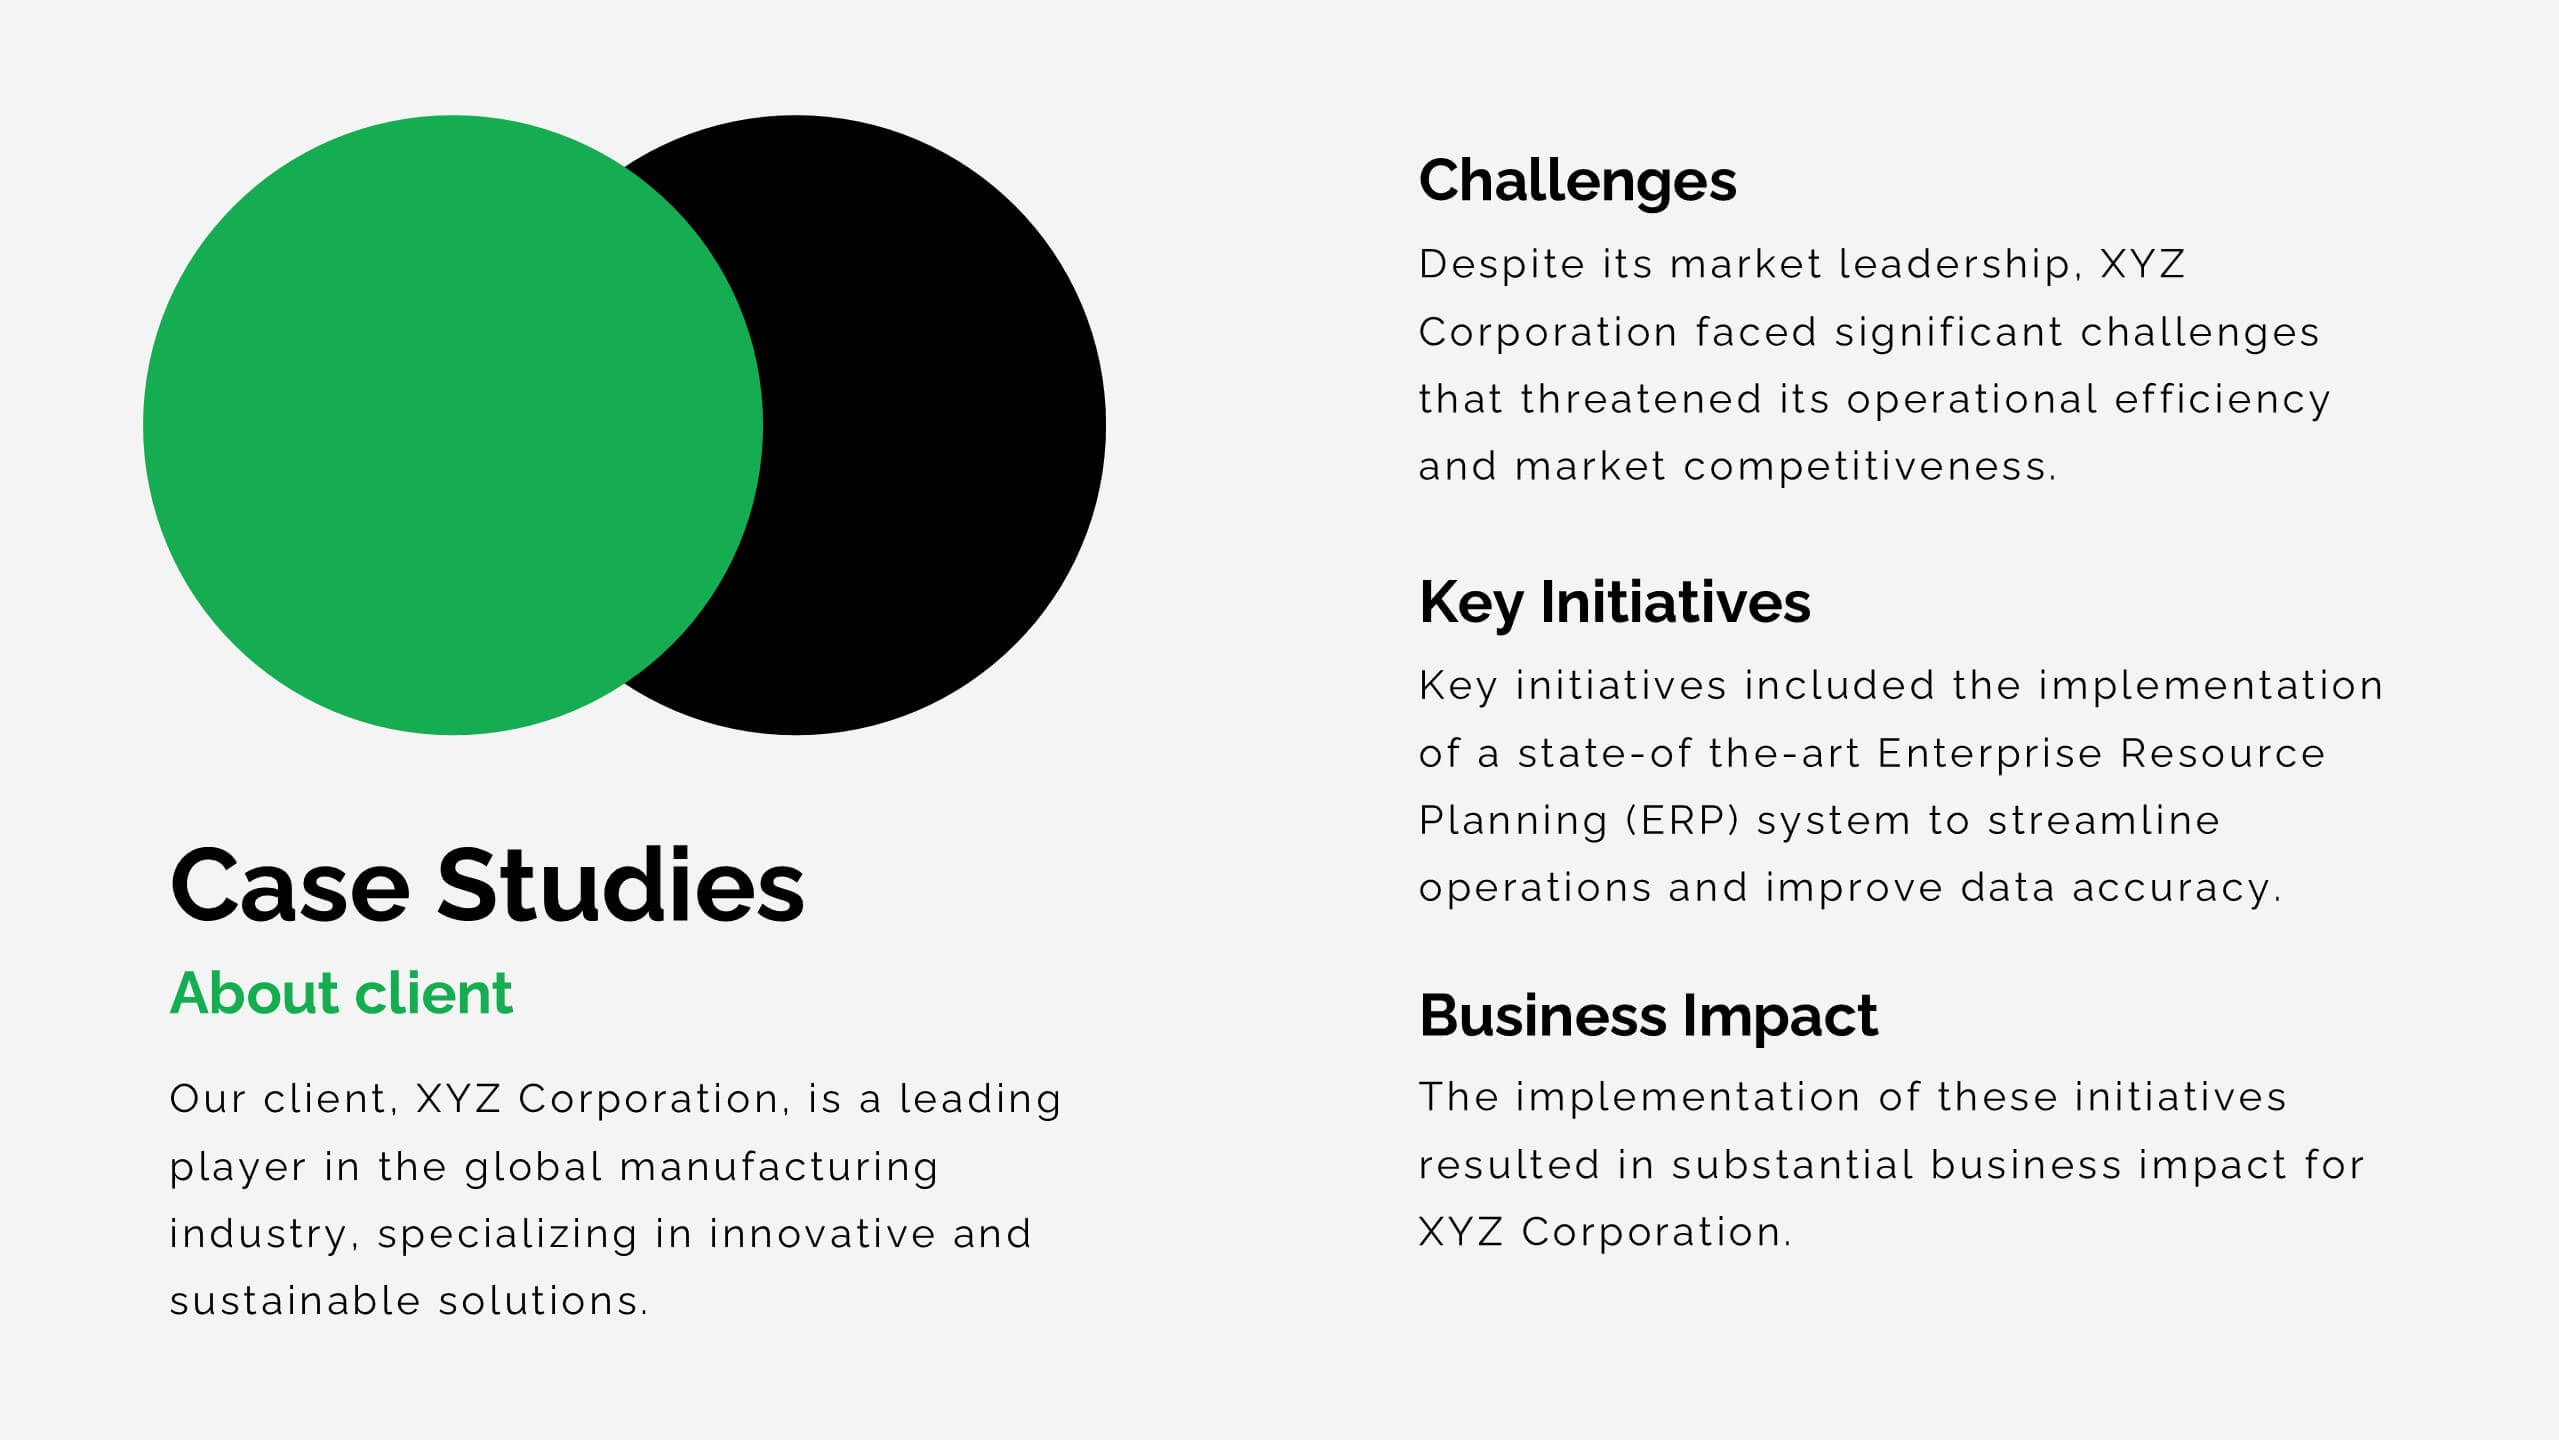
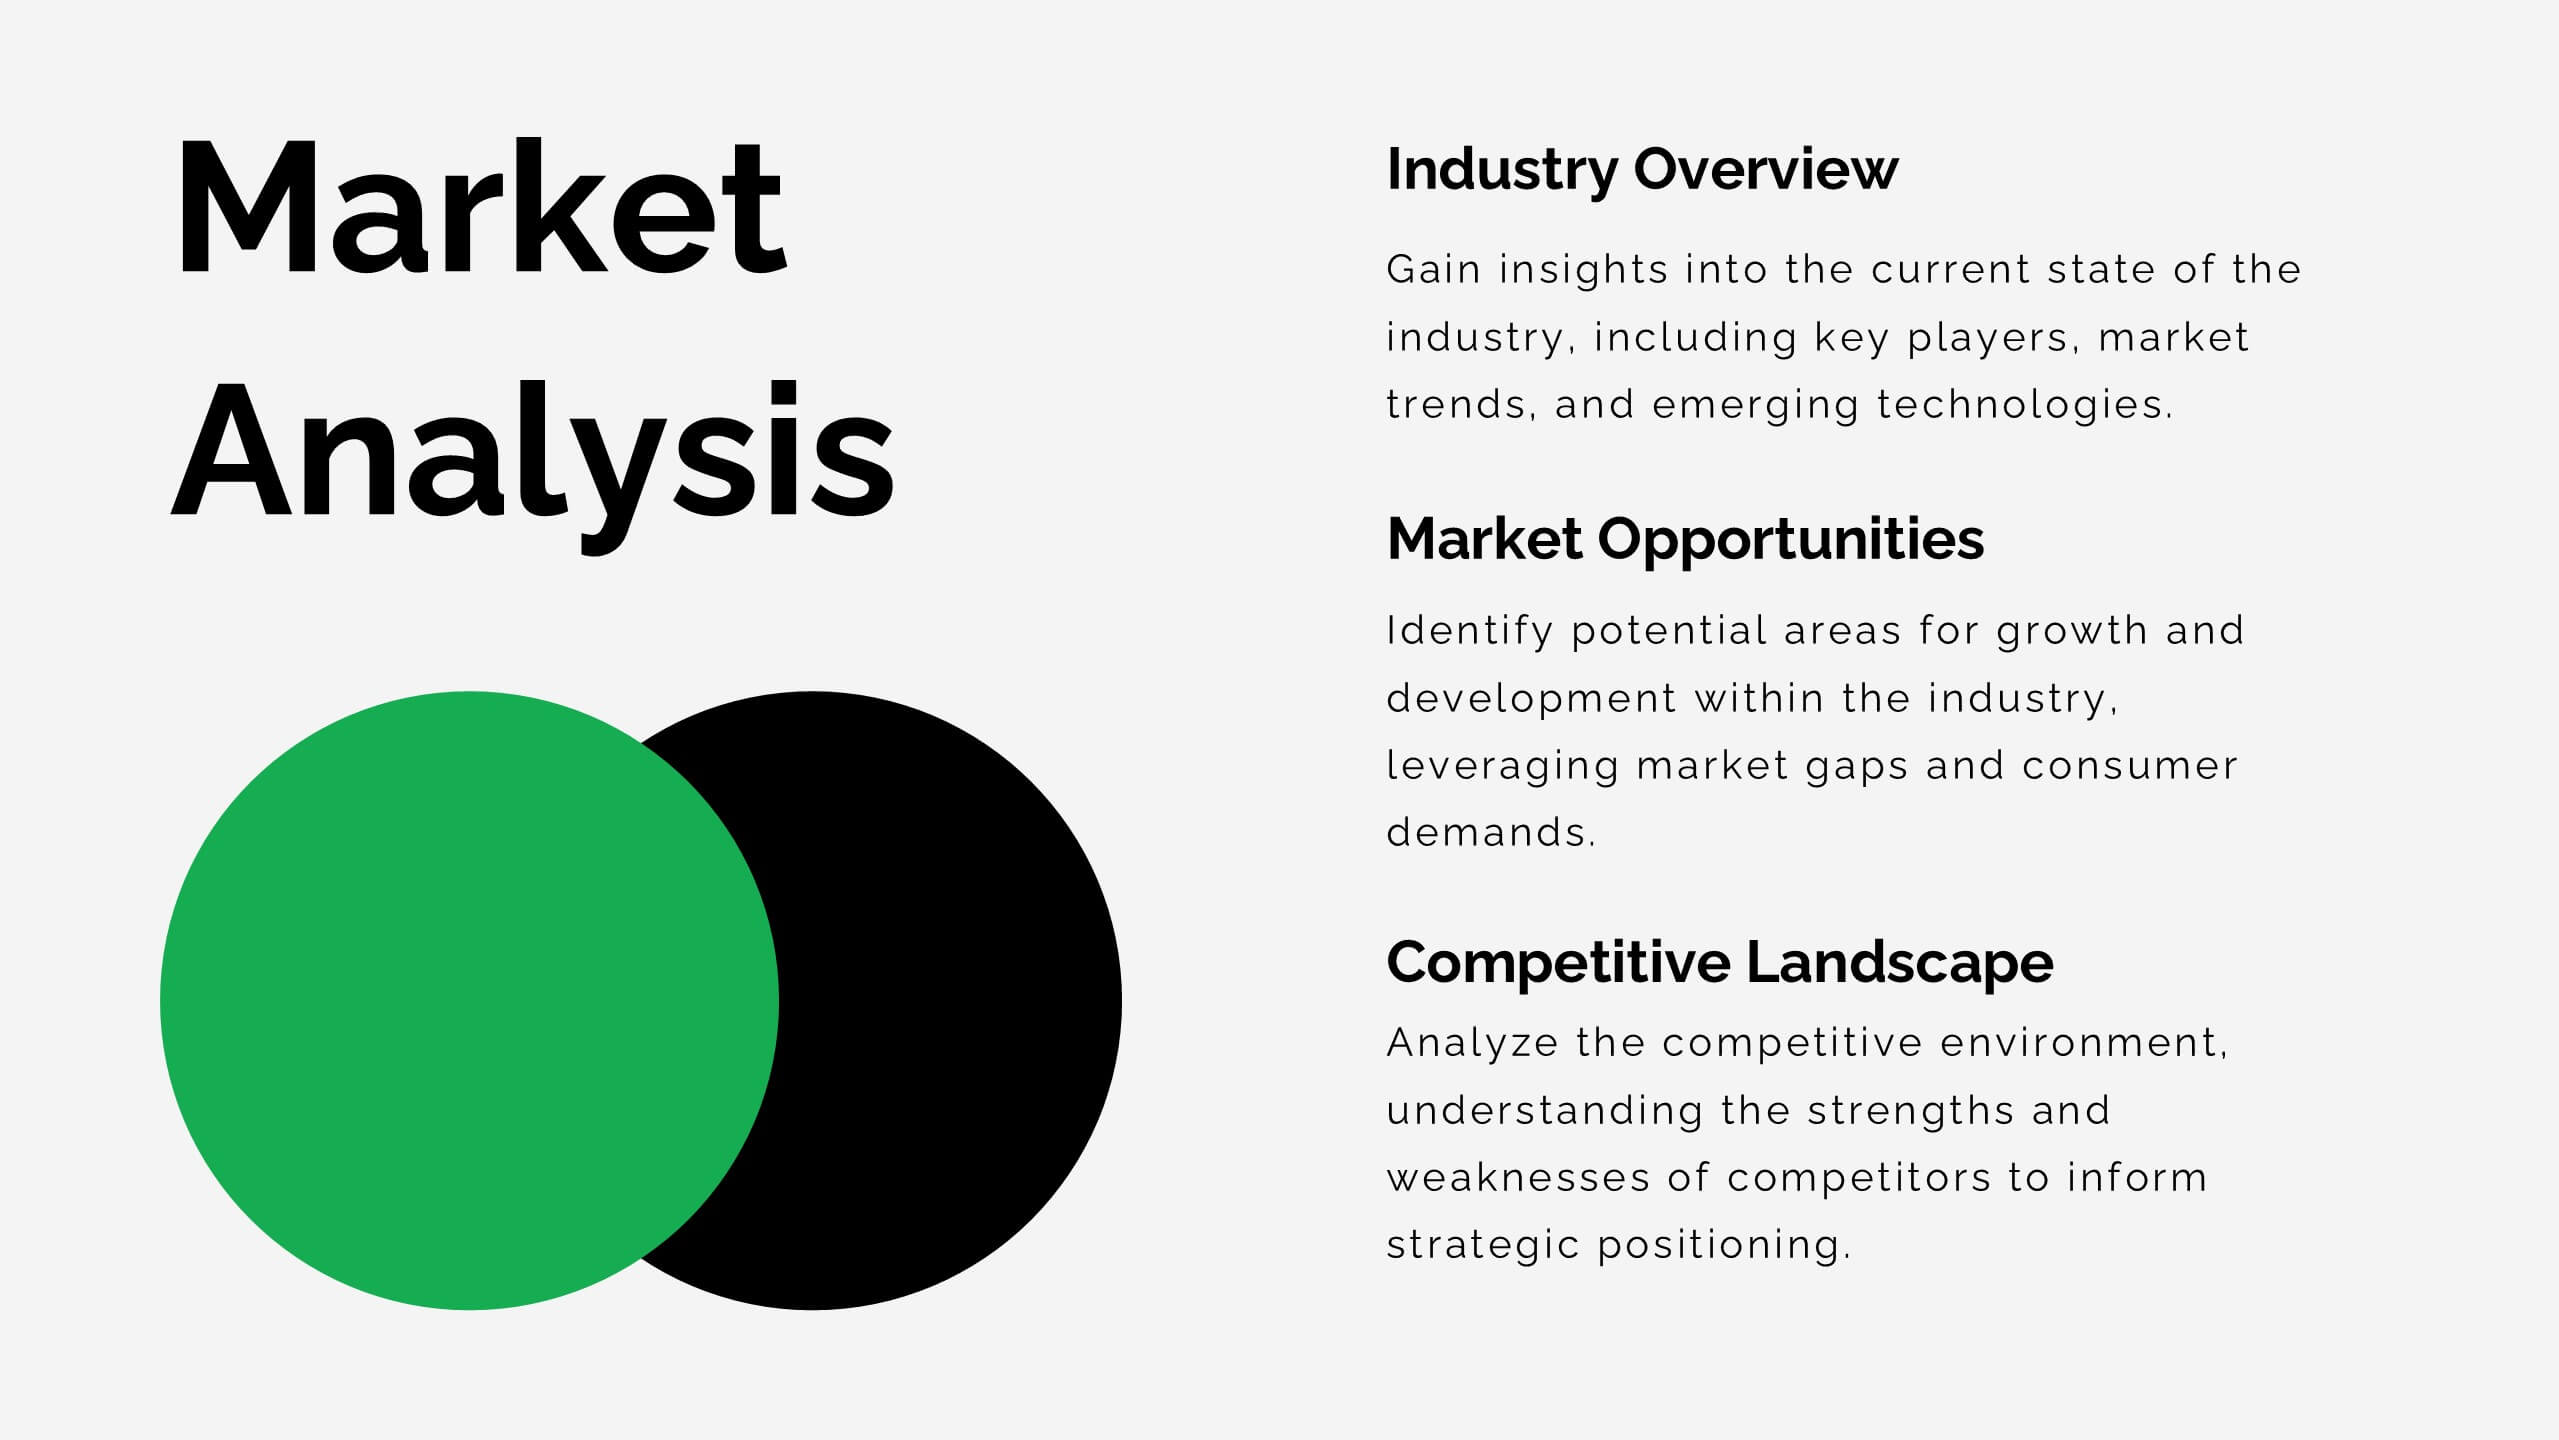
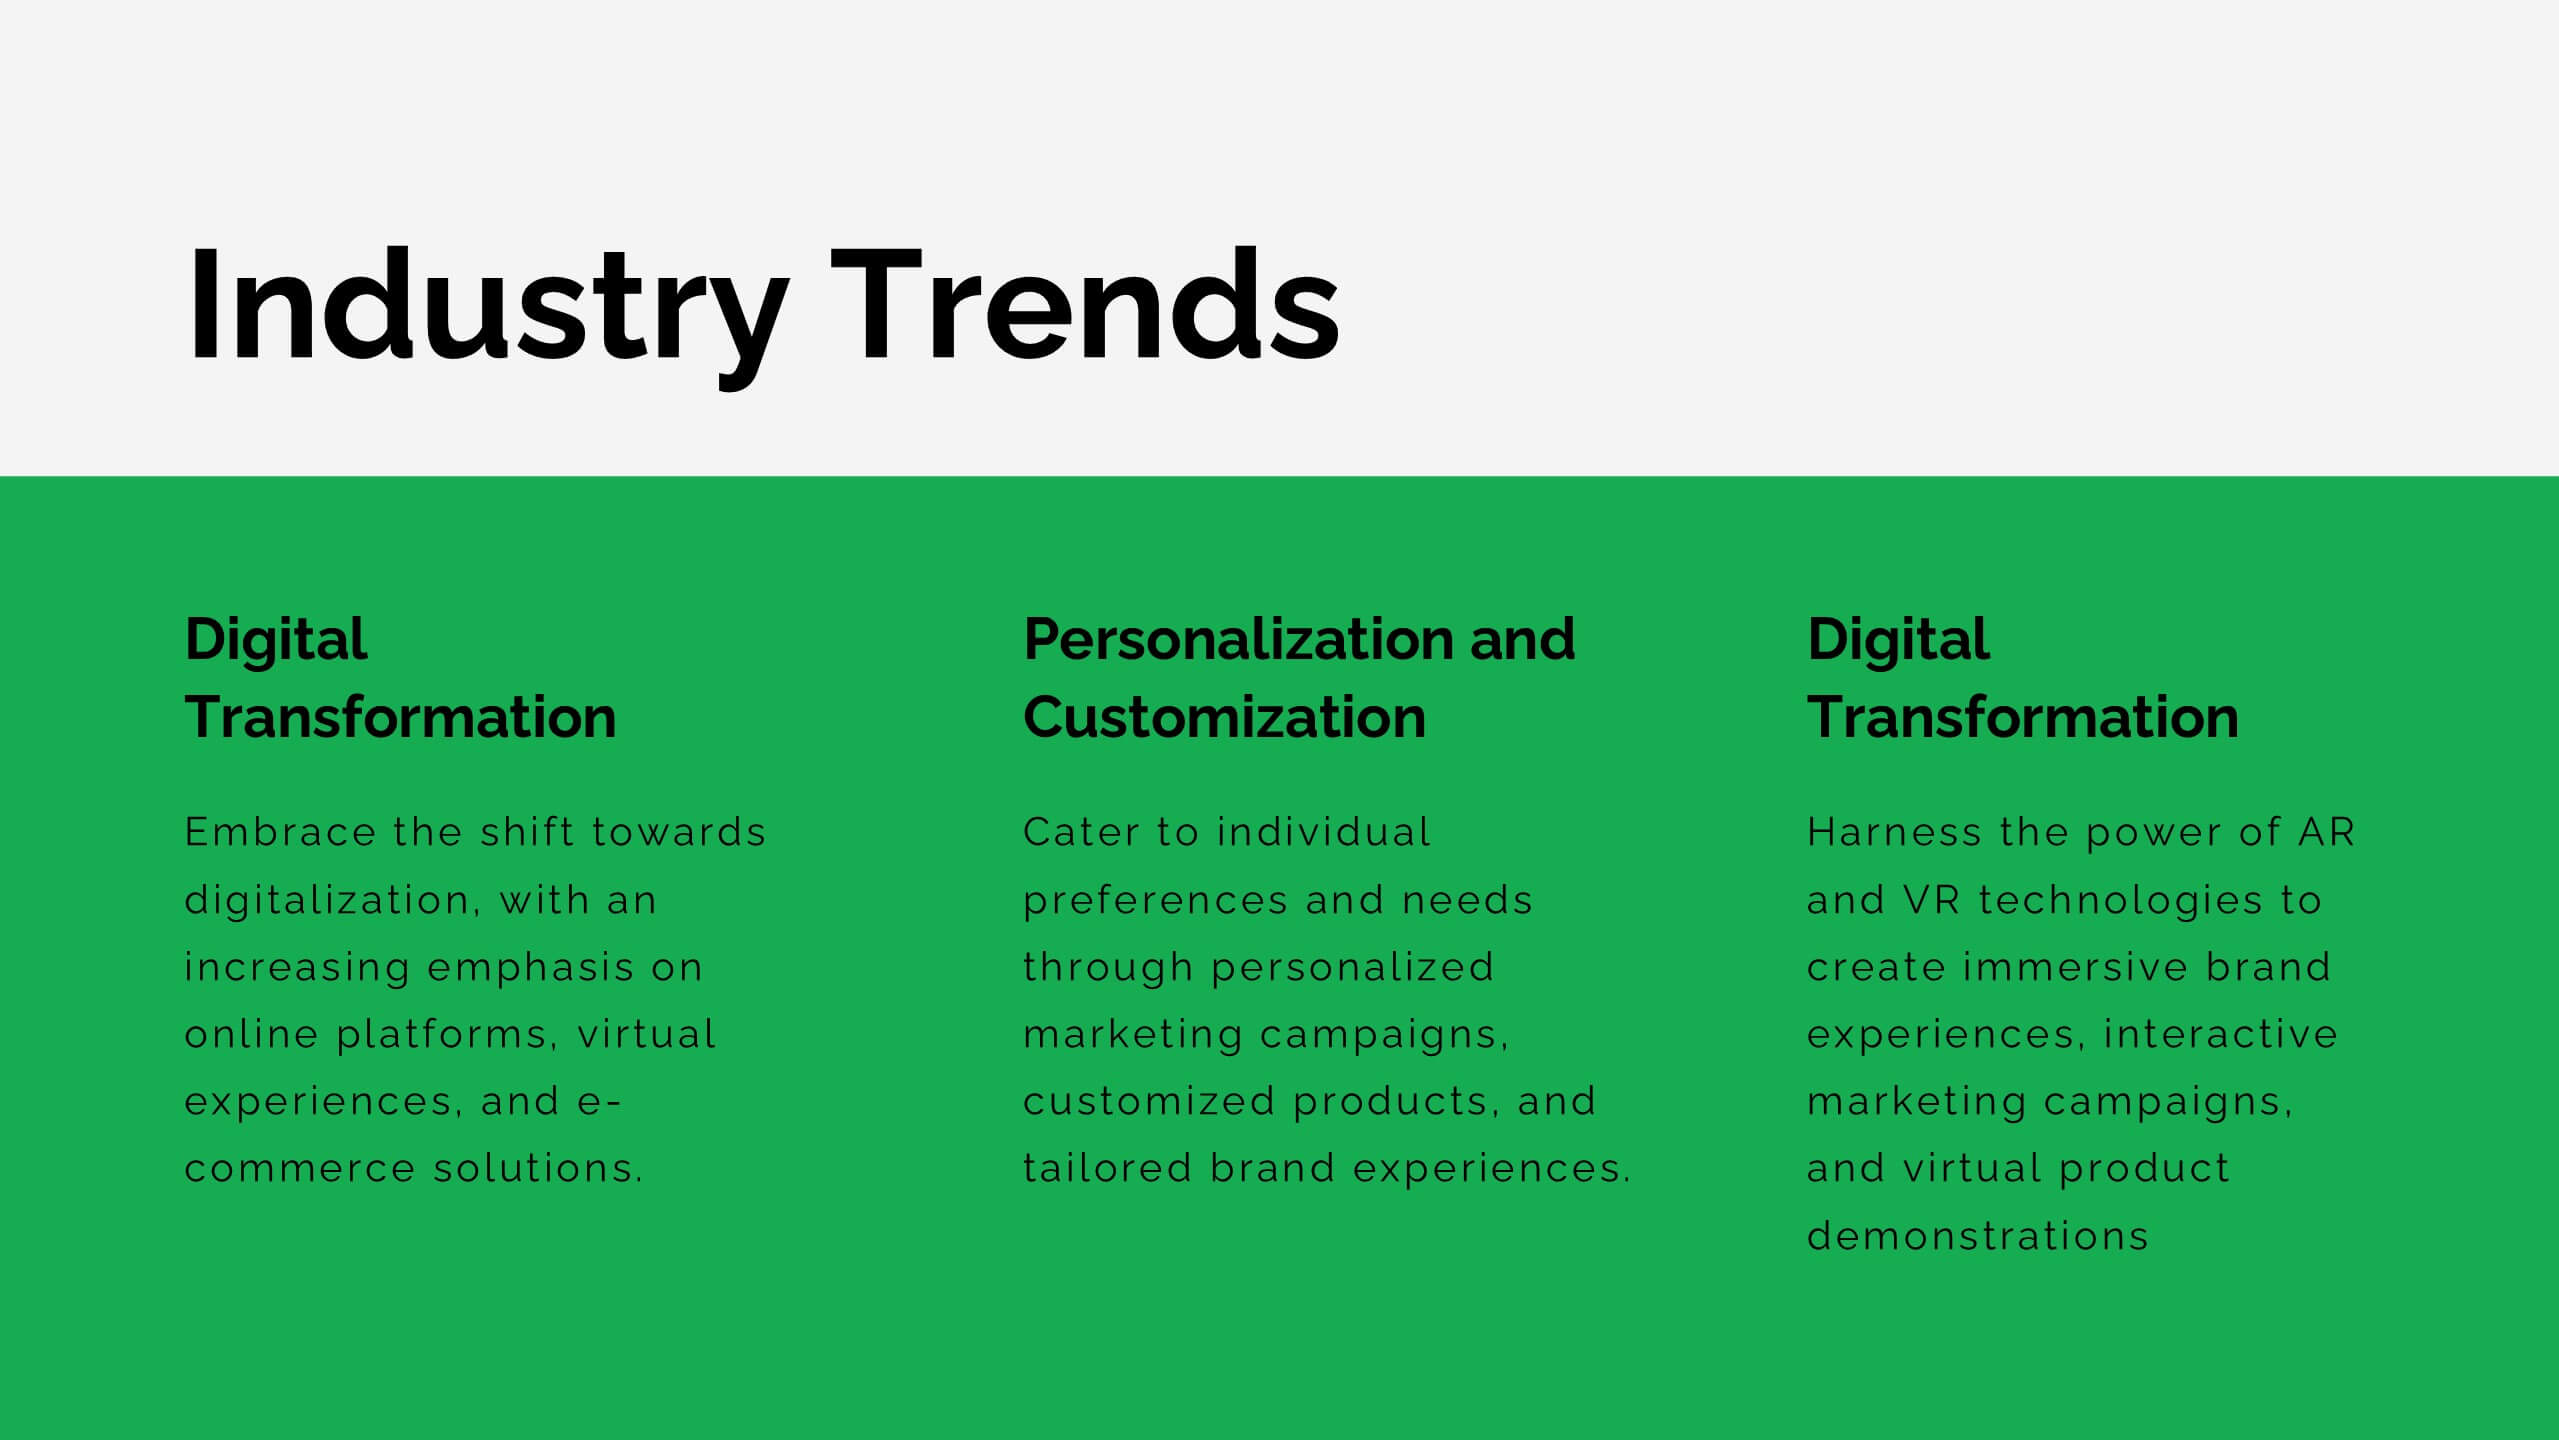
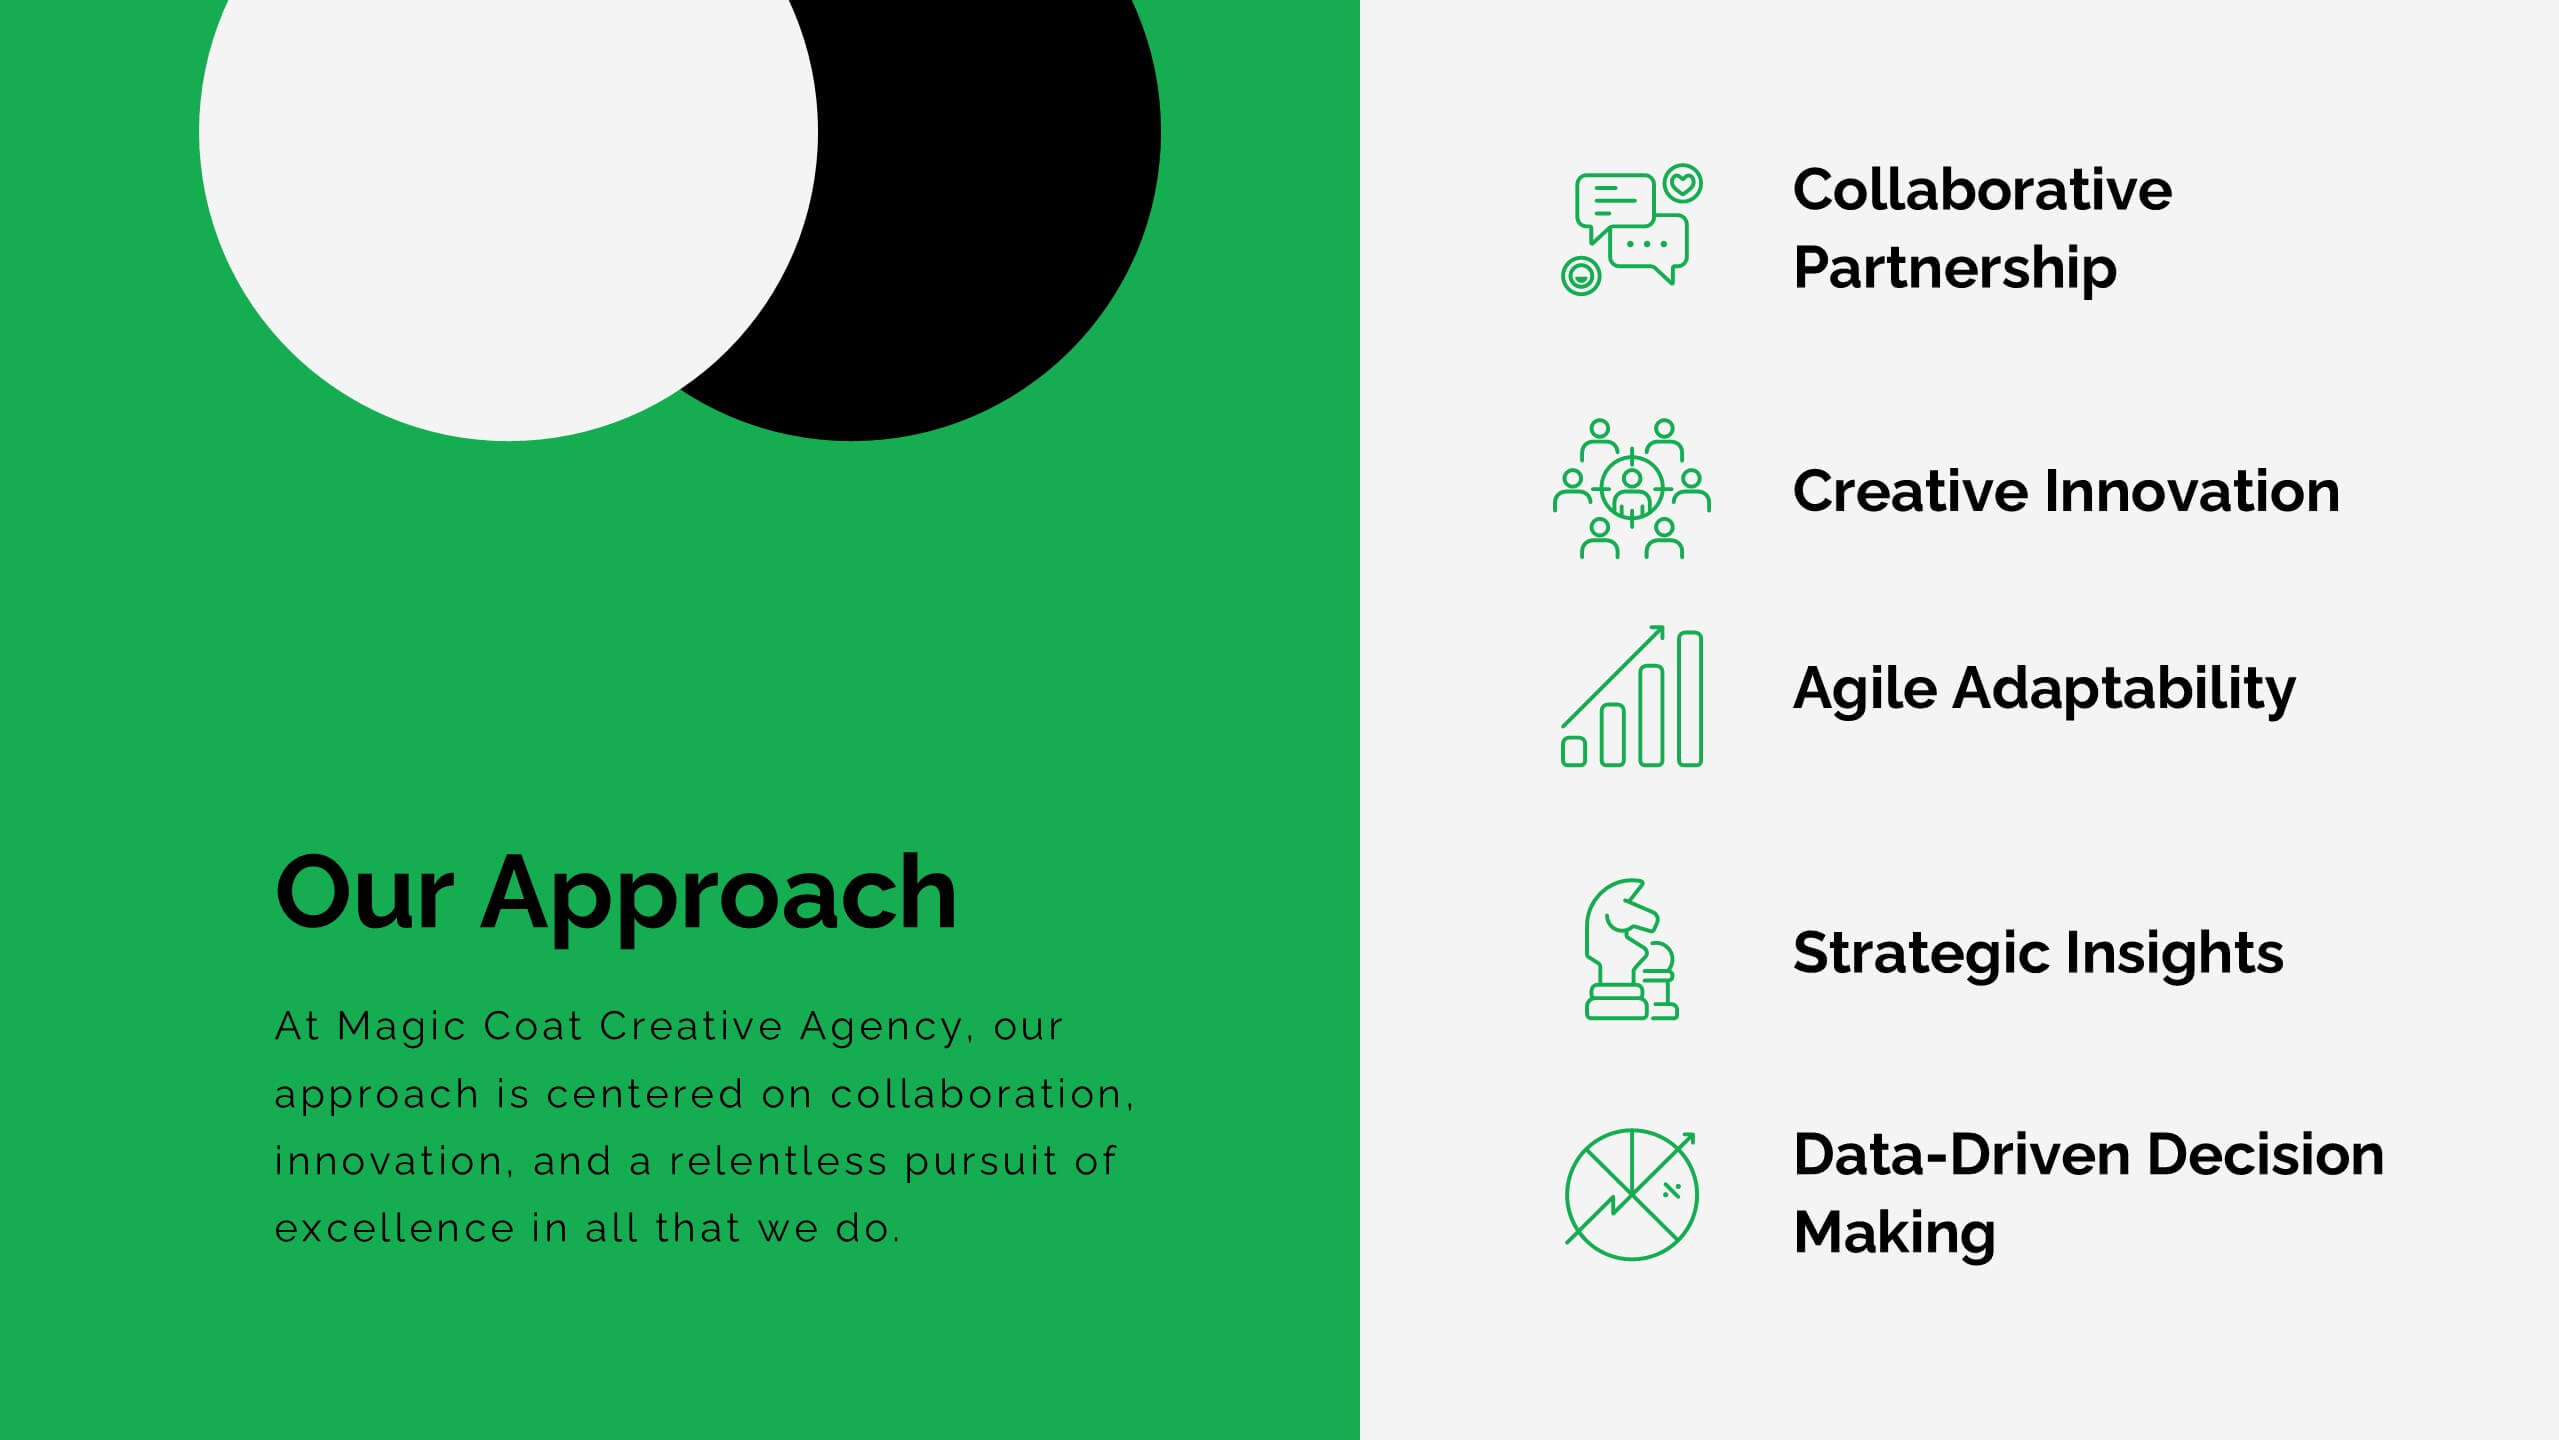
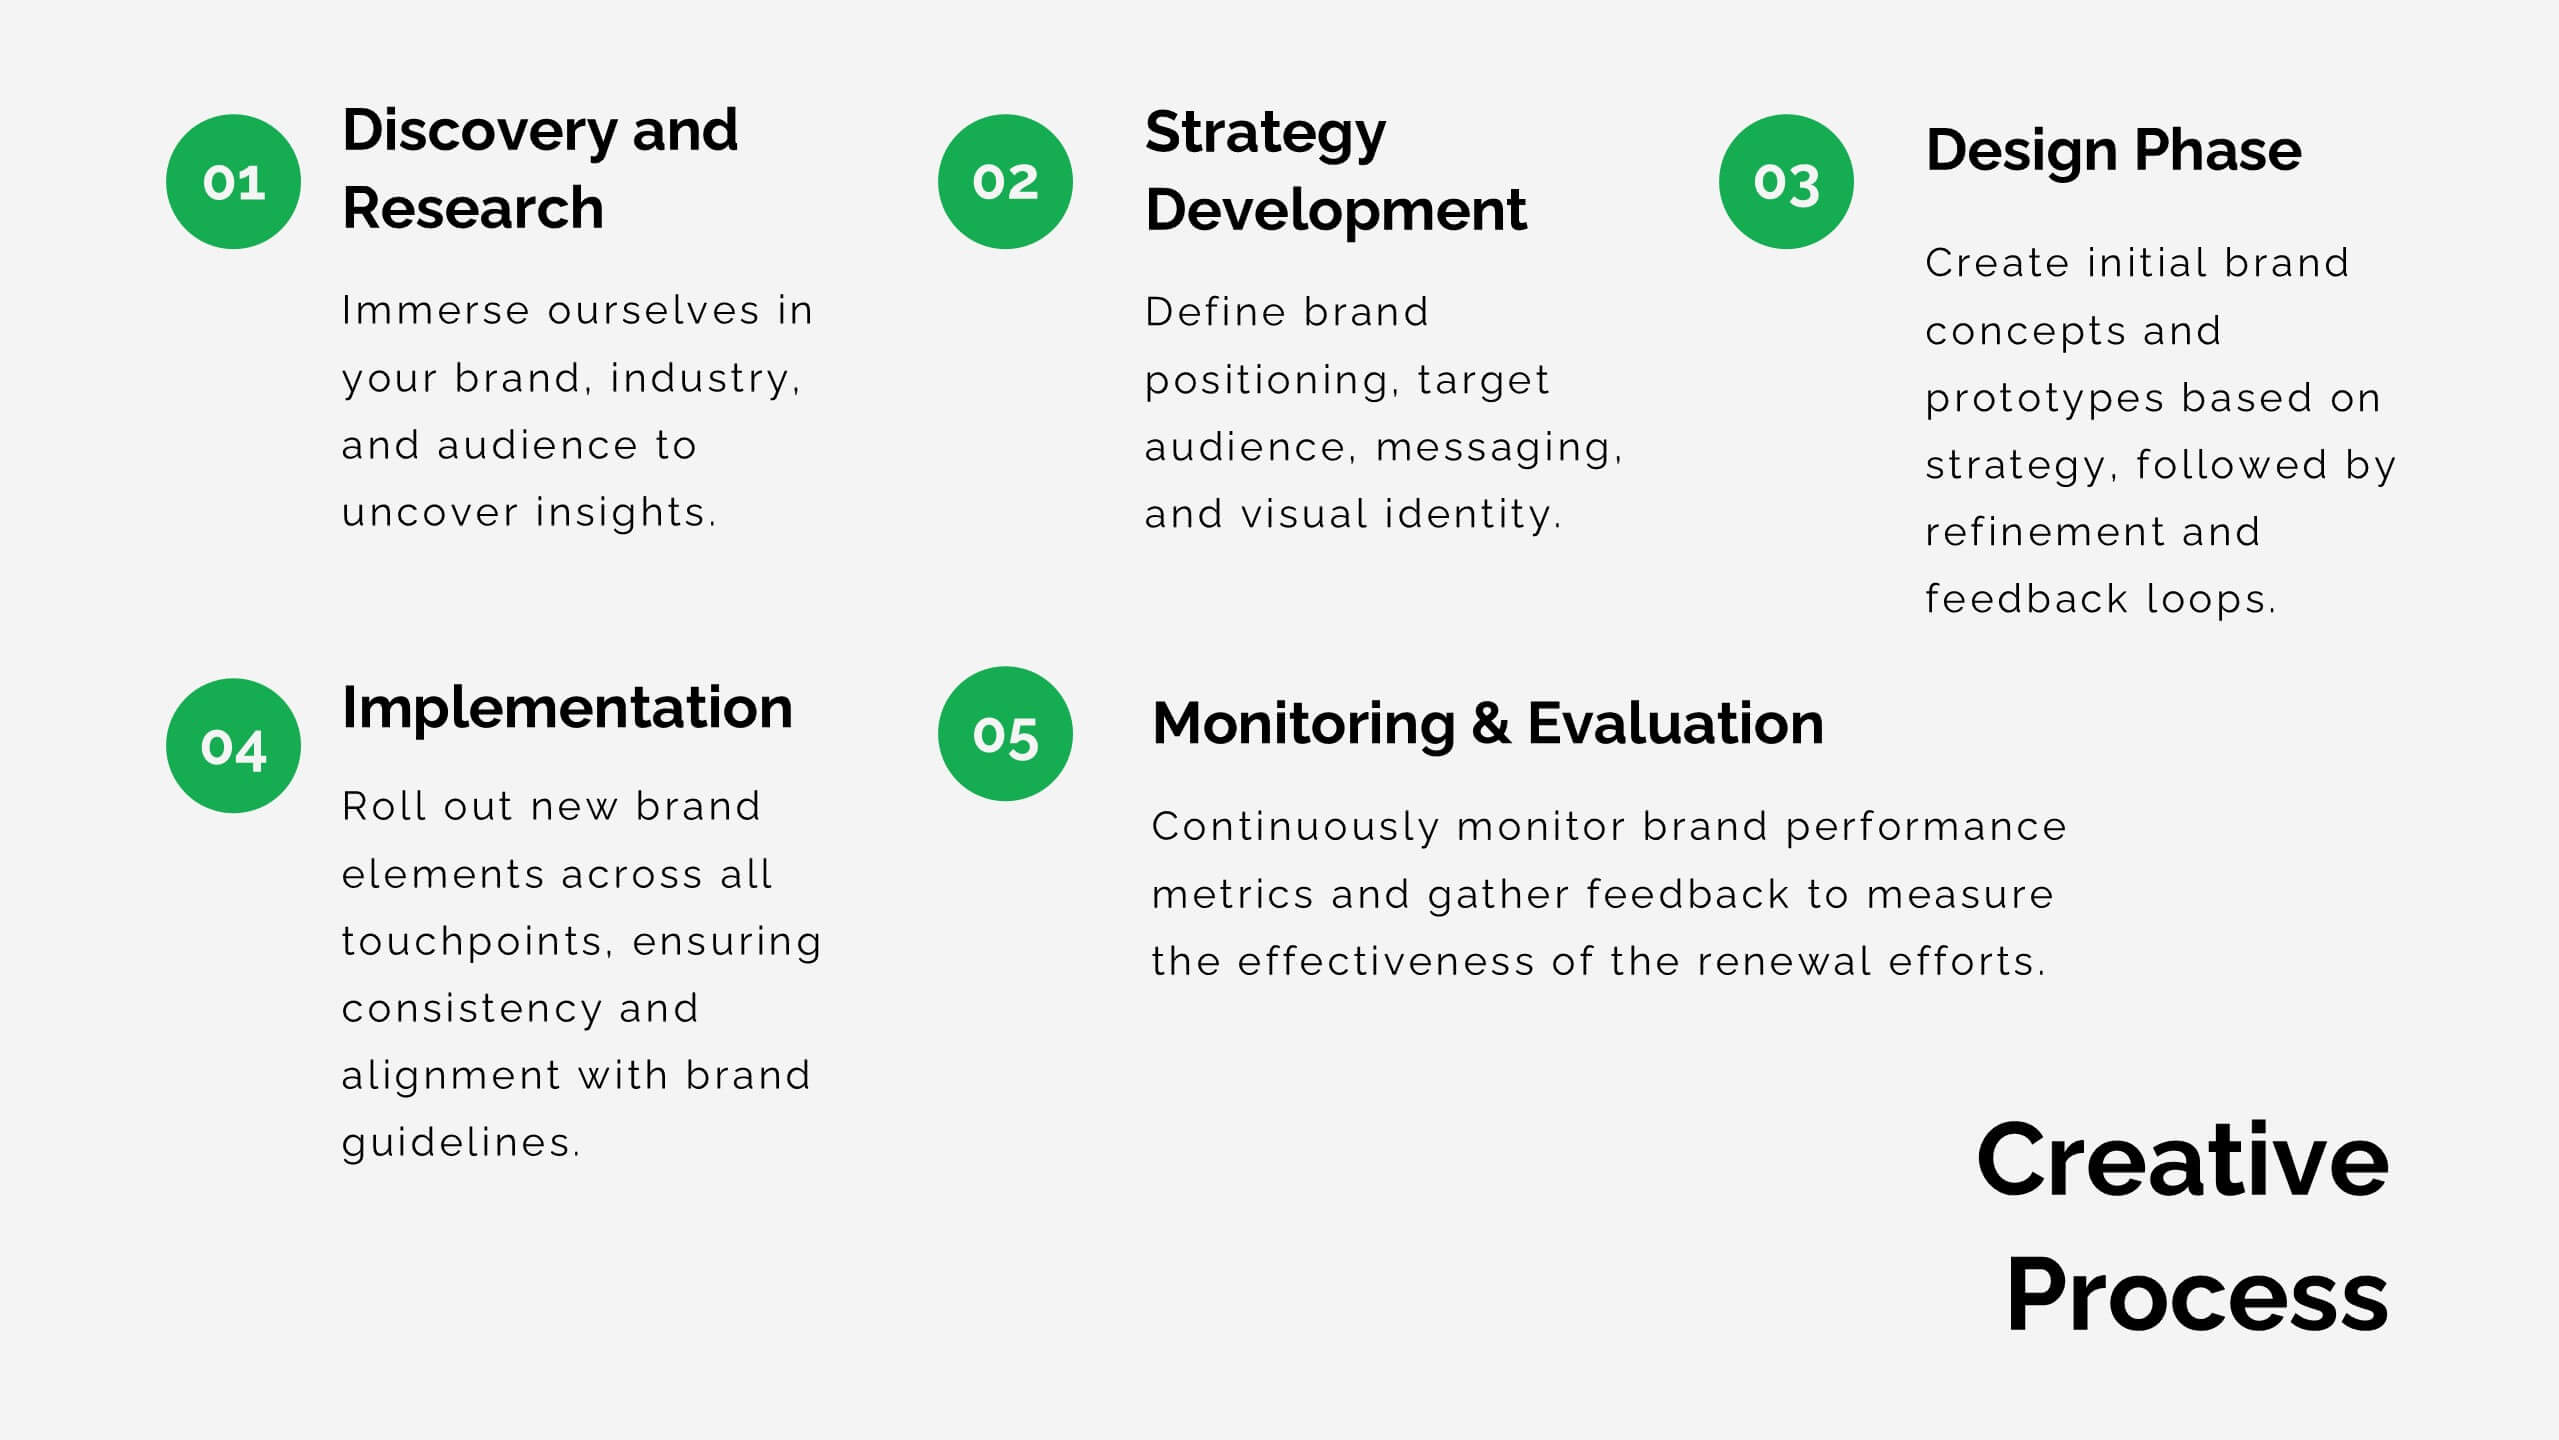
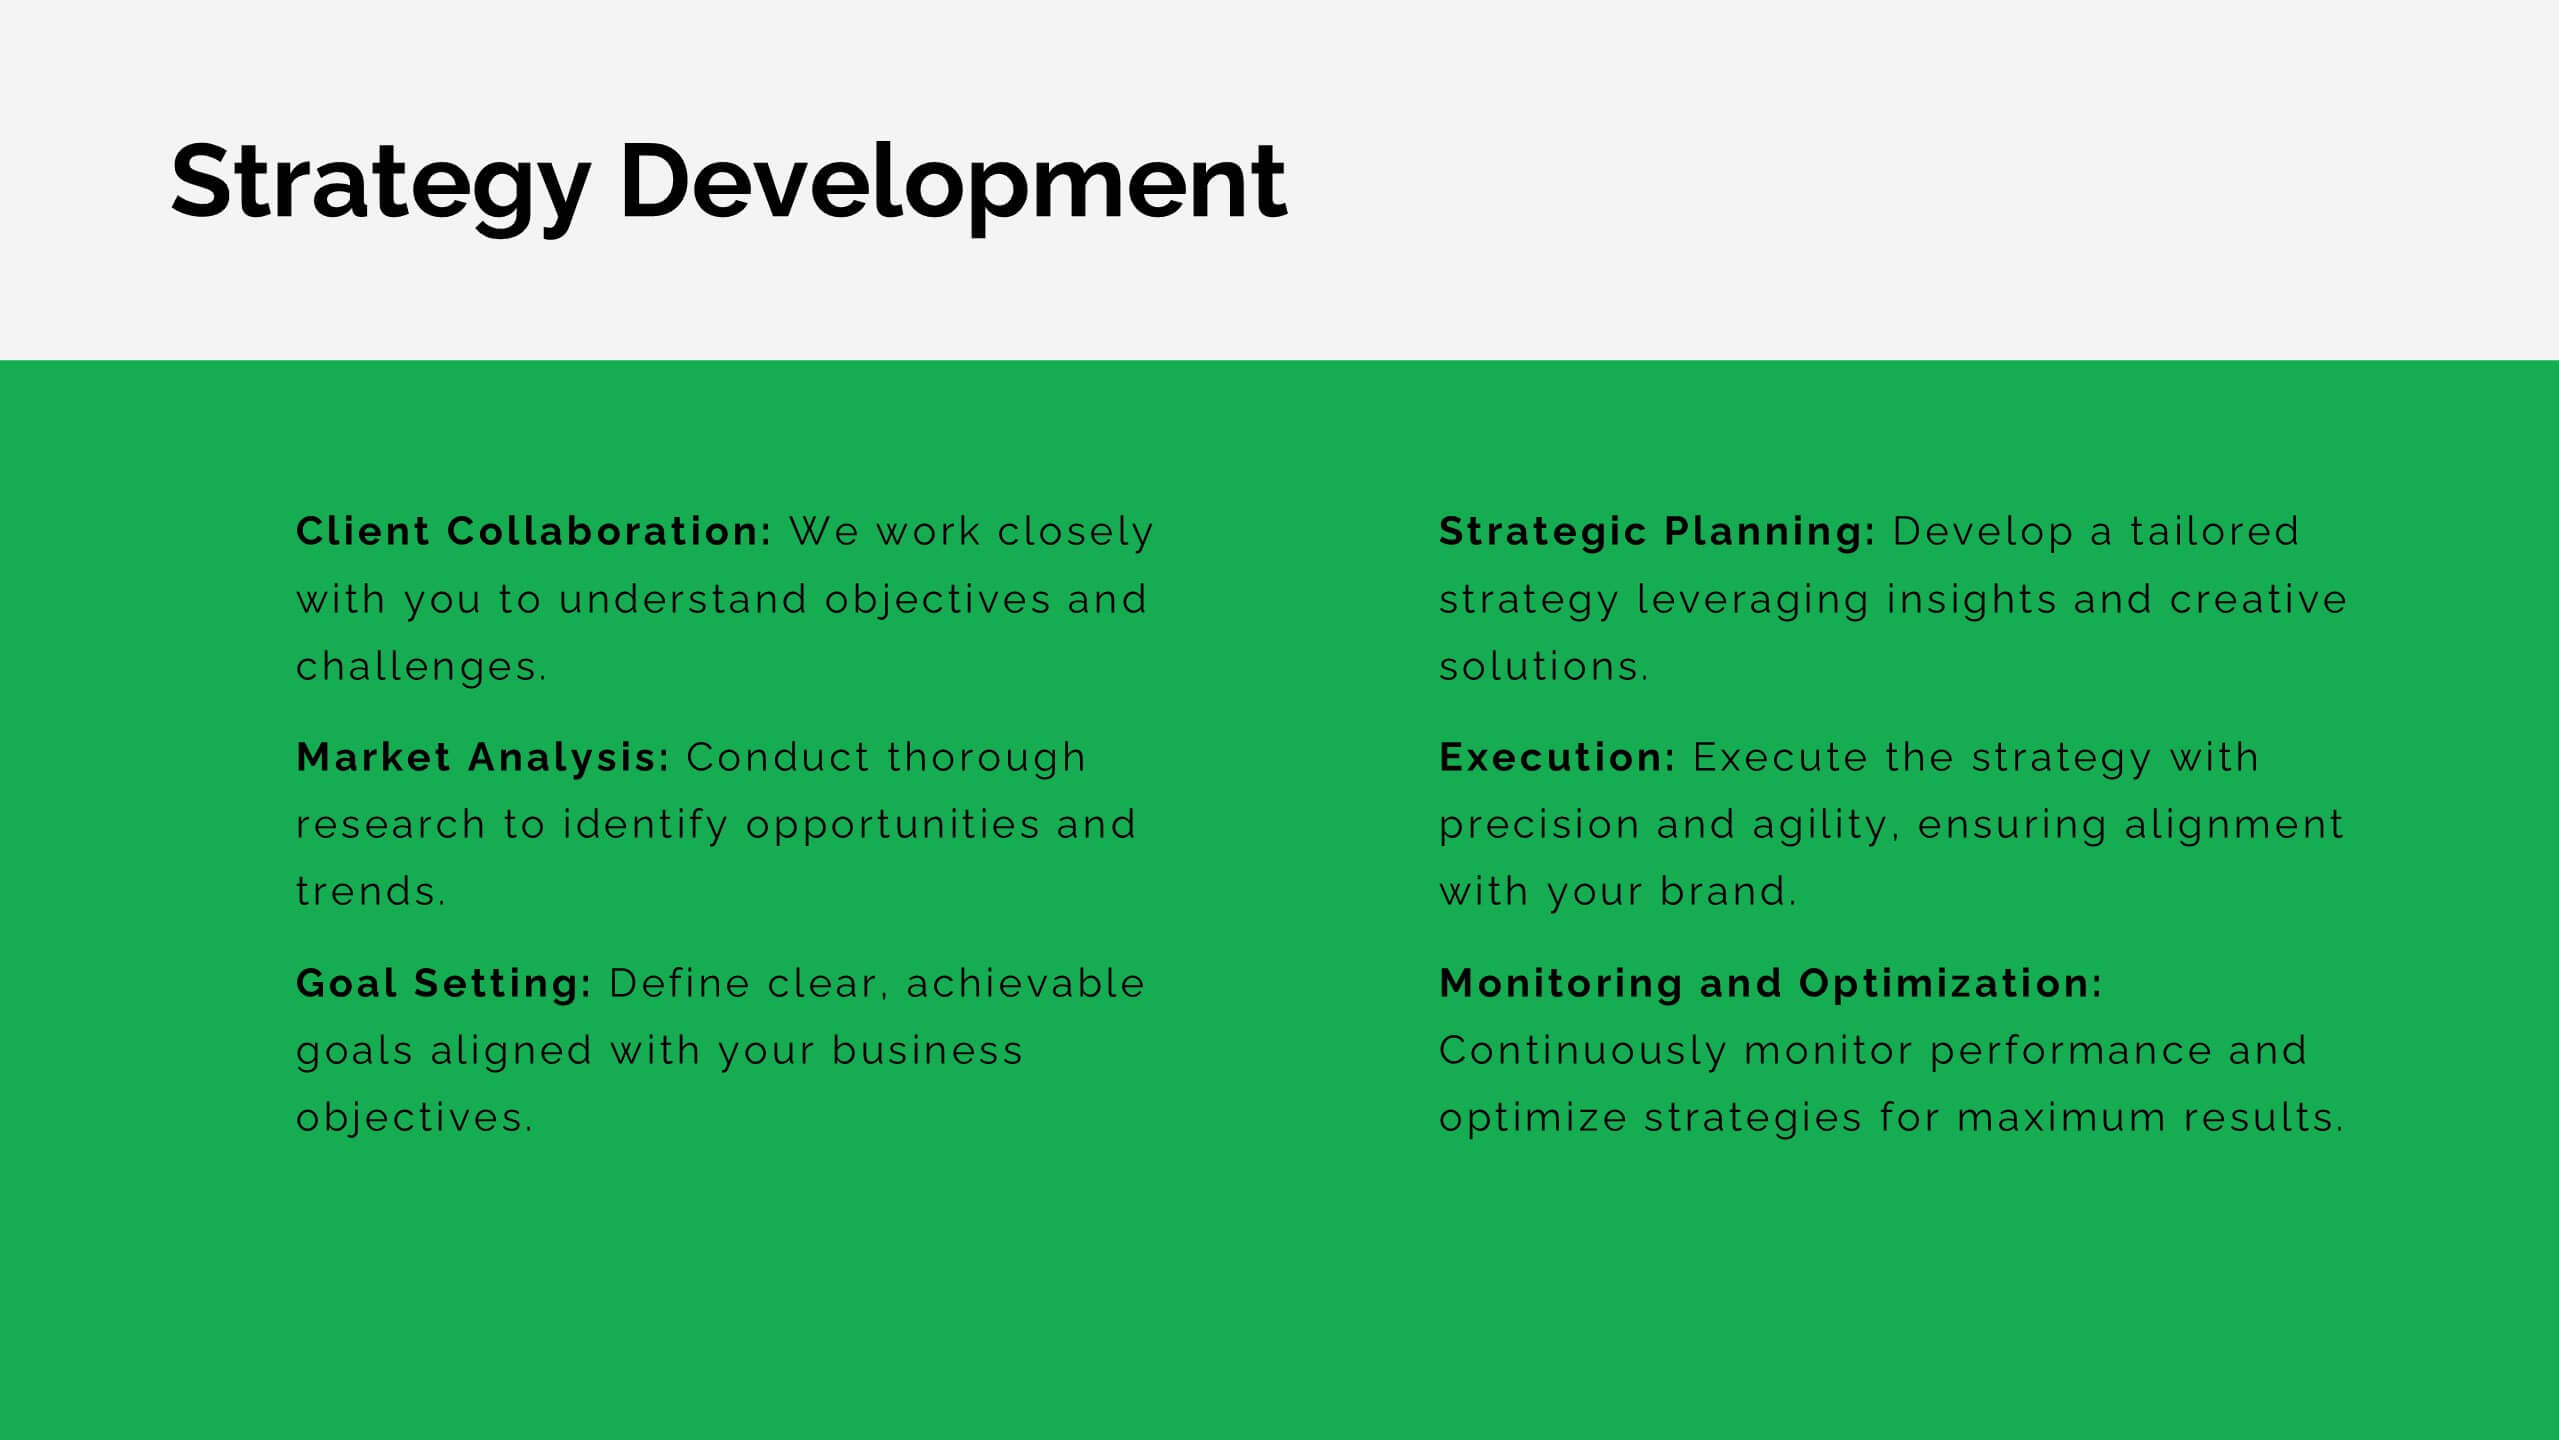
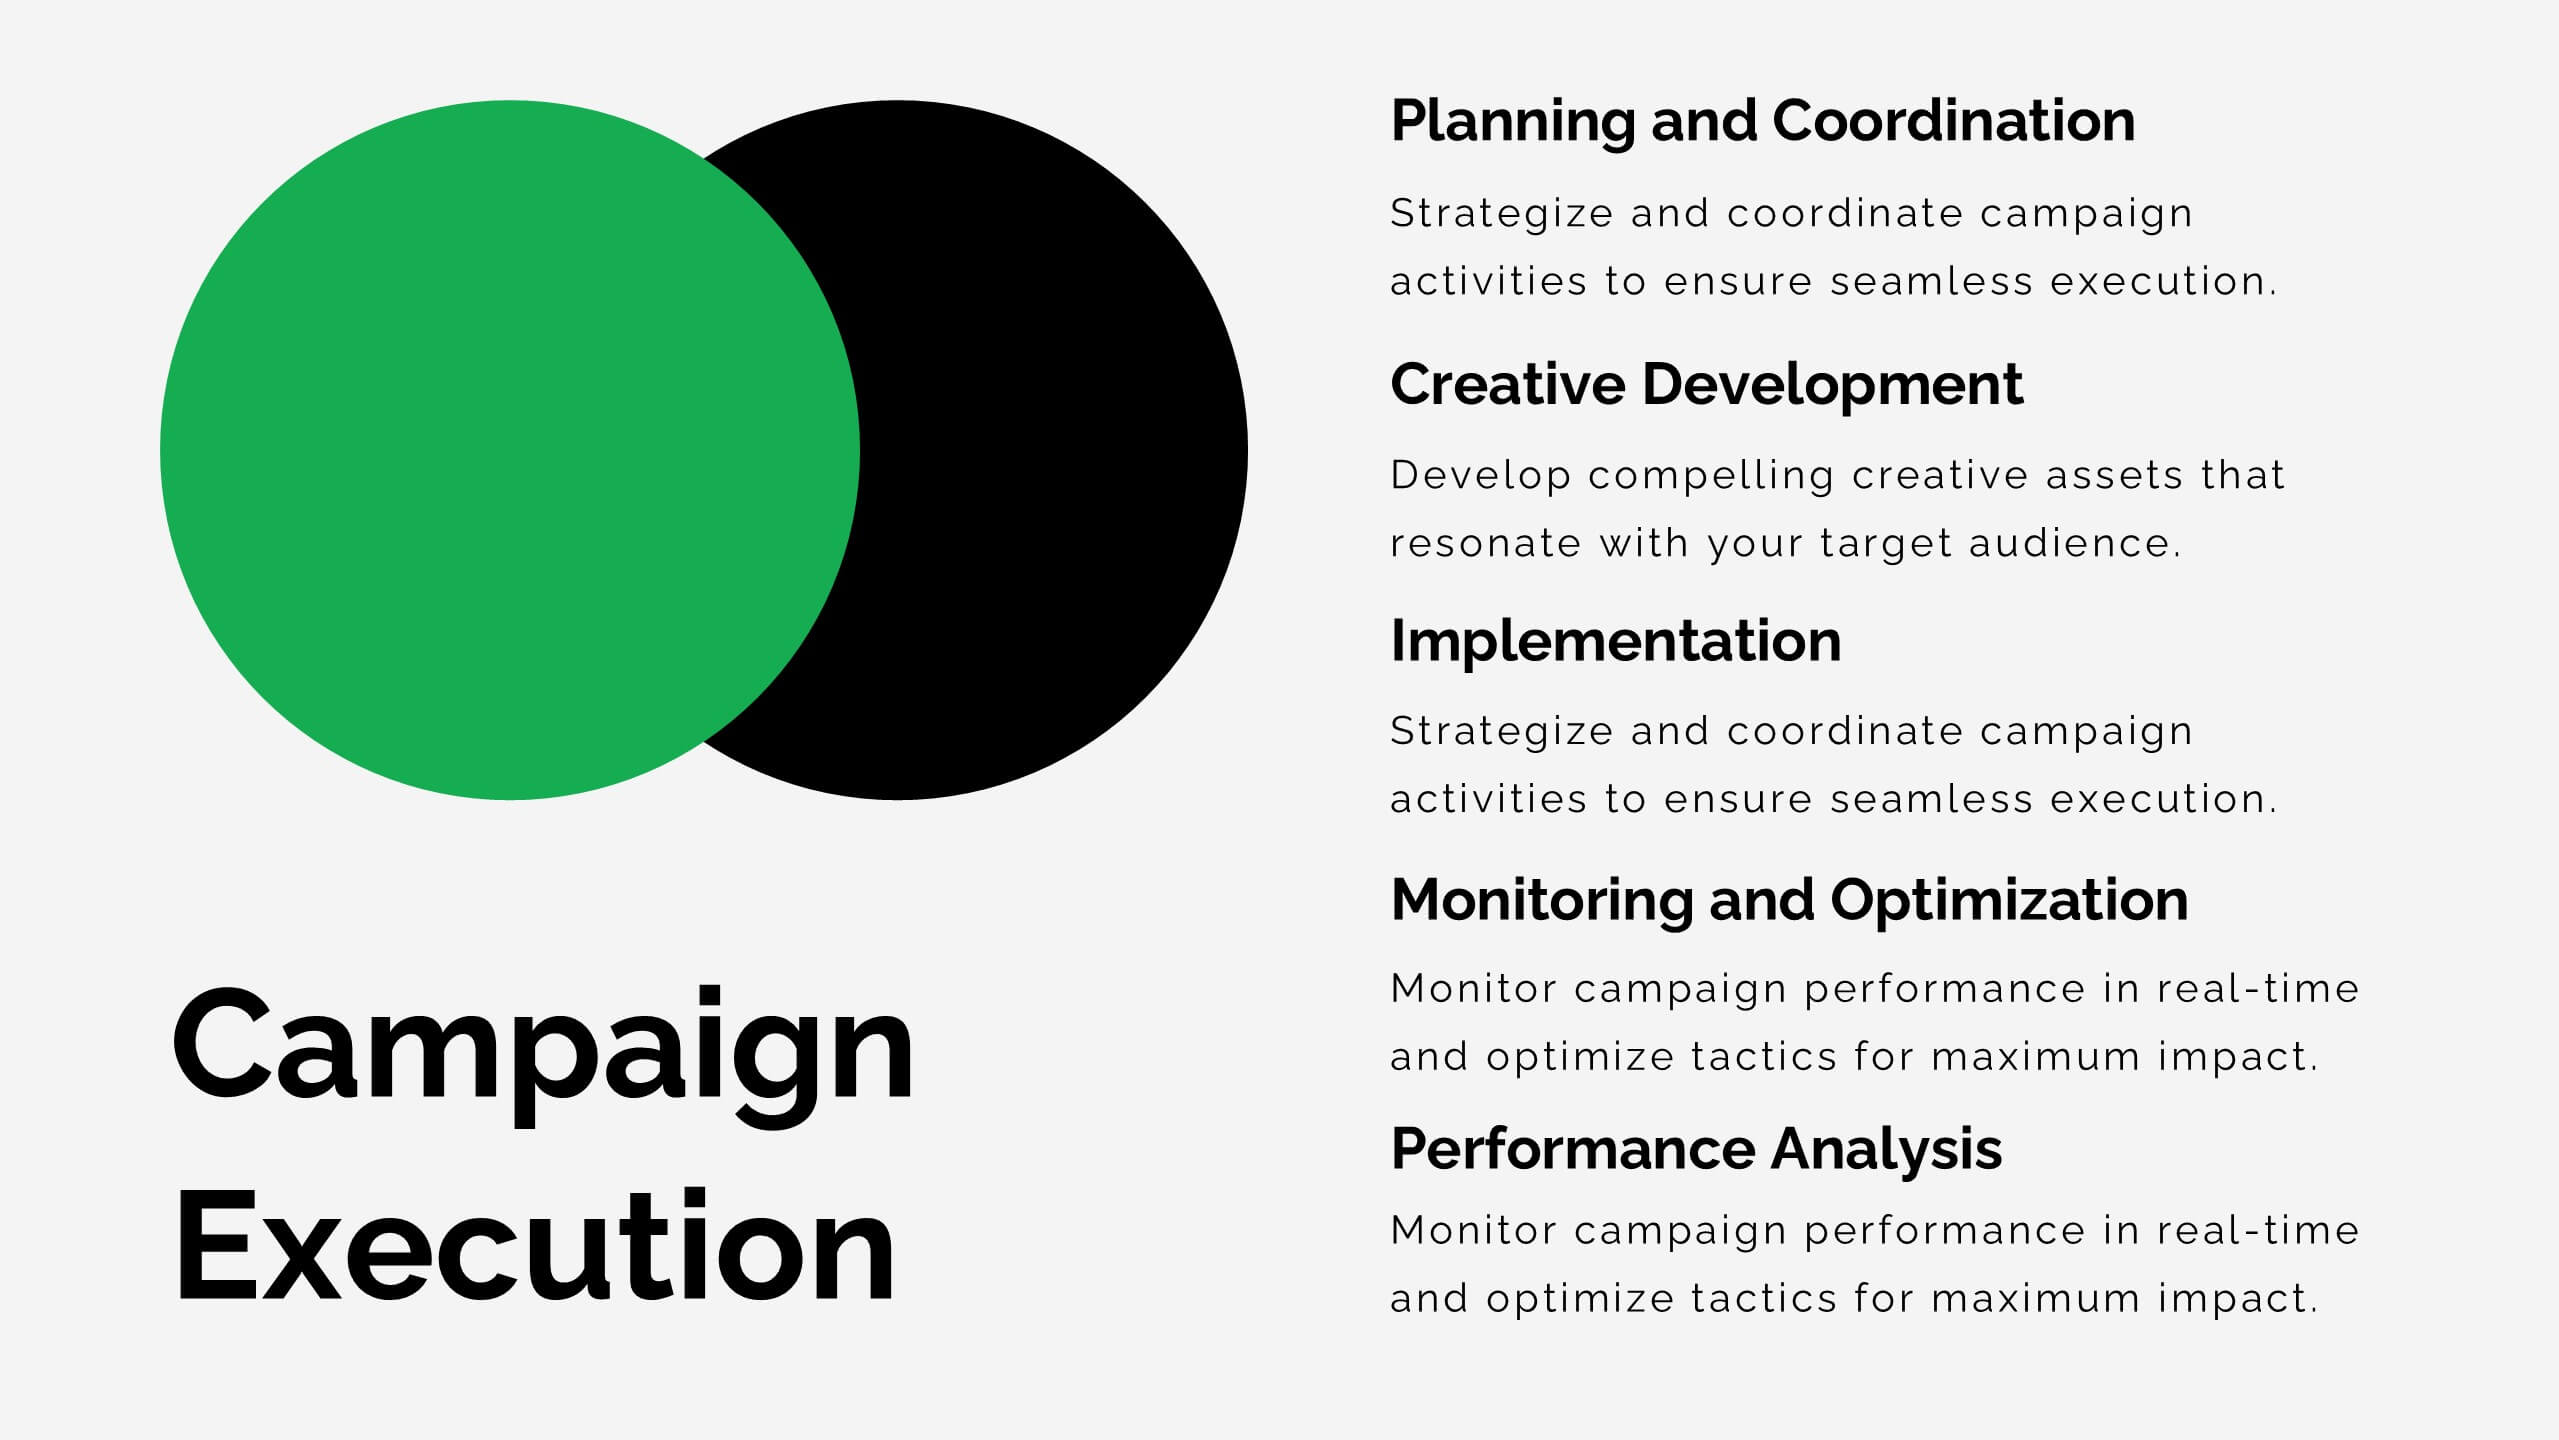
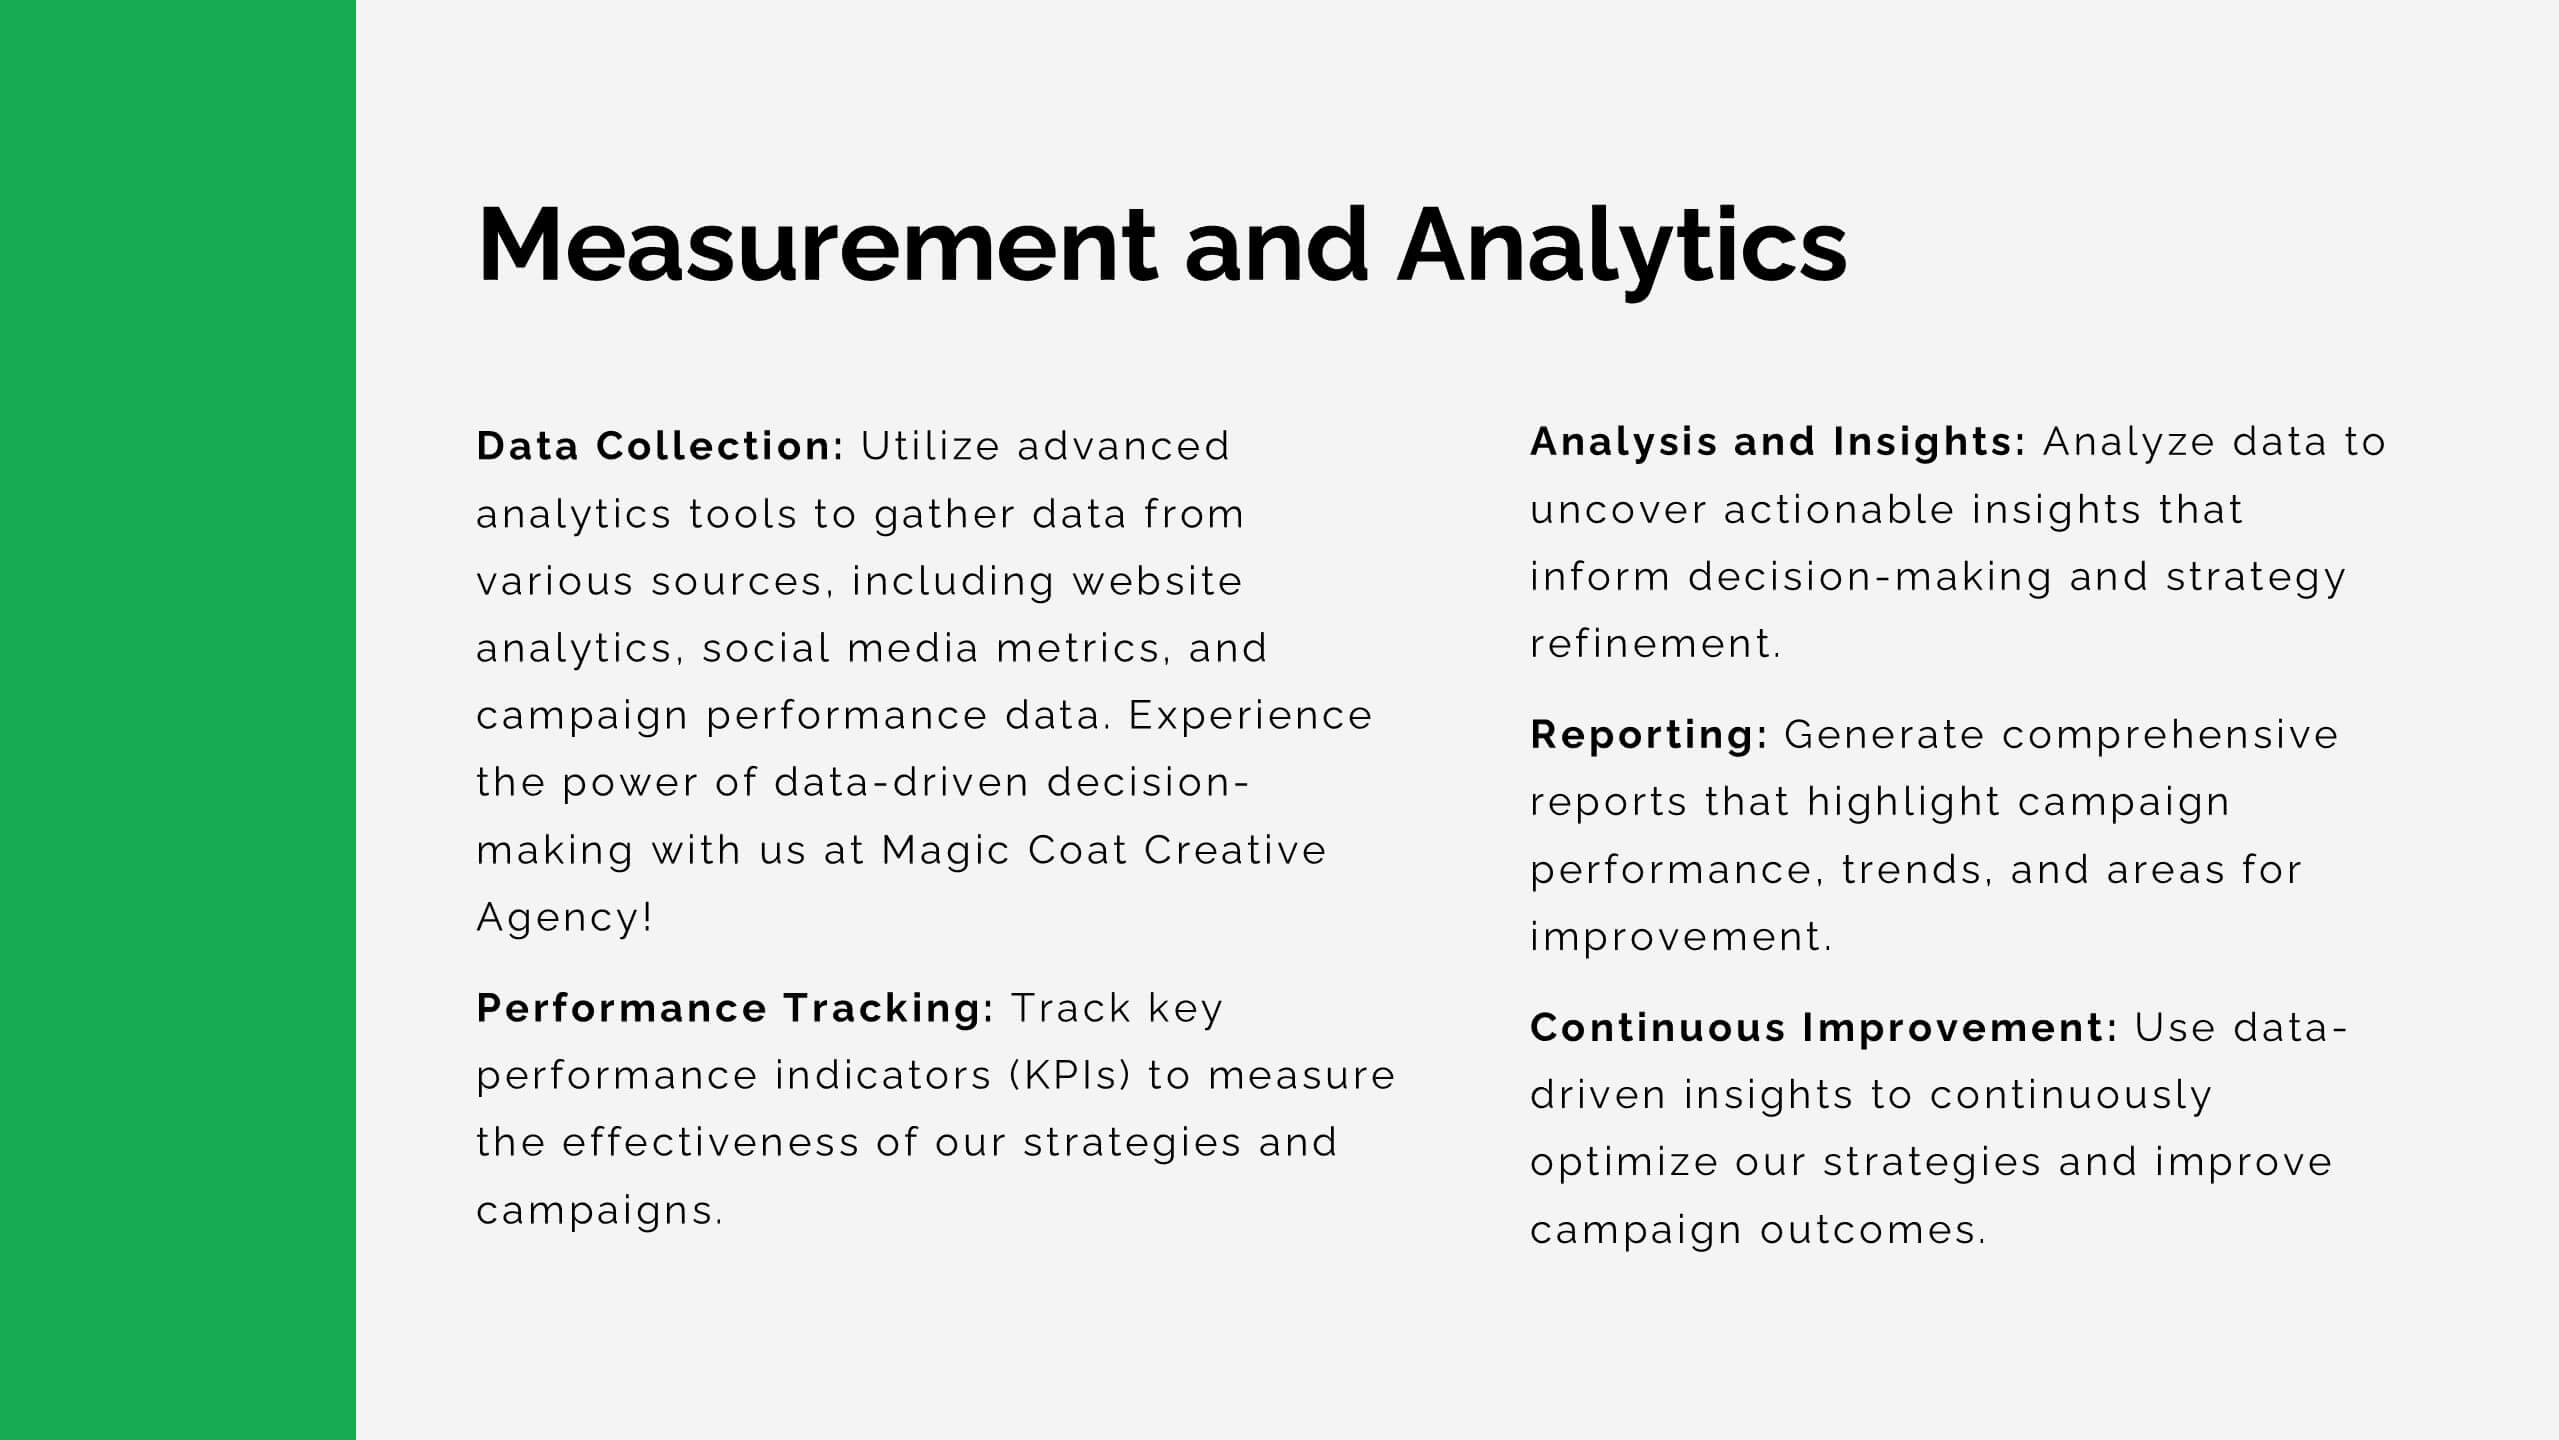
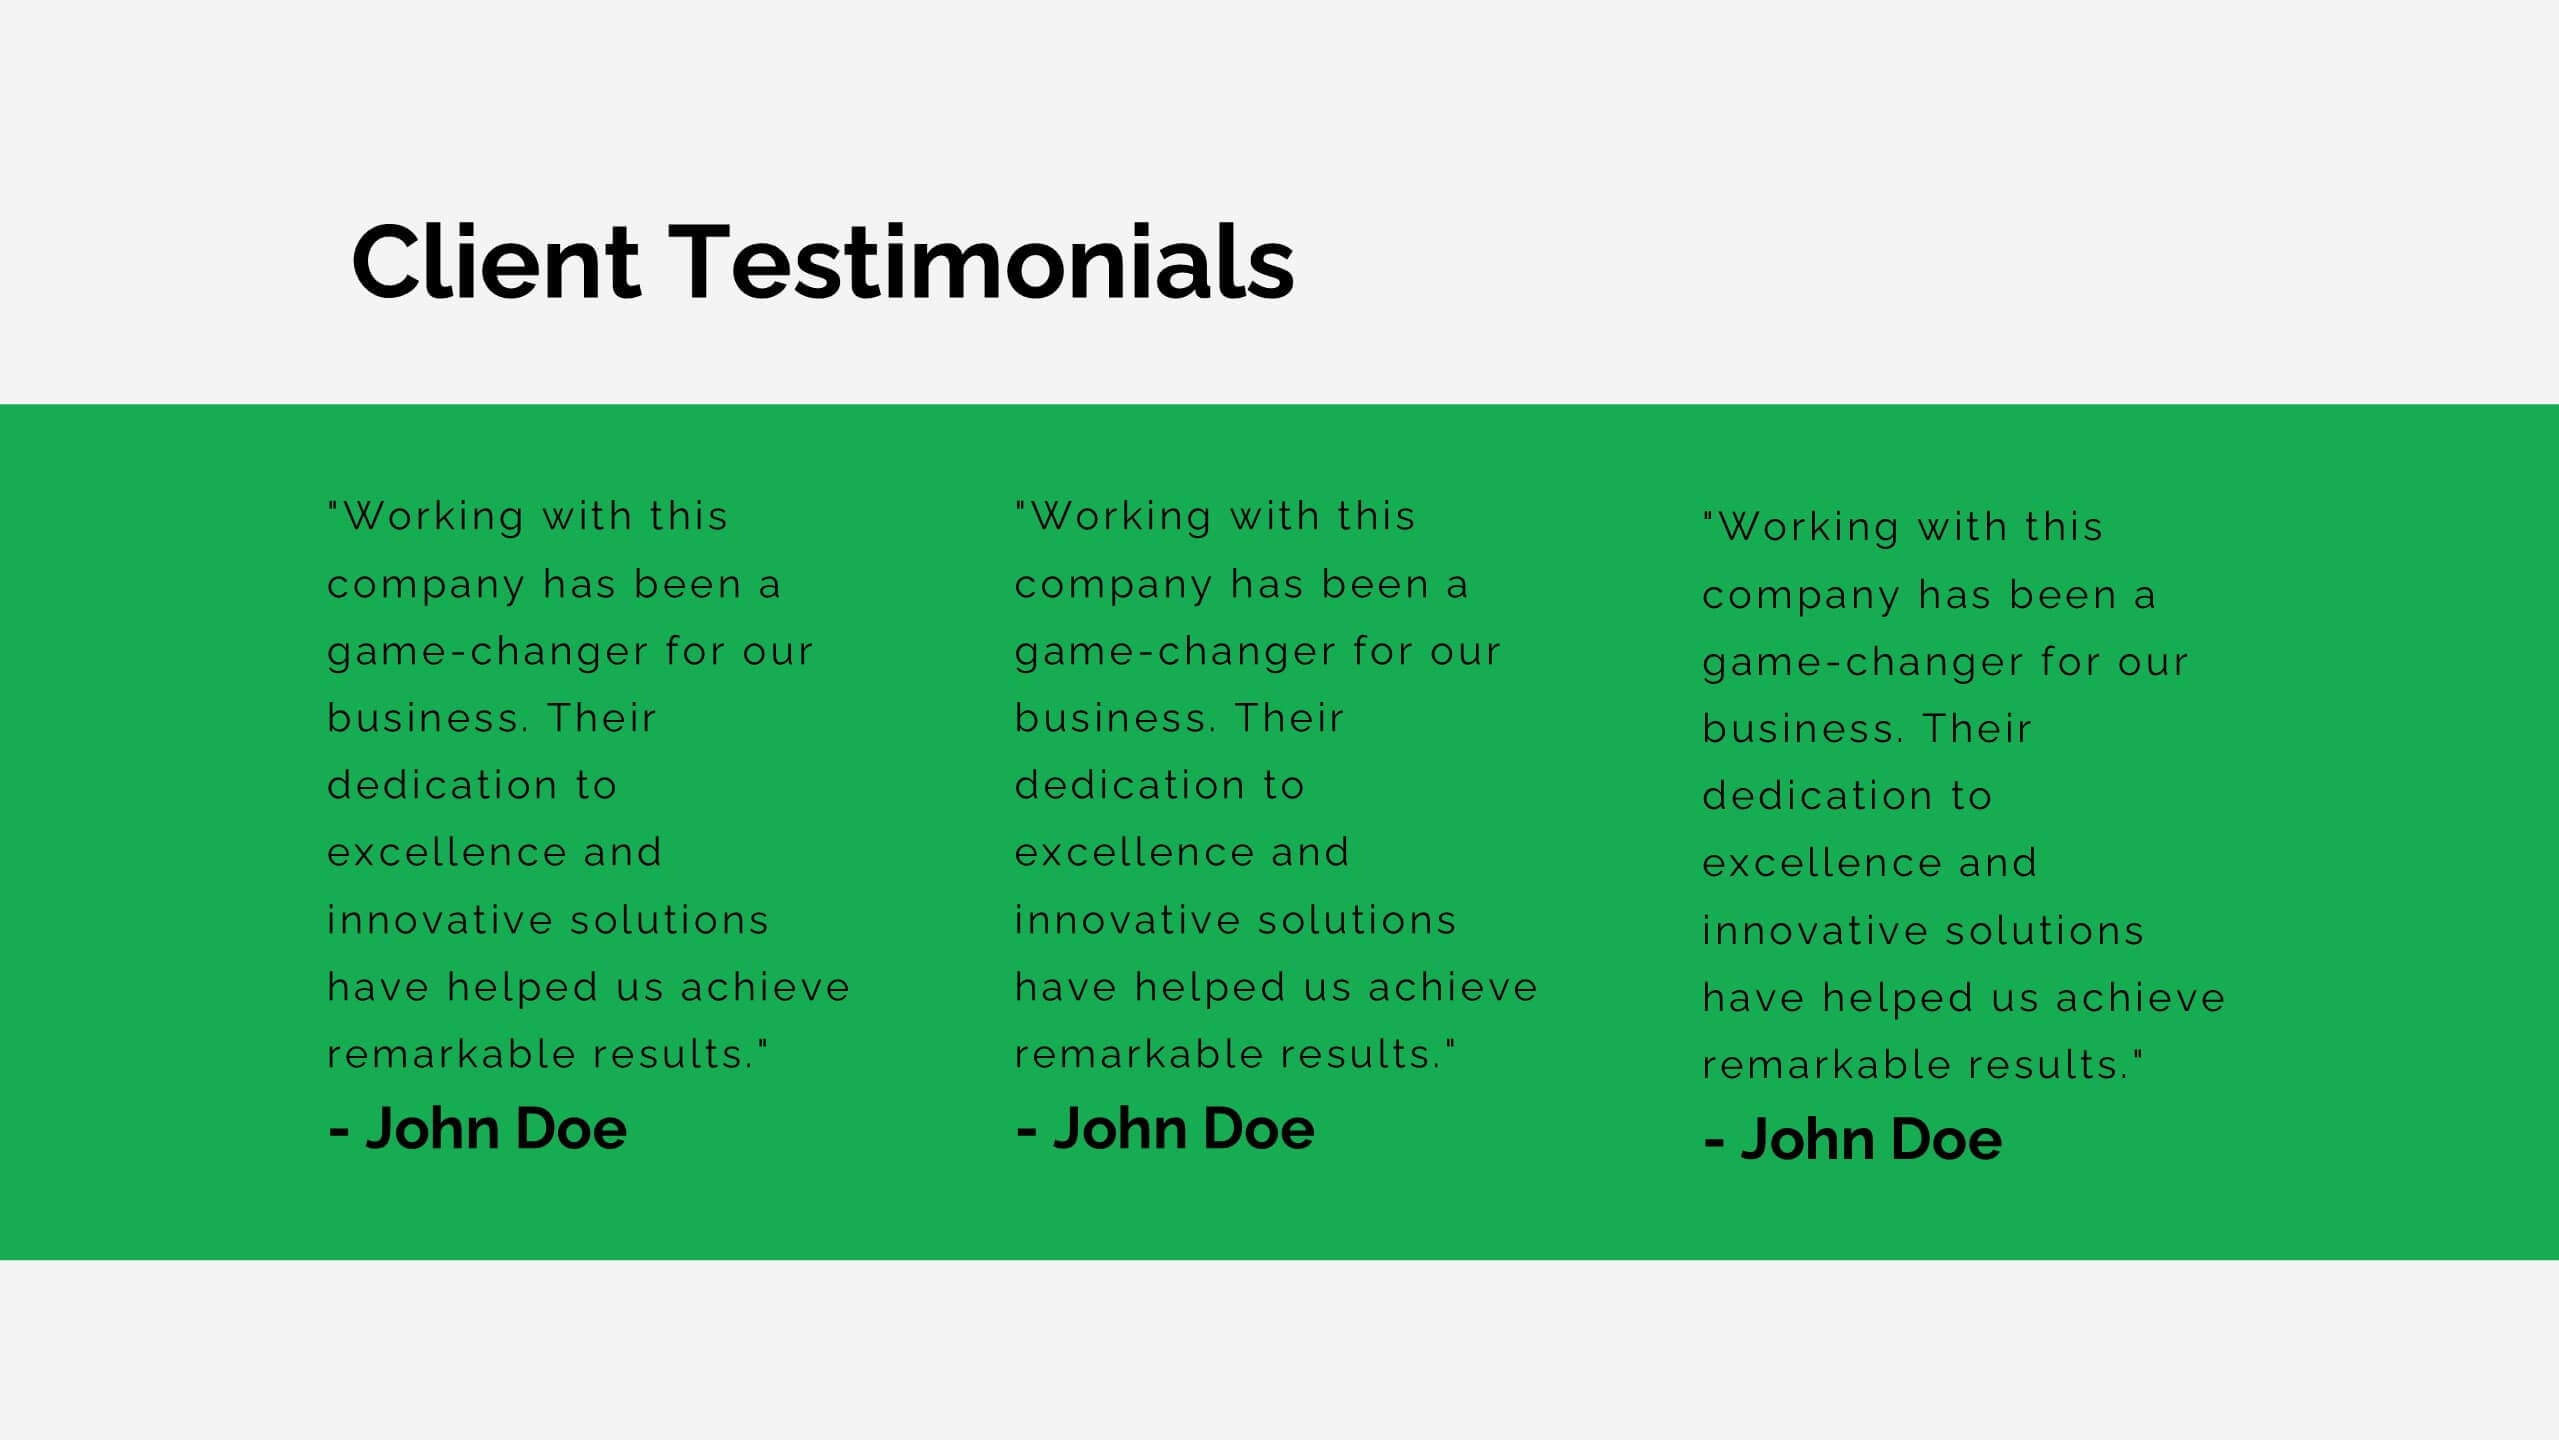
Lithium Advertising Agency Proposal Presentation
Elevate your advertising agency’s proposals with this sleek and modern template! It covers key areas like market analysis, case studies, client success stories, and campaign execution. Fully customizable, this template is perfect for presenting your agency’s services and strategies. Compatible with PowerPoint, Keynote, and Google Slides, it’s designed for impactful client presentations.


7 diapositivas
Industrial Safety Infographic
Industrial safety, also known as occupational safety, pertains to the management of processes and conditions within industrial settings to ensure the safety, health, and well-being of workers and the general public. This impactful infographic template encapsulates the essentials for fostering a secure and hazard-free industrial environment. Compatible with Powerpoint, Keynote, and Google Slides. The customizable set of icons represents emergency response actions, underlining the need for rapid and efficient responses in critical situations. Build a foundation of safety that fosters a secure and thriving work environment.


5 diapositivas
Market Economy Infographics
A market economy is an economic system where the production, distribution, and pricing of goods and services are determined by the interactions of individuals and businesses in the market. These vertical infographics are visually compelling design that explains the fundamental principles and characteristics of a market economy. This infographics is ideal for economists, business analysts, educators, and anyone looking to educate others about how market economies work and their impact on society. The infographics incorporate relevant statistics and data to support the information presented. Compatible with Powerpoint, Keynote, and Google Slides.


5 diapositivas
5-Year Strategic Roadmap Slide Presentation
Take your audience on a dynamic journey with a flowing, milestone-based layout that makes long-term planning feel clear and engaging. This presentation helps you map out goals, priorities, and key initiatives across five years with structure and clarity. Ideal for strategy meetings and planning sessions. Fully compatible with PowerPoint, Keynote, and Google Slides.


4 diapositivas
Editable Cause and Effect Diagram Presentation
Bring clarity to every insight with a bold visual layout that makes connections between actions and outcomes easy to follow. This presentation helps you explain root causes, outline impacts, and guide decision-making with clean, structured graphics. Ideal for reports, planning, and analysis. Fully compatible with PowerPoint, Keynote, and Google Slides.


4 diapositivas
Construction Project Planning
Streamline your workflow and improve clarity with this vibrant project planning wheel designed for construction professionals. This slide helps visualize key phases—such as planning, team coordination, and logistics—using color-coded segments and editable icons. Perfect for architects, contractors, and project managers. Fully customizable in PowerPoint, Keynote, and Google Slides.


2 diapositivas
Thank You Page for Final Impressions Presentation
Leave a lasting impression with a bold, modern layout that speaks professionalism and clarity. This presentation template is designed to wrap up your message with impact, offering space for contact details and a short message of appreciation. It’s fully editable and works seamlessly in PowerPoint, Keynote, and Google Slides.


5 diapositivas
Business Decision-Making Questions
Streamline critical thinking with this interactive Business Decision-Making Questions template. Featuring a creative circular diagram and visual cues, it helps structure questions around options, evaluations, and outcomes. Ideal for brainstorming, strategic planning, and executive decision sessions. Fully editable in PowerPoint, Keynote, and Google Slides.


6 diapositivas
Session-by-Session Agenda Breakdown Presentation
Easily outline and compare multiple sessions with this Session-by-Session Agenda Breakdown presentation. Designed to group agenda topics and supplementary content side by side, this layout is perfect for workshops, summits, or recurring meetings. Fully editable in Canva, PowerPoint, and Google Slides for seamless branding and customization.


7 diapositivas
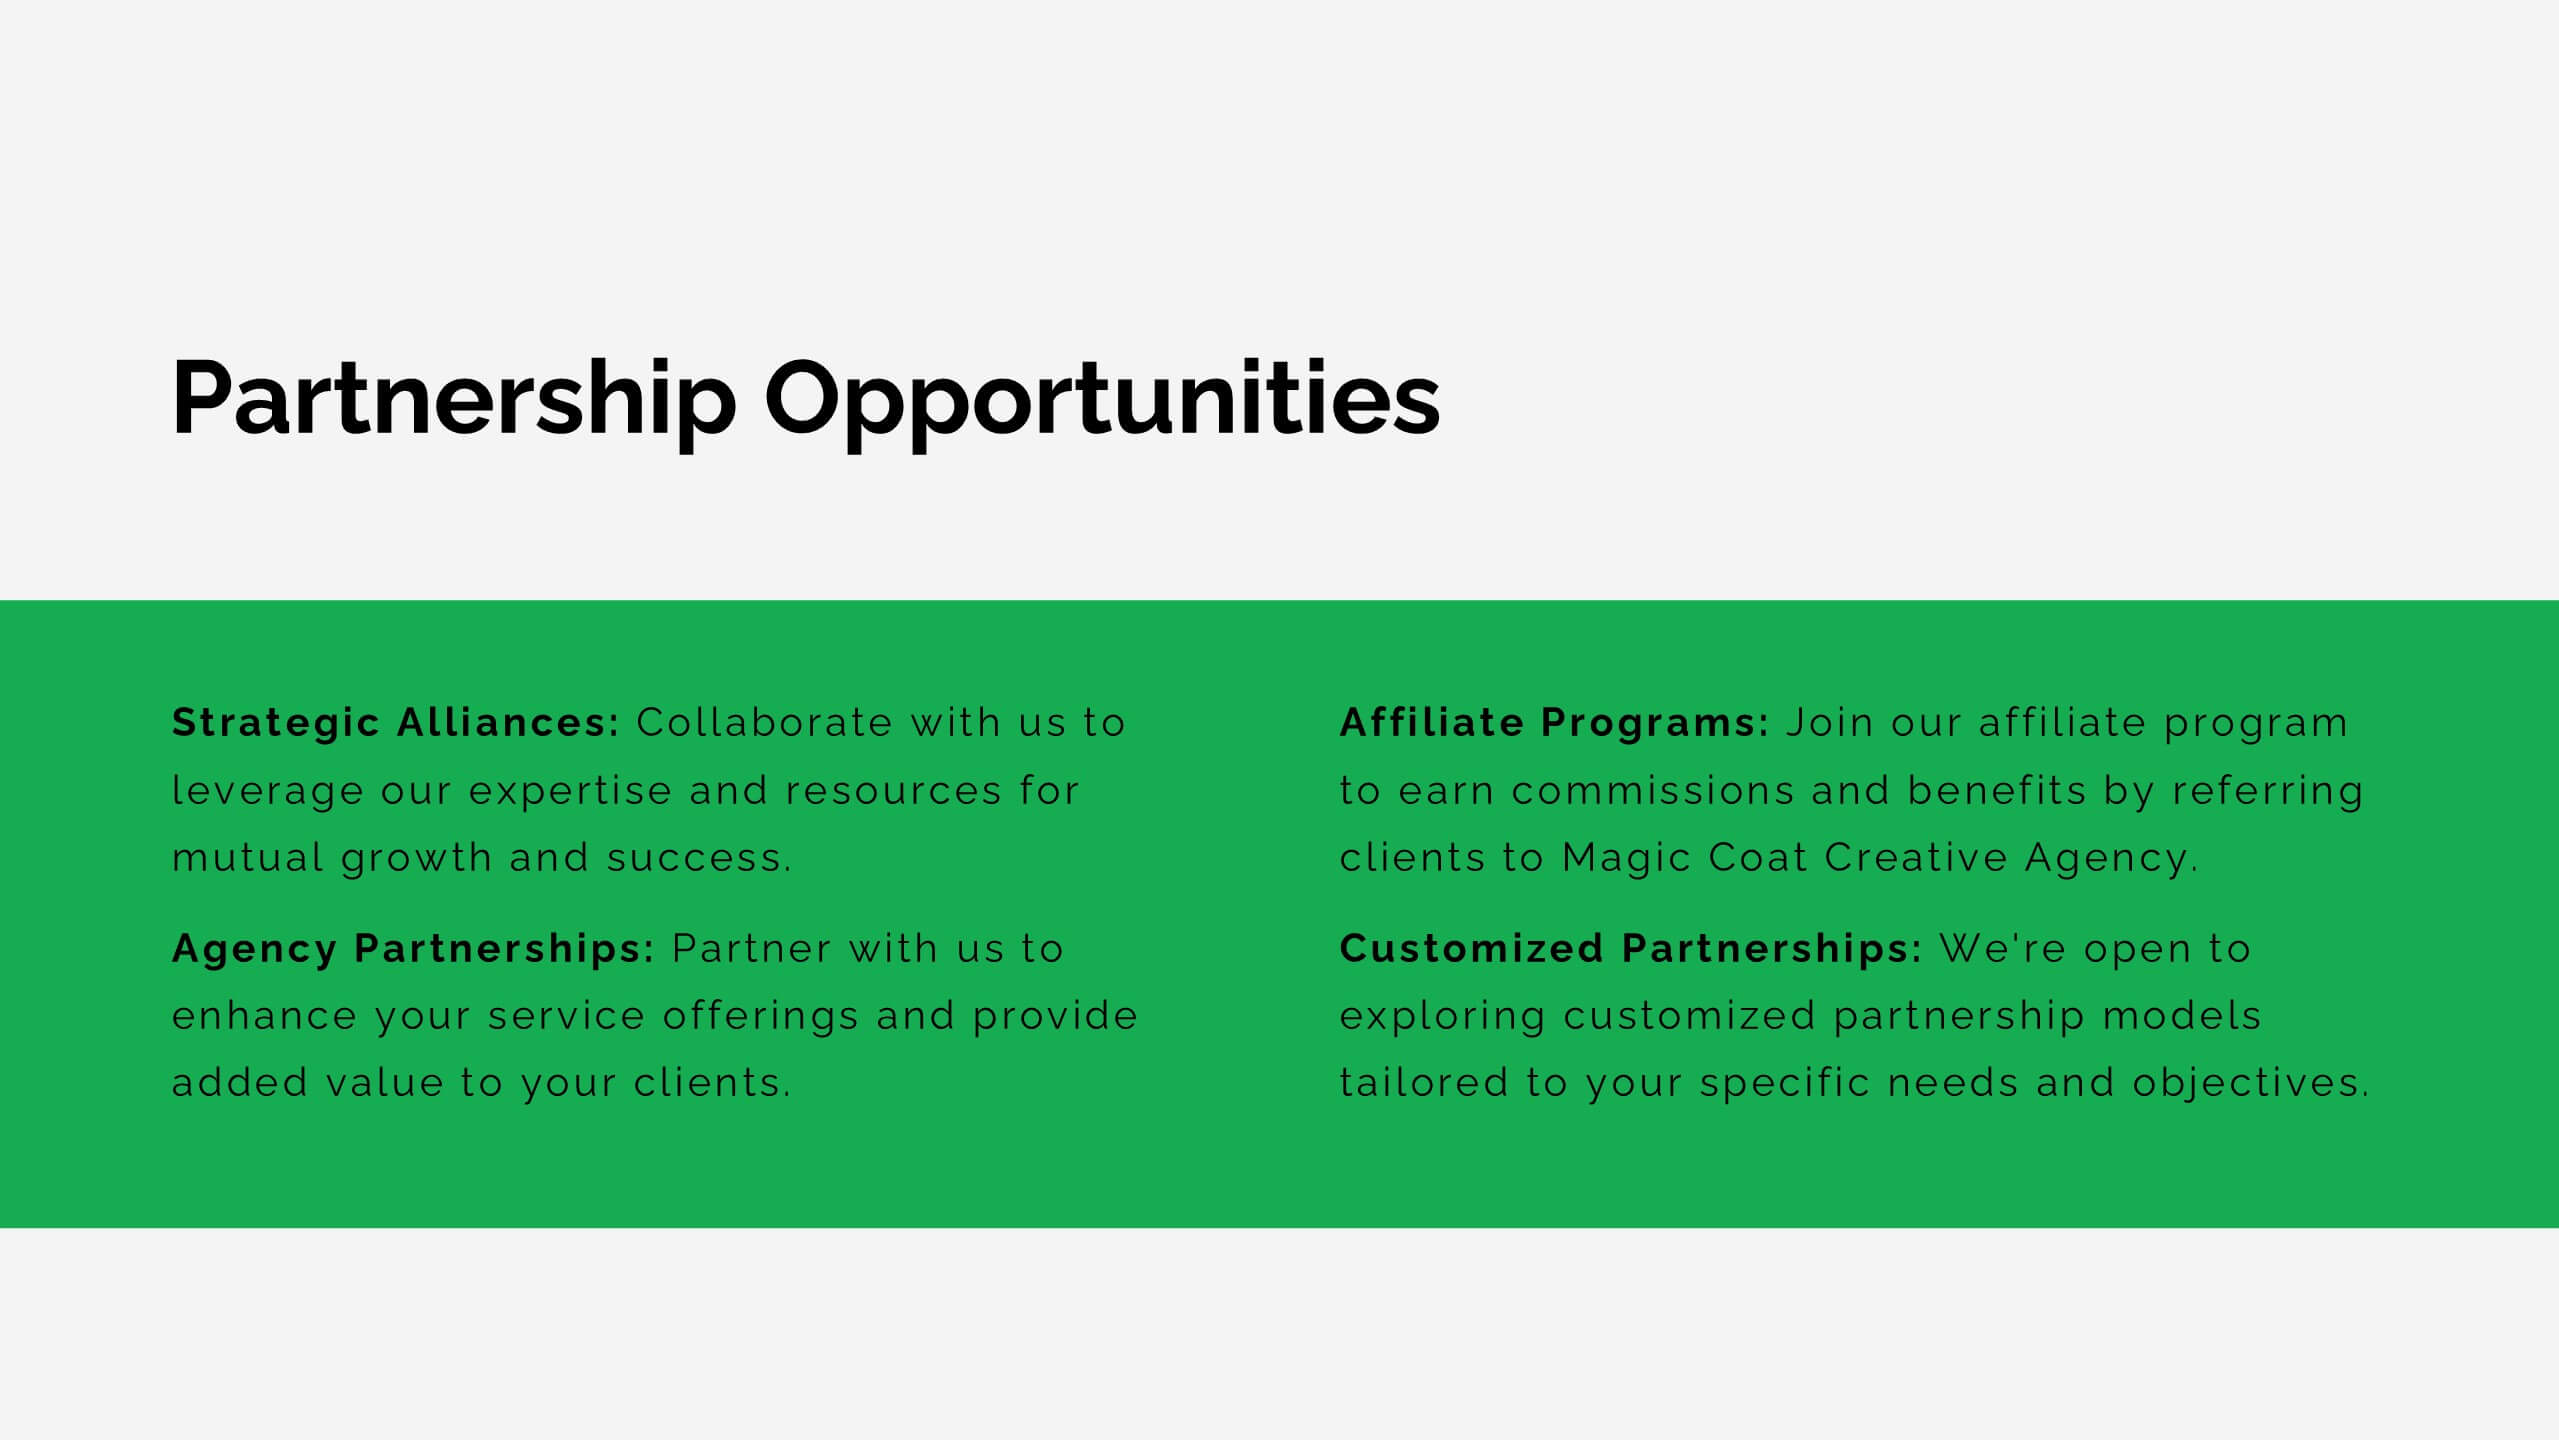
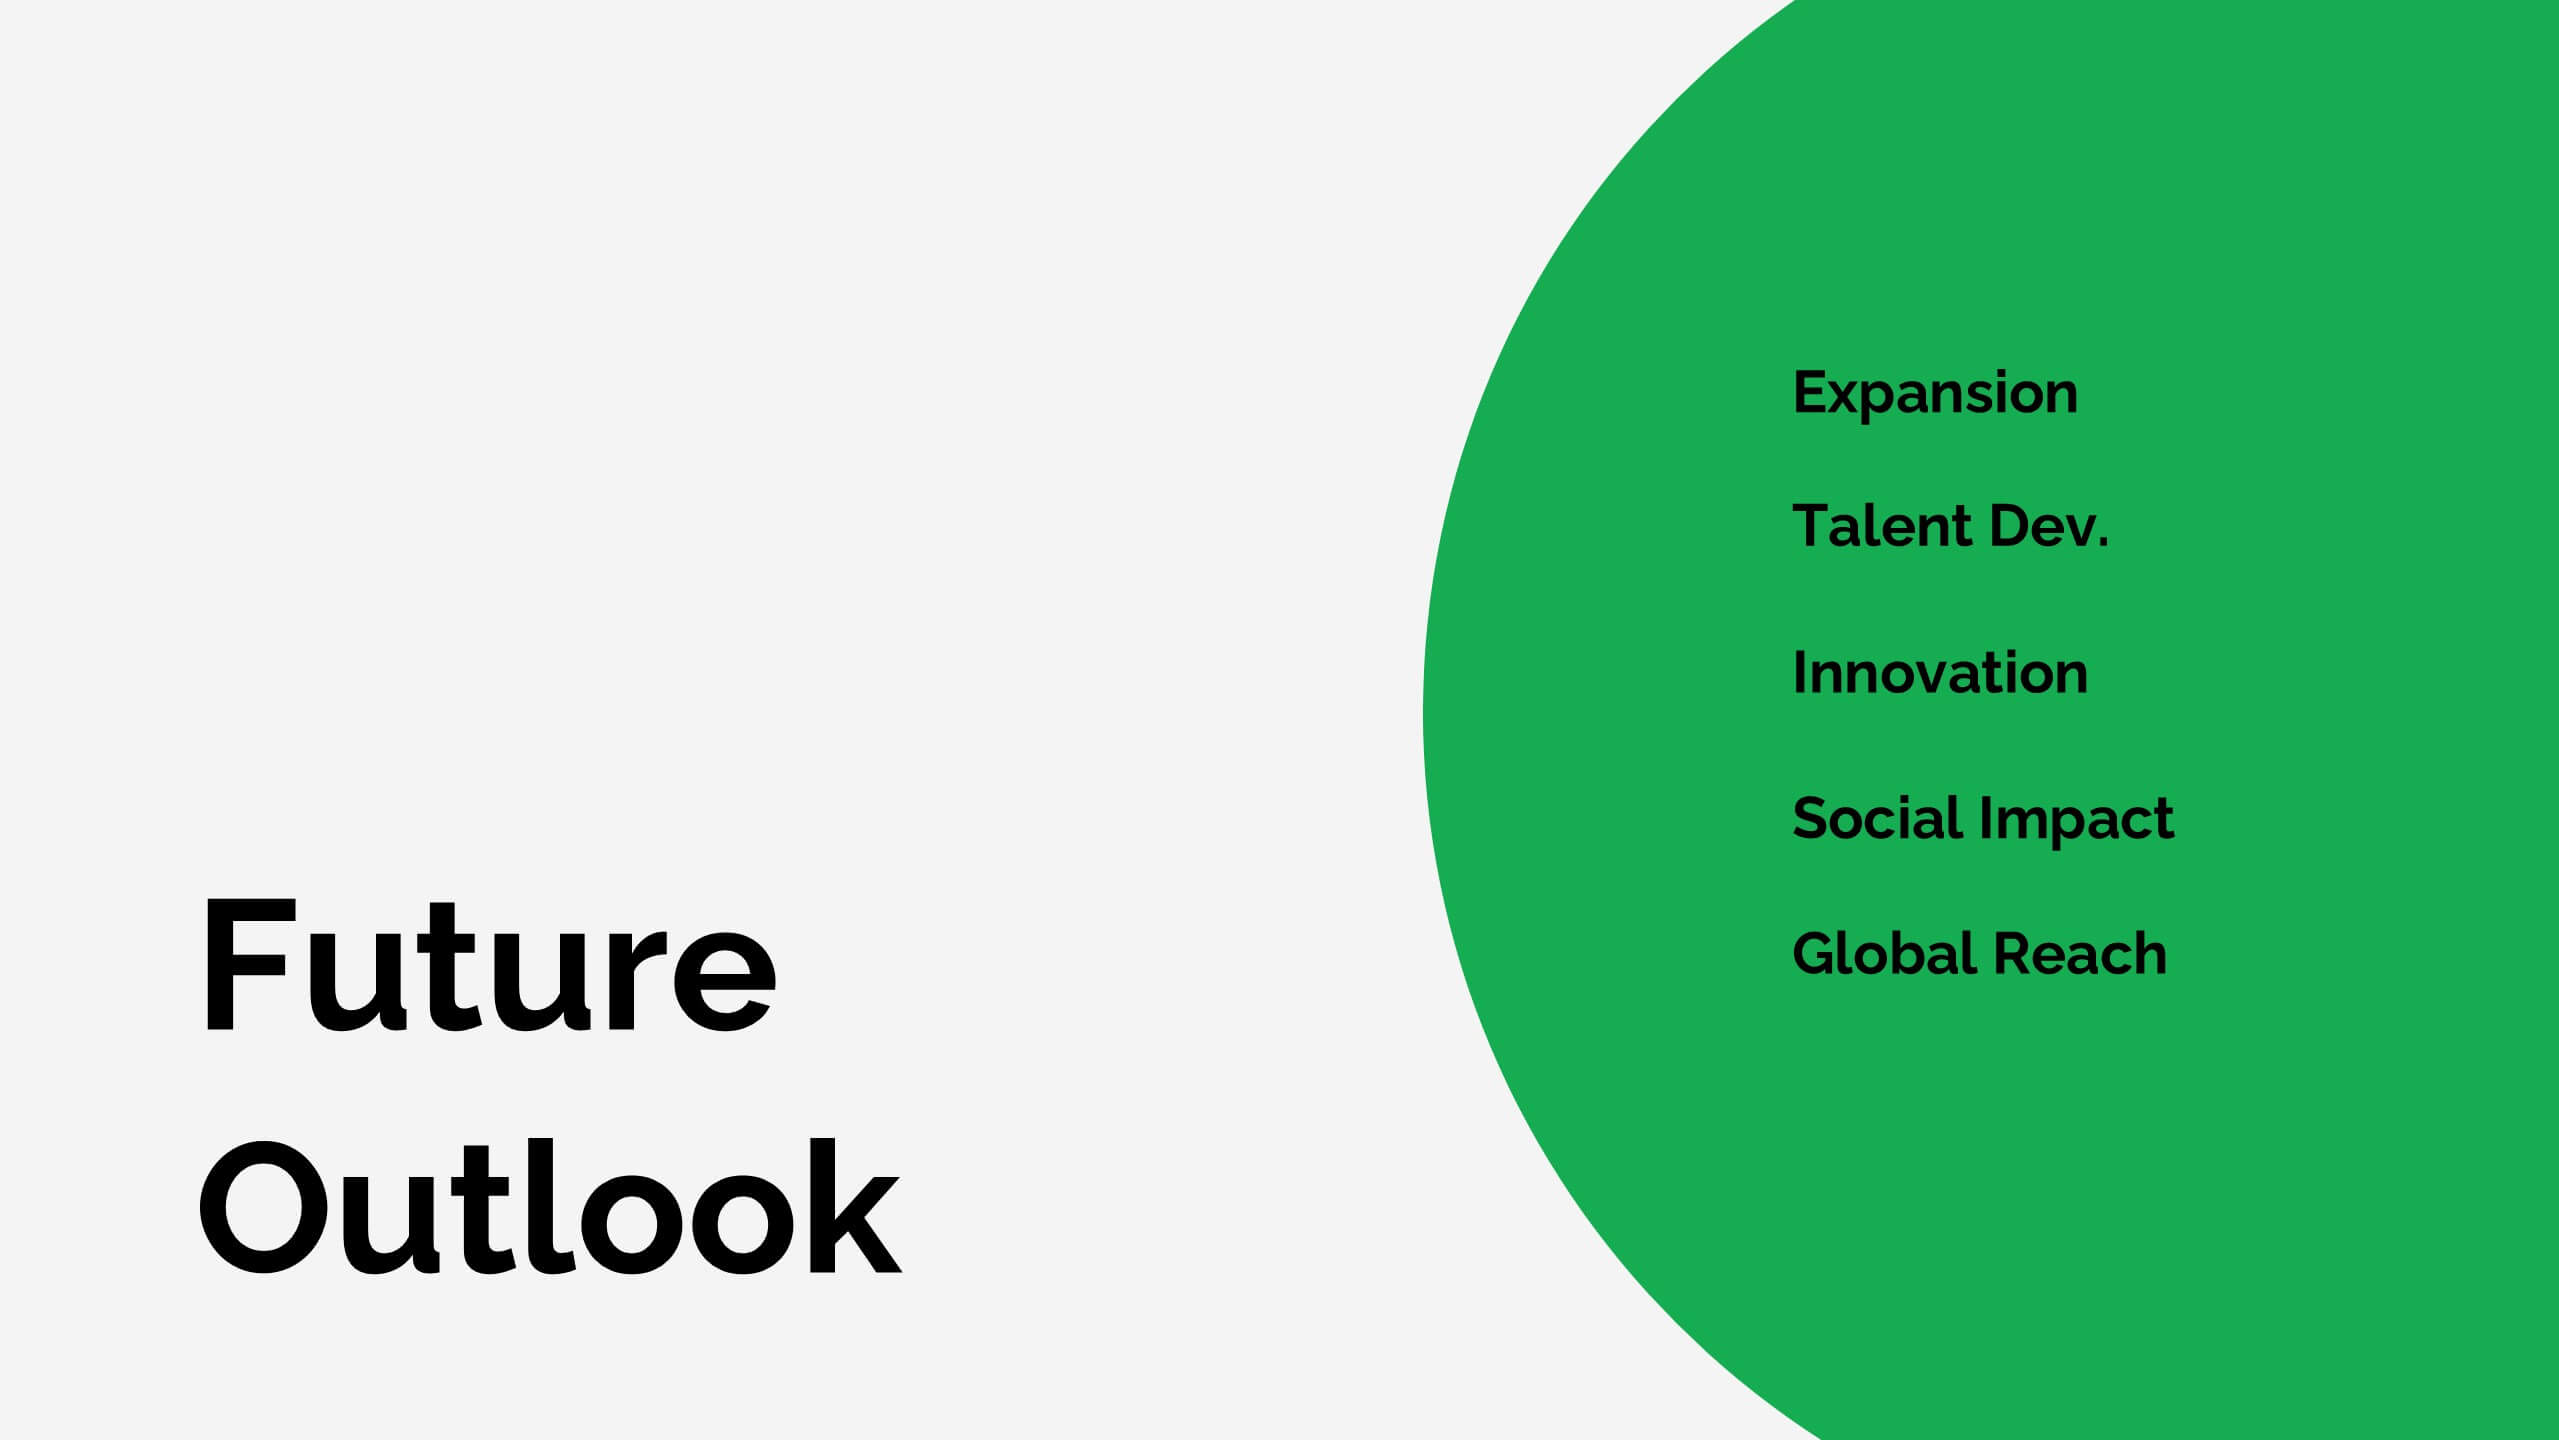
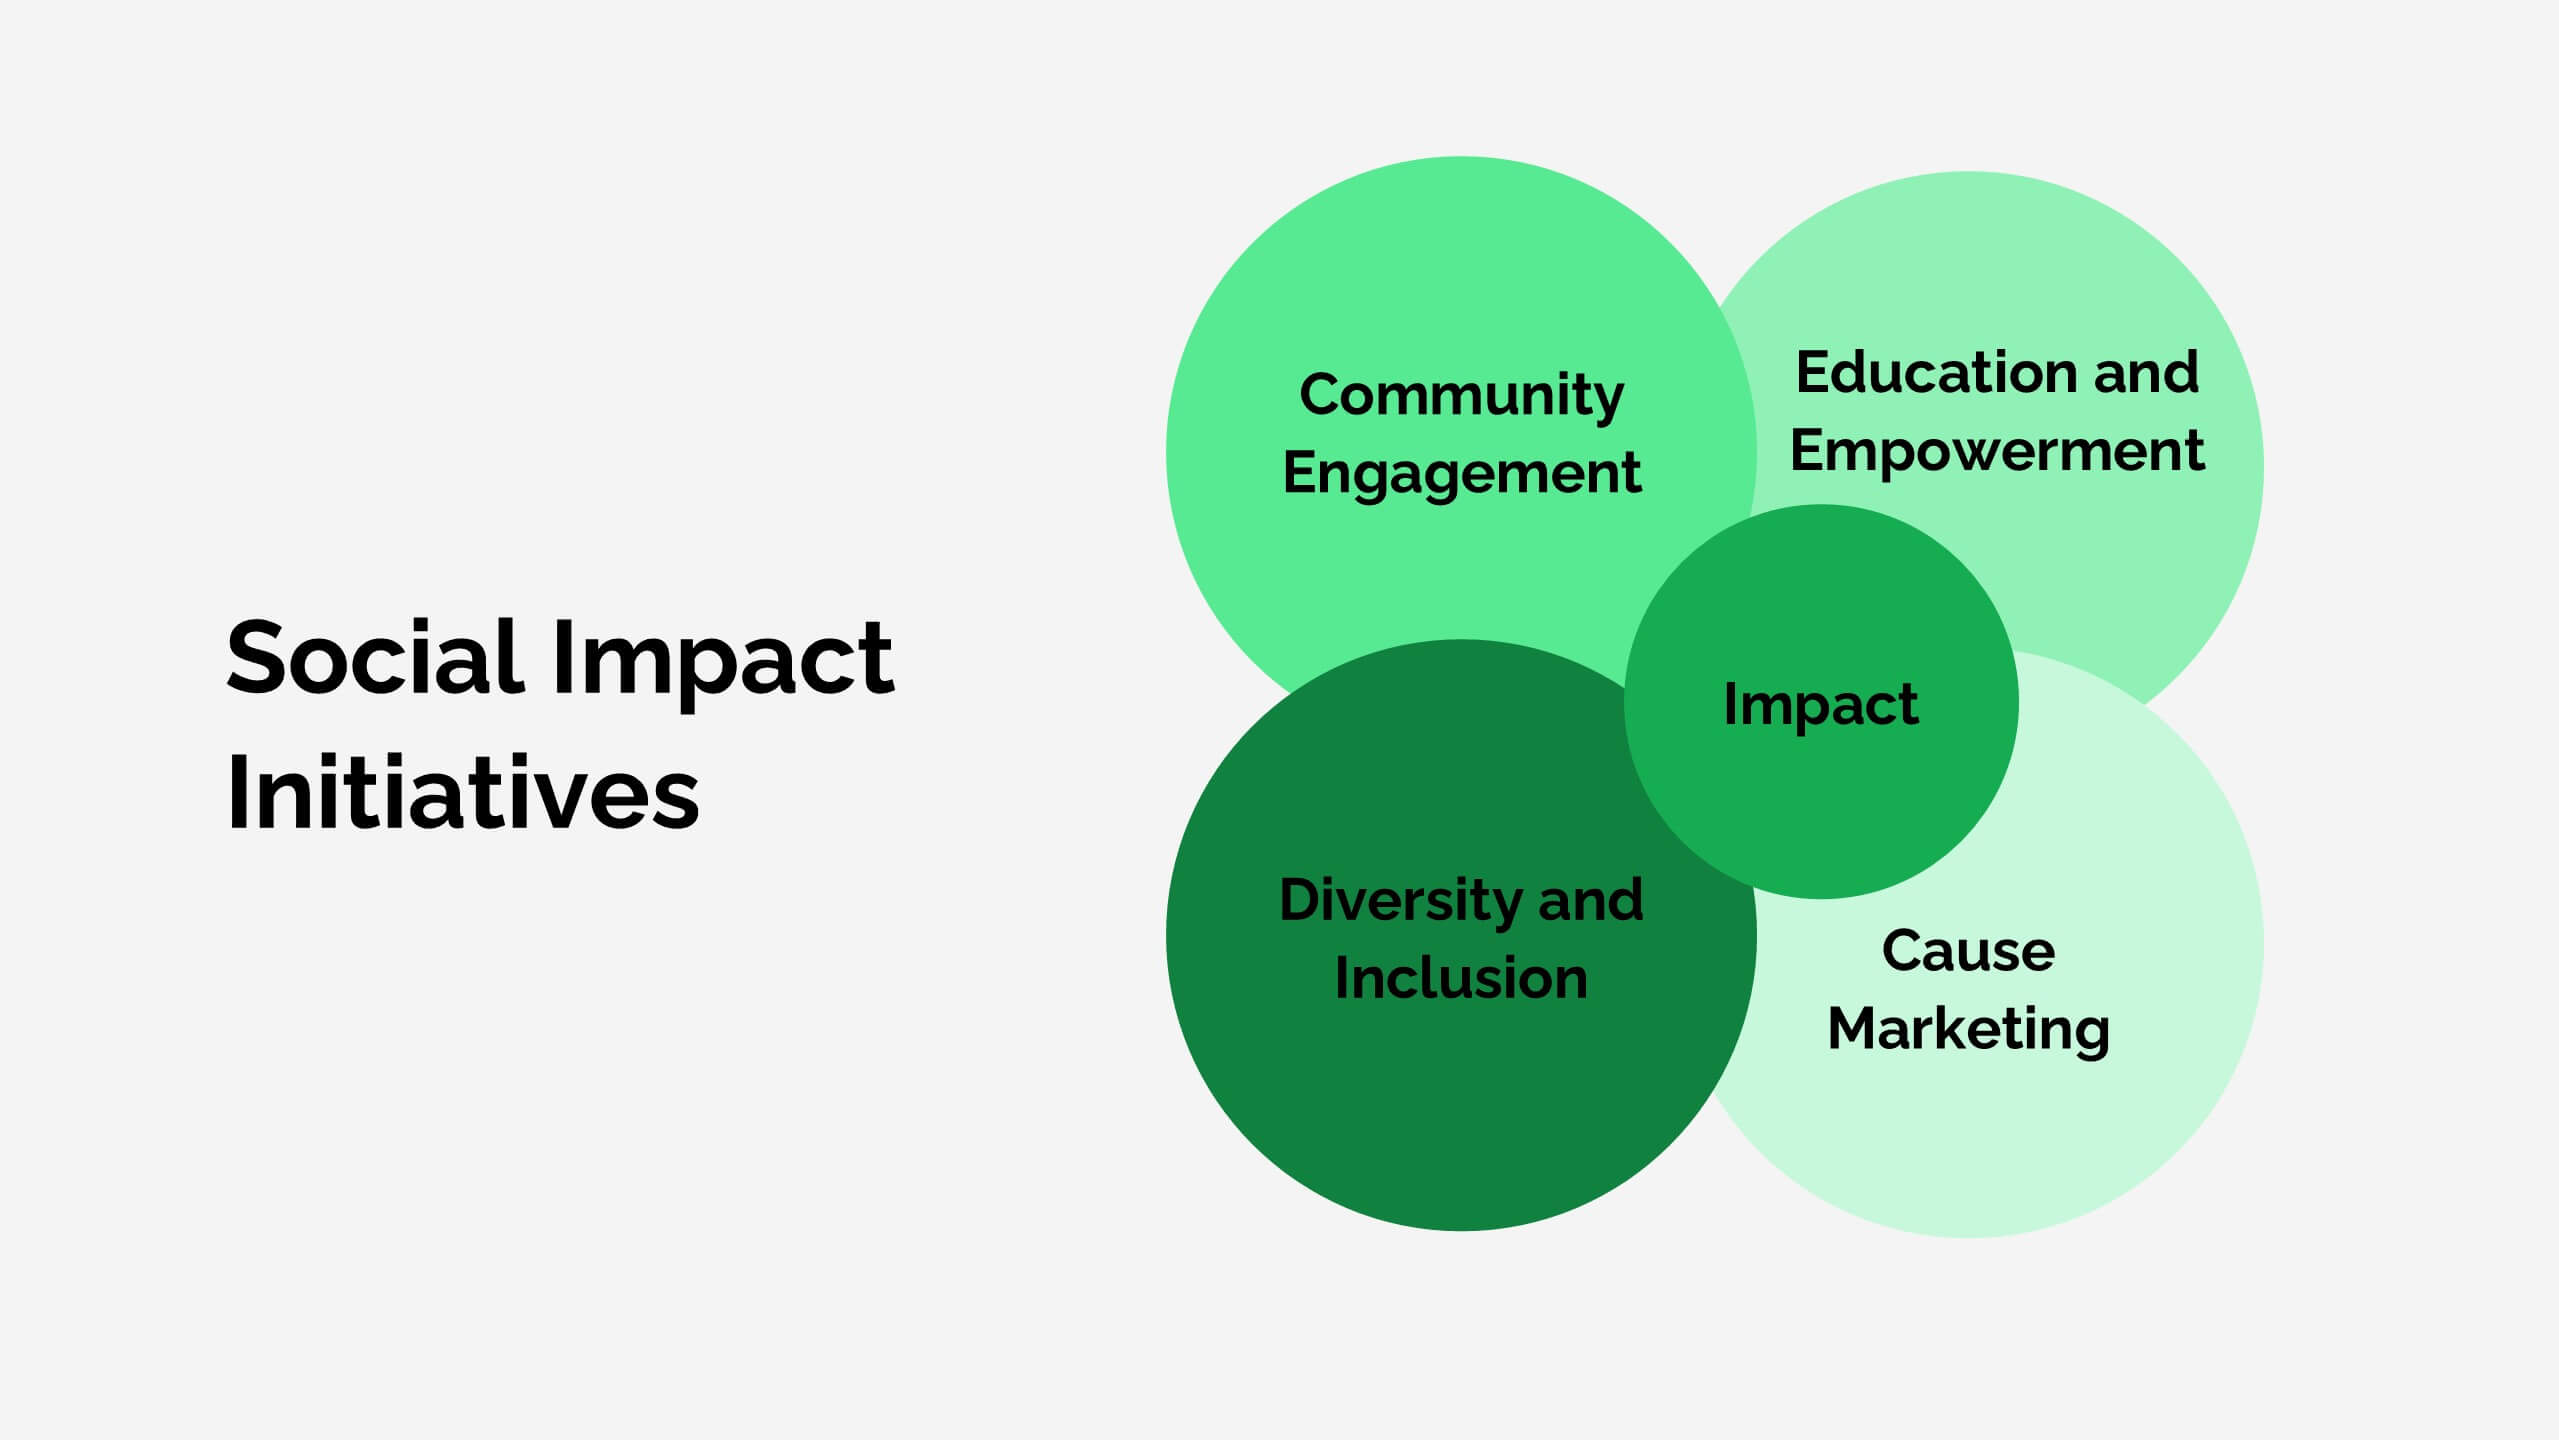
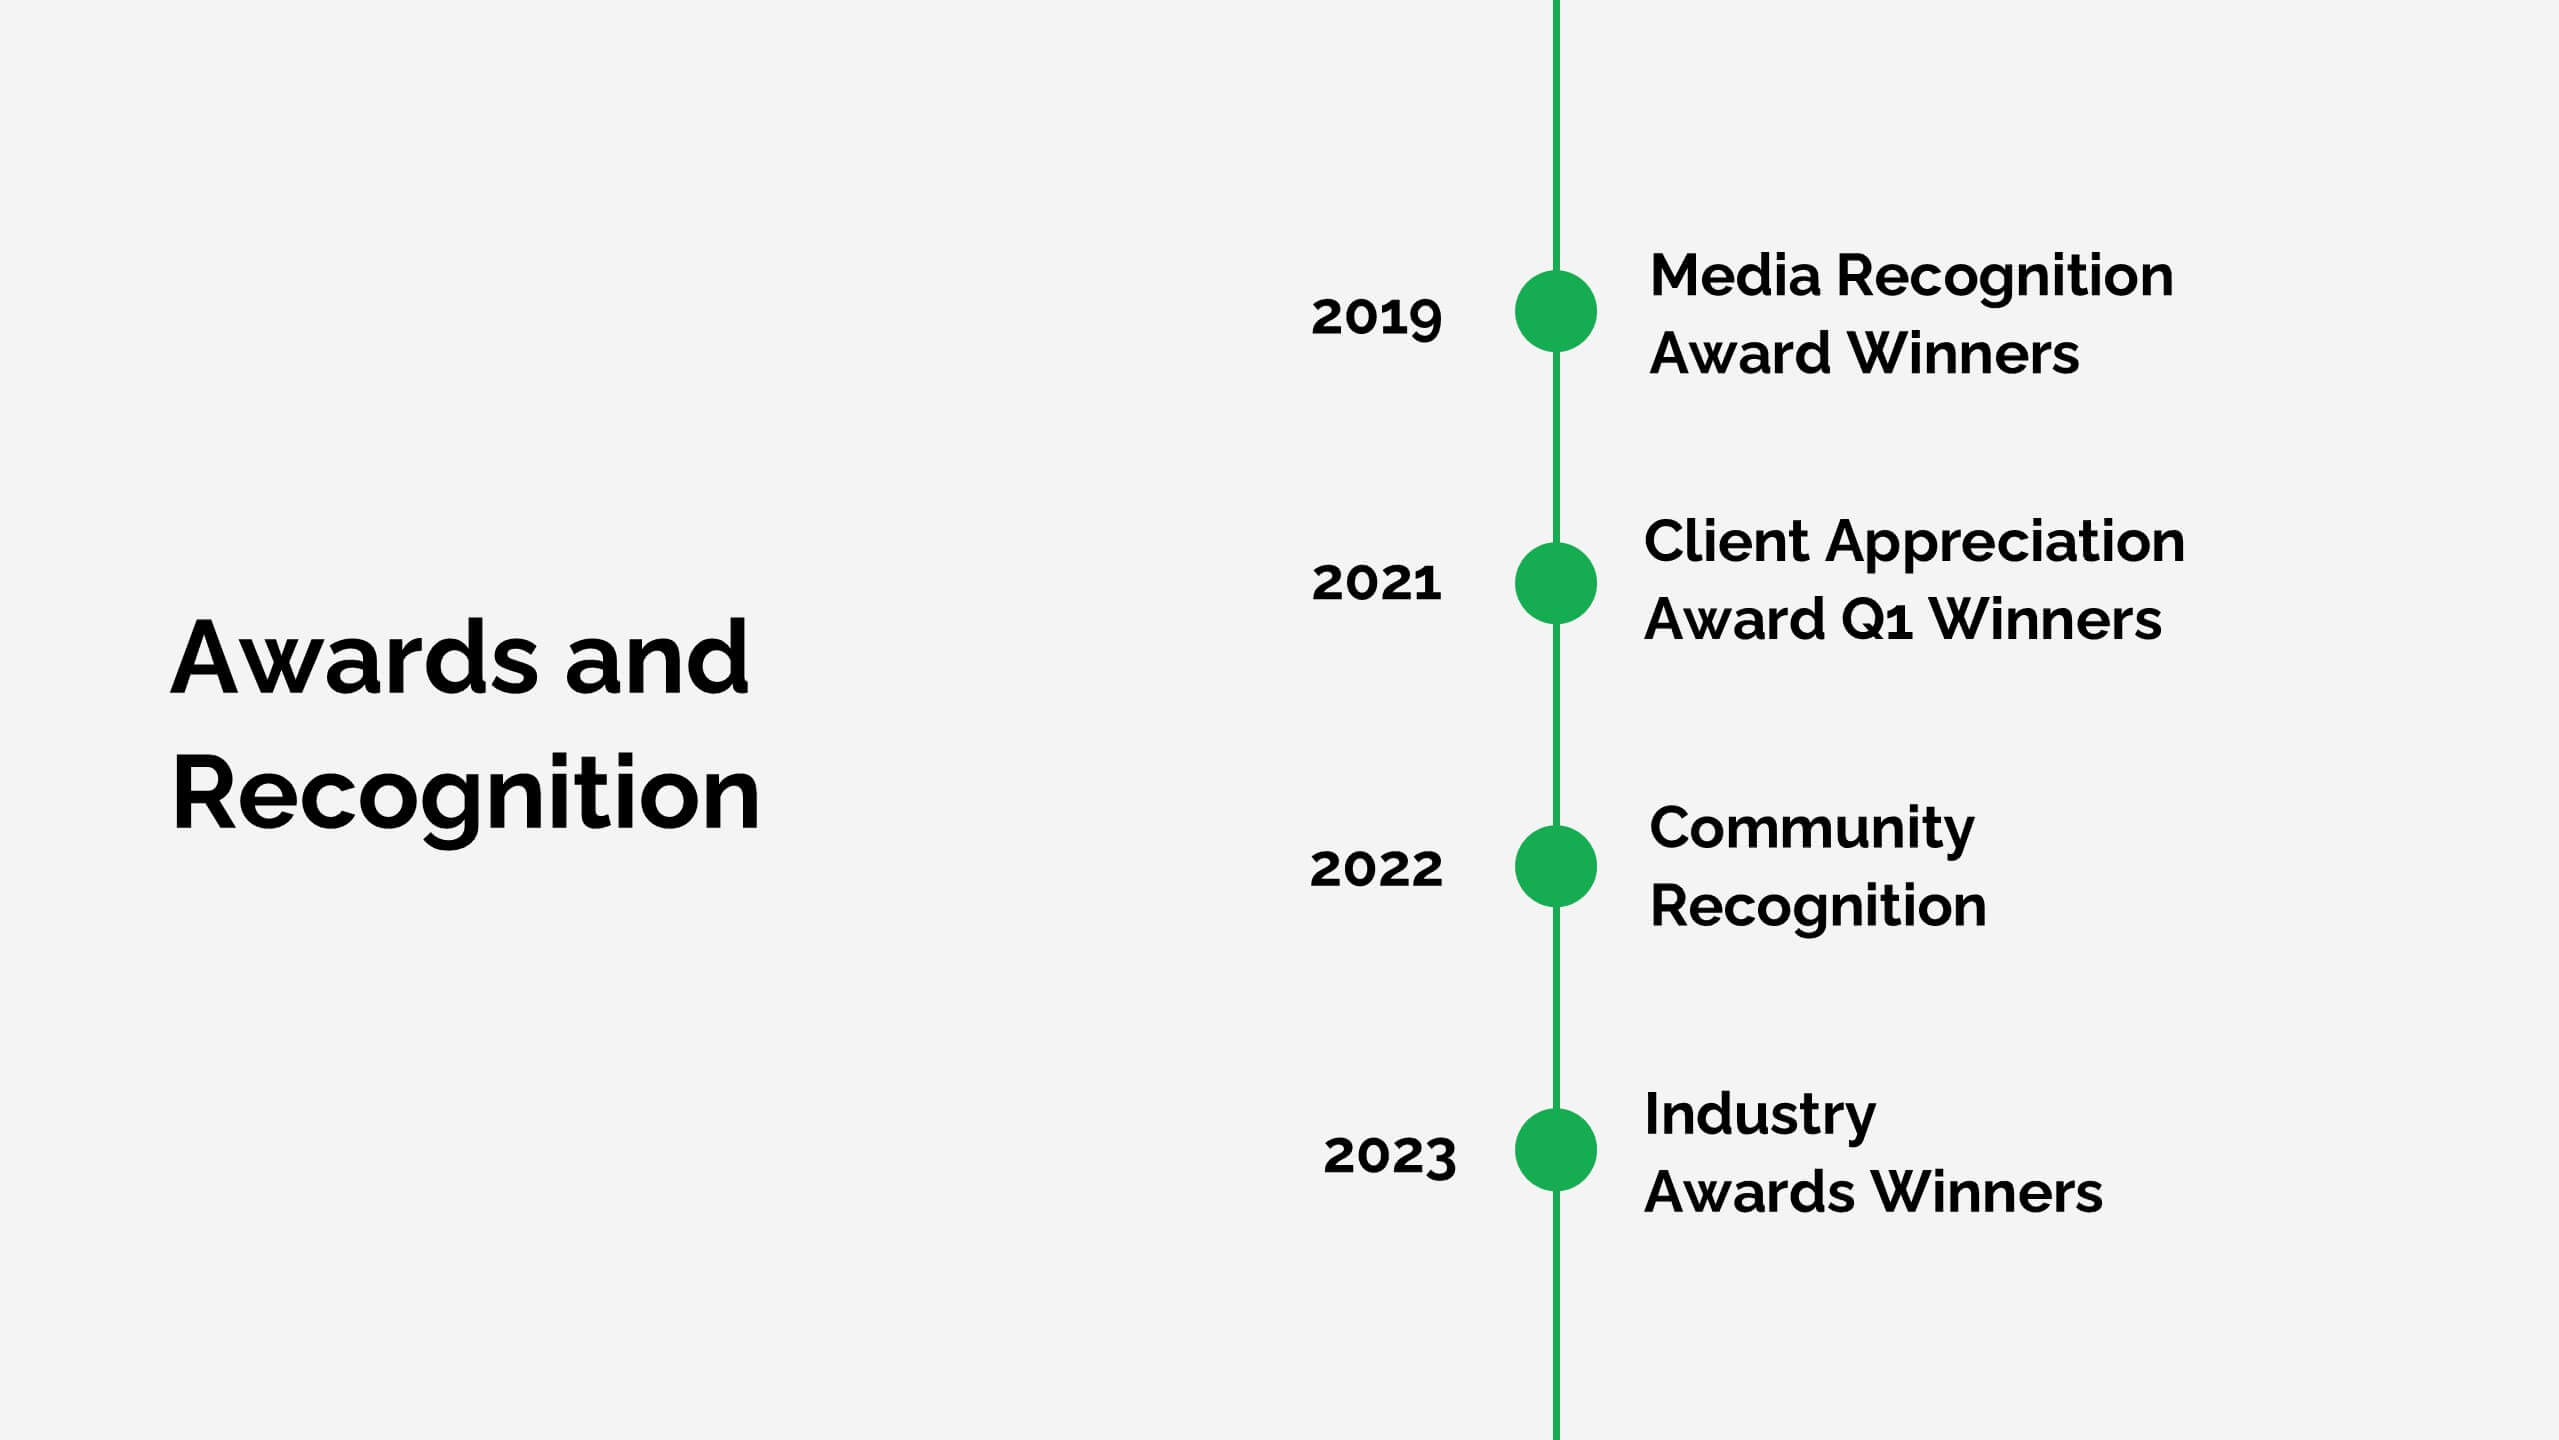
Future Vision Infographic
Chart a course towards a visionary future with our Future Vision Infographic Template. This dynamic template is designed to help organizations articulate and visualize their long-term goals and strategies in a clear and compelling way. Each slide offers a unique blend of geometric designs and bold color palettes, ideal for engaging stakeholders and inspiring action. Perfect for corporate presentations, strategic meetings, or digital showcases, this template allows you to lay out your vision with precision. It guides viewers through your roadmap to success, highlighting key milestones and the innovative steps you plan to take. Customize each element to echo your organizational identity and values, ensuring that your future aspirations resonate deeply with your audience. Whether you're aiming to motivate your team, attract investors, or inform your partners, our Future Vision template provides a robust foundation for powerful storytelling and strategic clarity.