


Características


¿Tienes alguna pregunta?
Recomendar


3 diapositivas
Credit Card Comparison Chart Presentation
Make financial decisions feel clearer and more visual with this clean comparison-focused layout designed to highlight key features side by side. It helps you simplify data, explain differences, and guide smarter choices with confidence. Fully editable and compatible with PowerPoint, Keynote, and Google Slides.


6 diapositivas
Task Automation Workflow
Illustrate streamlined processes, AI-powered sequences, or automated tasks with this gear-based workflow layout. Ideal for tech teams, business consultants, or IT professionals explaining step-by-step automation. Fully editable in PowerPoint, Keynote, and Google Slides—customize text, icons, and colors with ease.

21 diapositivas
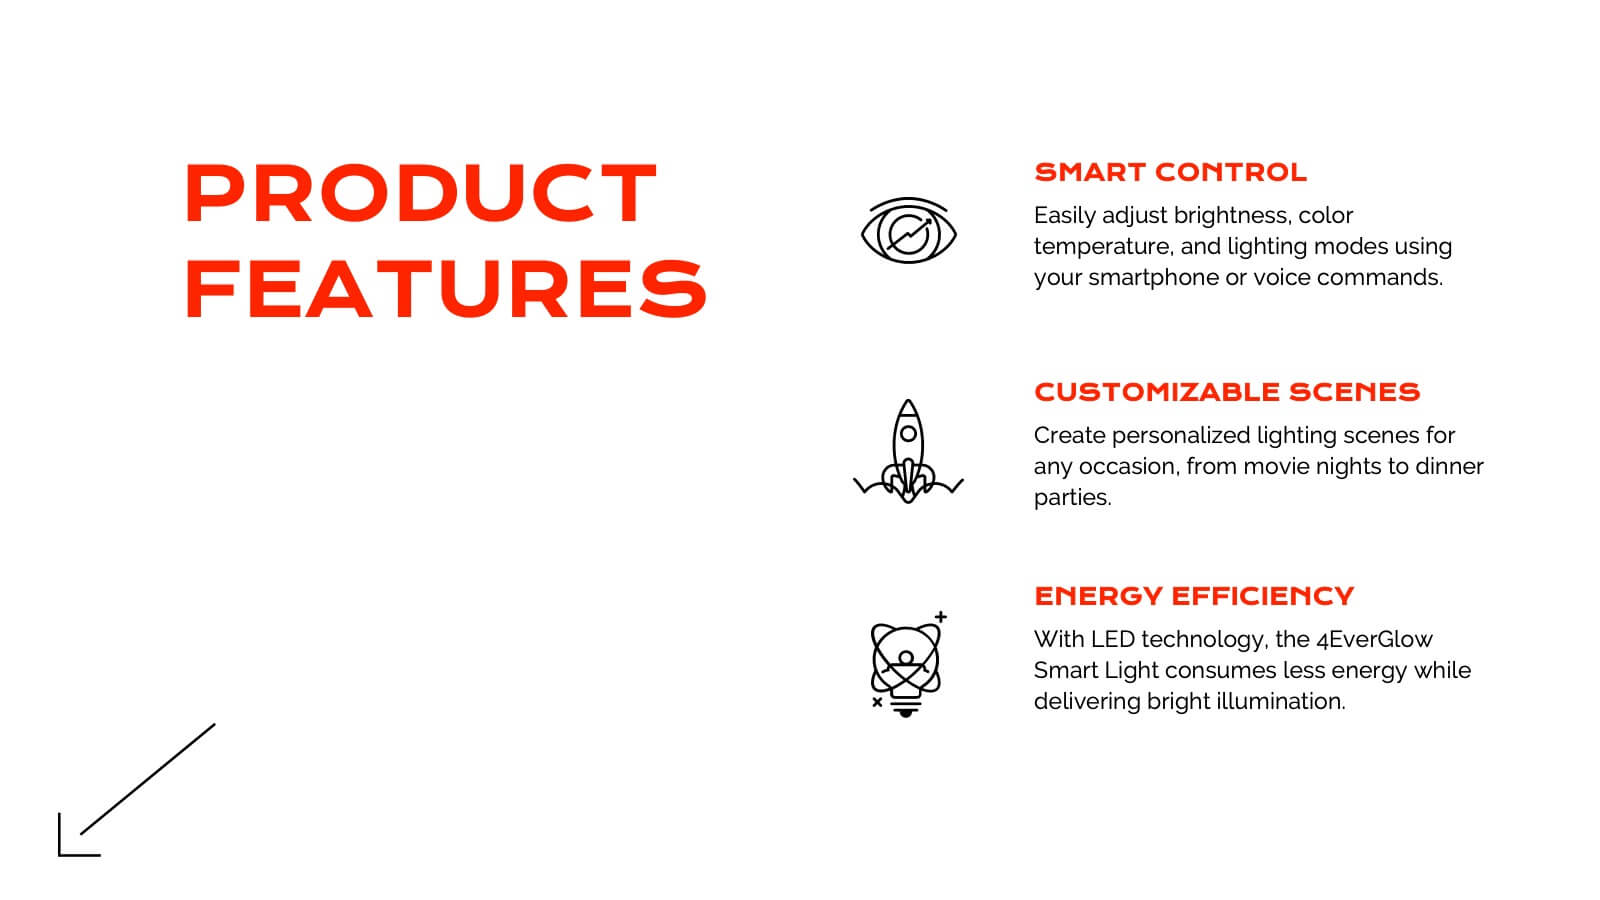
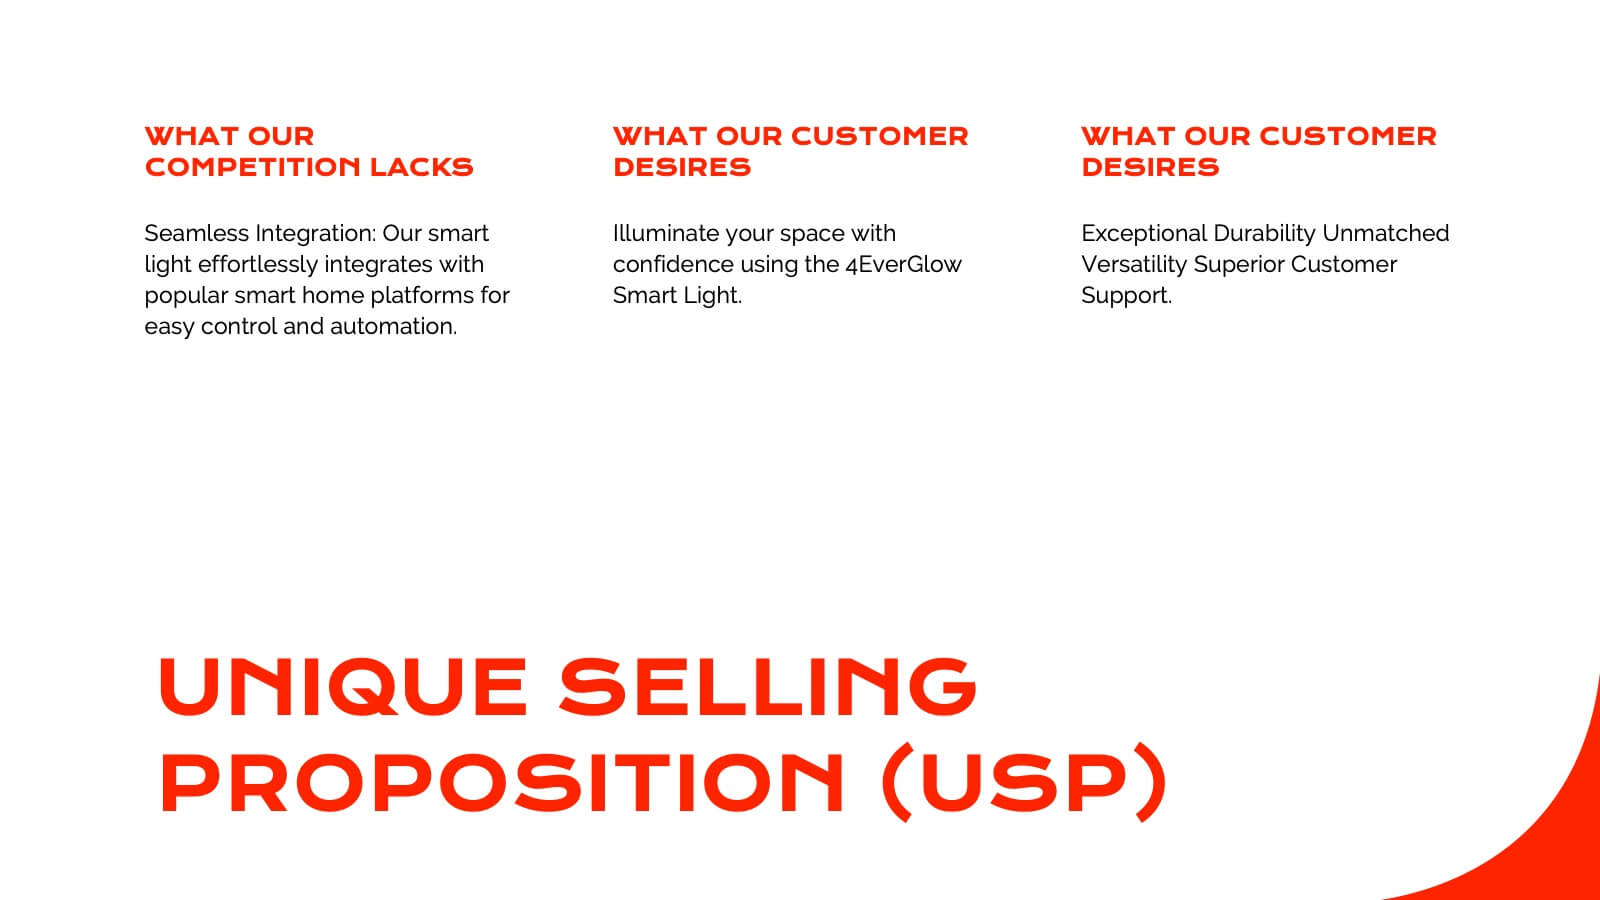
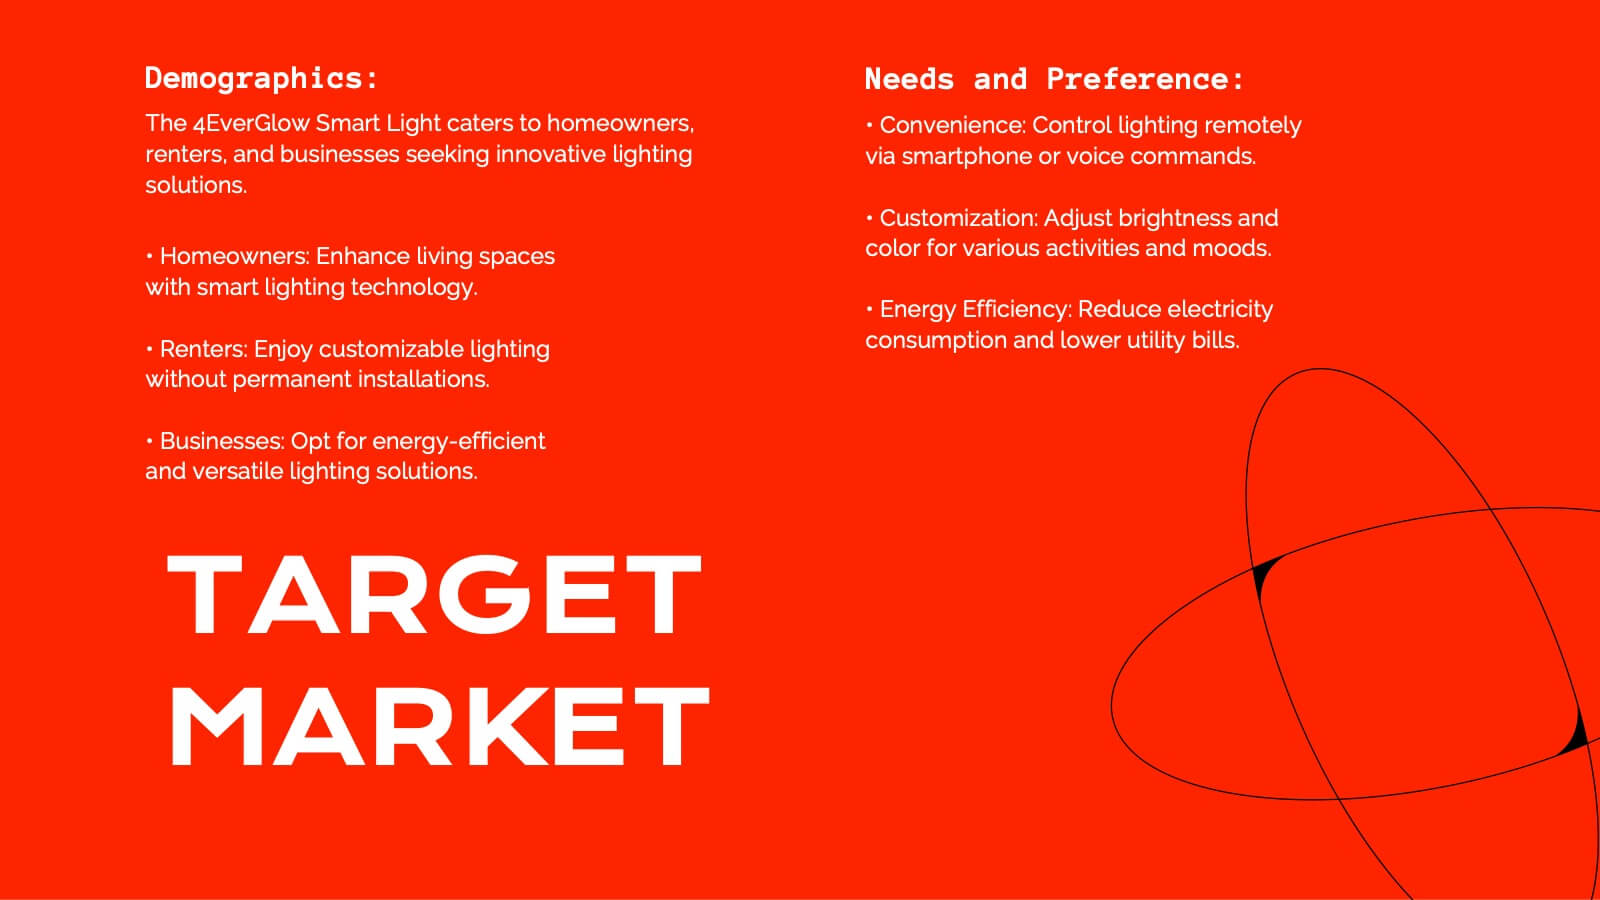
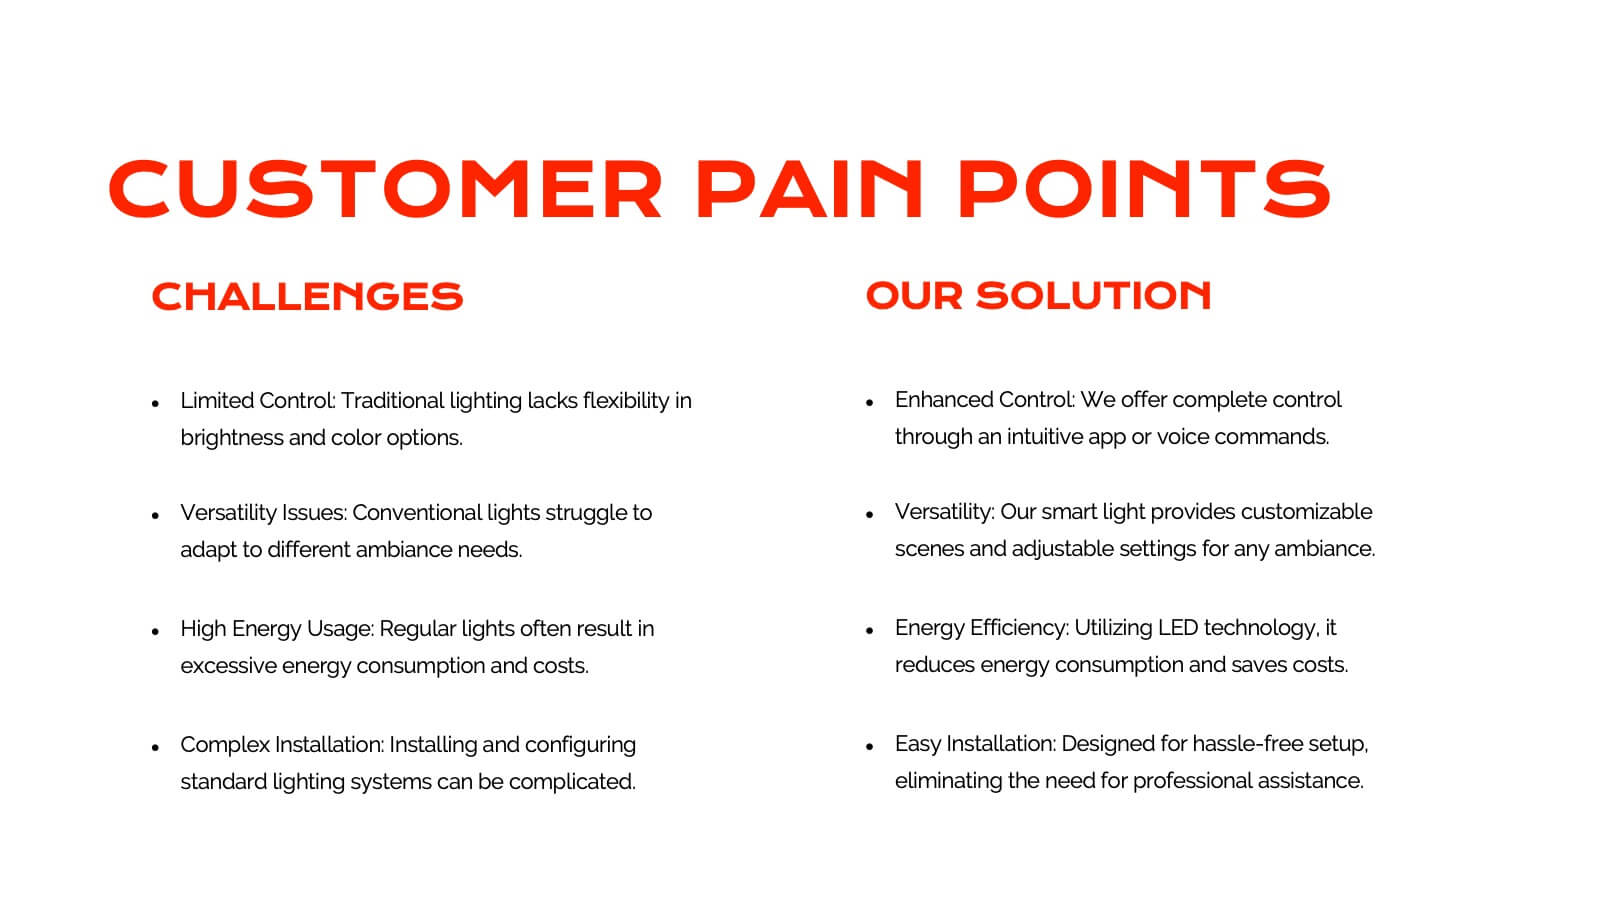
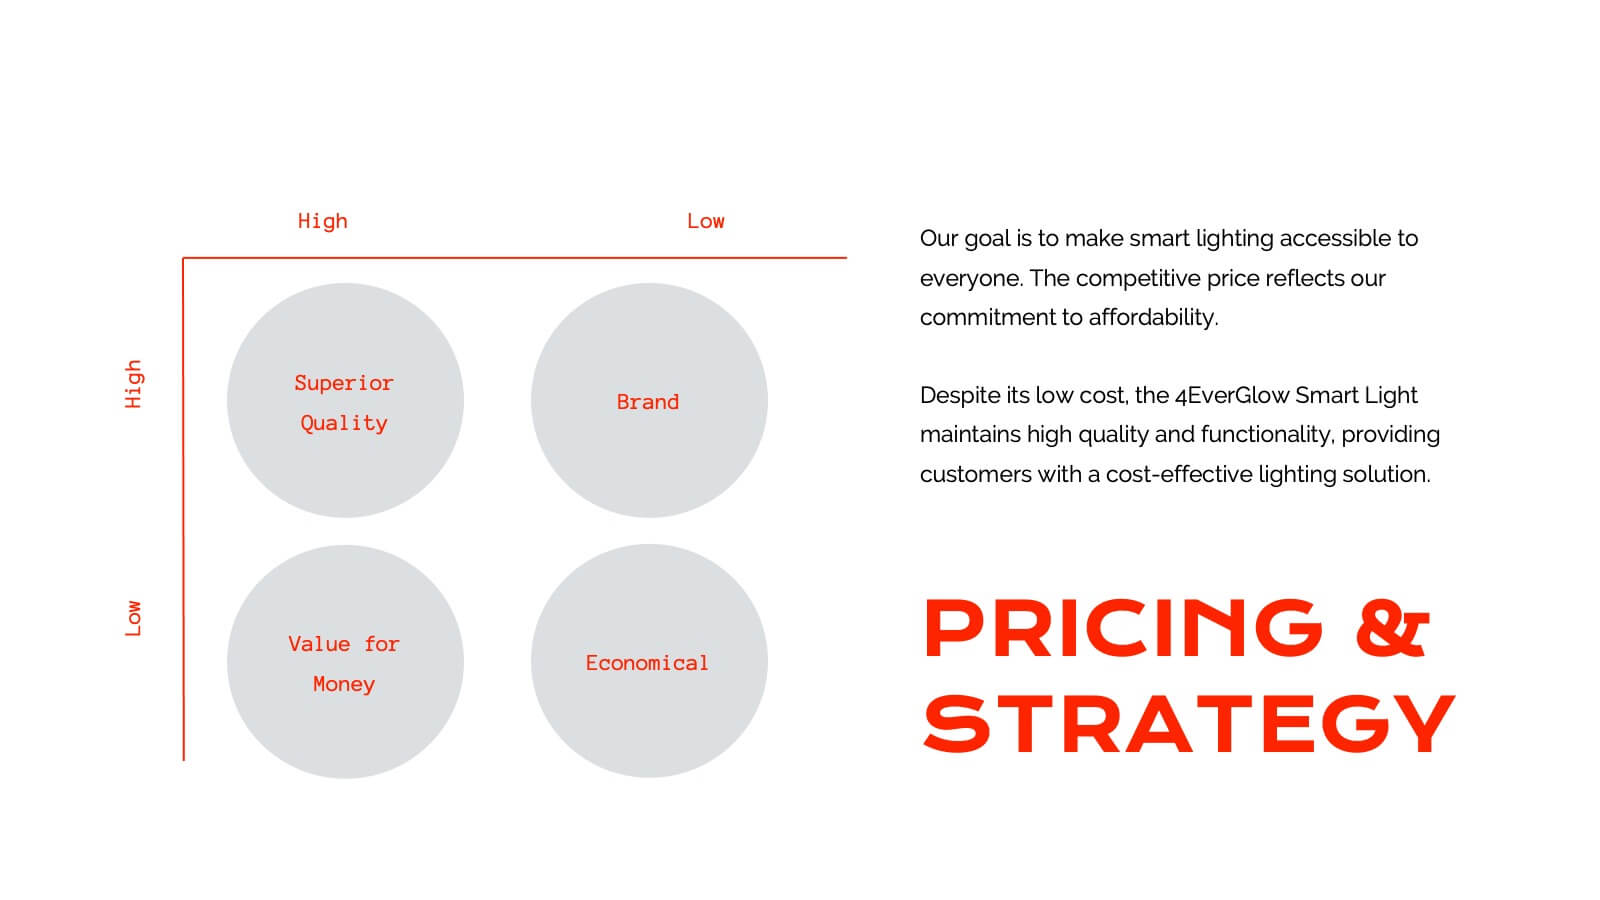
Juventas Product Roadmap Presentation
Get ready to dazzle your audience with a visually striking presentation that takes them through the entire product journey! This template covers essential areas such as product features, target market analysis, and competitive positioning. With its sleek, modern design, it's perfect for capturing attention and delivering clear information. Compatible with PowerPoint, Keynote, and Google Slides for effortless use across platforms.


5 diapositivas
Product Development Empathy Mapping
Bridge the gap between user insight and product success. This empathy mapping slide is perfect for product development teams to capture what users see, hear, think, feel, and experience—along with their pains and gains. Fully customizable and compatible with PowerPoint, Keynote, and Google Slides.


5 diapositivas
Startup Business Pitch Deck Presentation
Impress investors with this clean and modern pitch deck slide, designed to showcase business growth and funding stages. Featuring a sleek stacked ring graphic with a rocket icon for visual impact, this layout is perfect for presenting milestones, KPIs, or financial progress. Fully editable in PowerPoint, Keynote, and Google Slides.


6 diapositivas
Gantt Chart for Project Phasing Presentation
Plan and visualize your timeline effortlessly with this Gantt Chart for Project Phasing presentation. Ideal for breaking down tasks by month, this template helps you communicate project stages, team responsibilities, and key milestones clearly. Fully editable in Canva, PowerPoint, and Google Slides—customize colors, titles, and durations to match your workflow.


6 diapositivas
Funding and Return on Investment Overview Presentation
Showcase your funding strategy and ROI journey with this growth-themed infographic. The plant-inspired design visually represents financial progress across six stages, making it perfect for startups, business proposals, or investor updates. Fully editable in PowerPoint, Google Slides, and Keynote for seamless customization and a polished, professional presentation experience.


6 diapositivas
Demographic and Psychographic Segmentation Presentation
Bring your audience insights to life with a clear, data-driven design that highlights who your customers are and what drives their decisions. This presentation helps you analyze audiences by lifestyle, behavior, and demographics. Fully customizable and compatible with PowerPoint, Keynote, and Google Slides for effortless professional presentations.


7 diapositivas
Stakeholder Impact Analysis Infographic Presentation
Stakeholder analysis is a tool used to identify and assess the interests, needs, and concerns of different stakeholders related to a particular project or initiative. This template can provide a comprehensive overview of the stakeholders involved in a project including their interests and level of influence. Use this template to include information on the relationships between stakeholders, as well as the potential risks and opportunities associated with their involvement. It is designed in PowerPoint, Keynote, and Google Slides so you can use the one that works best for your team and edit.


4 diapositivas
Social Media Content Strategy Presentation
Engage your audience with this Social Media Content Strategy Presentation. Featuring side-by-side thumbs-up icons, this template visually contrasts two key focus areas—ideal for comparing campaign goals, content pillars, or platform strategies. Each section includes editable text blocks to outline insights clearly. Fully customizable and compatible with PowerPoint, Keynote, and Google Slides.


5 diapositivas
Medical Services Infographics
Navigate the complexities of healthcare information with our medical services infographics. Rendered in a life-affirming palette of blue and red, these infographics elucidate various facets of medical services. The template serves as a lifeline for healthcare professionals, and public health advocates by providing a clear, visual narrative of services, processes, and advancements in the medical field. Compatible with Powerpoint, Keynote, and Google Slides. Its creative yet informative style, enhanced with relevant graphics and icons, ensure that critical information catches the eye, improves understanding, and encourages engagement.


6 diapositivas
Unique Intersection Comparison Diagram
Illustrate complex relationships with clarity using the Unique Intersection Comparison Diagram Presentation. This visually engaging 5-circle diagram highlights overlaps and distinct points, ideal for showcasing cross-functional collaboration, multi-variable strategies, or layered comparisons. Each segment supports titles and brief text, making it perfect for business planning, product features, or audience segmentation. Fully editable in PowerPoint, Keynote, and Google Slides.


21 diapositivas
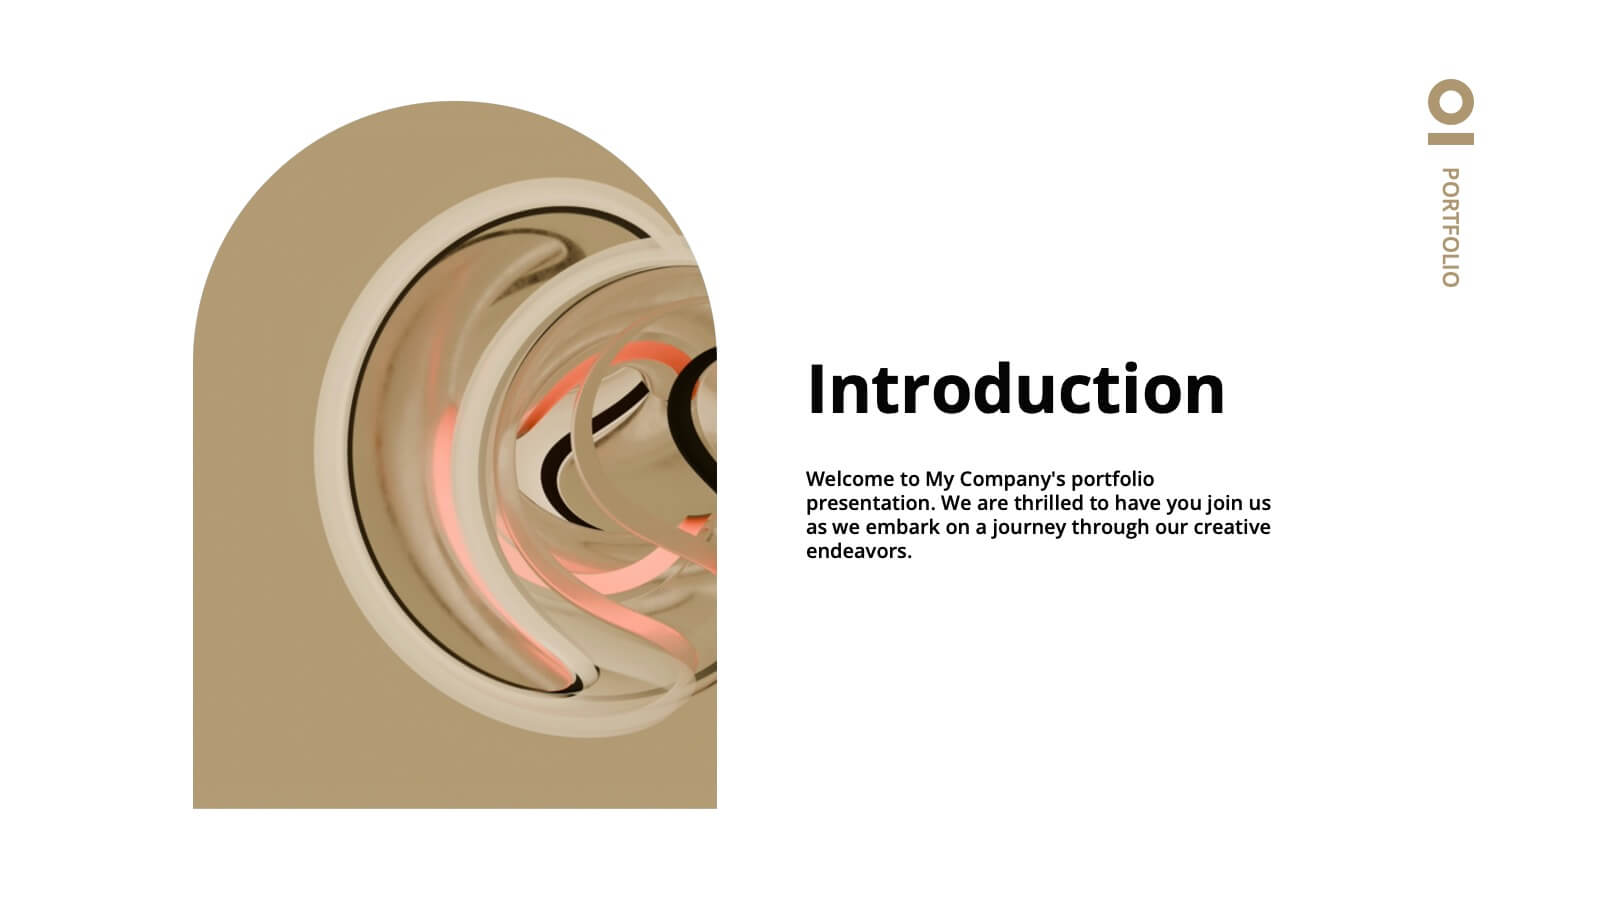
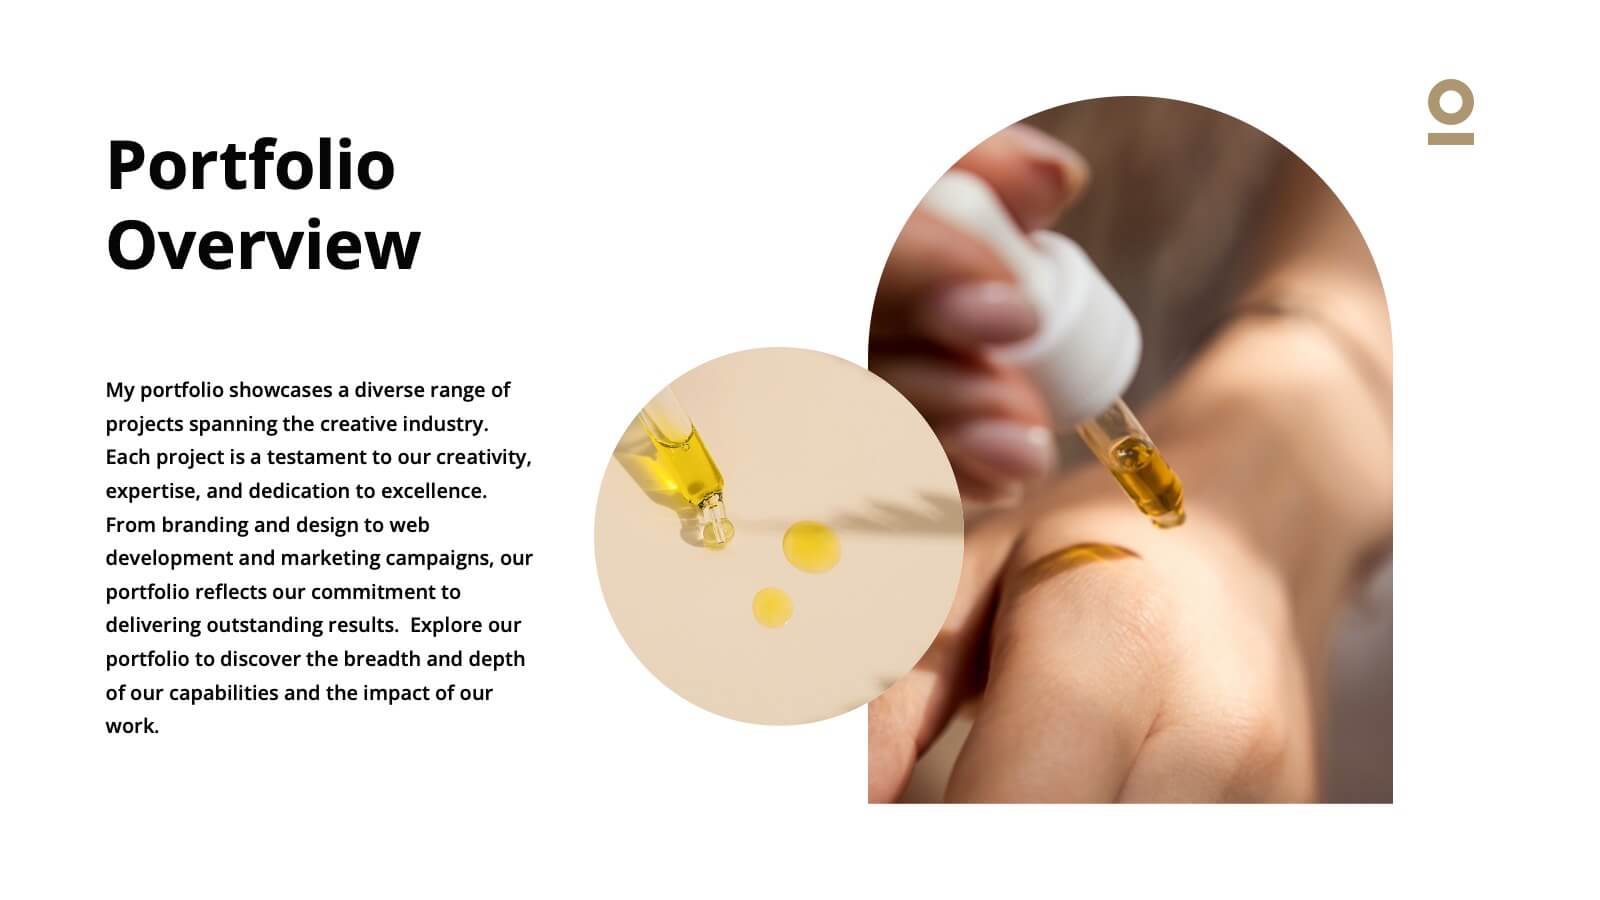
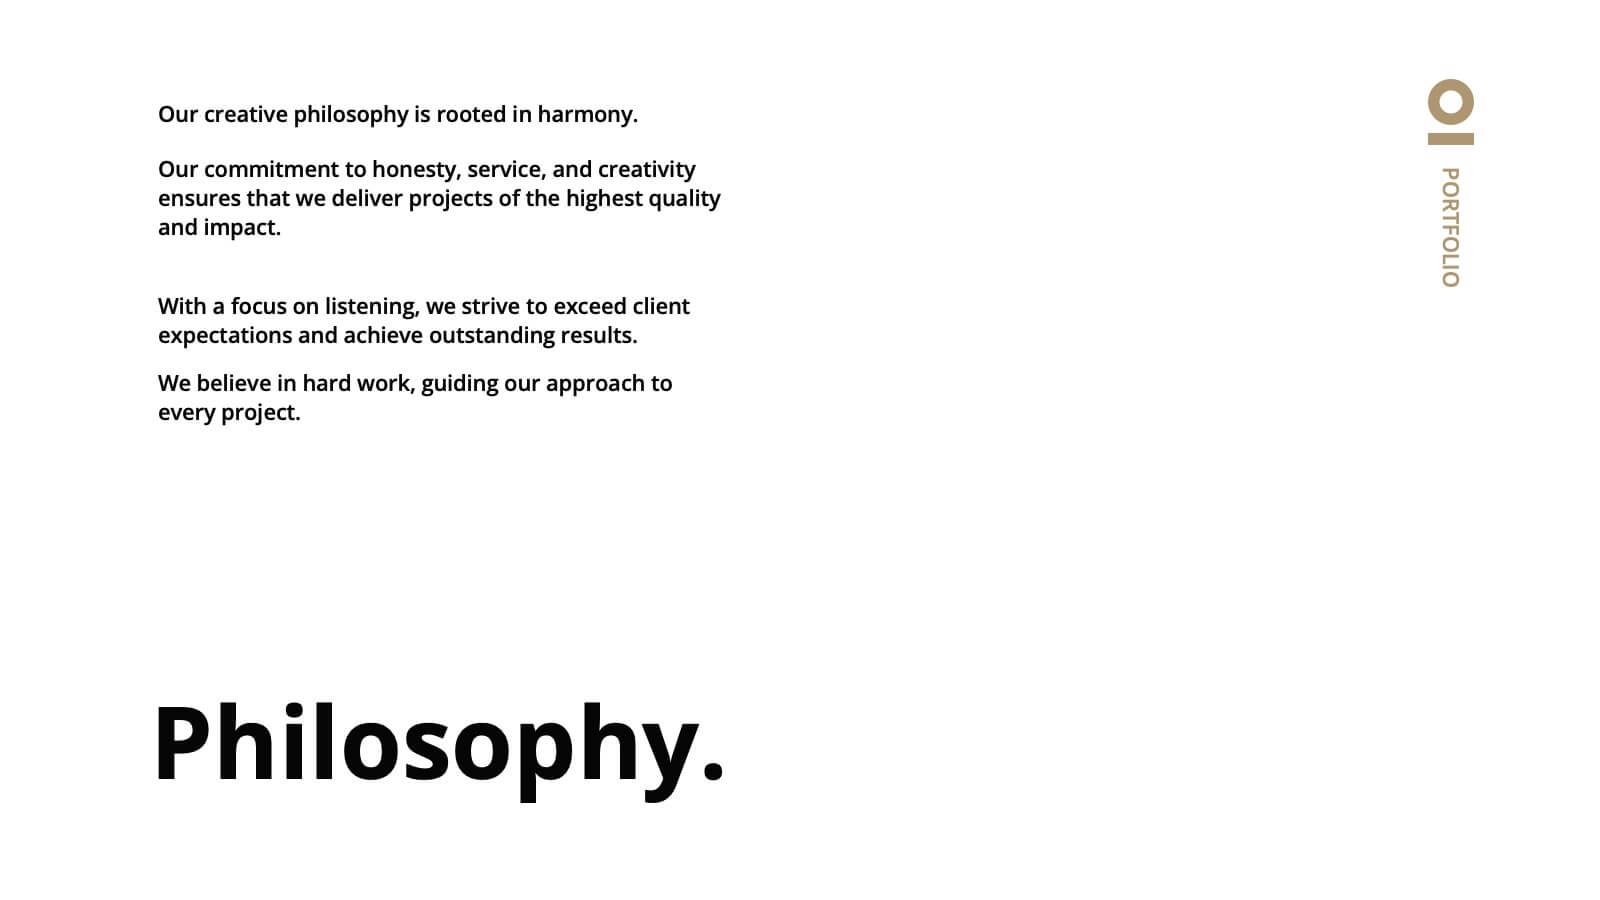
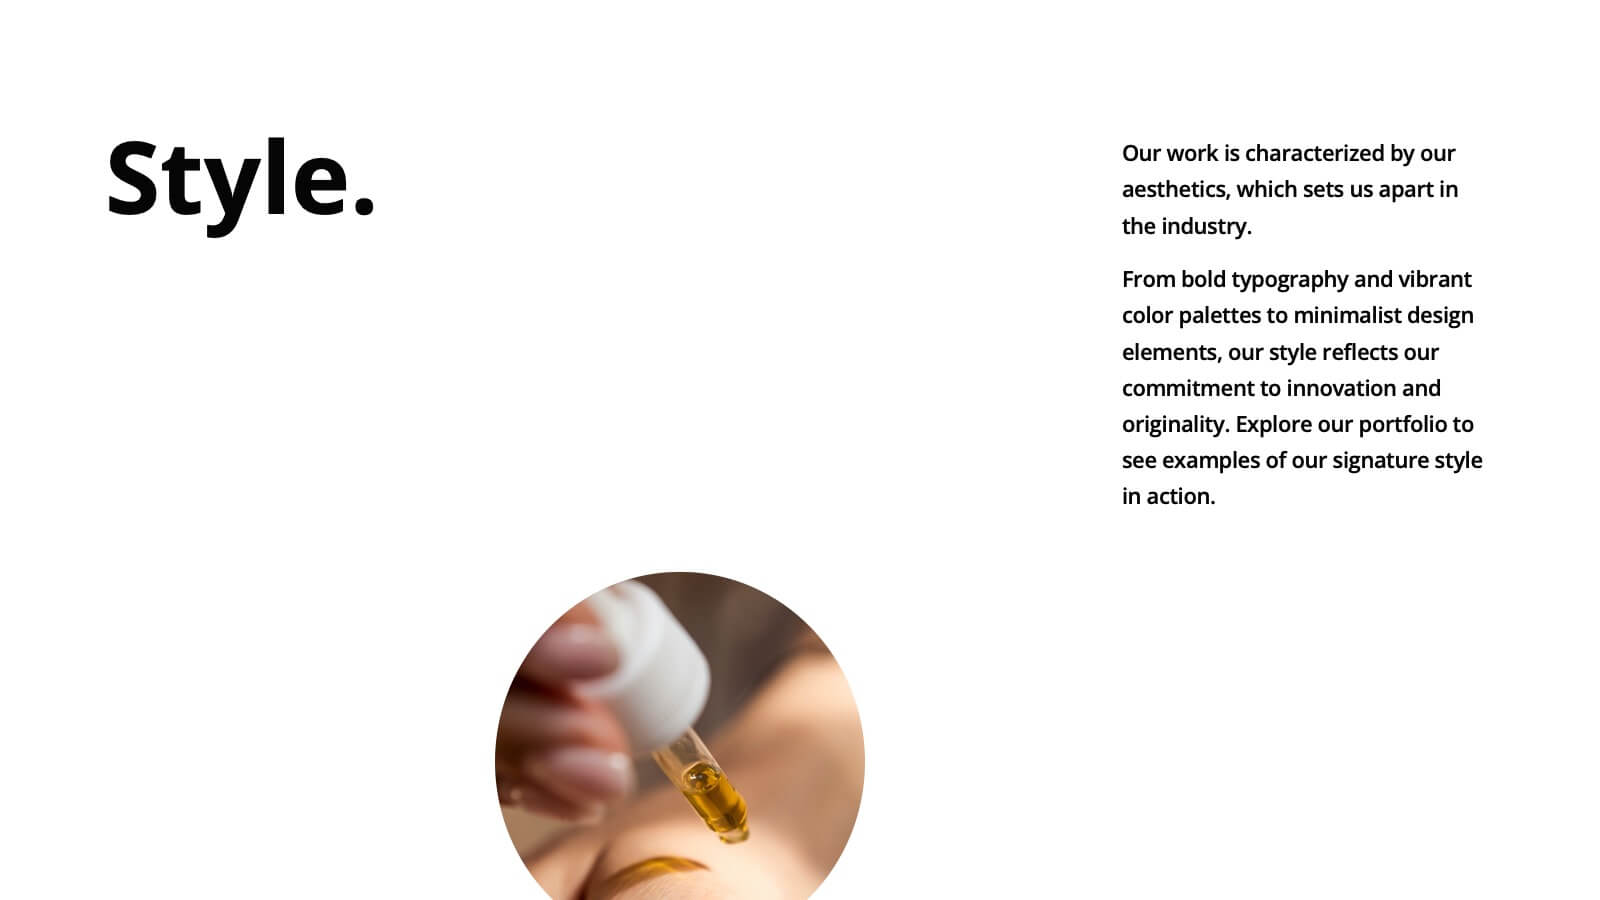
Haze Professional Portfolio Showcase Presentation
Elevate your professional presence with this stunning haze-inspired presentation template! Ideal for showcasing your portfolio, it beautifully highlights your skills, projects, and achievements with a clean and sophisticated design. This template ensures your work stands out, captivating potential clients and employers. Compatible with PowerPoint, Keynote, and Google Slides.


5 diapositivas
Root Cause Analysis Fishbone Slide Presentation
Give your problem-solving sessions a fresh visual spark with a tree-style diagram that makes tracing causes feel clear and intuitive. This presentation helps you break down issues, organize insights, and present findings with clean, structured flow. Perfect for teams and workshops. Fully compatible with PowerPoint, Keynote, and Google Slides.


4 diapositivas
Mind Mapping for Idea Expansion Presentation
Visualize your concepts clearly with this Mind Mapping for Idea Expansion presentation. Designed to help structure brainstorming sessions or strategic planning, this template organizes ideas around a central theme with clean, radial layouts. Ideal for creative teams and professionals. Fully editable in Canva, PowerPoint, and Google Slides.


23 diapositivas
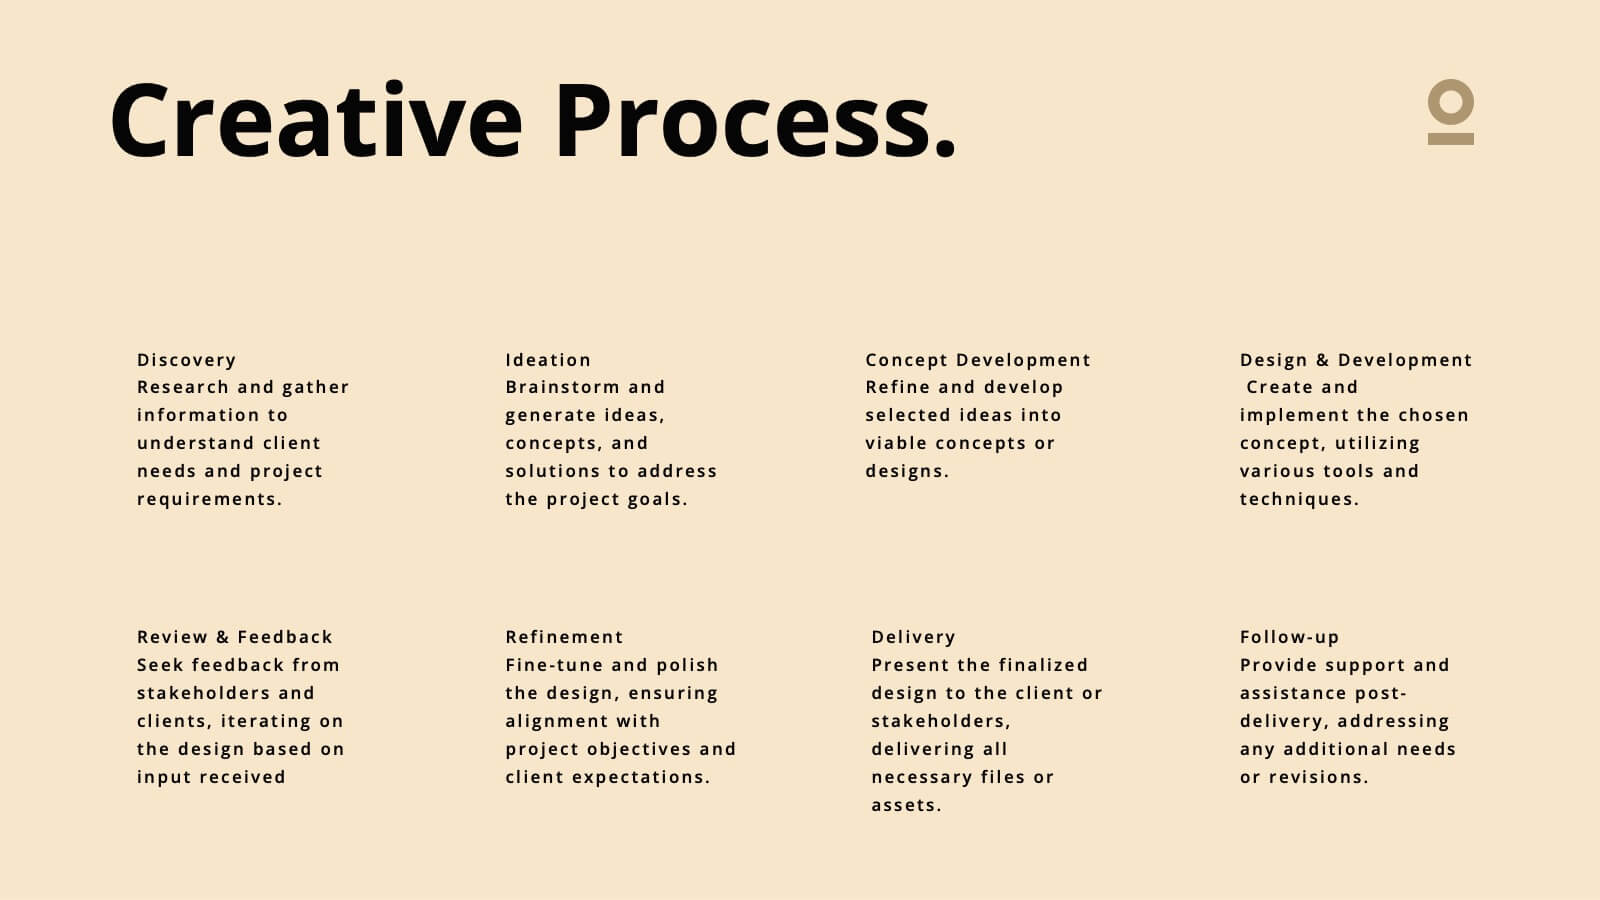
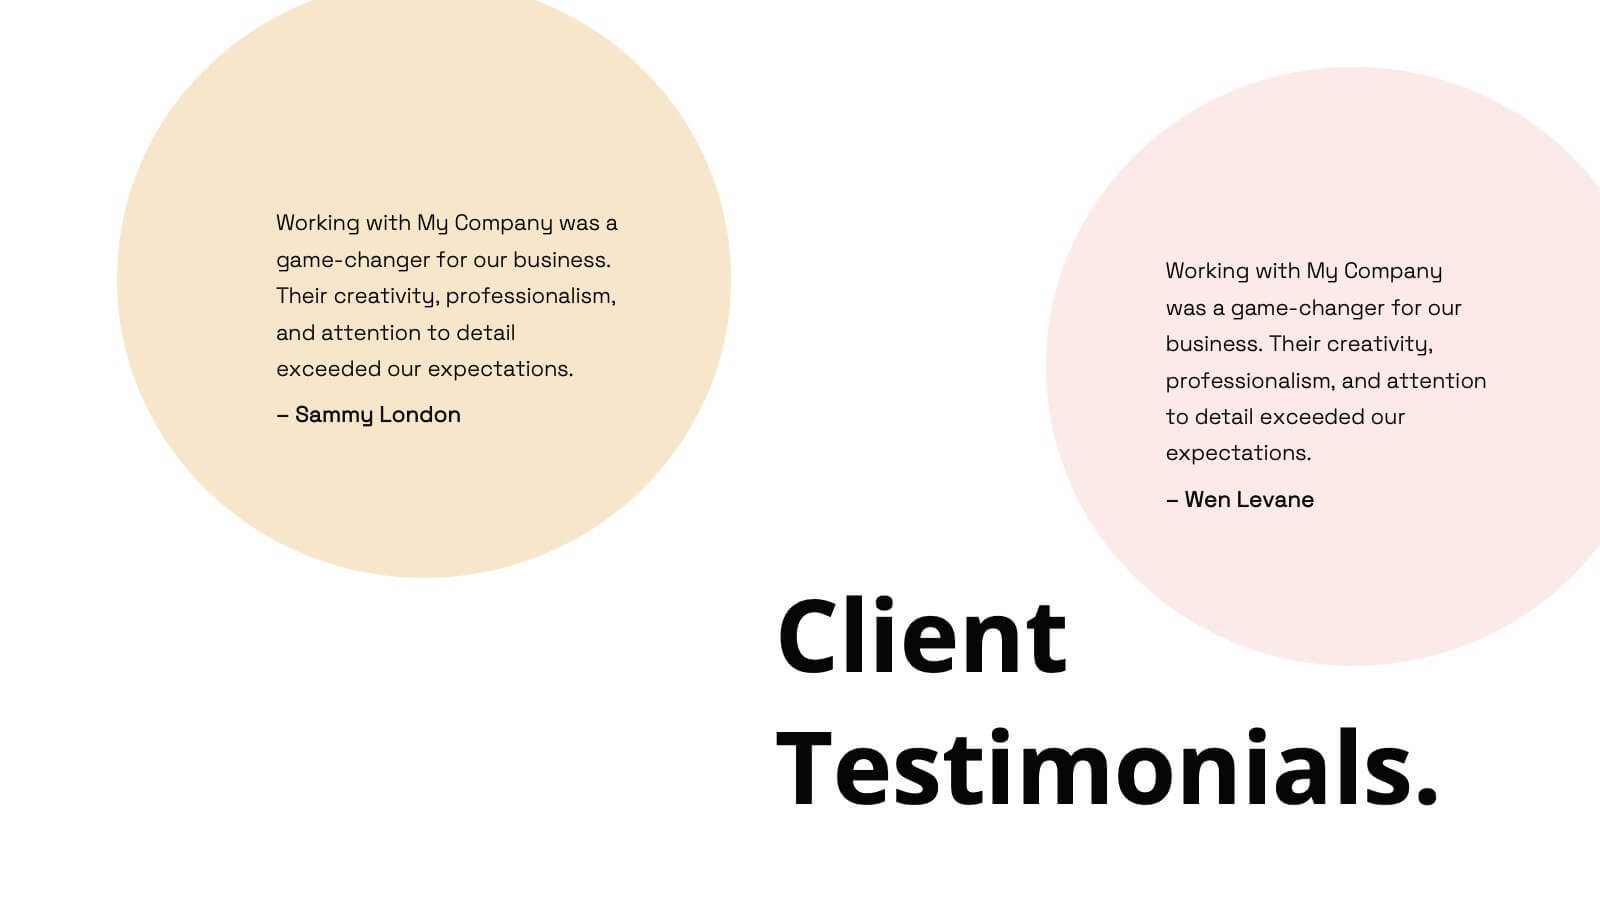
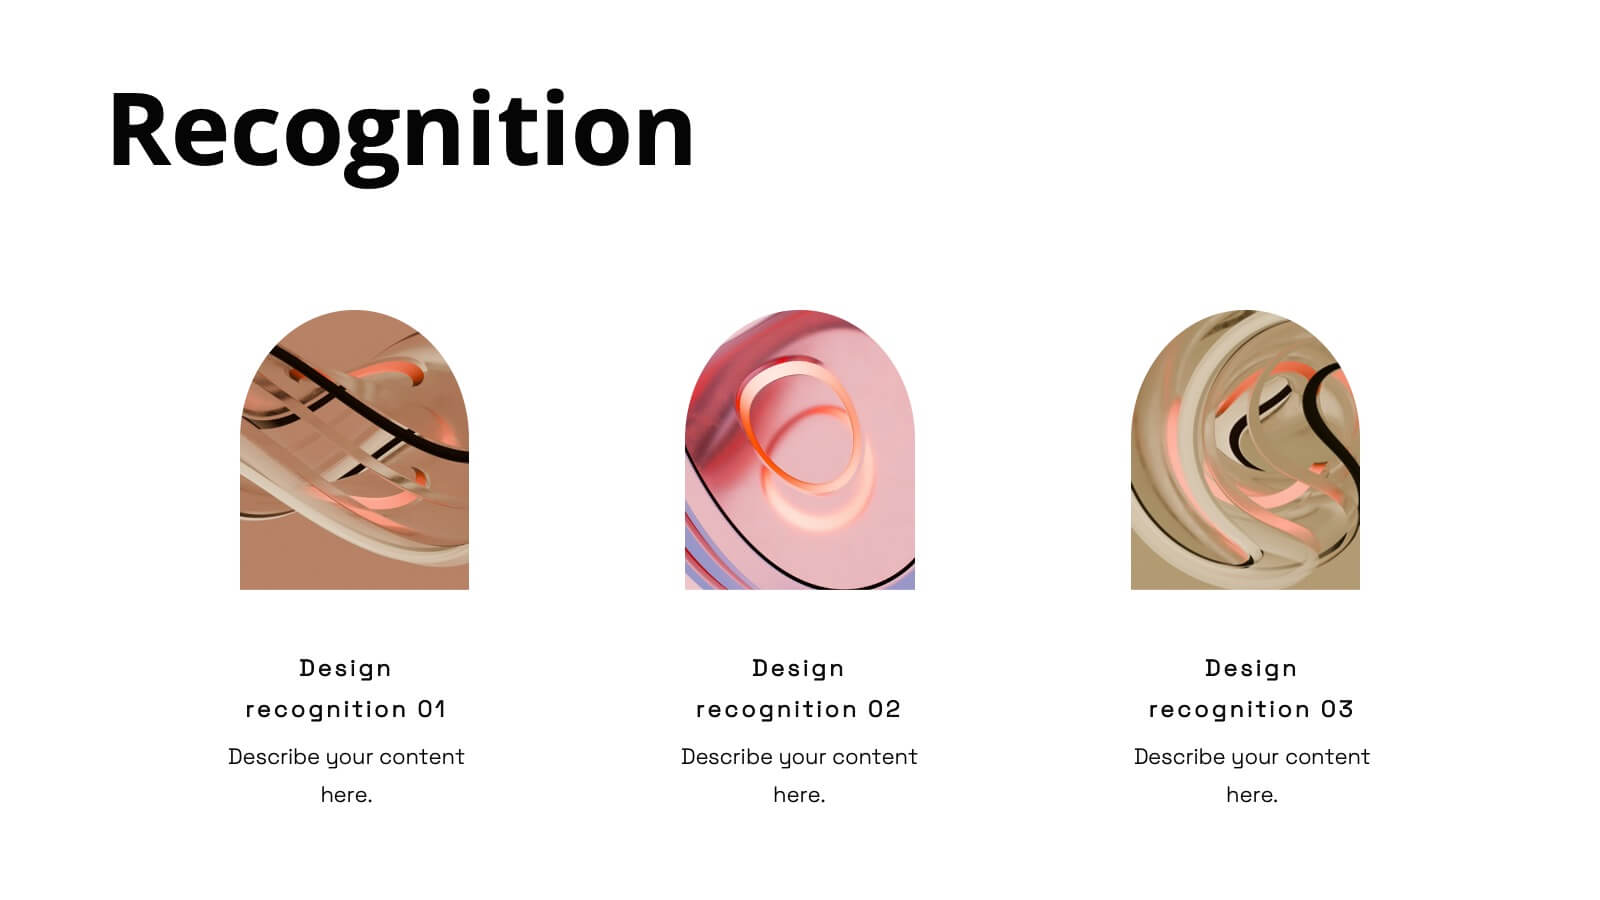
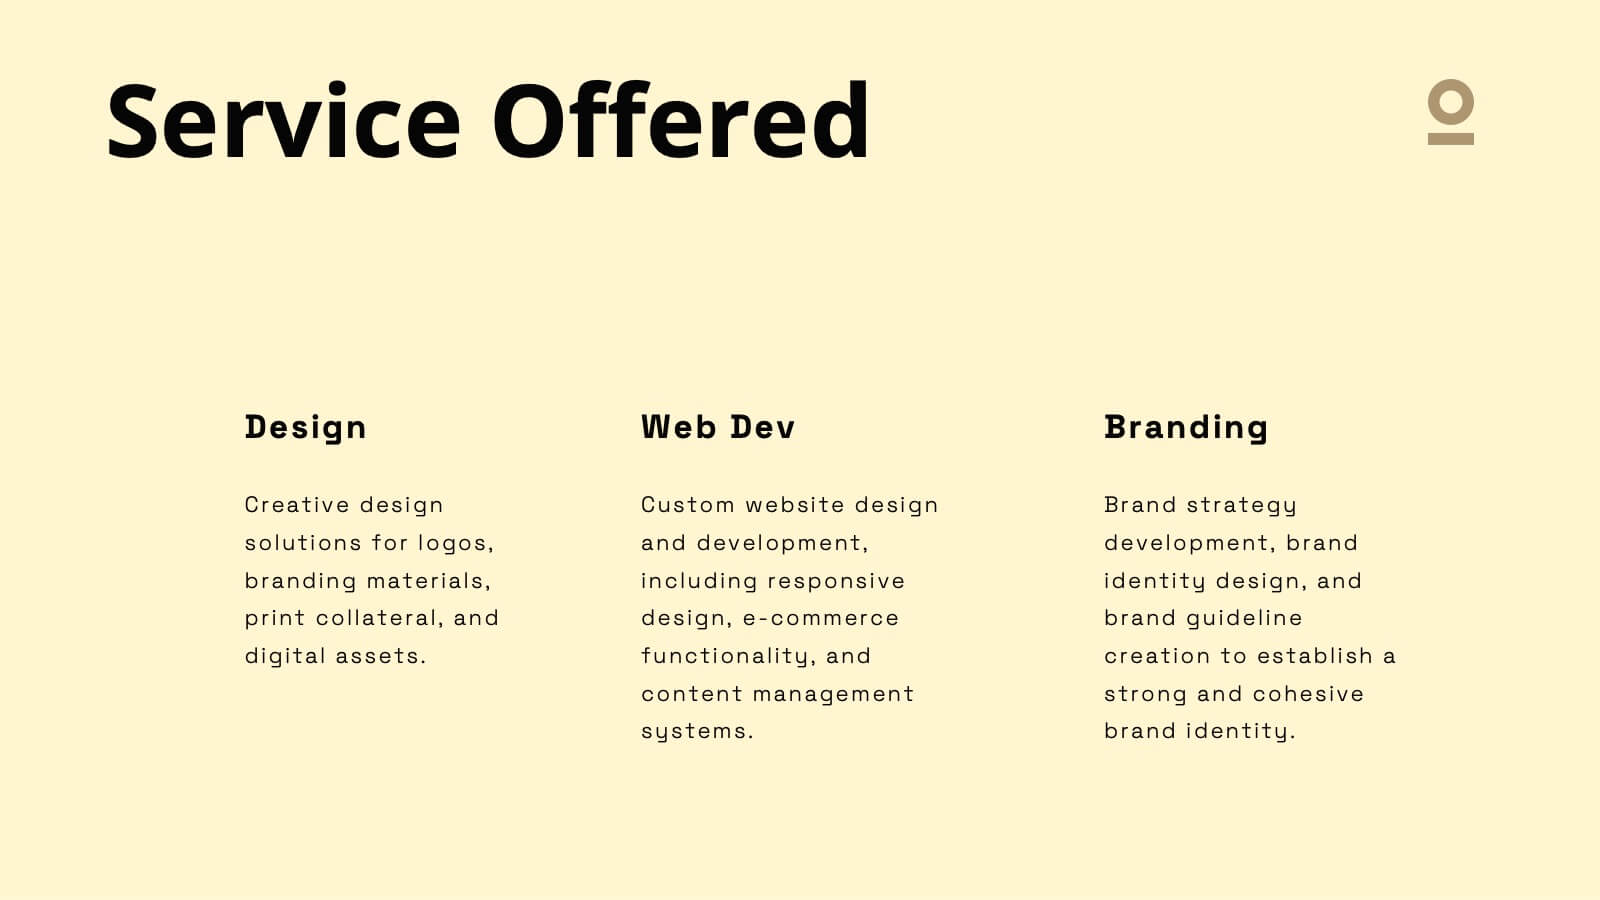
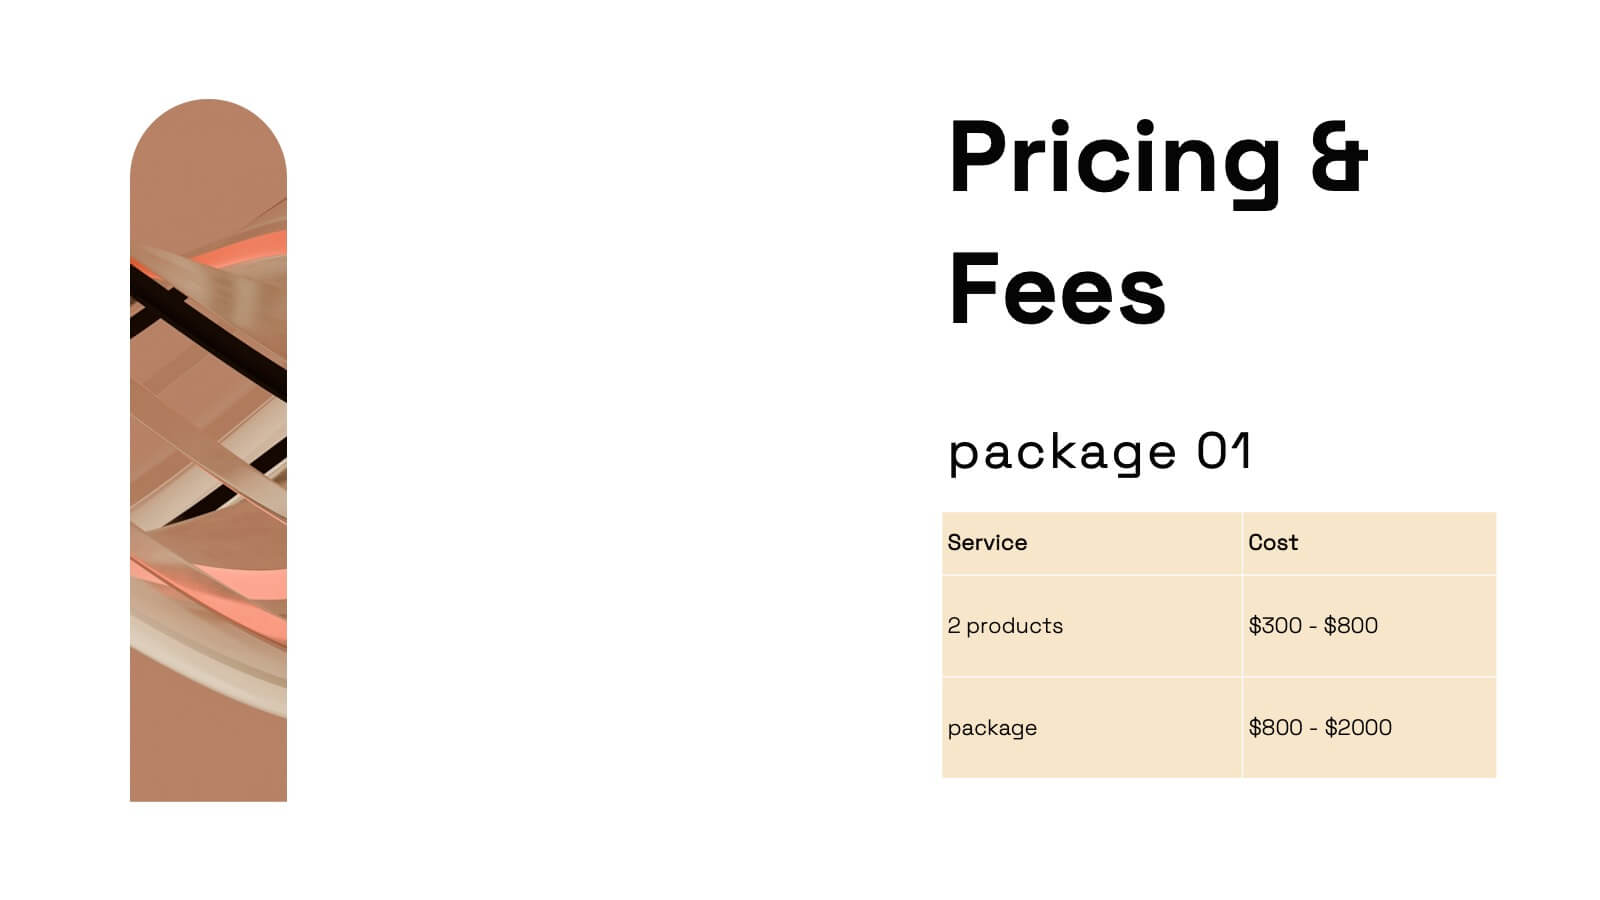
Agency Portfolio Presentation
Elevate your creative agency's presentation with this Agency Portfolio template. It highlights your best projects, core competencies, client testimonials, and unique services. Ideal for showcasing a professional portfolio, it’s compatible with PowerPoint, Keynote, and Google Slides, facilitating a dynamic and engaging presentation experience.


6 diapositivas
Numerical Data Infographic Presentation
Present complex data in a visually engaging way with the Numerical Data Infographic Presentation template. Featuring bar charts, percentage indicators, and segmented data visuals, this template makes statistical analysis clear and digestible. Perfect for business reports, analytics presentations, and performance reviews, this fully editable set is compatible with PowerPoint, Keynote, and Google Slides.