Scientific Research Presentation
PowerPoint Template and Google Slides Theme
Características
Etiquetas
- Eliminar de favoritos
Plantilla de PowerPoint
1 MB
Plantilla de Google Slides
Enlace externo
Plantilla de Keynote
1 MB
Recomendar
- Eliminar de favoritos
Plantilla de PowerPoint
1 MB
Plantilla de Google Slides
Enlace externo
Plantilla de Keynote
1 MB
7 diapositivas
Cloud Architecture Infographic
Cloud technology is reshaping the digital landscape, and understanding its architecture is paramount. Dive into the intricacies of cloud systems with our cloud architecture infographic, crafted in a crisp white and serene blue palette. This visual tool demystifies the layers and components that constitute cloud frameworks. IT professionals, enterprise architects, and business decision-makers will greatly benefit from this structured depiction. Fully tailored for a smooth experience on PowerPoint, Keynote, and Google Slides, this infographic serves as a cornerstone for all looking to harness the potentials of cloud infrastructure.
- Eliminar de favoritos
Plantilla de PowerPoint
1 MB
Plantilla de Google Slides
Enlace externo
Plantilla de Keynote
1 MB
4 diapositivas
Lab Research Data Analysis Layout Presentation
Present your scientific findings with clarity using this Lab Research Data Analysis Layout Template. Featuring molecular, lab flask, and data icons in a connected node design, it's ideal for researchers and analysts. Fully editable in PowerPoint, Keynote, and Google Slides, this clean layout ensures your data is both visual and professional.
- Eliminar de favoritos
Plantilla de PowerPoint
1 MB
Plantilla de Google Slides
Enlace externo
Plantilla de Keynote
1 MB
5 diapositivas
History of Photography Infographics
The History of Photography traces back to the early 19th century when the concept of capturing and preserving images through a camera was first realized. These infographic templates provide a visually stunning format to showcase the key milestones, influential photographers, and technological advancements that shaped the history of photography. The template consists of vertical infographics, making it easy to present information in a visually appealing and organized manner. It is compatible with Powerpoint, Keynote, and Google Slides, ensuring seamless customization and adaptability to your specific needs.
- Eliminar de favoritos
Plantilla de PowerPoint
1 MB
Plantilla de Google Slides
Enlace externo
Plantilla de Keynote
1 MB
7 diapositivas
Job Objective Infographic Presentation
A Job Objective is an introduction that summarizes an individual's career goals and objectives. This Template is designed to create a visual experience with a focus of solving your objectives, showcasing your expertise and individuality. Use this infographic to help you visually communicate your knowledge and skills with a powerful presentation. Highlight your experience, skills and key achievements. You can edit the graphics, photos, data and text in this template so that it fits your needs perfectly. All you have to do is just download this template in PowerPoint, Keynote, or Google Slides.
- Eliminar de favoritos
Plantilla de PowerPoint
1 MB
Plantilla de Google Slides
Enlace externo
Plantilla de Keynote
1 MB
5 diapositivas
Brief Overview of Key Insights Presentation
Present essential information at a glance with this Brief Overview of Key Insights slide. Designed around a bold key graphic, this layout highlights up to four major takeaways with icons and concise descriptions. Ideal for summaries, analysis highlights, or recommendations. Fully editable in Canva, PowerPoint, or Google Slides.
- Eliminar de favoritos
Plantilla de PowerPoint
1 MB
Plantilla de Google Slides
Enlace externo
Plantilla de Keynote
1 MB
5 diapositivas
Optimized Process Flow Diagram Presentation
Streamline workflows with the Optimized Process Flow Diagram. This professional template visualizes key business processes for efficient decision-making and execution. Designed for project managers, analysts, and strategists, it ensures a clear, structured overview of sequential steps. Fully editable and compatible with PowerPoint, Keynote, and Google Slides.
- Eliminar de favoritos
Plantilla de PowerPoint
1 MB
Plantilla de Google Slides
Enlace externo
Plantilla de Keynote
1 MB
4 diapositivas
Efficient Workflow Management Presentation
Optimize productivity with the Efficient Workflow Management template, designed to streamline processes and improve task coordination. Ideal for project managers, teams, and businesses, this template visually maps workflows, helping to identify bottlenecks and enhance efficiency. Fully customizable and compatible with PowerPoint, Keynote, and Google Slides for seamless presentations.
- Eliminar de favoritos
Plantilla de PowerPoint
1 MB
Plantilla de Google Slides
Enlace externo
Plantilla de Keynote
1 MB
5 diapositivas
IT Security and Data Protection Presentation
Communicate your cybersecurity objectives with impact using this clean, shield-based visual layout. This presentation slide features five distinct steps with matching icons, perfect for detailing protocols like data governance, firewall strategies, or access control measures. Ideal for IT professionals, network admins, or compliance teams. Fully customizable and compatible with PowerPoint, Keynote, and Google Slides.
- Eliminar de favoritos
Plantilla de PowerPoint
1 MB
Plantilla de Google Slides
Enlace externo
Plantilla de Keynote
1 MB
5 diapositivas
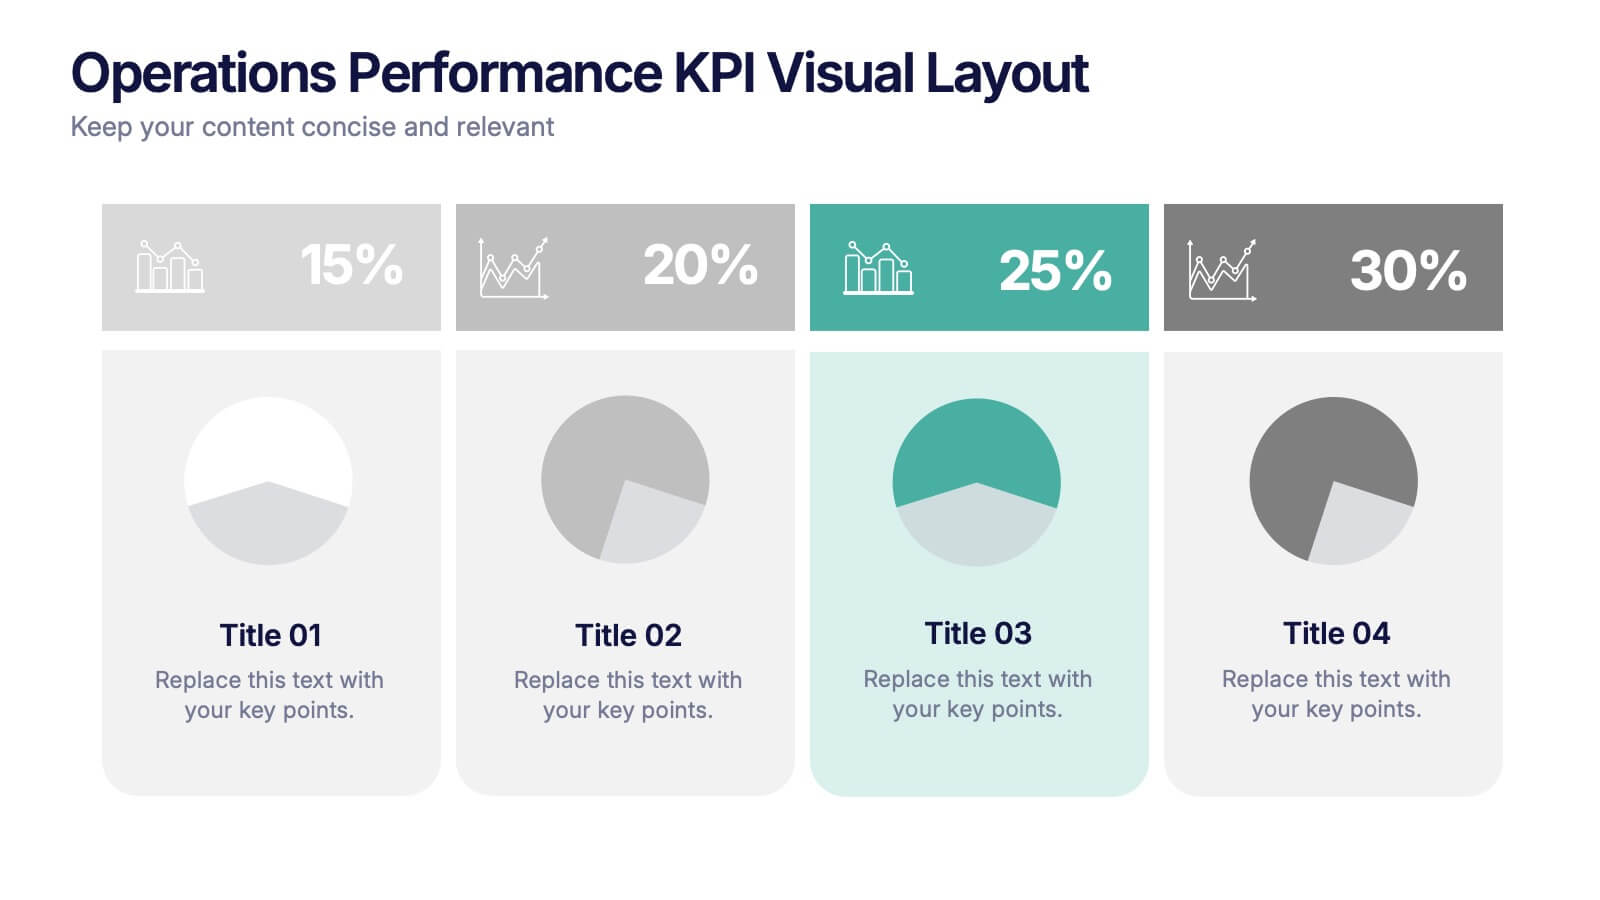
Operations Performance KPI Visual Layout Presentation
Visualize operational KPIs with this clean and modern layout. Highlight four key metrics using pie chart visuals, percentage headers, and customizable labels. Perfect for business operations reviews, performance tracking, or team updates. Fully editable and compatible with PowerPoint, Keynote, and Google Slides for seamless, data-driven presentations.
- Eliminar de favoritos
Plantilla de PowerPoint
1 MB
Plantilla de Google Slides
Enlace externo
Plantilla de Keynote
1 MB
6 diapositivas
Customer Journey Management Infographic
Map out the customer's path to purchase with our intuitive Customer Journey Management Infographic, perfect for Powerpoint, Google Slides, and Keynote. This visual tool helps businesses understand and enhance the customer experience at every touchpoint. Highlight critical stages from awareness to advocacy with distinct, easy-to-follow layouts. Customize it to fit your brand’s journey, showcasing the interactions and emotions customers encounter. Ideal for marketing strategy sessions and client presentations, it simplifies complex consumer behavior into a clear, actionable pathway.
- Eliminar de favoritos
Plantilla de PowerPoint
1 MB
Plantilla de Google Slides
Enlace externo
Plantilla de Keynote
2 MB
6 diapositivas
Territorial Analysis of US Regions Presentation
Present clear regional insights with this Territorial Analysis of US Regions template. Ideal for market segmentation, sales reporting, or demographic studies. Each region is color-coded for quick comparison and fully editable to match your data. Compatible with PowerPoint, Keynote, and Google Slides—perfect for marketers, strategists, or analysts.
- Eliminar de favoritos
Plantilla de PowerPoint
1 MB
Plantilla de Google Slides
Enlace externo
Plantilla de Keynote
1 MB
5 diapositivas
Empathy to Ideation Process Framework Presentation
Visualize the journey from understanding user needs to generating innovative ideas with the Empathy to Ideation Process Framework Presentation. This slide features a side-profile silhouette and five clear, horizontal stages, each representing a key step in design thinking. Ideal for innovation workshops, UX strategy sessions, or educational use. Fully editable in Canva, PowerPoint, Google Slides, and Keynote.
- Eliminar de favoritos
Plantilla de PowerPoint
1 MB
Plantilla de Google Slides
Enlace externo
Plantilla de Keynote
1 MB
6 diapositivas
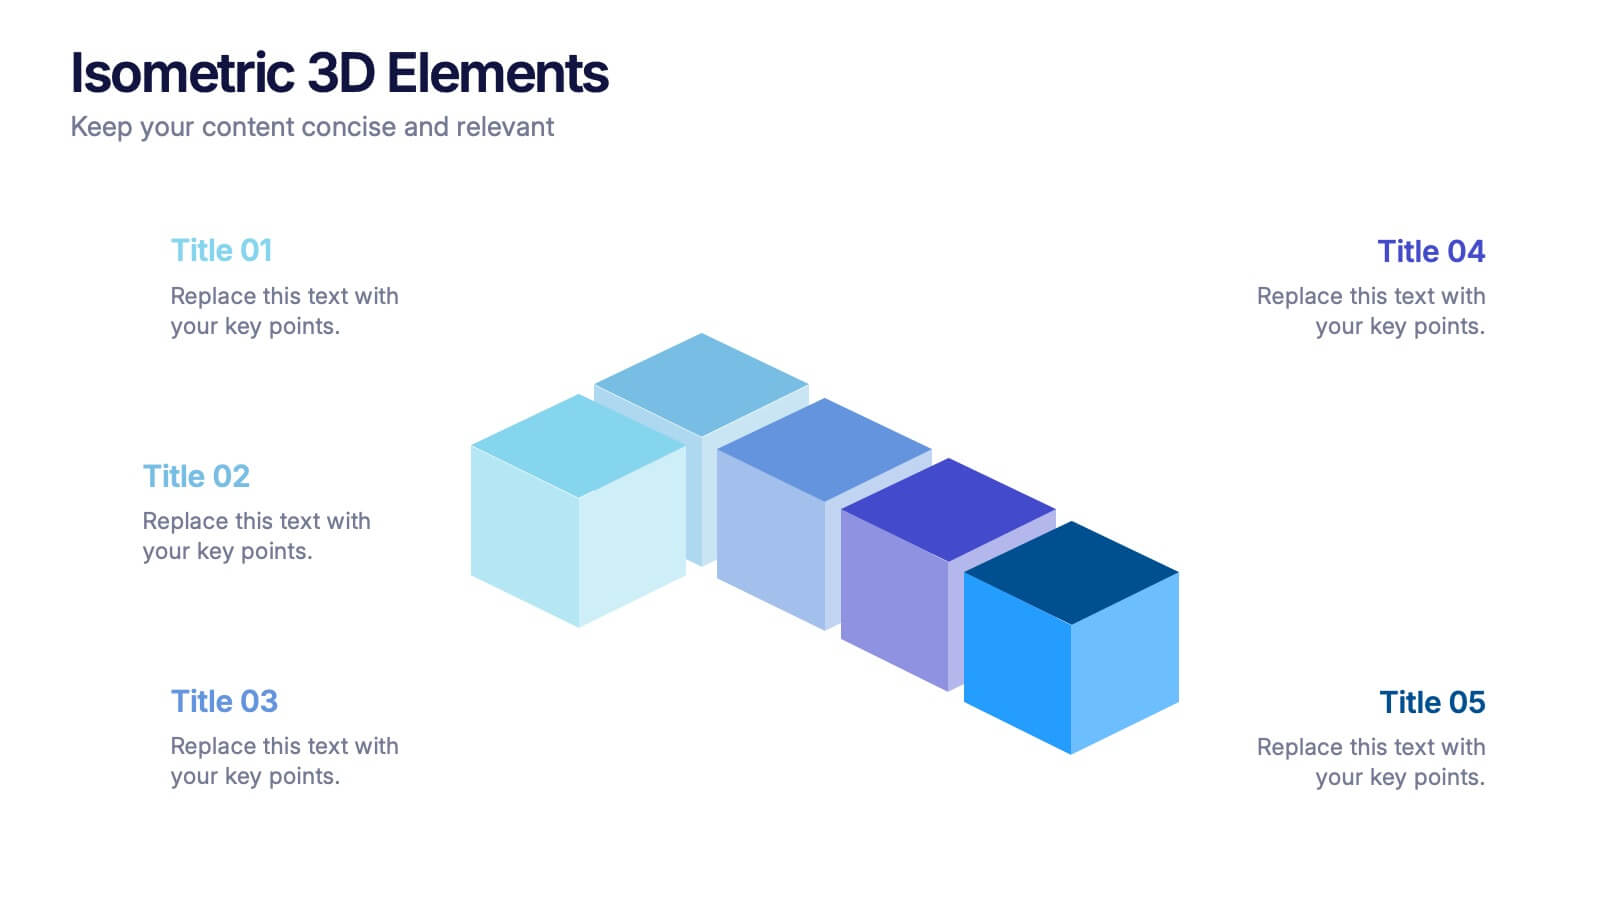
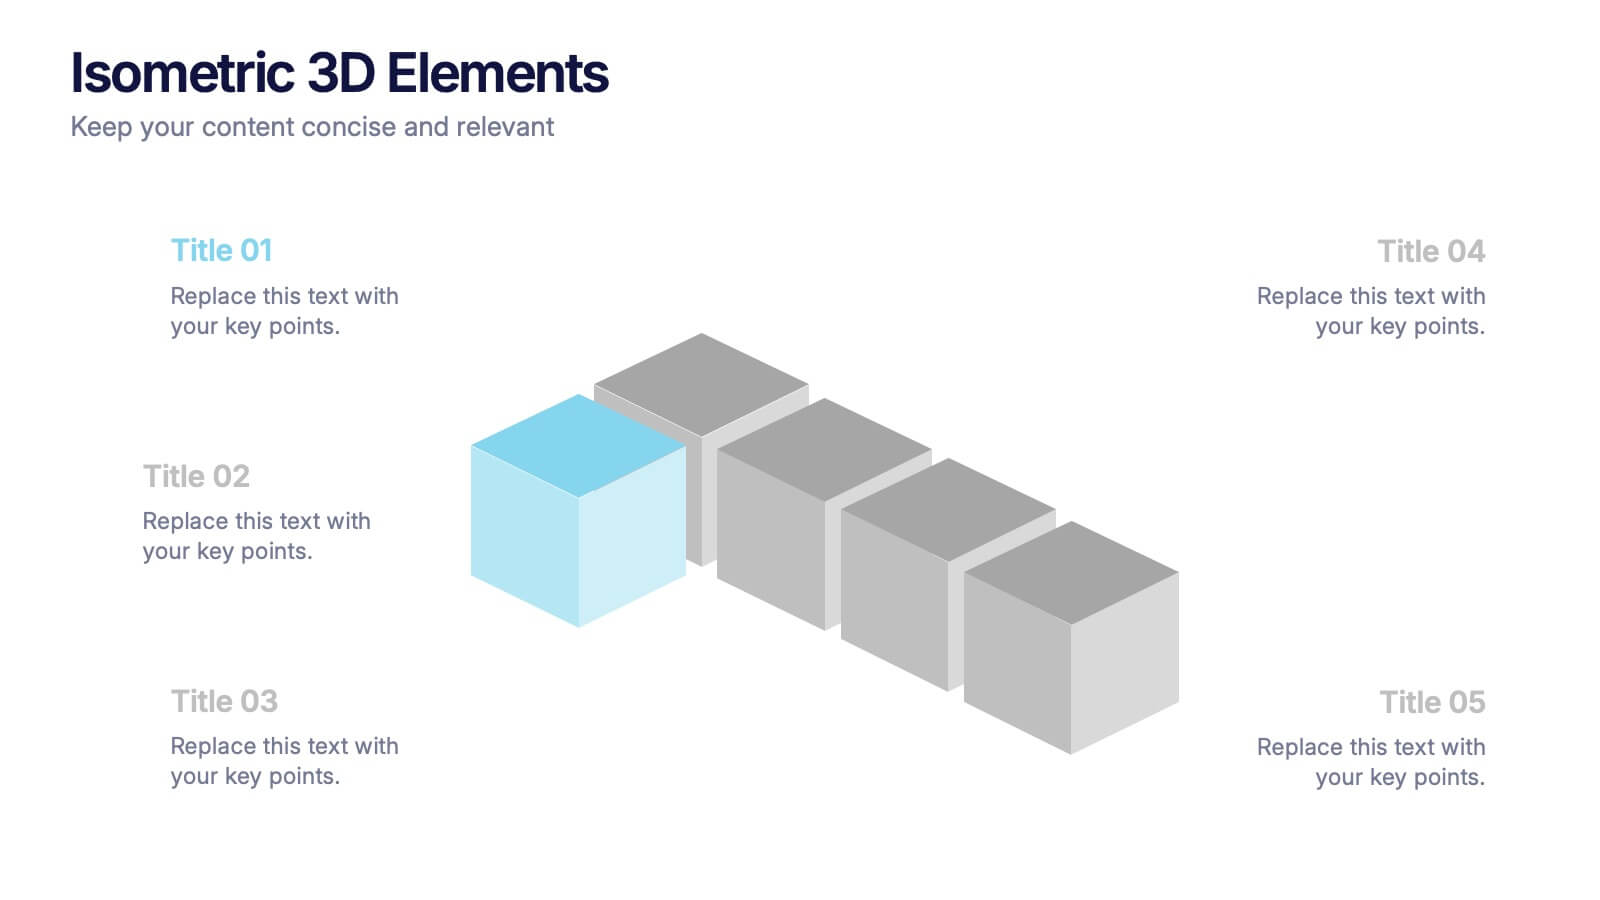
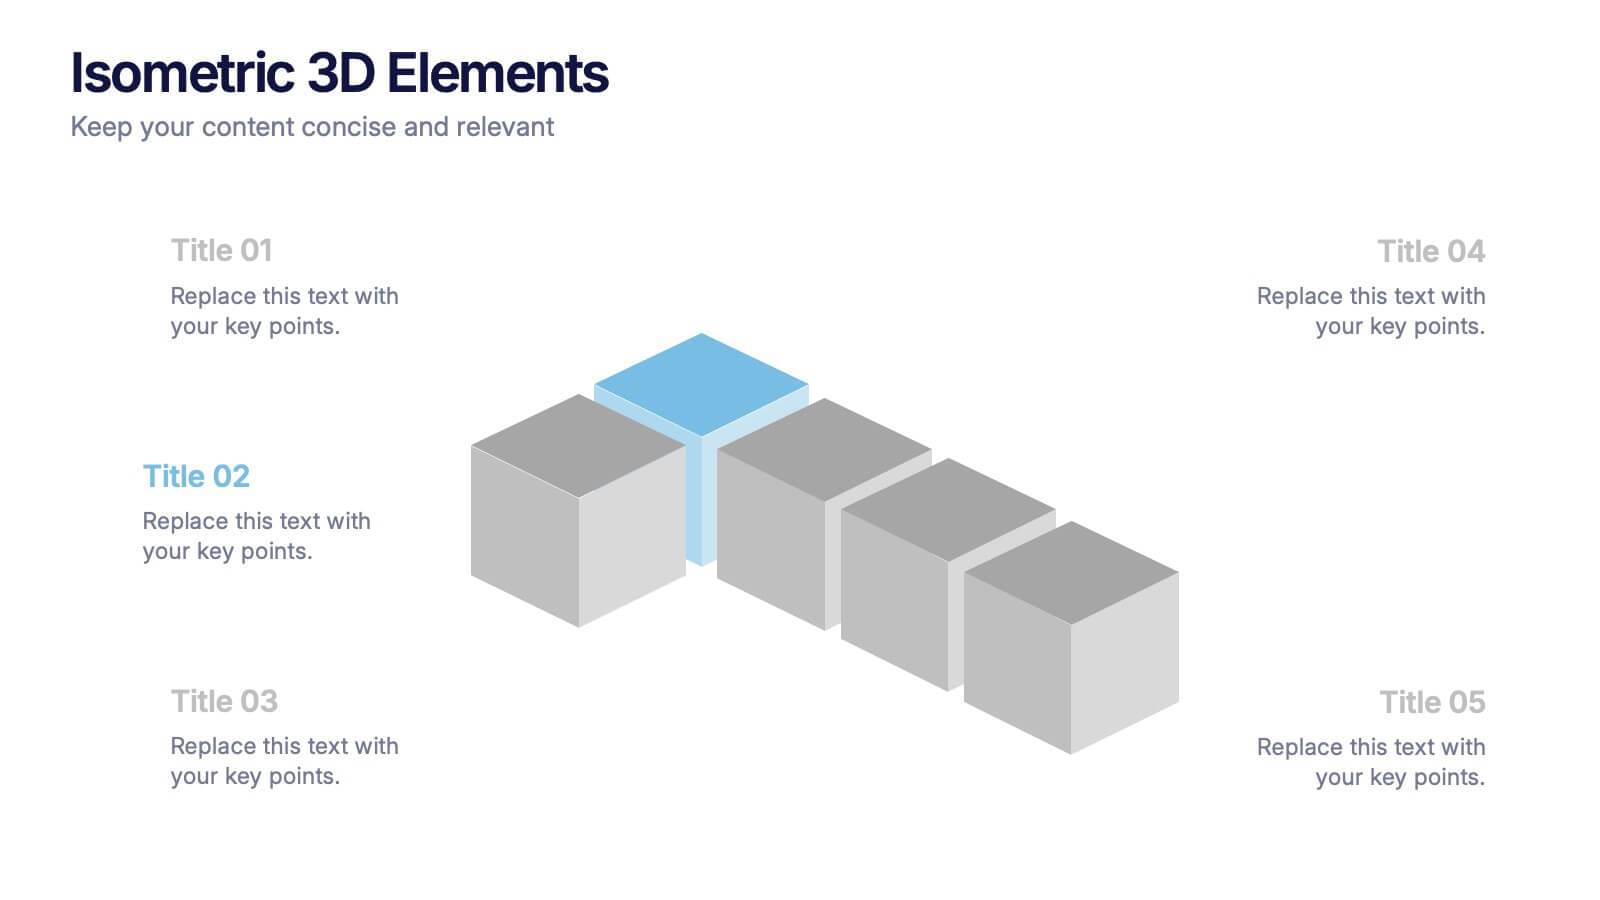
Isometric 3D Elements Presentation
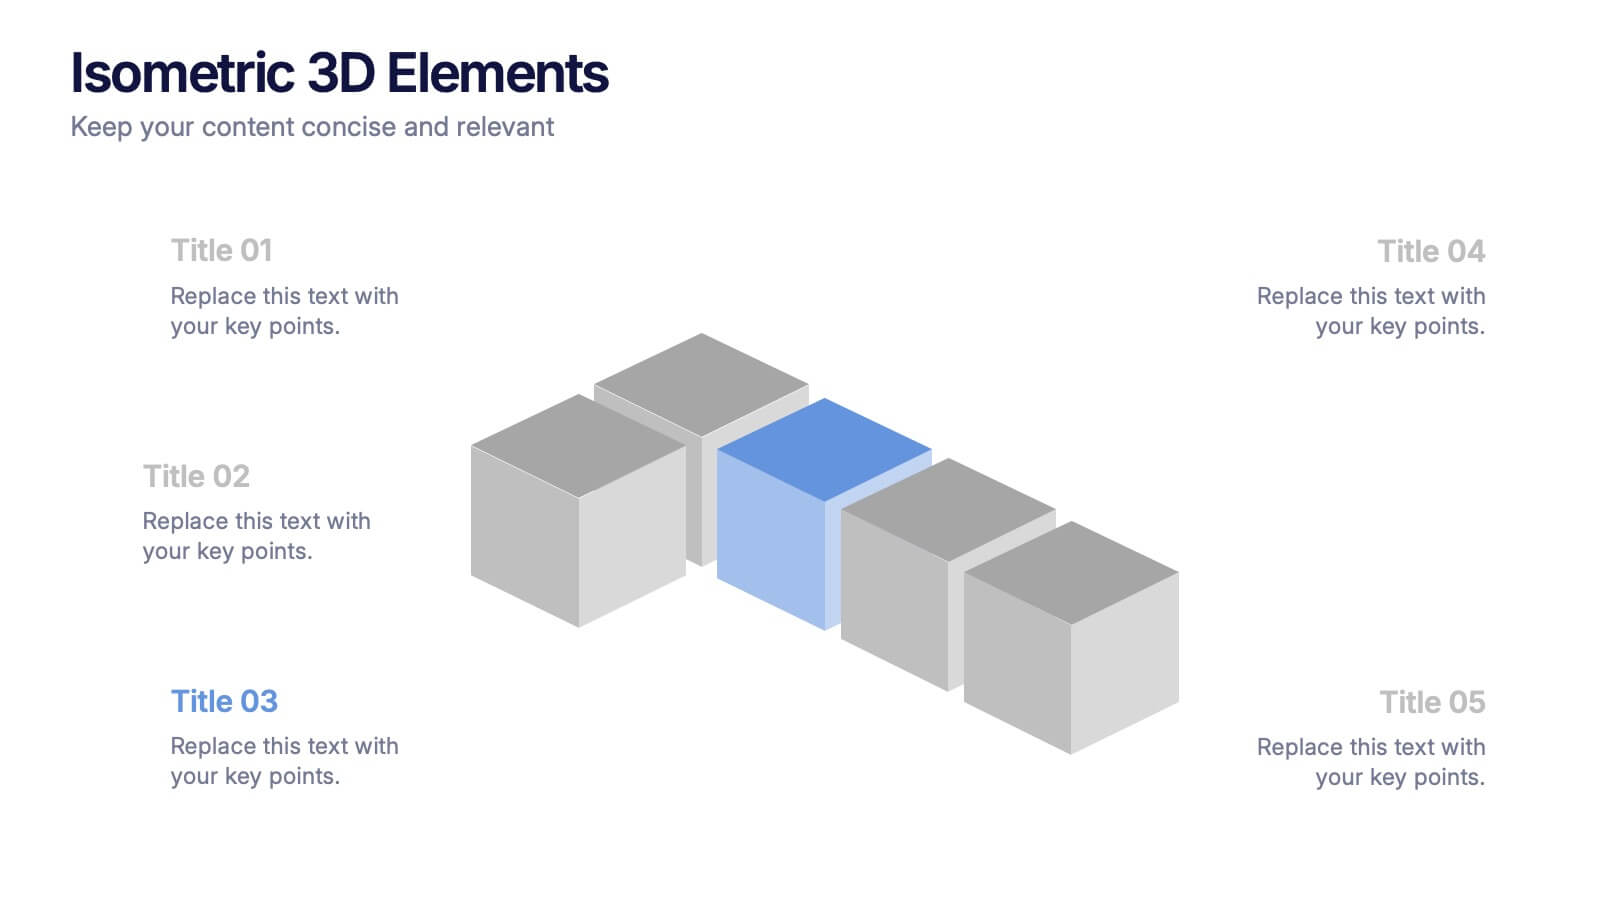
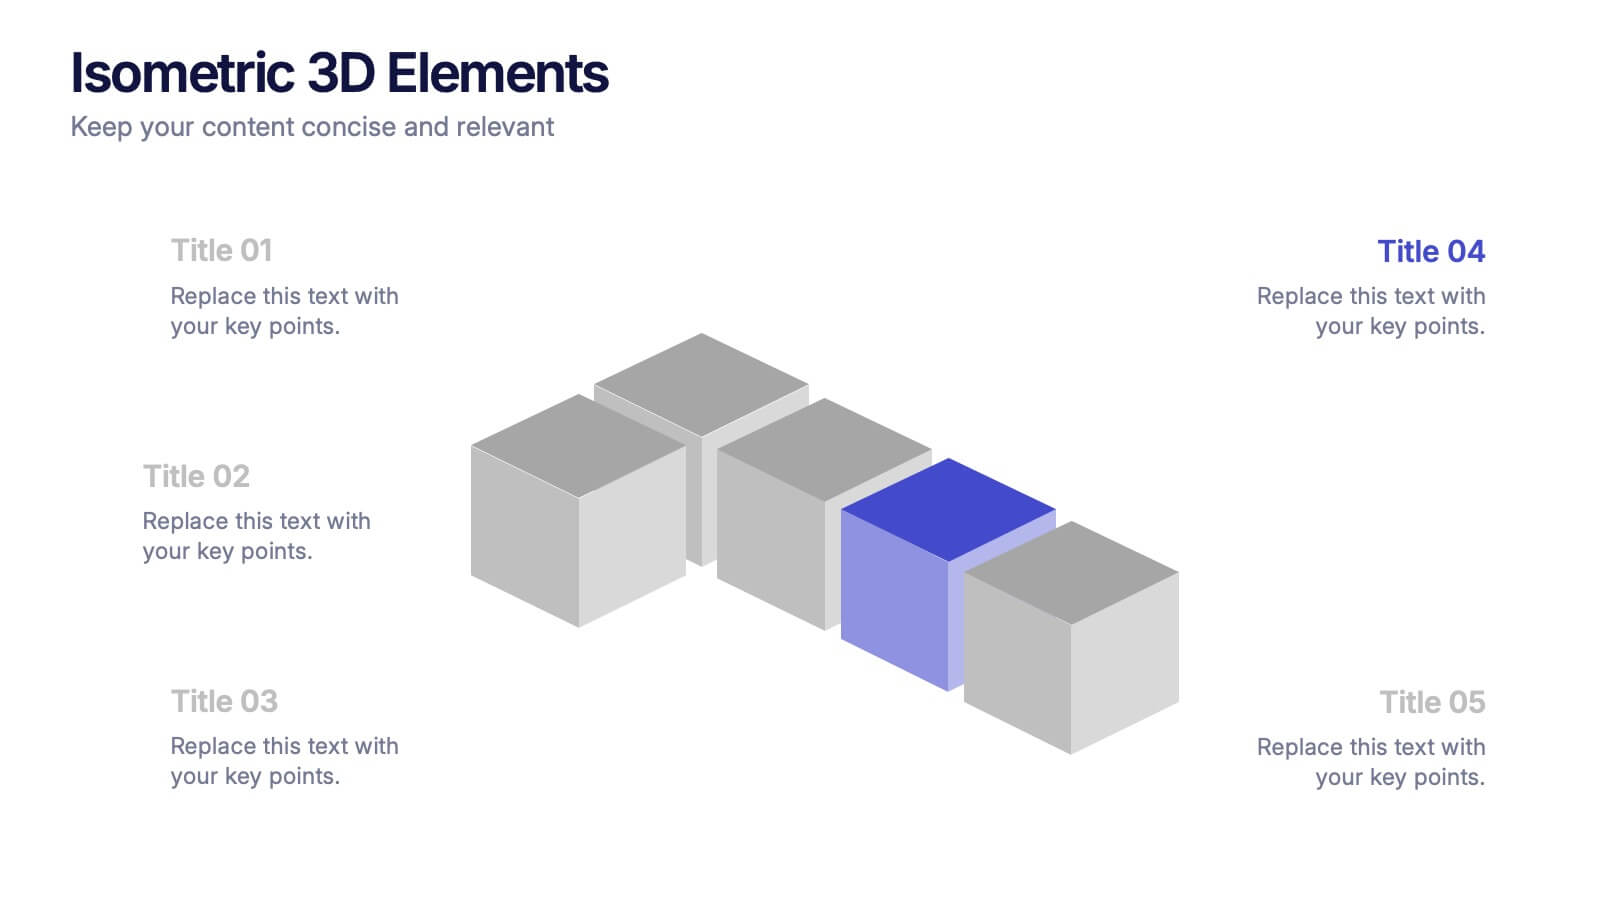
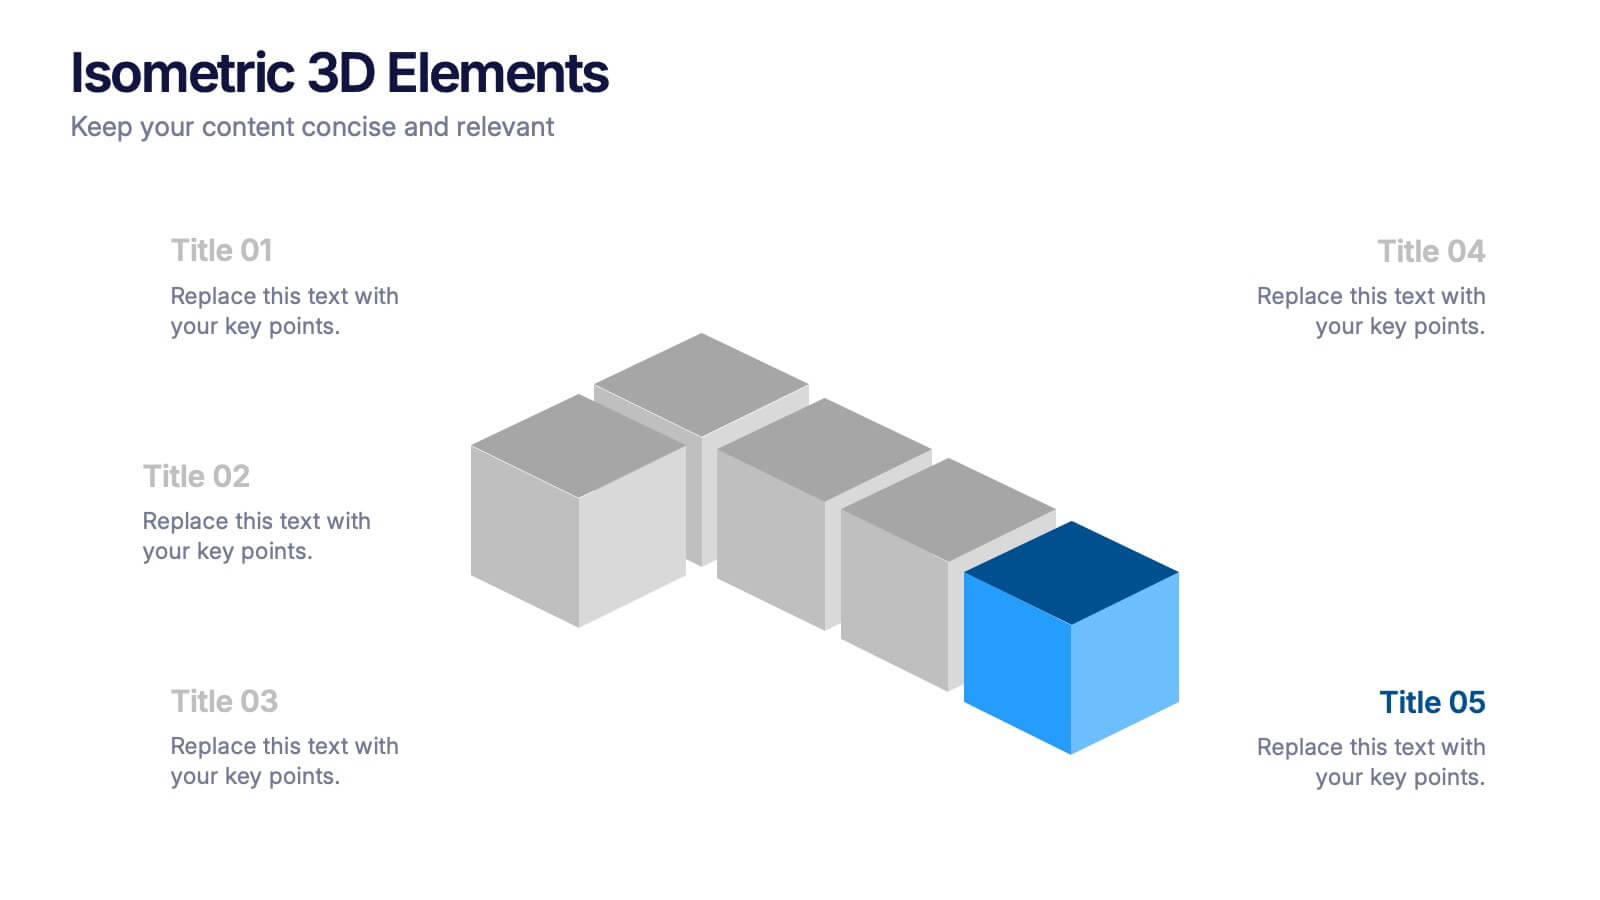
Add depth and dimension to your ideas with this sleek 3D visual layout that transforms flat concepts into engaging graphics. Perfect for showing connected processes, stages, or data structures, it balances clarity with creativity. Fully editable and compatible with PowerPoint, Keynote, and Google Slides for effortless customization.
- Eliminar de favoritos
Plantilla de PowerPoint
1 MB
Plantilla de Google Slides
Enlace externo
Plantilla de Keynote
1 MB
6 diapositivas
Effective Time Management Strategies
Master your productivity with this time-focused infographic template. Featuring a central clock illustration and six surrounding sections, it's perfect for showcasing time-blocking techniques, task prioritization, or team scheduling strategies. Customize each segment with your own insights in PowerPoint, Keynote, or Google Slides. Fully editable for any business use.
- Eliminar de favoritos
Plantilla de PowerPoint
1 MB
Plantilla de Google Slides
Enlace externo
Plantilla de Keynote
1 MB
7 diapositivas
Brain Balance Infographic
Introducing our brain infographic template, it's a colorful, engaging and professional brain diagram. This template is designed for a wide range of applications such as education, blogging, social media, marketing, presentations and other types of projects. This infographic is very easy to edit and customize. Fully customizable and compatible with Powerpoint, Keynote, and Google Slides, you can change text, colors and shapes with just one click. This infographic is perfect for any company that wants to show off their colorful personality. Create an infographic that will get people excited about your brand filled with facts and important information!
- Eliminar de favoritos
Plantilla de PowerPoint
1 MB
Plantilla de Google Slides
Enlace externo
Plantilla de Keynote
2 MB
7 diapositivas
Company Vision and Future Direction
Bring your company’s future into focus with this sleek, icon-led layout designed to showcase strategic goals, values, and long-term vision. Perfect for leadership presentations, investor updates, or team briefings, this slide turns abstract direction into a clear path forward. Fully compatible with PowerPoint, Keynote, and Google Slides.
- Eliminar de favoritos
Plantilla de PowerPoint
1 MB
Plantilla de Google Slides
Enlace externo
Plantilla de Keynote
1 MB
5 diapositivas
Oil Industry Production Infographic
The Oil Industry is an essential component of the global economy, as oil and natural gases are primary sources of energy. This vertical infographic template is a visual representation of data related to the extraction and production of oil and its byproducts. Use this to include statistics and key facts about oil production, including the top oil-producing countries, and the different methods used for extracting and processing oil. This infographic is compatible with PowerPoint, Keynote, and Google Slides, and can be easily edited to match your branding and style to help you effectively communicate your message.


