


Características


¿Tienes alguna pregunta?
Recomendar


5 diapositivas
Comparison Table for Feature Mapping Presentation
Compare your product features with ease using this Comparison Table for Feature Mapping presentation. Ideal for highlighting similarities and differences across multiple offerings, this layout uses clean visuals and color-coded elements to show feature availability per product. Perfect for product teams, marketing, or internal decision-making. Compatible with PowerPoint, Canva, and Google Slides.


21 diapositivas
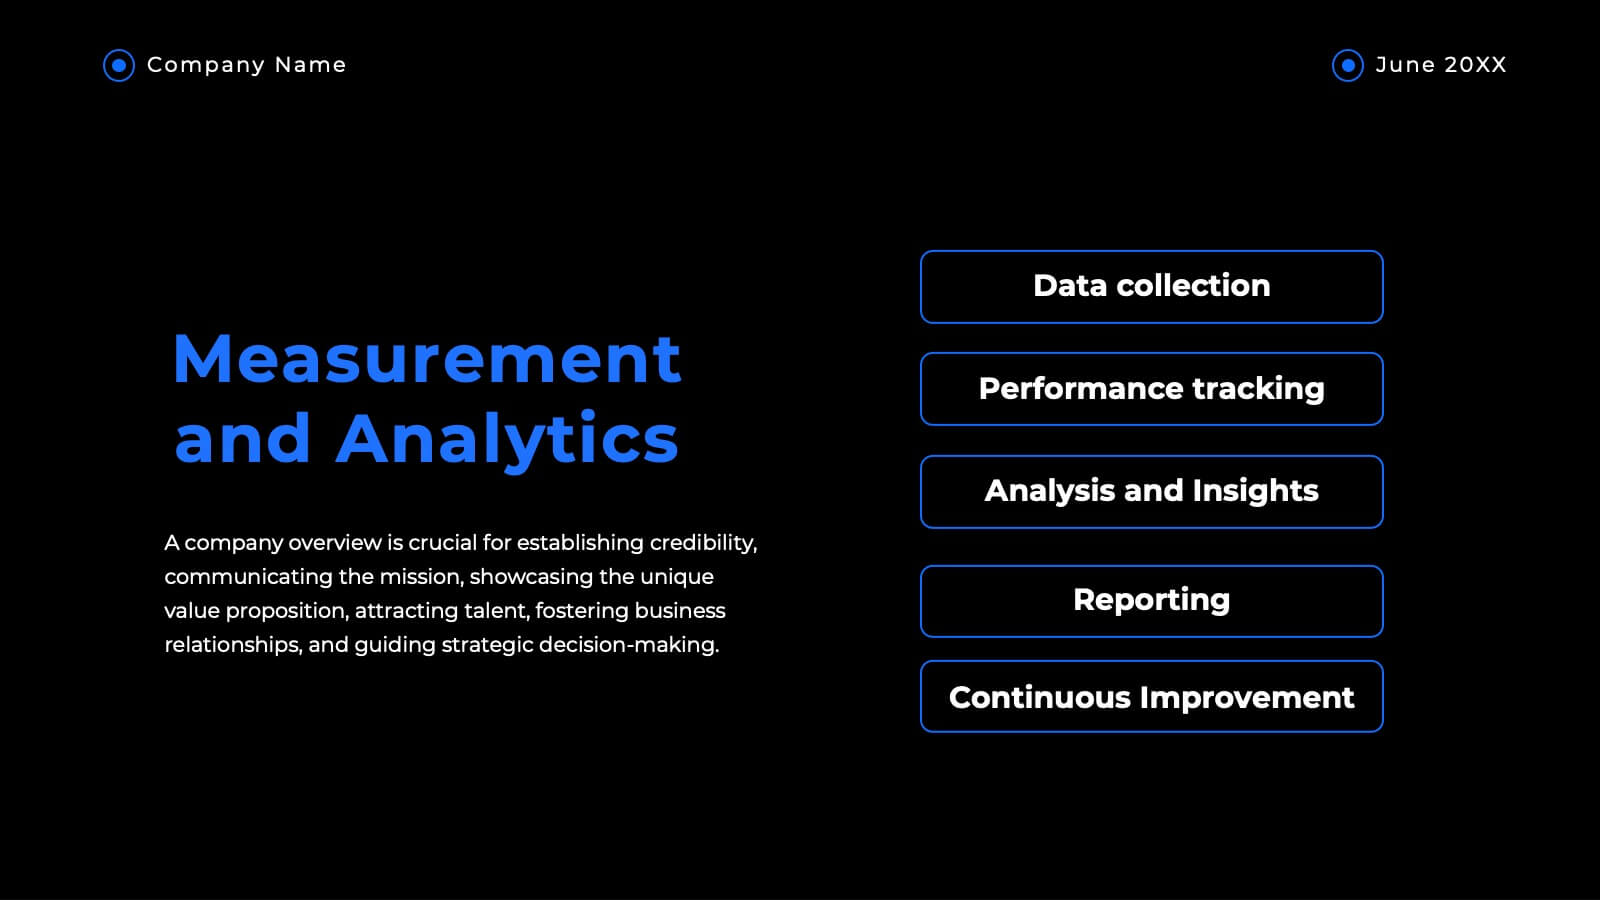
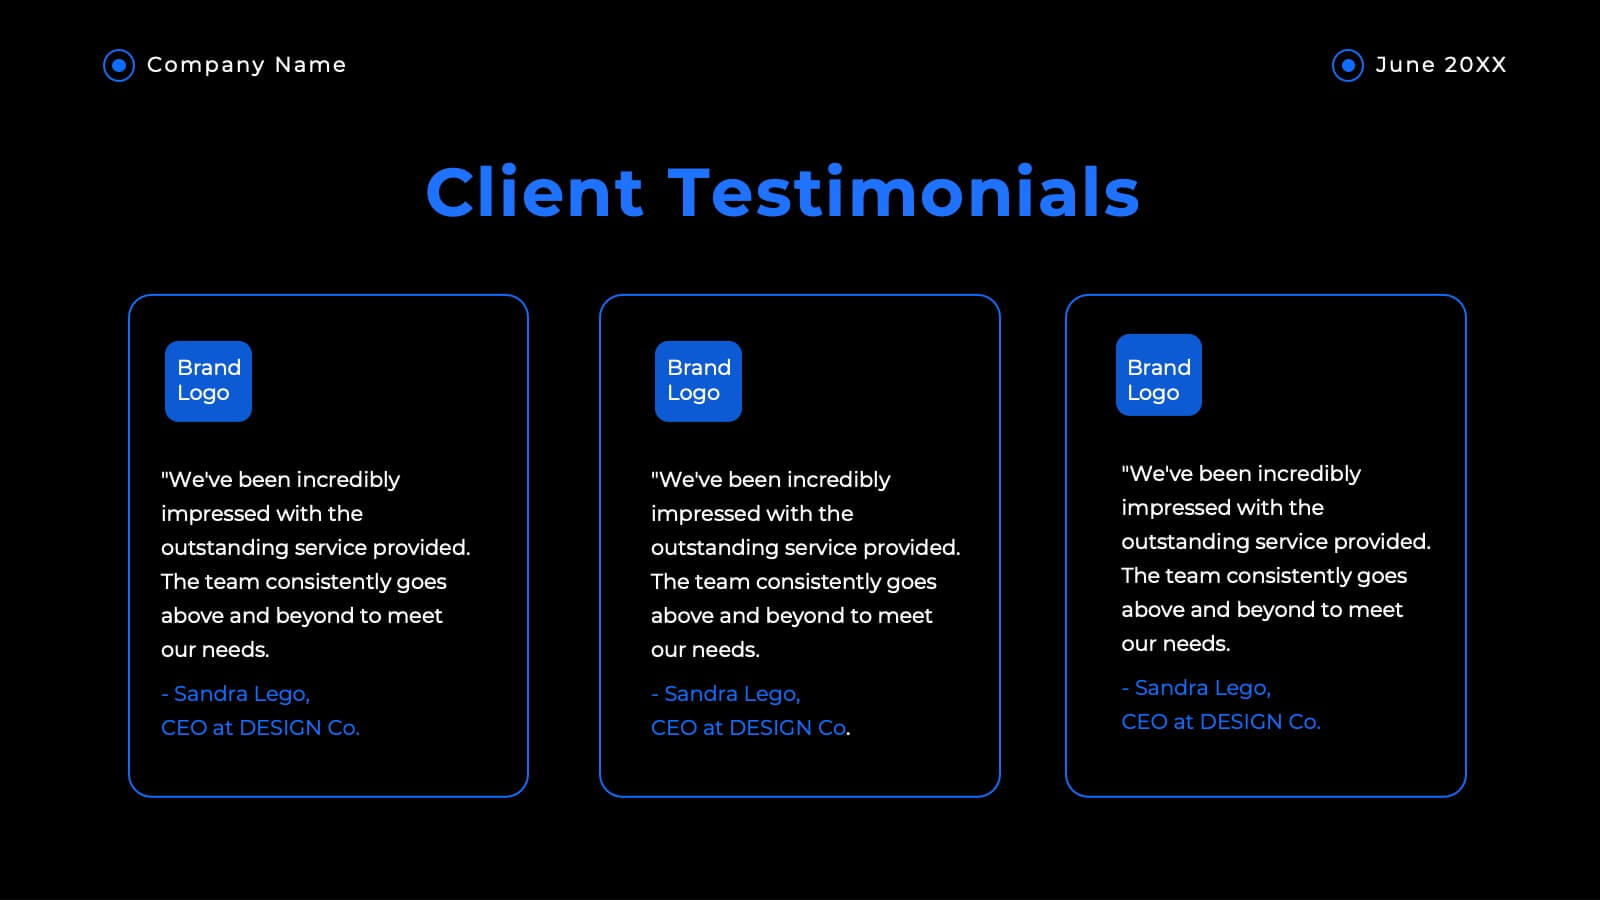
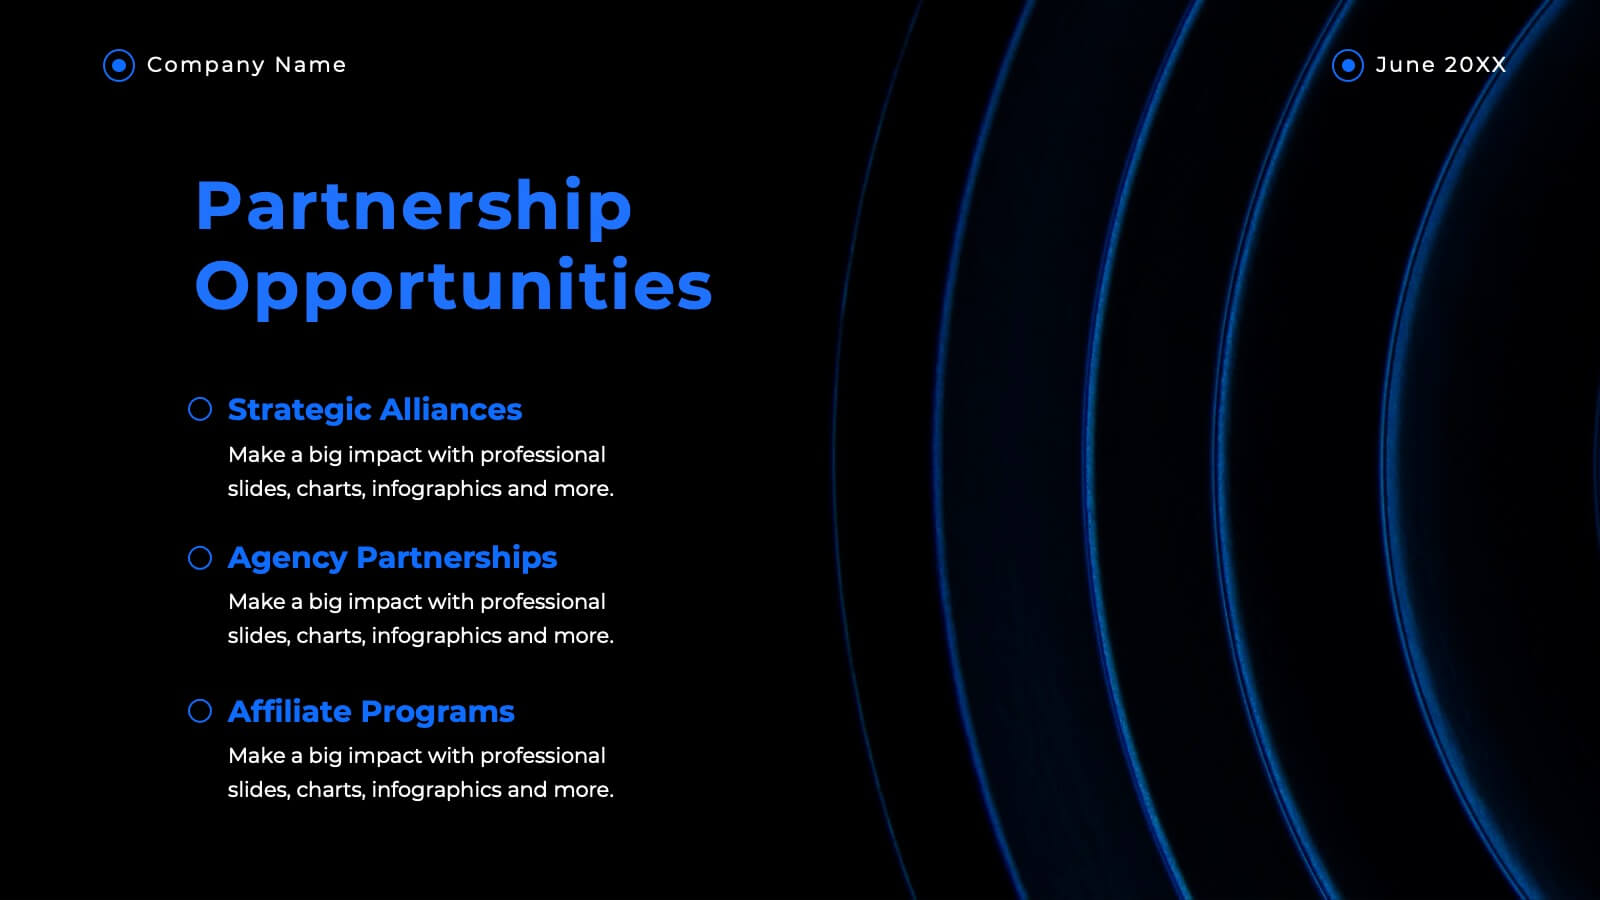
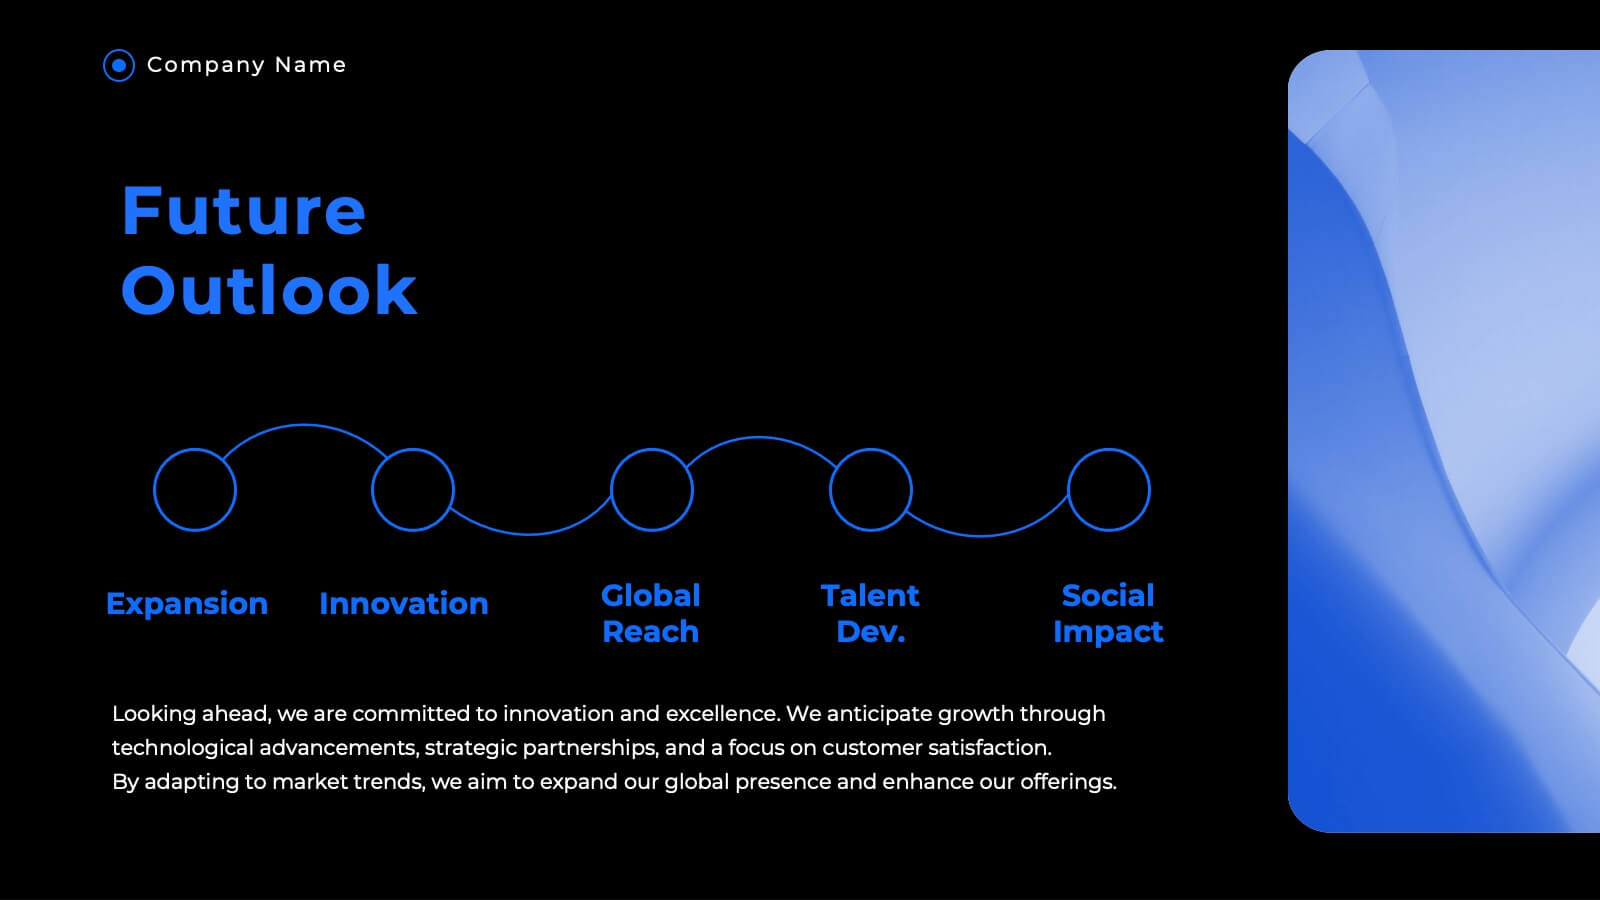
Turquoise Market Analysis Report Presentation
This sleek report presentation template covers essential sections like key performance metrics, market analysis, and strategic initiatives. It’s designed for a professional yet modern look, perfect for showcasing updates and insights. Compatible with PowerPoint, Keynote, and Google Slides, it’s ideal for delivering engaging and impactful business reports.


5 diapositivas
Strategic Business Pillars Model Presentation
Visualize your core strategies with this vertical pillar infographic slide. Each level represents a key focus area or foundational element essential for business success. Ideal for leadership talks, team alignment, or growth strategies. Fully editable in PowerPoint, Keynote, and Google Slides.


6 diapositivas
Discussion Starter and Inquiry Prompt Presentation
Kick off meaningful conversations with style and clarity. This discussion prompt slide uses a flowing layout and droplet-shaped icons to guide teams through key questions or ideas—ideal for brainstorming sessions, workshops, and meeting agendas. It’s a great way to visually organize dialogue. Fully compatible with PowerPoint, Keynote, and Google Slides.


7 diapositivas
Science Infographic Presentation Template
A science infographic is a visual representation of scientific information or knowledge that aims to simplify and communicate complex scientific concepts in a clear and concise way. This template uses charts, images, and other elements to convey information, making it easier for your audience to understand and retain scientific information. Use this Science infographic to cover a wide range of scientific topics, from biology and physics to climate change and space exploration. This can be used in various settings, such as in educational settings, scientific publications, and popular media.

22 diapositivas
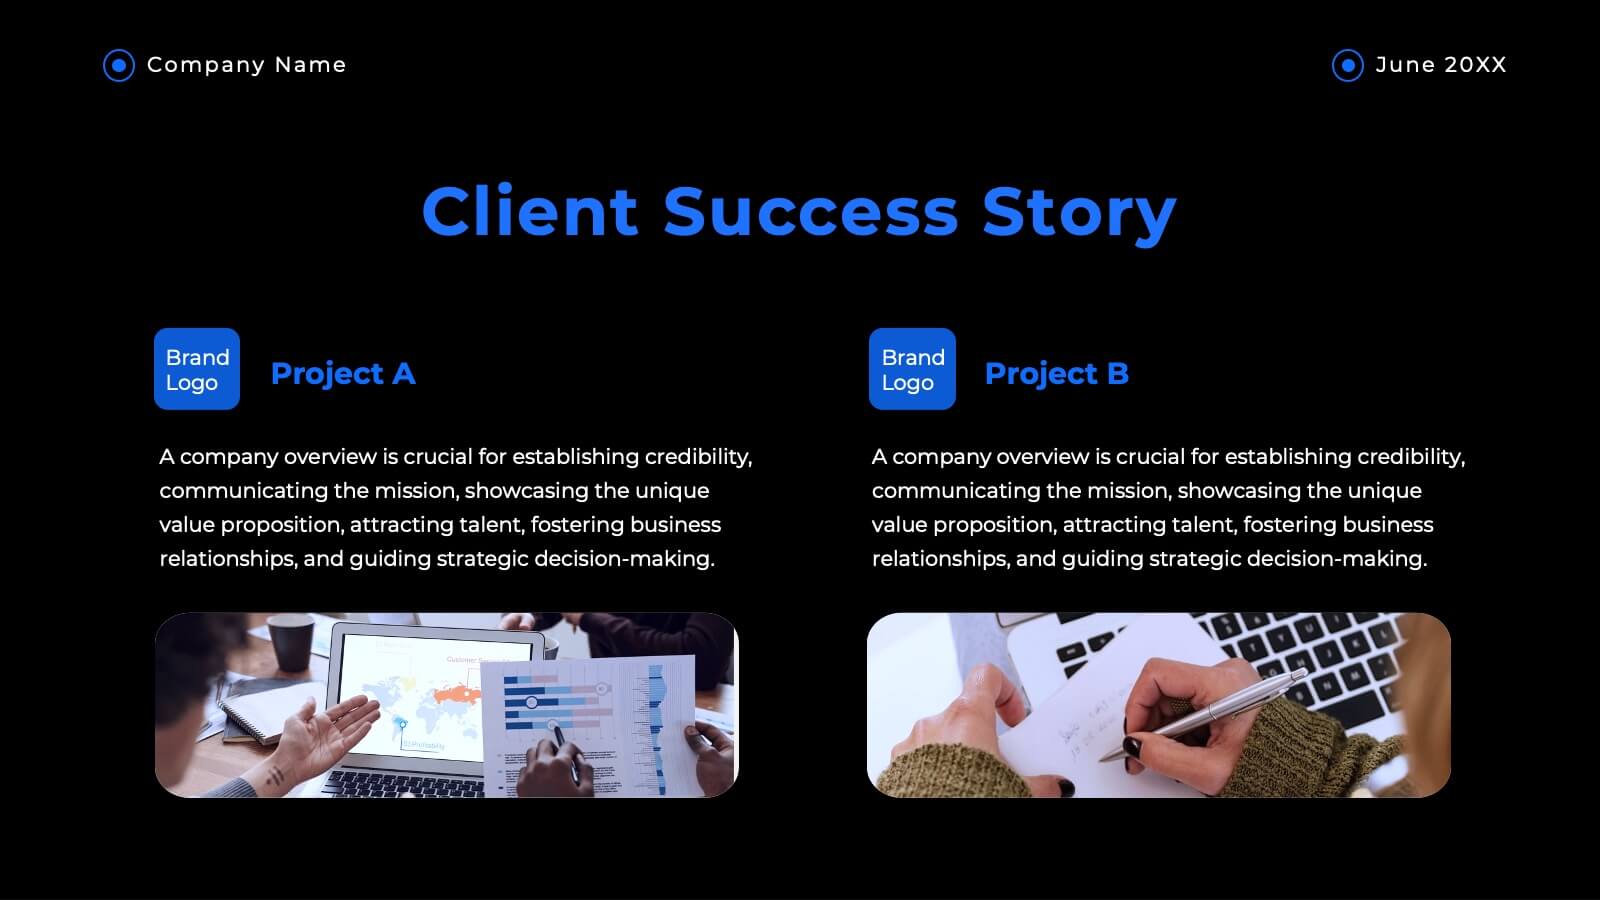
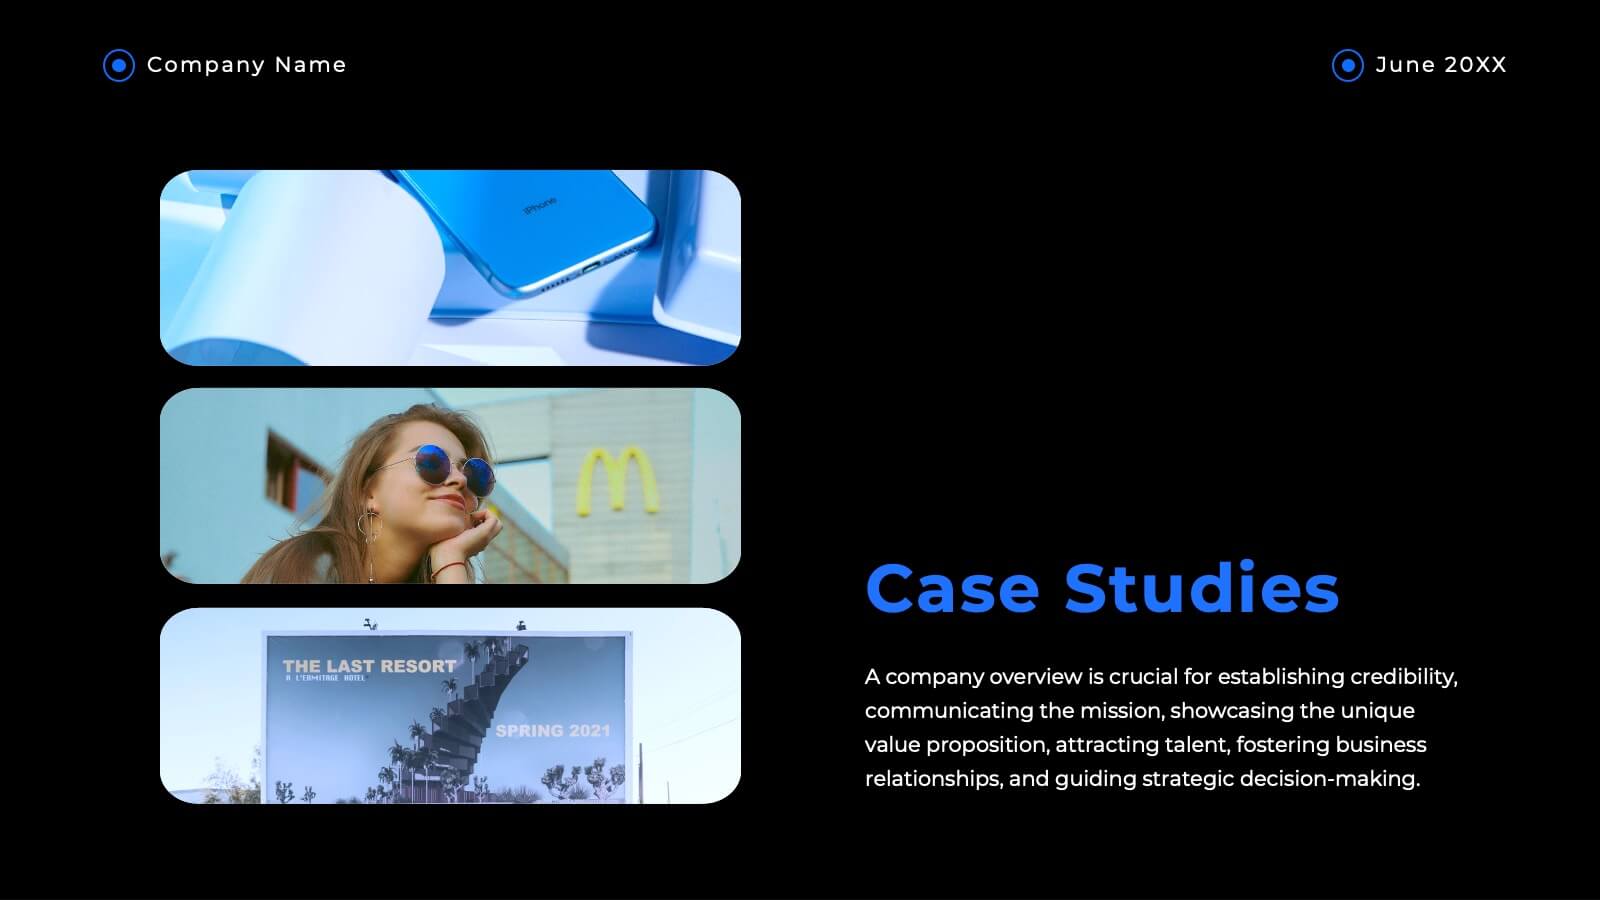
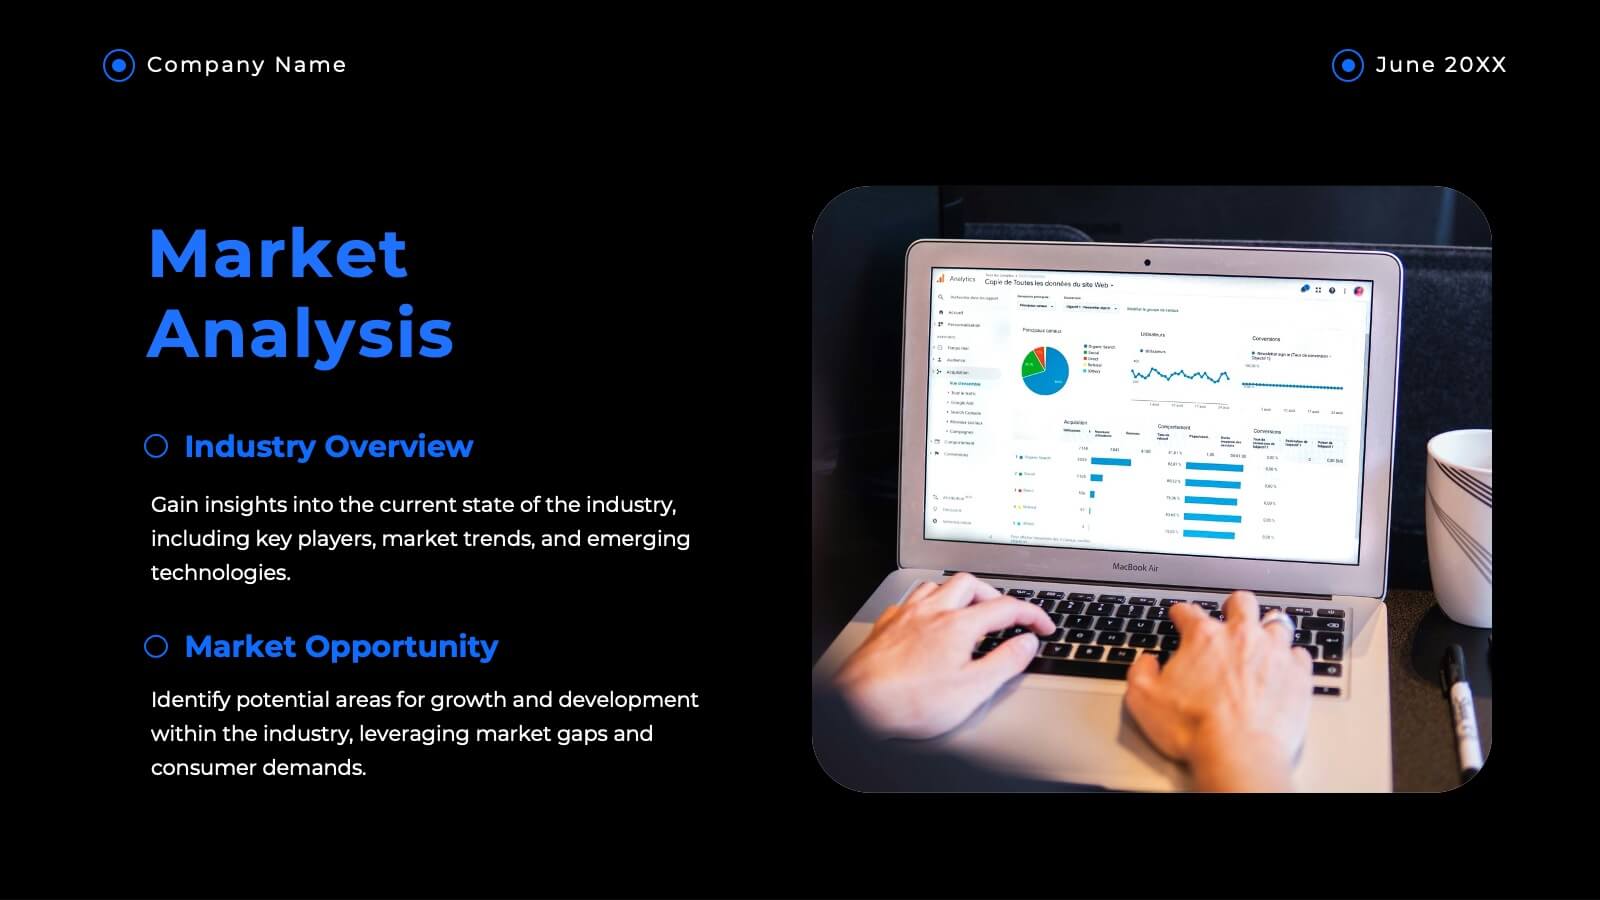
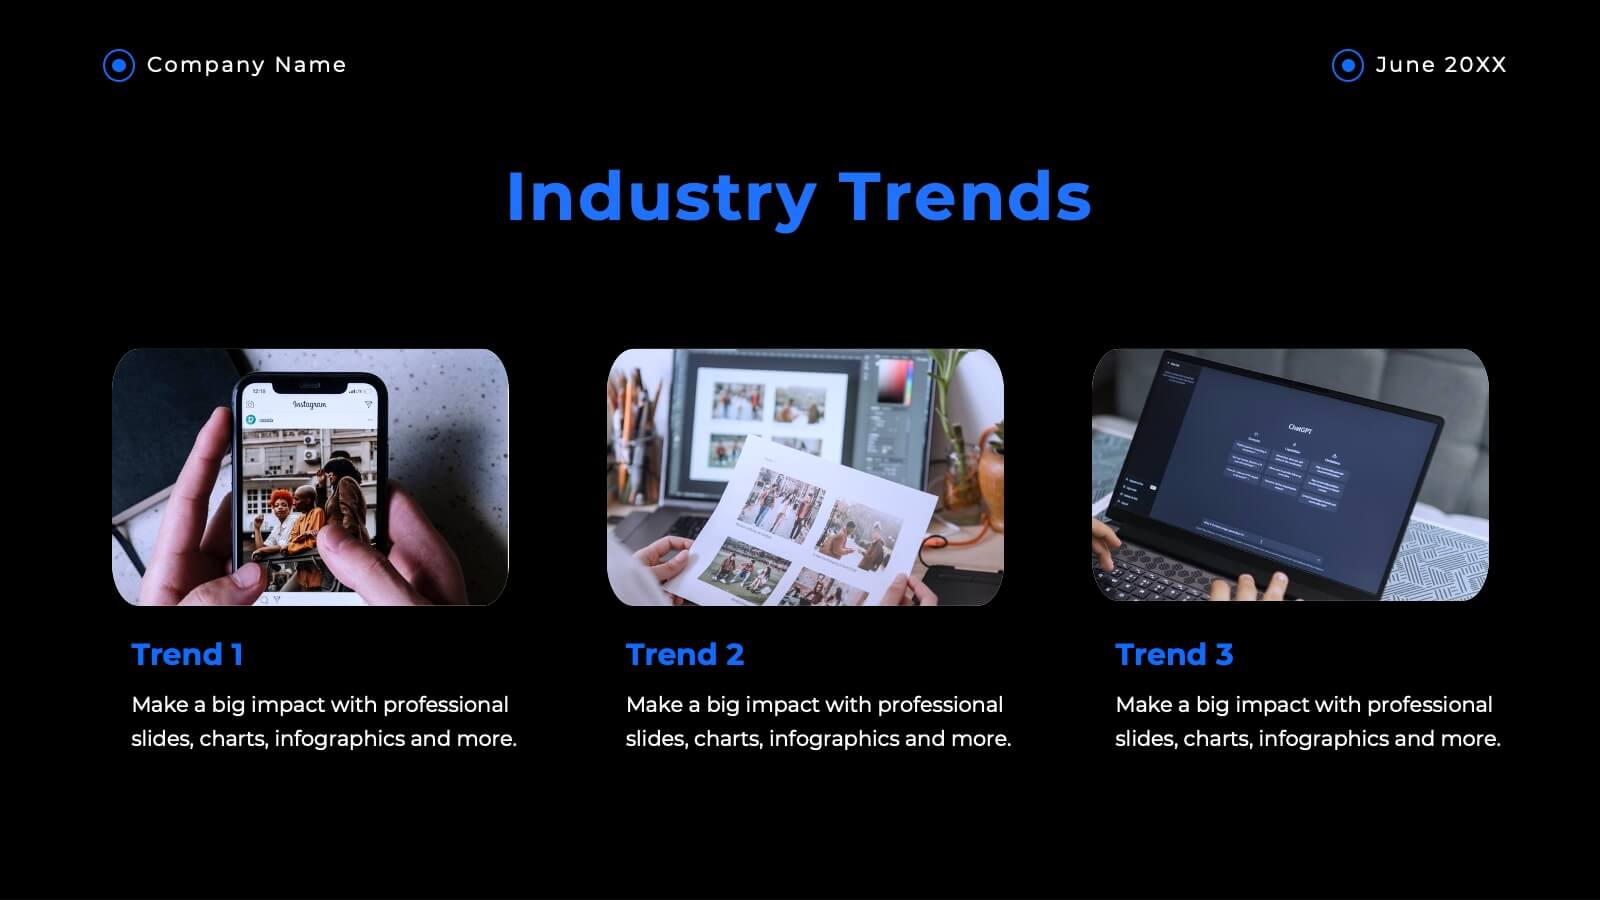
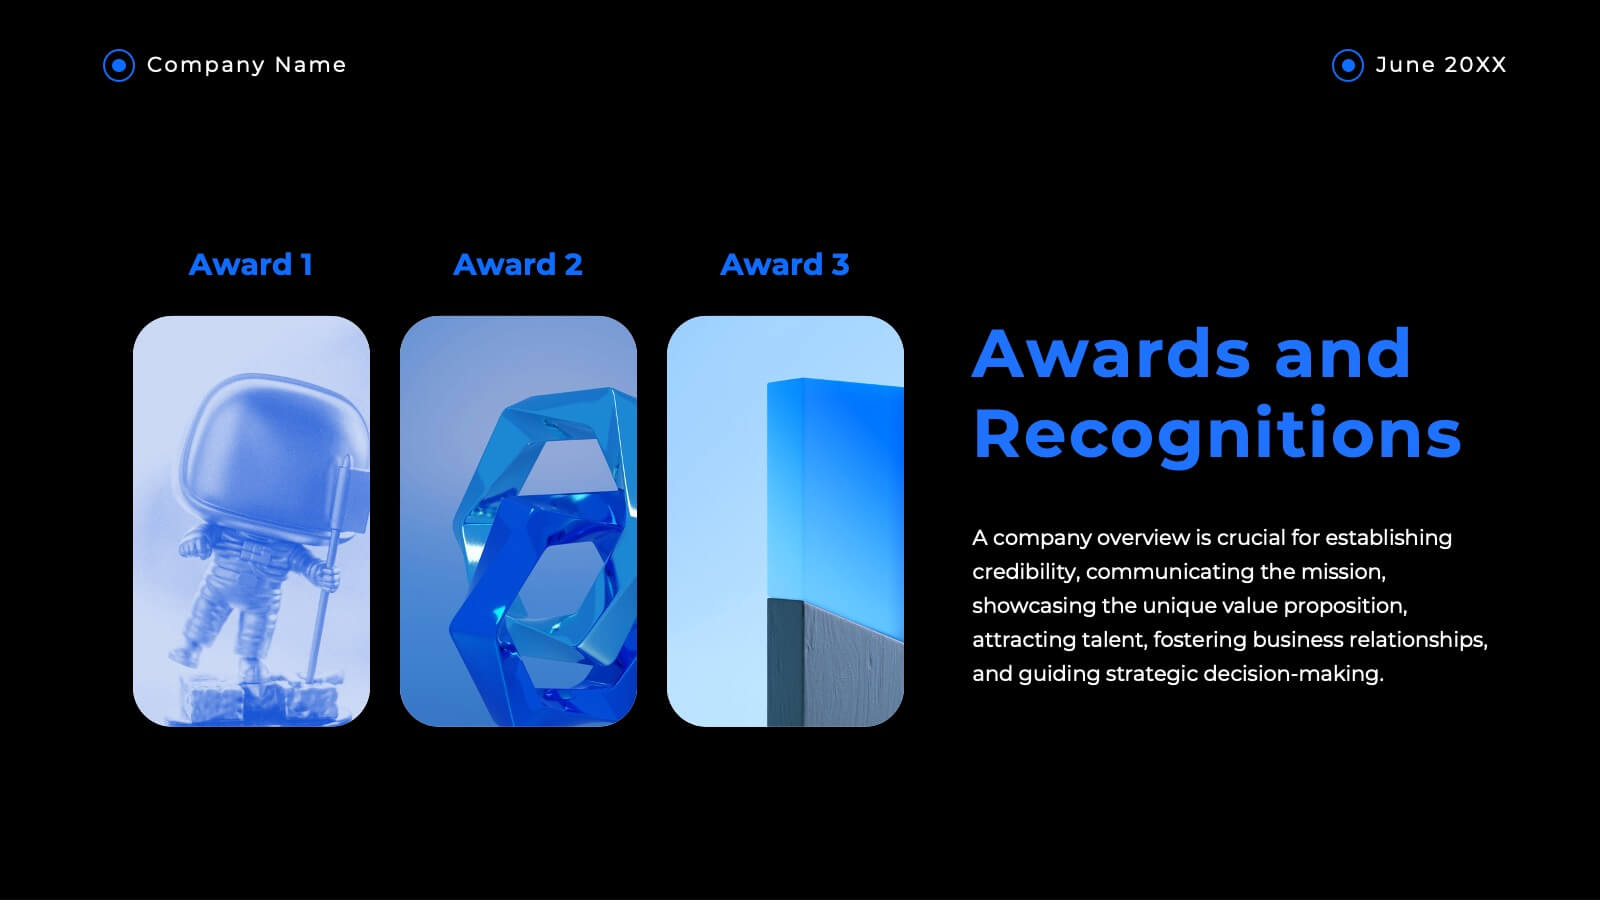
Haven Advertising Agency Proposal Presentation
Wow your clients with this sophisticated agency presentation template! Perfect for showcasing your services, client success stories, and market analysis. Ideal for agencies looking to impress and secure new business. Compatible with PowerPoint, Keynote, and Google Slides, this template ensures your proposals stand out with professional elegance. Perfect for any pitch or proposal.


3 diapositivas
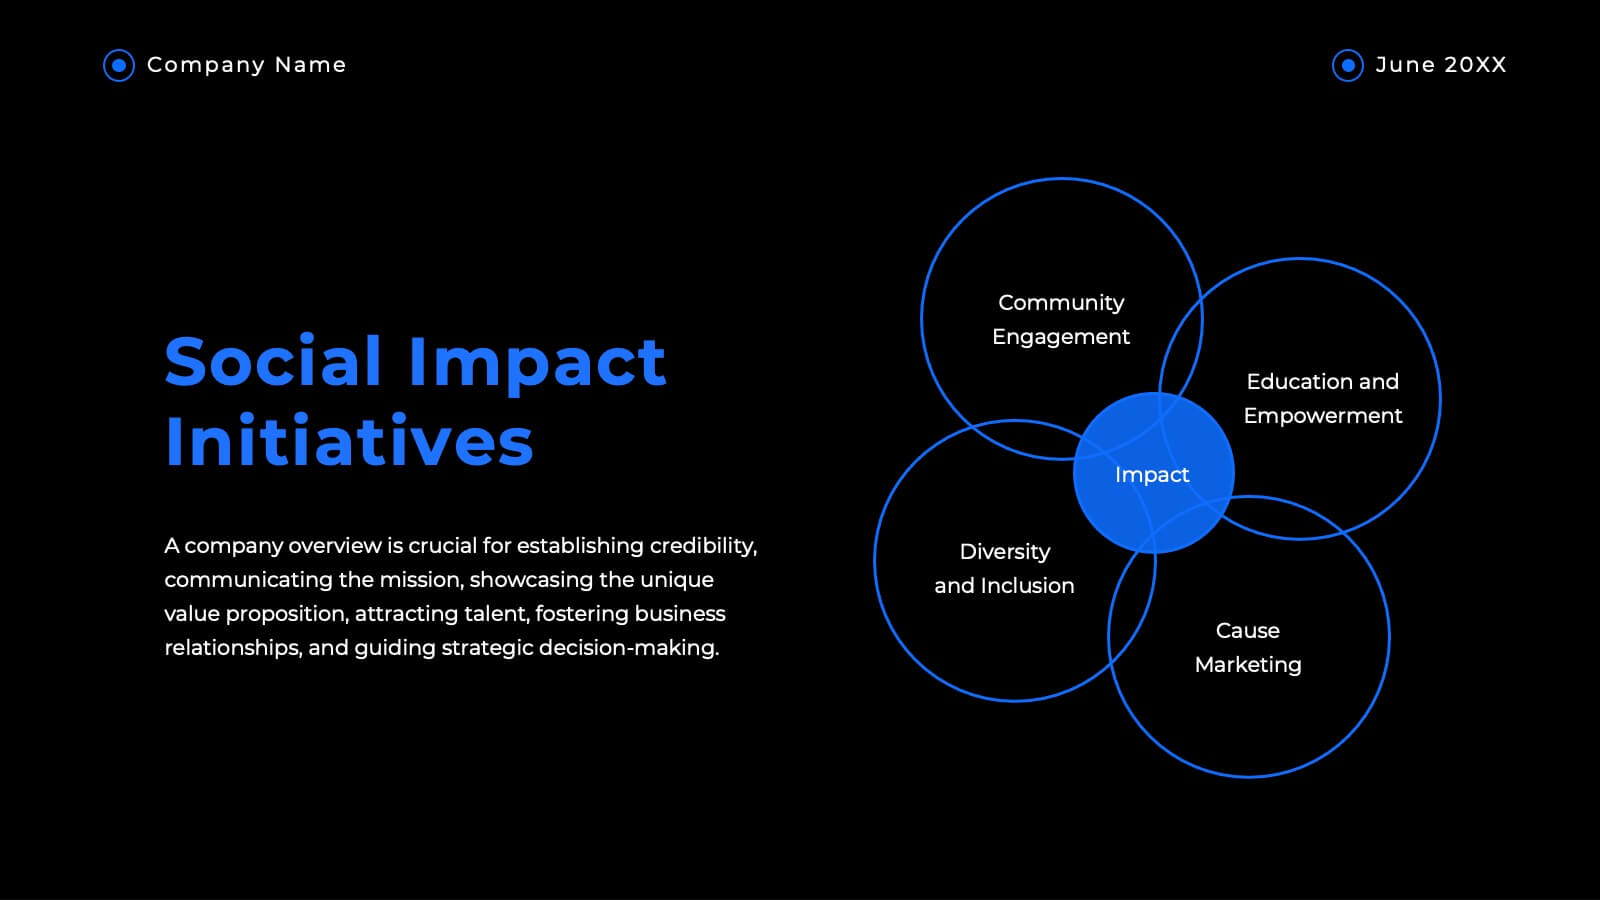
Search Engine Optimization Strategy Presentation
Stand out in your next presentation with this dynamic visual breakdown of digital visibility tactics. Perfect for marketers, business owners, or SEO specialists, this colorful circular infographic highlights the key pillars of a search strategy in a way that's both professional and easy to follow. Compatible with PowerPoint, Keynote, and Google Slides.


26 diapositivas
Briarfall Rebranding Project Plan Presentation
This Brand Presentation Template offers a modern and structured approach to showcasing your brand identity, values, and strategic direction. Covering essential elements like audience personas, brand positioning, touchpoints, and performance metrics, it's fully customizable and perfect for businesses looking to strengthen their brand presence. Compatible with PowerPoint, Keynote, and Google Slides.


11 diapositivas
Moodboard Presentation
This Moodboard template is a vibrant tool for designers and creatives looking to showcase the aesthetic direction of their project. It starts with a dynamic cover slide, drawing you into the visual theme. As you progress through the slides, you are greeted with rich textures and a spectrum of colors carefully selected to inspire and evoke emotion. The slides dedicated to 'Textures' and 'Colors' serve not only as a palette but also as a canvas to communicate the essence of your creative vision. Questions like "Have you chosen your colors yet?" engage the audience, encouraging interaction and reflection on their choices. The 'Concept' and 'Keys' slides further detail the creative process and the core elements that will define the final design. The comprehensive Moodboard culminates in a credits slide, attributing all the inspirational sources that fueled the visual journey.


7 diapositivas
Job Title Infographic
The slides displayed offer a range of stylish and clear title designs for various business and creative presentations, ideal for introducing key concepts and sections within a professional document or presentation. Each slide is crafted to represent themes such as annual reports, digital strategies, and project retrospectives, as well as specialized areas like web design, strategic planning, and SEO. The designs incorporate modern aesthetics with clean lines, bold color palettes, and minimalist graphic elements, ensuring that the titles are not only eye-catching but also effectively convey the subject matter. This variety allows presenters to choose a slide that best fits the tone and topic of their presentation, making each section distinct and engaging for the audience. These slides are perfect for professionals looking to present complex information in an accessible and visually appealing format.


24 diapositivas
Silver Product Launch Presentation
Unleash the potential of your product launch with this vibrant and engaging presentation template! Designed to showcase your product's unique features, market positioning, and competitive edge, this template helps you tell a compelling story from start to finish. It’s perfect for grabbing attention and driving impact. Compatible with PowerPoint, Keynote, and Google Slides.


5 diapositivas
Innovation with Design Thinking Framework
Boost creativity and problem-solving with the Innovation with Design Thinking Framework Presentation. This slide features a vertically stacked rocket diagram symbolizing the five key phases of design thinking—perfect for illustrating iterative innovation processes. Each level includes editable text and icons, helping you align stakeholders around empathy, ideation, and prototyping. Ideal for workshops, innovation teams, educators, or product development presentations. Fully customizable in PowerPoint, Keynote, and Google Slides.


21 diapositivas
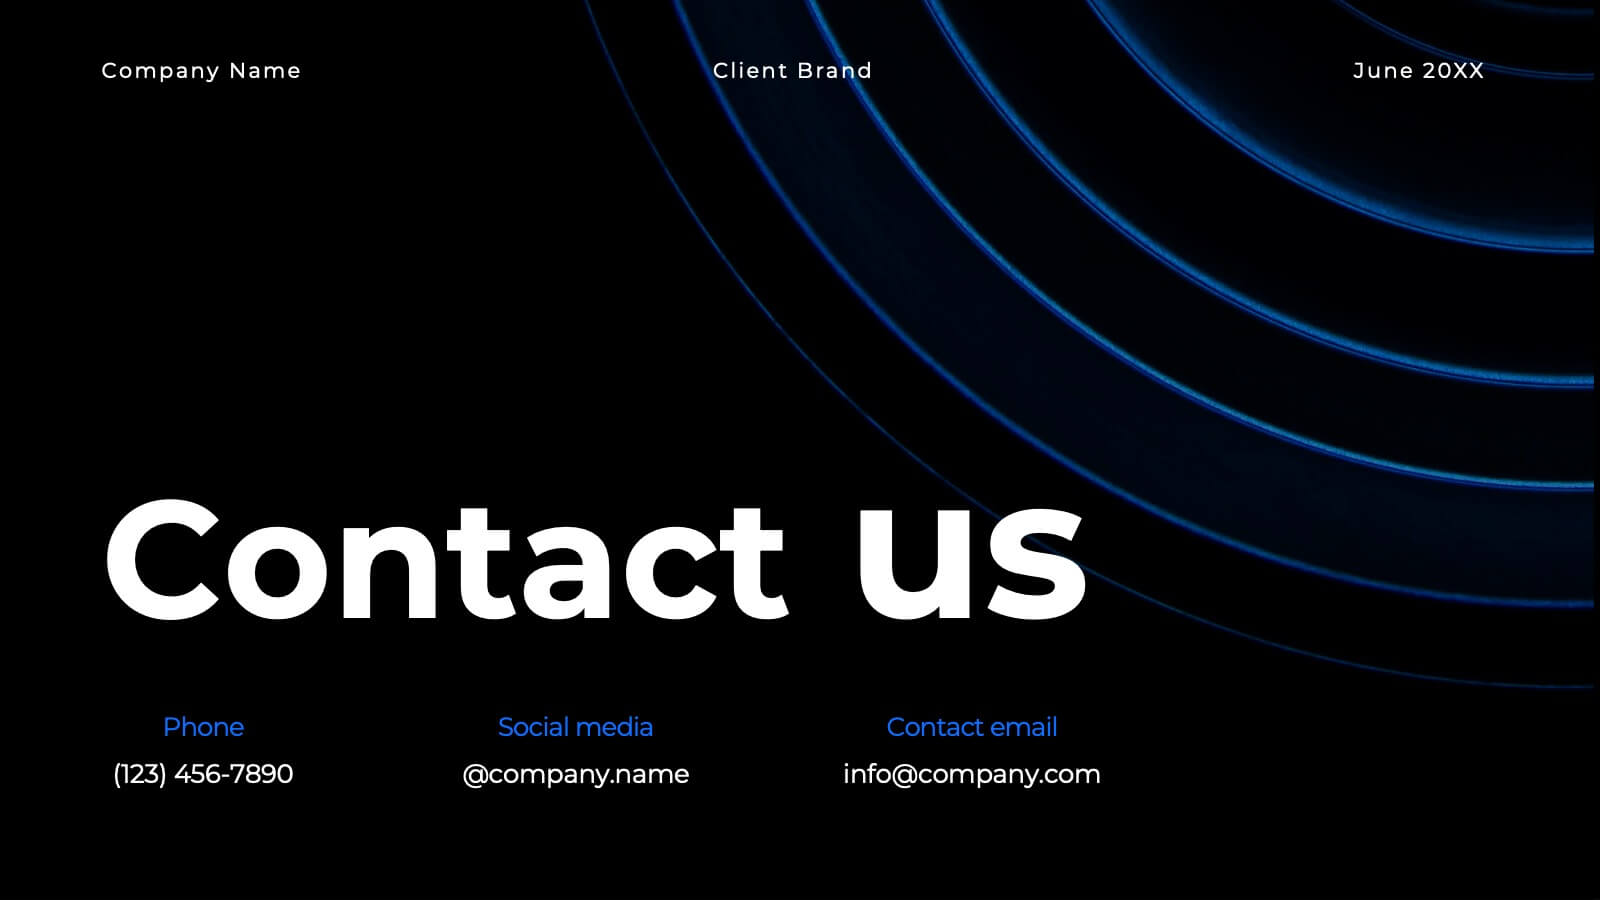
Cerberus Project Timeline Presentation
Bring your project vision to life with a well-structured plan that flows effortlessly. This presentation covers everything from objectives and timelines to budget breakdowns, team introductions, and next steps, helping you communicate key details with clarity. Perfect for internal or client presentations, and fully compatible with PowerPoint, Keynote, and Google Slides.


4 diapositivas
Data Analytics Heat Map Presentation
Turn complex data into clear insights with this dynamic heat map template! Ideal for visualizing trends, risks, or performance metrics, this design enhances decision-making at a glance. With fully customizable elements, it simplifies data analysis for business, finance, or research. Compatible with PowerPoint, Keynote, and Google Slides for seamless use.


6 diapositivas
360-Degree Feedback System Overview
Clearly communicate your evaluation process with the 360-Degree Feedback System Overview Presentation. Featuring a circular layout with six editable segments, this template helps visualize feedback from peers, subordinates, managers, and more. Ideal for HR reviews, performance evaluations, and leadership development programs. Fully customizable in PowerPoint, Keynote, or Google Slides.


5 diapositivas
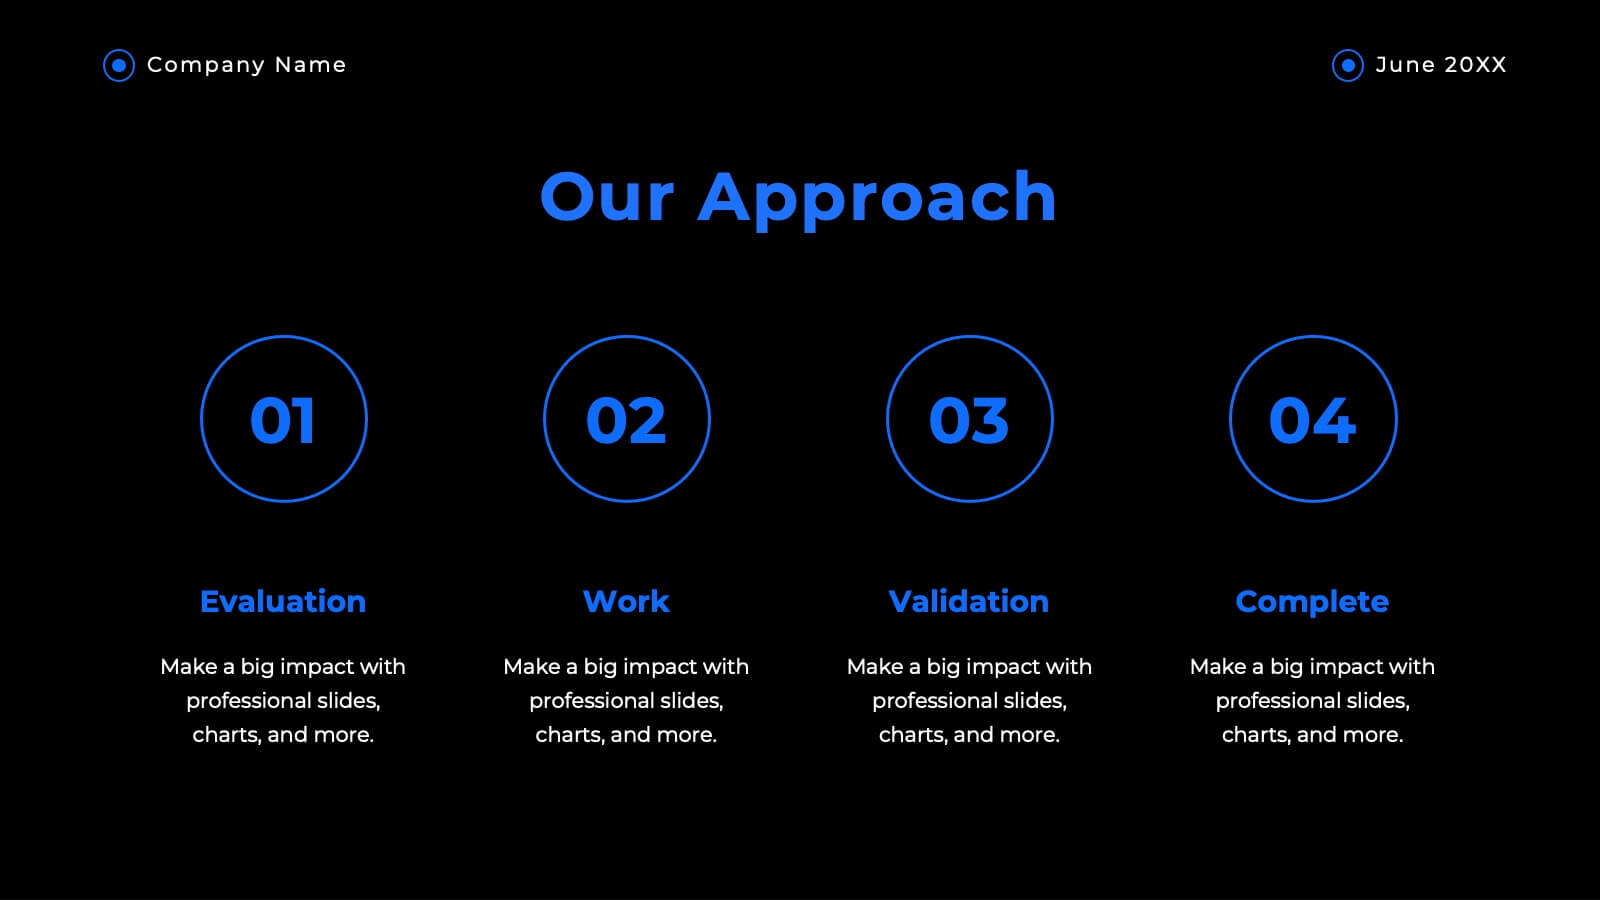
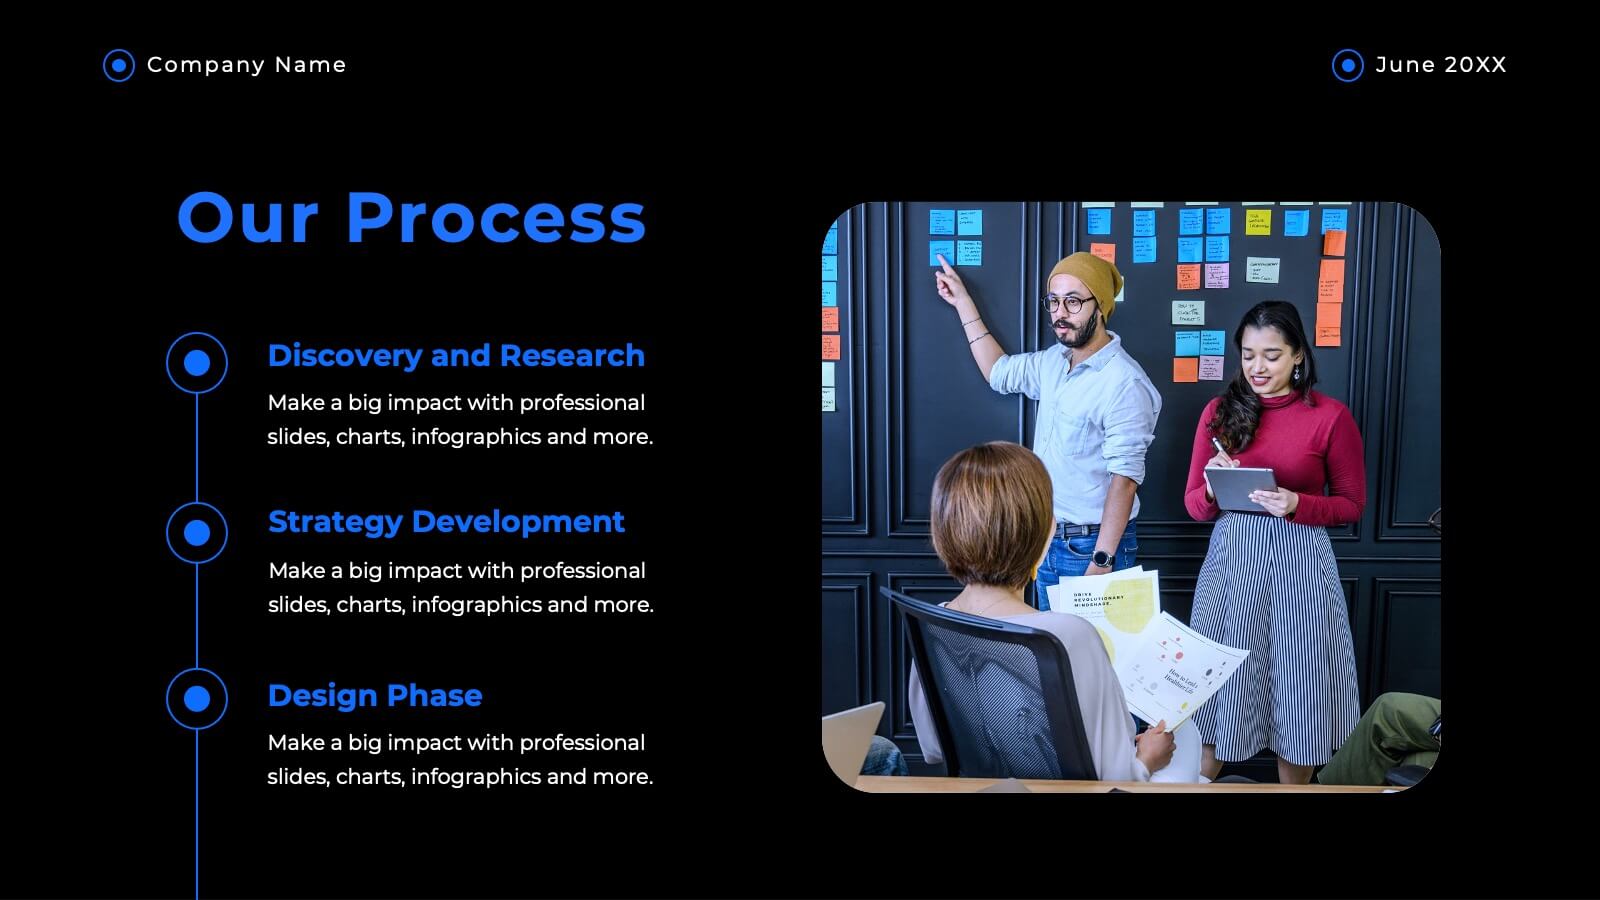
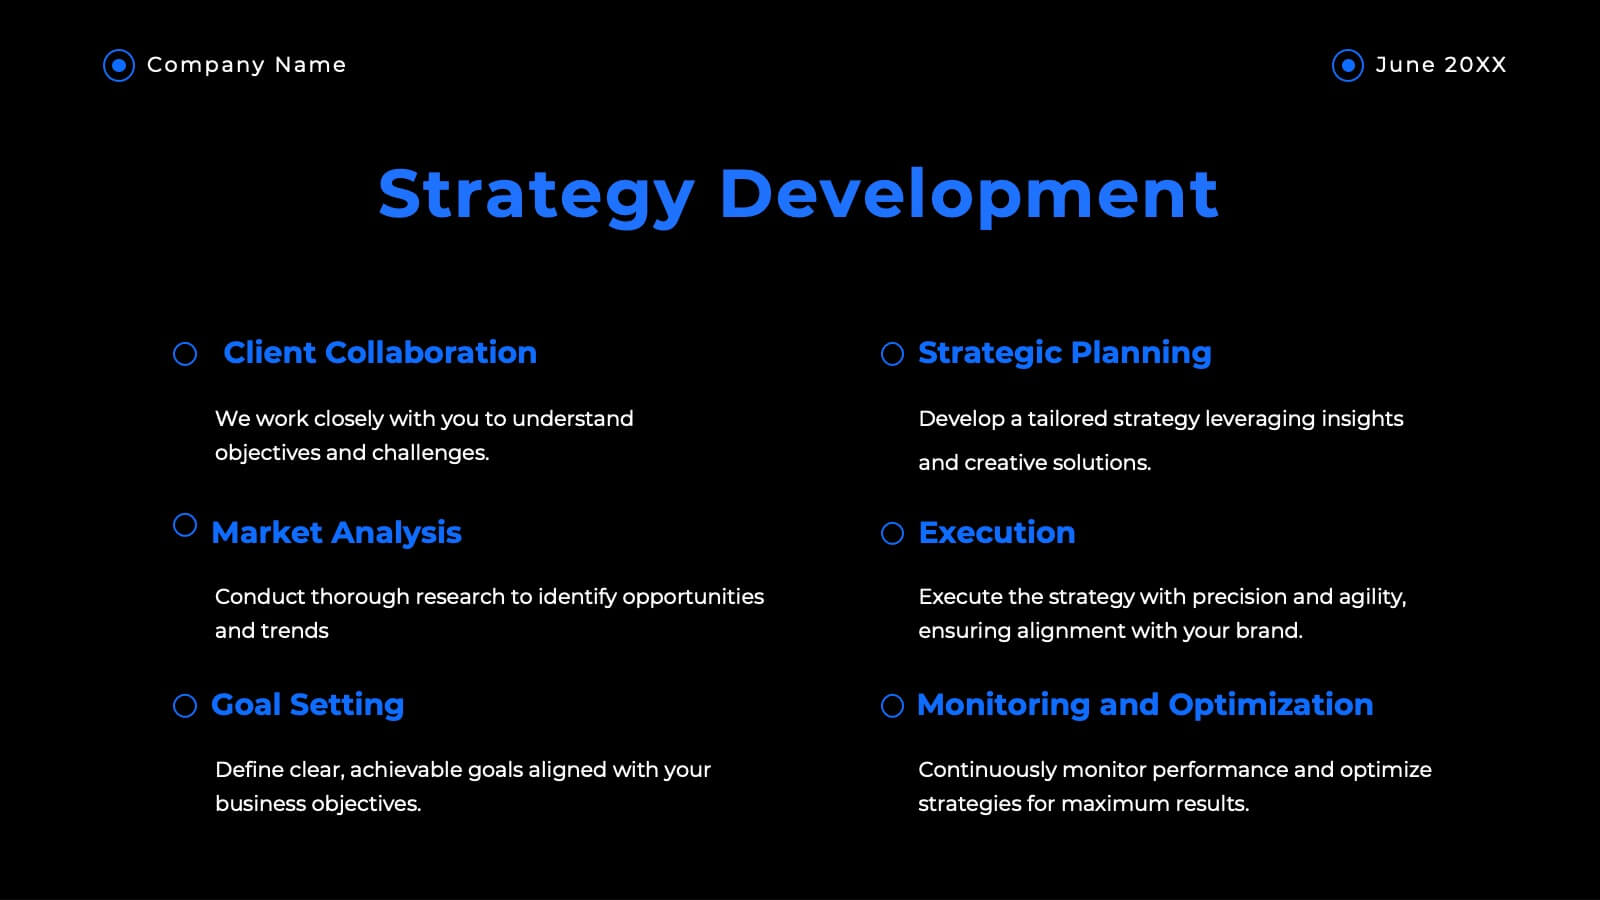
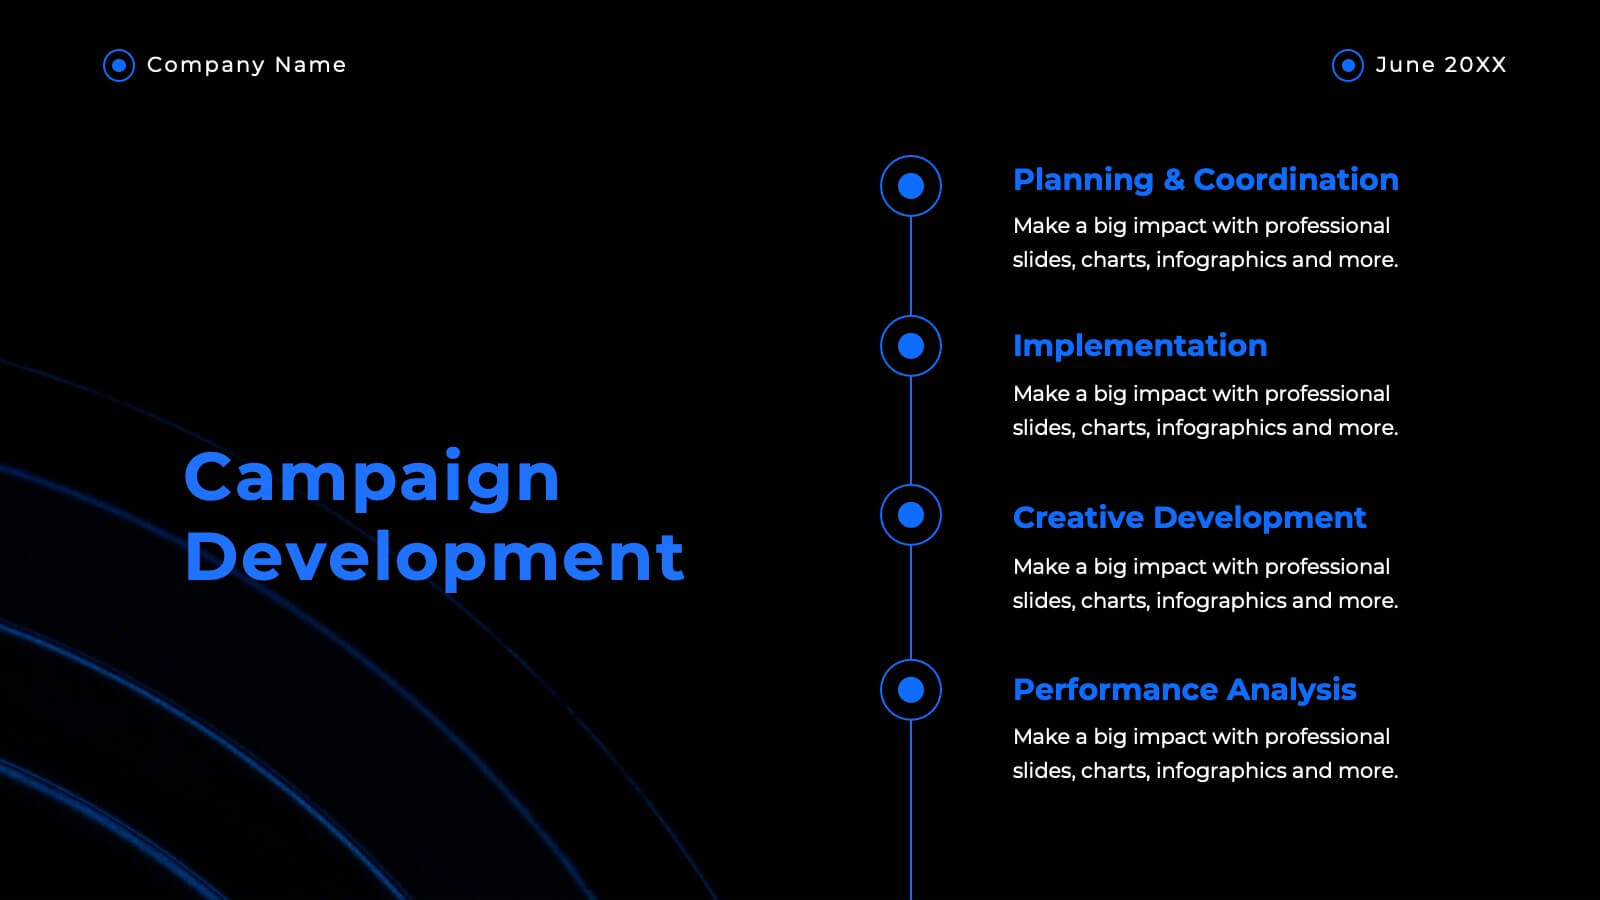
Project Management Framework Presentation
Master the art of project management with our Project Management Framework template. This design is tailored to guide you through every phase of your project, ensuring a smooth and structured execution. The template is perfect for visually representing processes within PowerPoint, Keynote, and Google Slides, providing a clear pathway from project initiation to completion. Ideal for project managers looking to streamline their strategies and enhance project communication.


5 diapositivas
Nutrition Facts Infographics
Nutrition facts provide important information about the nutritional content of food and beverages. This helps individuals make informed decisions about their dietary choices and understand the impact of food on their health. These infographic templates are designed to present essential information about nutrition and healthy eating habits. These infographics are suitable for nutritionists, dietitians, health educators, or anyone looking to communicate key facts and guidelines about nutrition in a clear and engaging manner. Compatible with Powerpoint, Keynote, and Google Slides, these are fully customizable.