


Características


¿Tienes alguna pregunta?
Recomendar


10 diapositivas
5G Technology and Network Advancements Presentation
Showcase key milestones and trends in modern telecom evolution with this dynamic 5G network infographic. The slide features a clean, wave-like flow connecting five signal tower icons, perfect for outlining technological phases, speed upgrades, or infrastructure rollouts. Suitable for IT professionals, telecom analysts, and future-tech strategists. Fully customizable in PowerPoint, Keynote, and Google Slides.


4 diapositivas
Interactive Learning Models Presentation
Illustrate step-by-step learning journeys with this creative, hand-drawn infographic layout. Ideal for training modules, course planning, or educational workflows, this slide highlights three key insights with interactive appeal. Fully editable in PowerPoint, Keynote, and Google Slides—perfect for educators, trainers, and instructional designers looking to boost engagement.


5 diapositivas
Suicide Prevention & Awareness Infographics
Suicide Awareness plays a vital role in addressing the global public health issue of suicide. These vertical infographics are powerful and informative designs that aim to raise awareness about suicide prevention, promote mental health, and provide essential information to help individuals recognize the signs and support those in need. With its thoughtful and sensitive design, the template communicates important statistics, facts, and resources. The template is fully customizable, allowing you to personalize the infographics with your own content, including local helpline numbers, support services, or specific awareness campaigns.


6 diapositivas
Matrix Diagram
A matrix diagram, also known as a matrix chart, is a visual tool used to analyze and organize complex information by displaying it in a matrix format. This infographic template provides a visual framework for analyzing complex information, and improving understanding of relationships between different elements or factors. This template allows users to effectively communicate complex relationships and categorize information using a matrix format. This is perfect to use in a wide range of contexts, including project management, problem-solving, decision-making, strategic planning, and data analysis.


4 diapositivas
Team OKRs Alignment Slide Presentation
Bring clarity and collaboration to your team’s goals with a clean, connected layout that visualizes how objectives lead to measurable results. Perfect for aligning departments, tracking progress, or sharing performance updates, this presentation turns strategy into action. Fully compatible with PowerPoint, Keynote, and Google Slides for easy customization.


6 diapositivas
Financial Summary Infographic
The series presented showcases various slide templates tailored for enhancing sales team strategies and communication. Each slide is crafted to assist sales professionals in detailing team structures, sales goals, performance metrics, and strategic initiatives effectively. Utilizing vibrant color blocks and streamlined design elements, these templates make complex sales data approachable and engaging, facilitating clear and impactful presentations. The collection is designed with adaptability in mind, incorporating elements that can be easily customized to fit different team needs and company branding. These include comparative layouts for benchmarking, timeline formats for showcasing sales cycles, and diagrammatic representations for visualizing sales processes and results. Perfect for internal meetings, sales training sessions, and stakeholder presentations, these templates serve as essential tools for sales leaders to convey their team’s progress, celebrate wins, and strategize for future sales endeavors.


20 diapositivas
Solstice Product Launch Presentation
Introducing our product launch template! Highlight your product’s features, target audience, and unique selling proposition with a sleek, modern design. Showcase marketing strategies, distribution channels, and competitive landscape effortlessly. Ideal for sales teams and marketers. Compatible with PowerPoint, Keynote, and Google Slides.


22 diapositivas
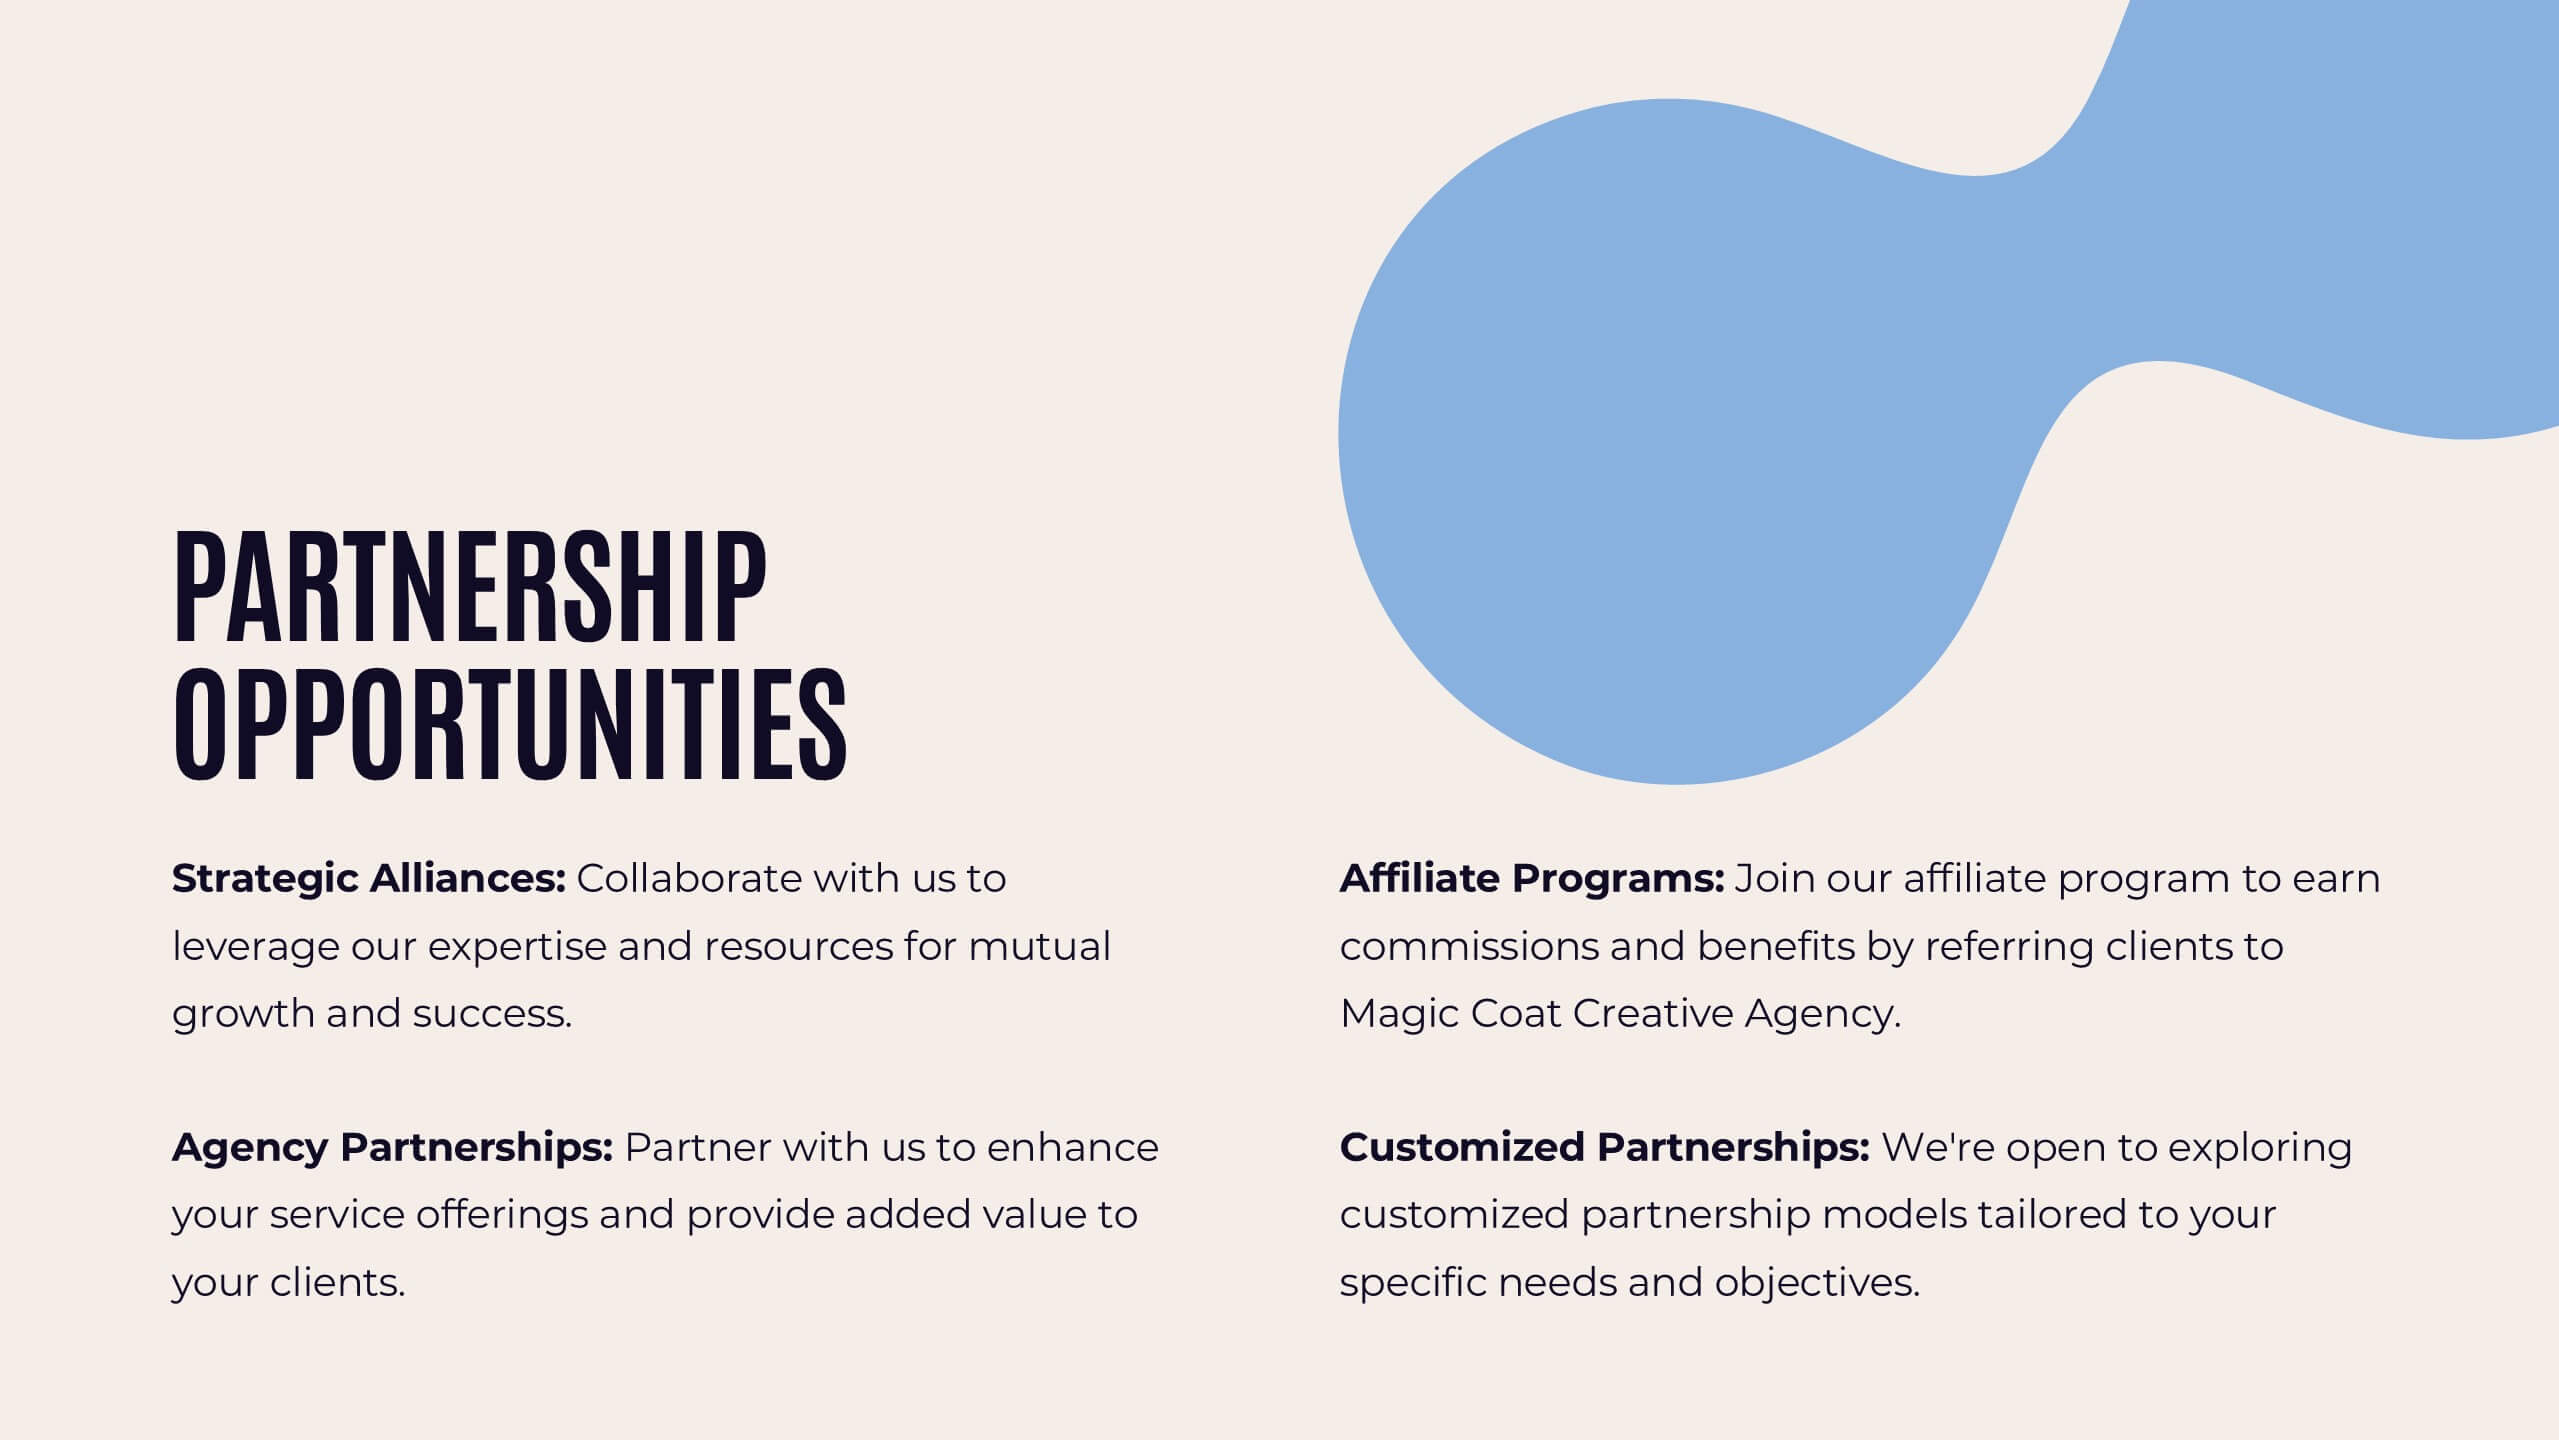
Bona Advertising Agency Proposal Presentation
Present your agency’s vision with confidence using this sleek advertising proposal template. It covers everything from market analysis and strategy development to campaign execution and client testimonials. Ideal for securing new partnerships, it’s compatible with PowerPoint, Keynote, and Google Slides for a polished, professional presentation.


22 diapositivas
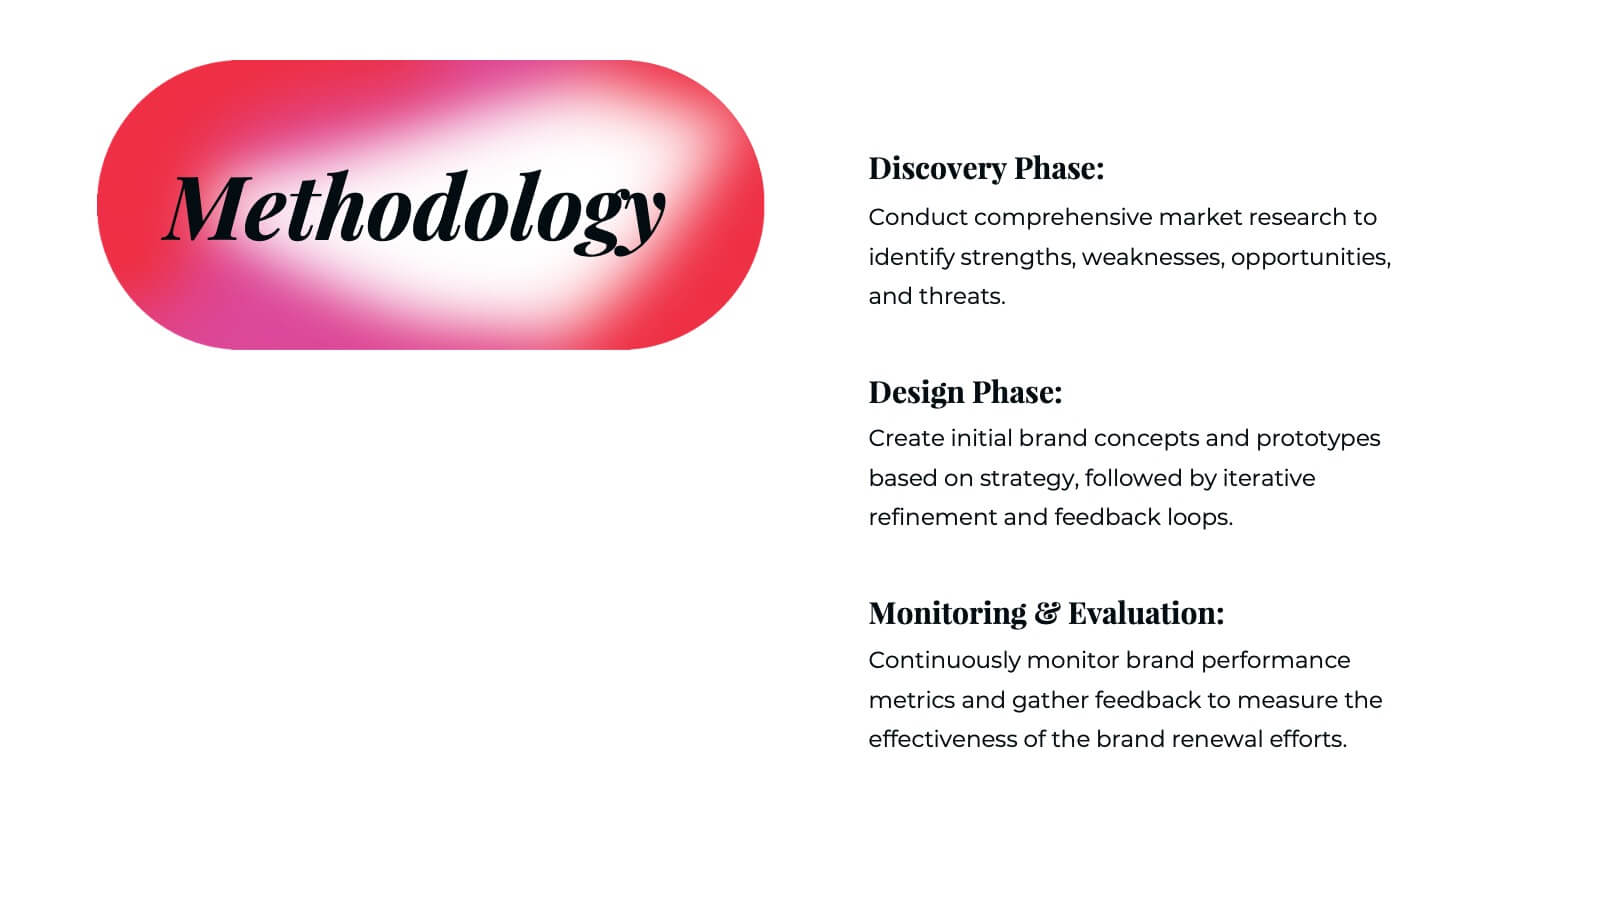
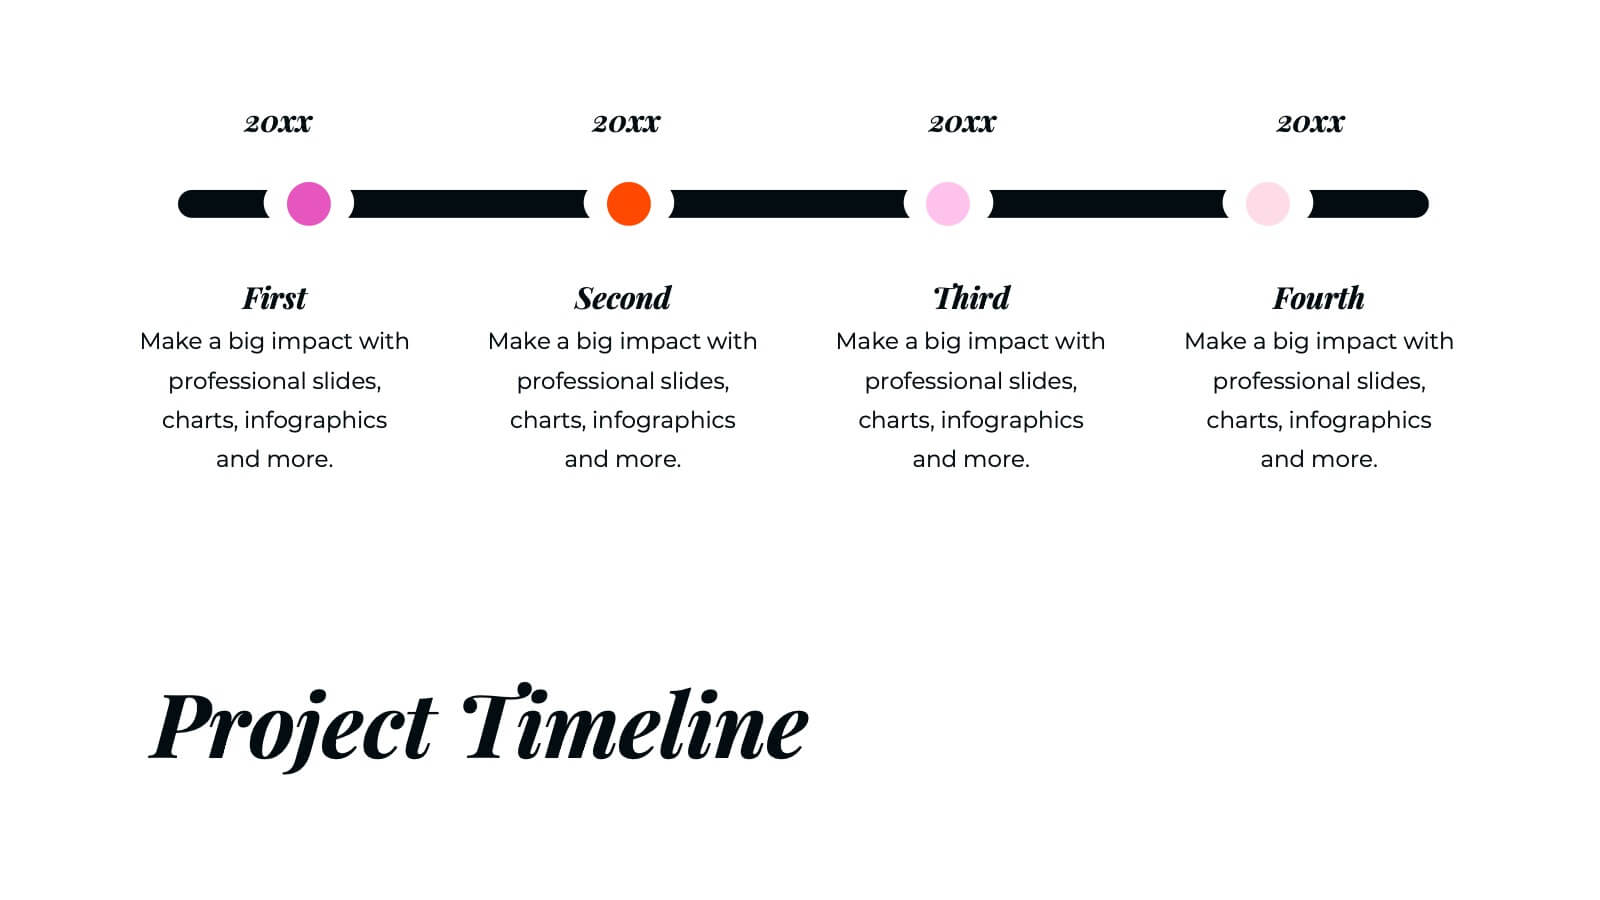
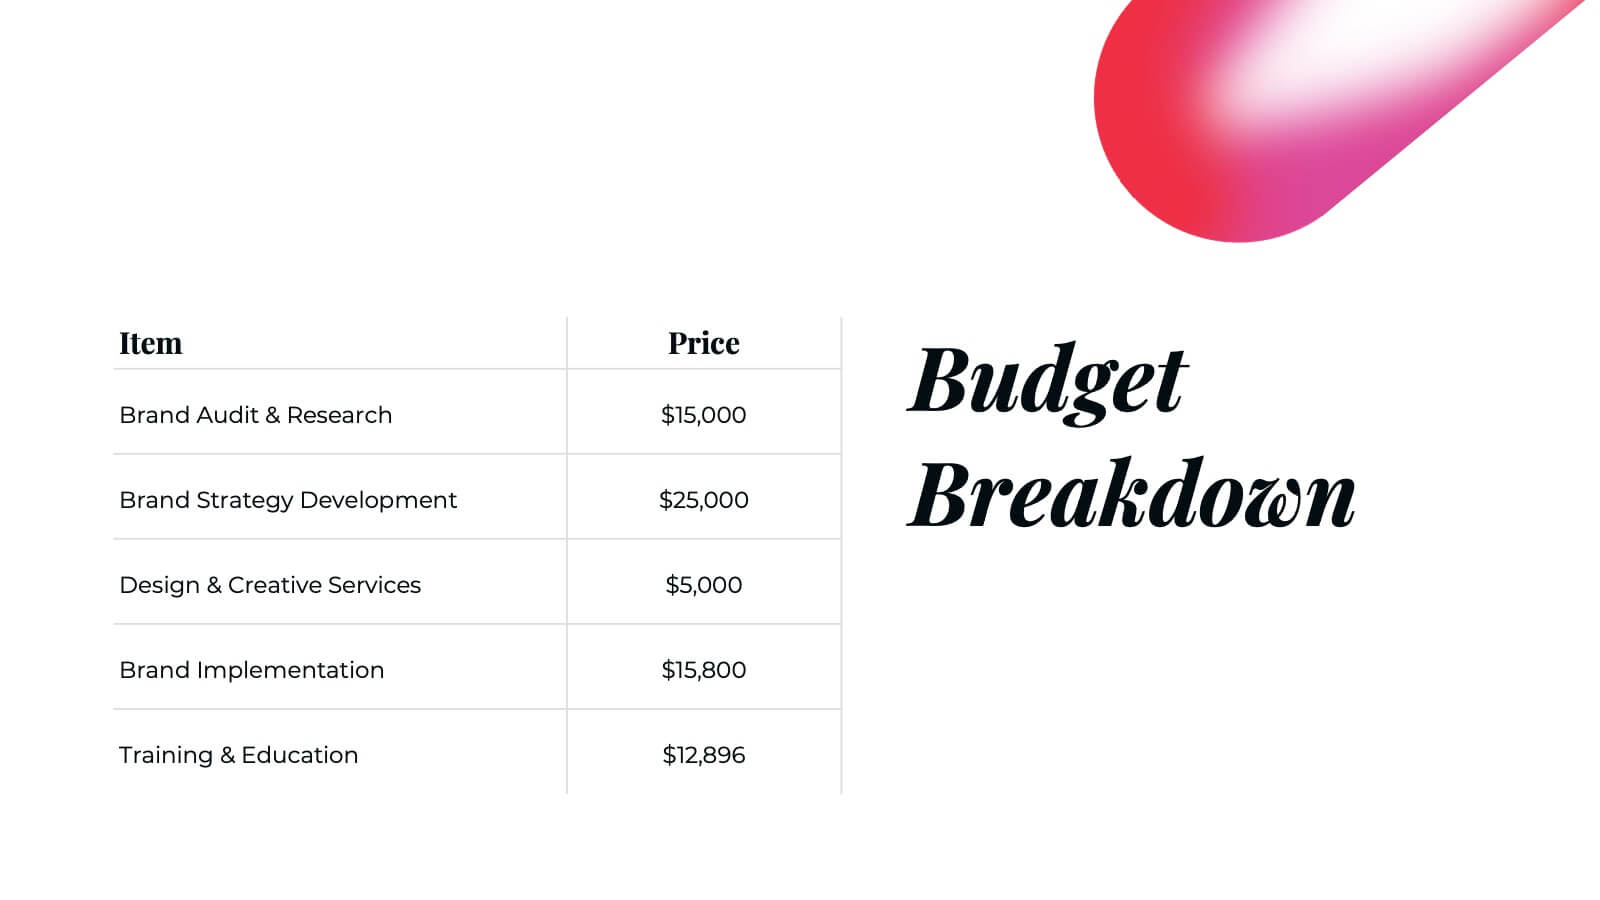
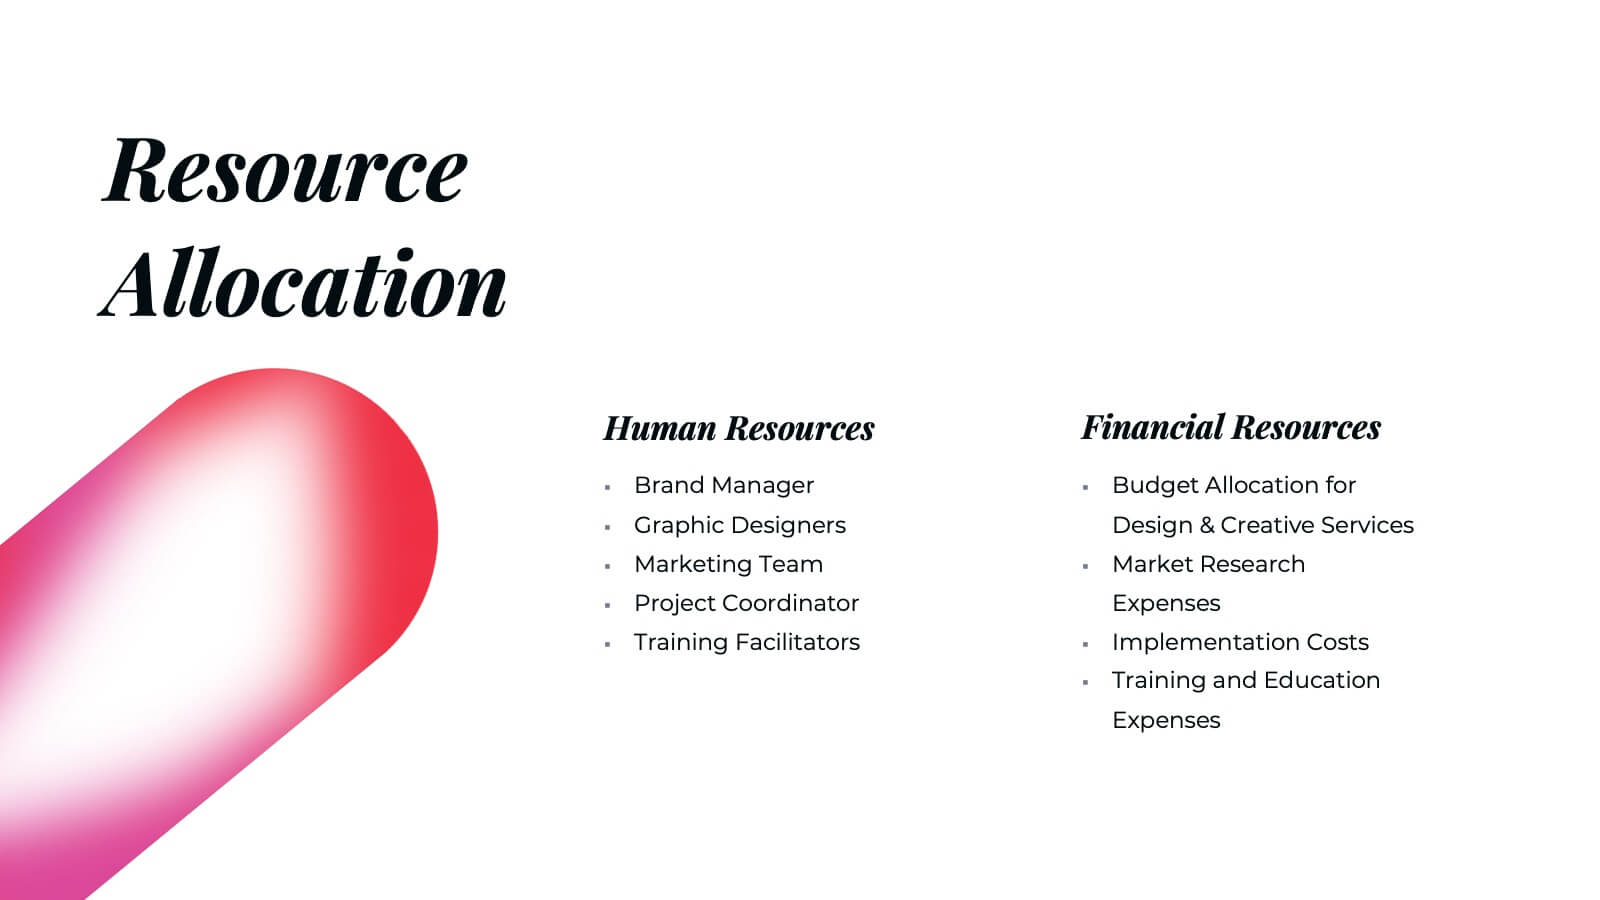
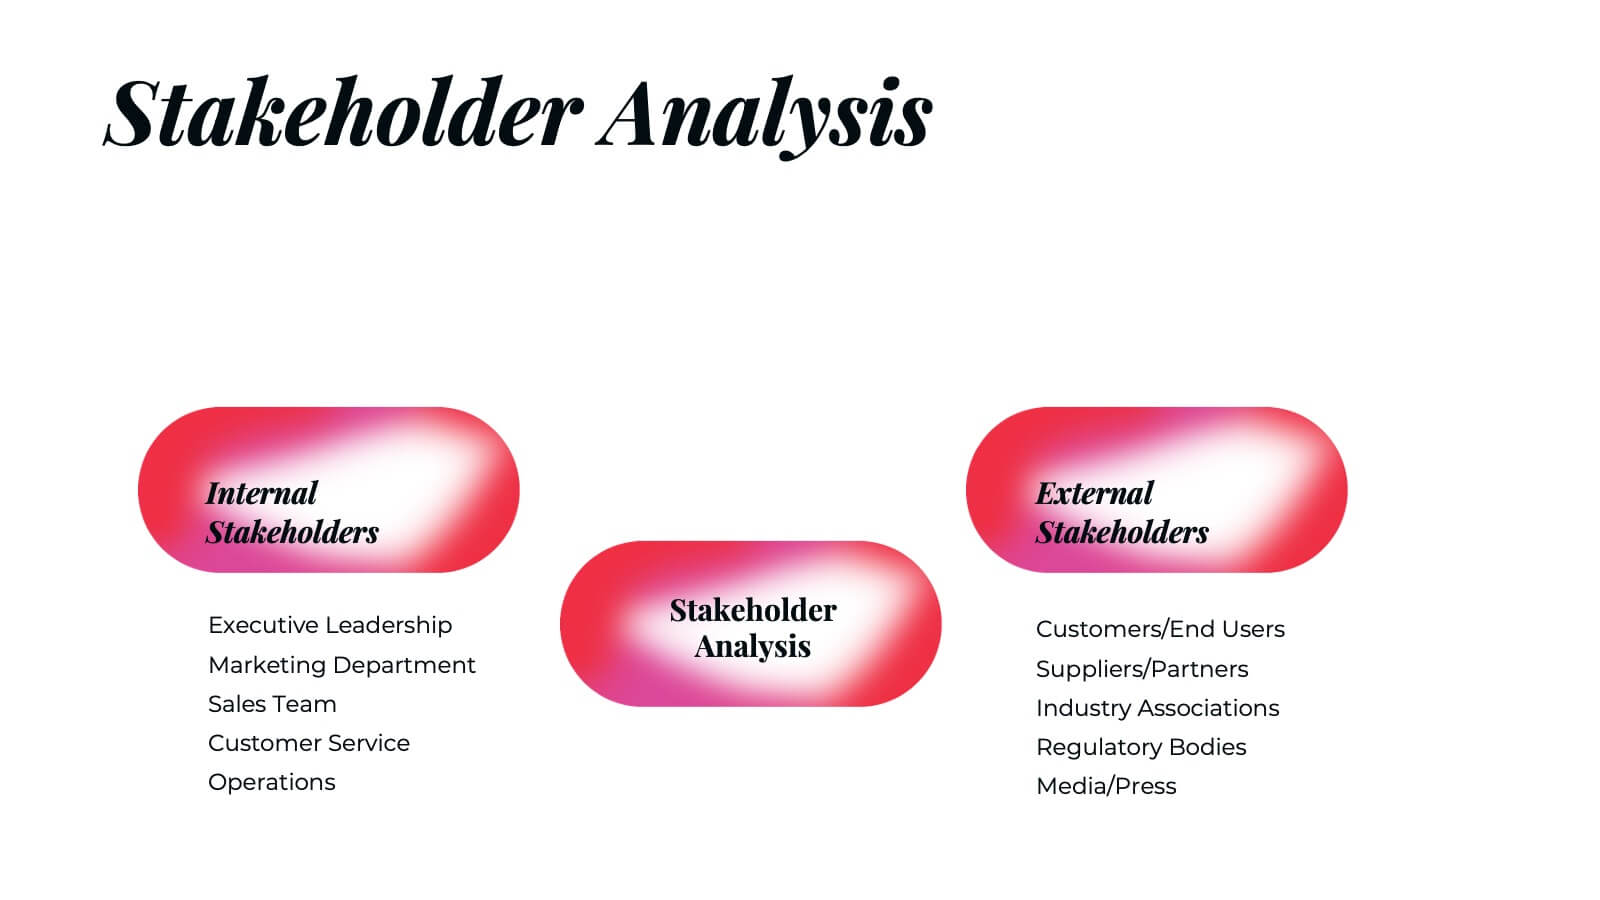
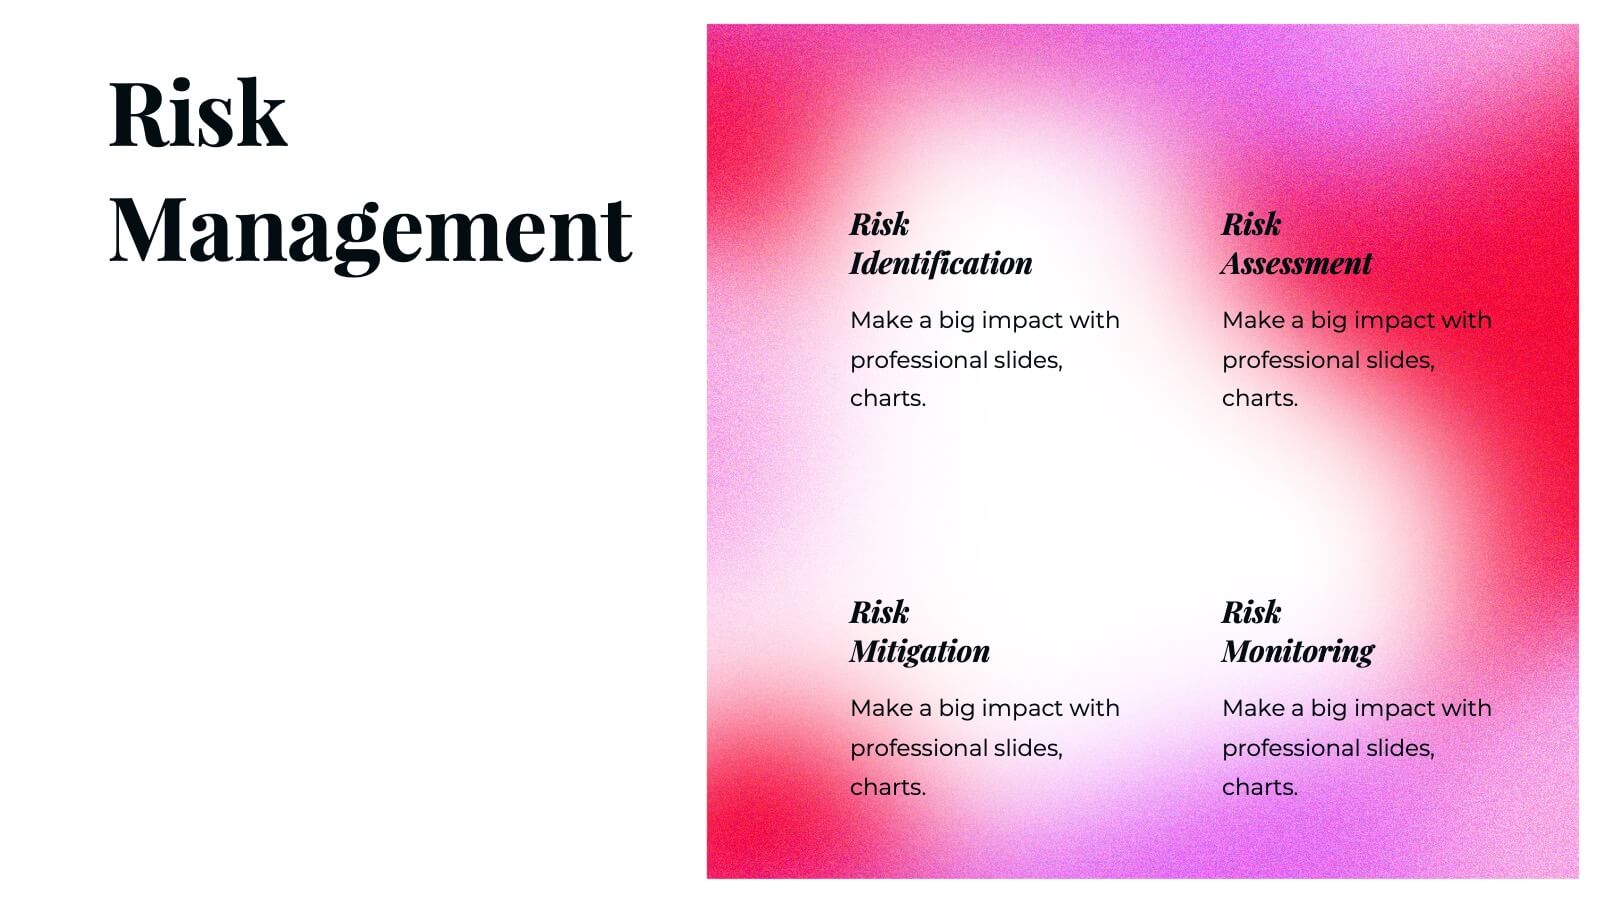
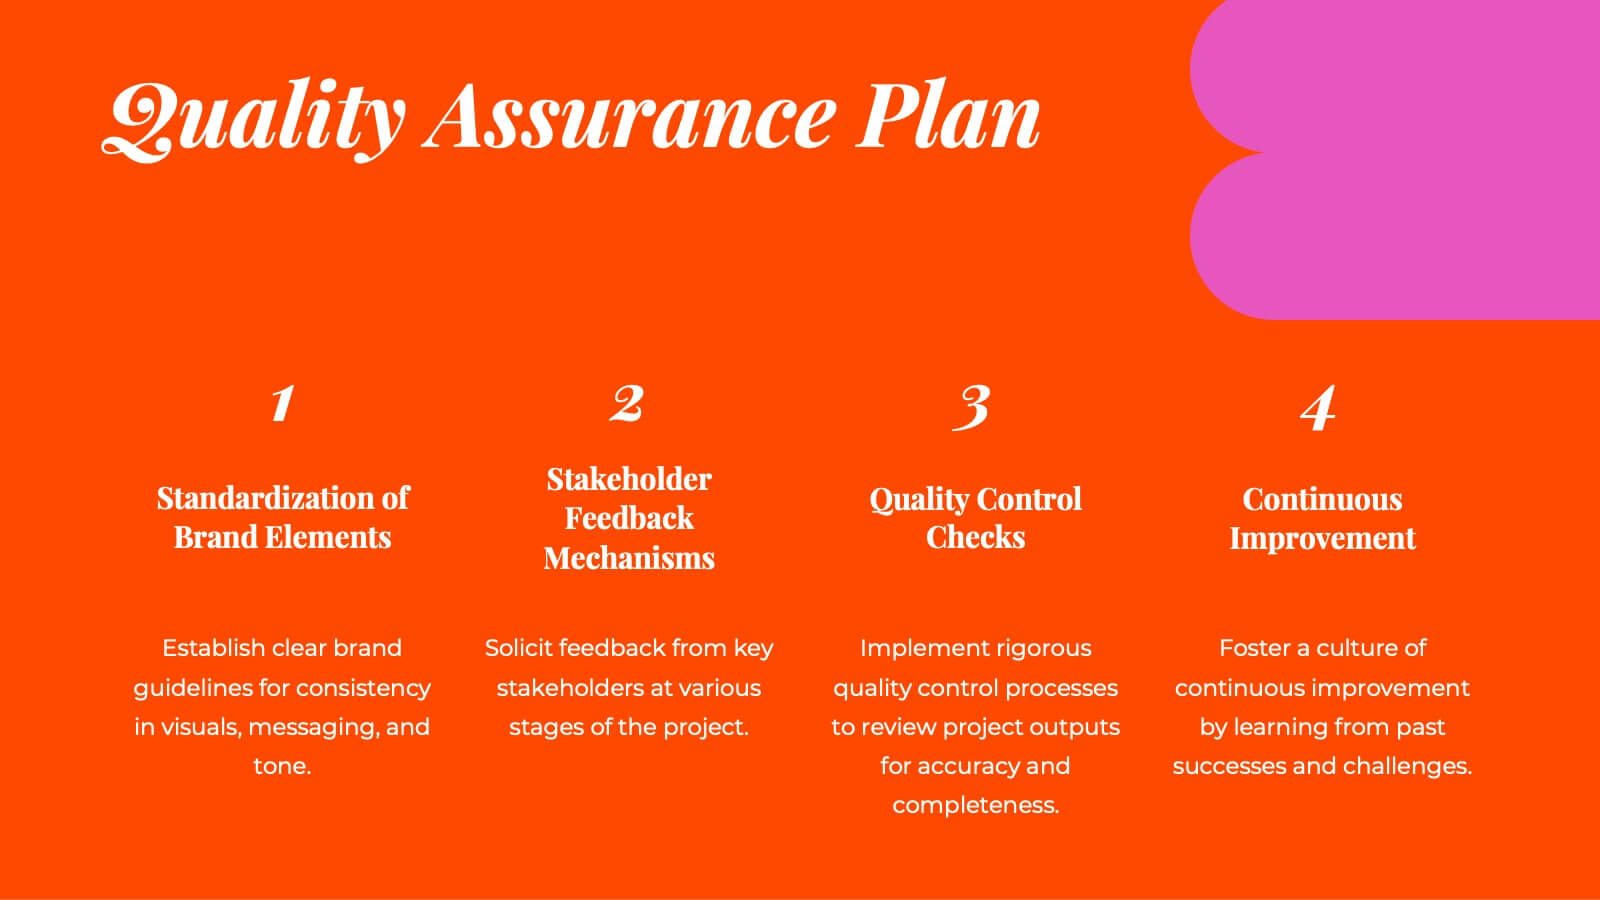
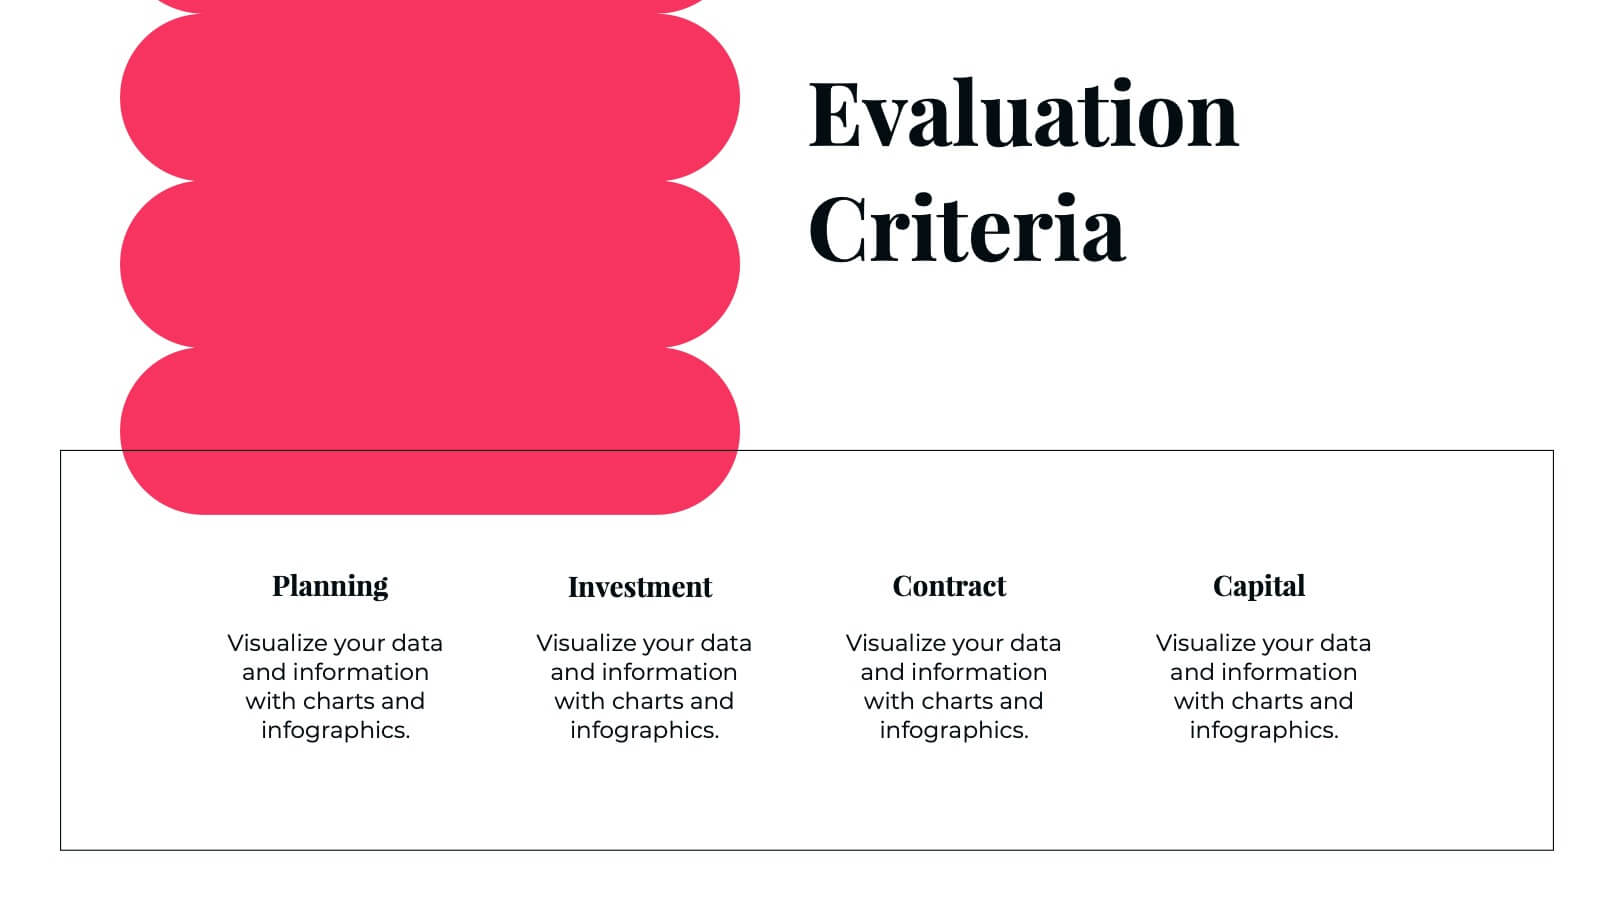
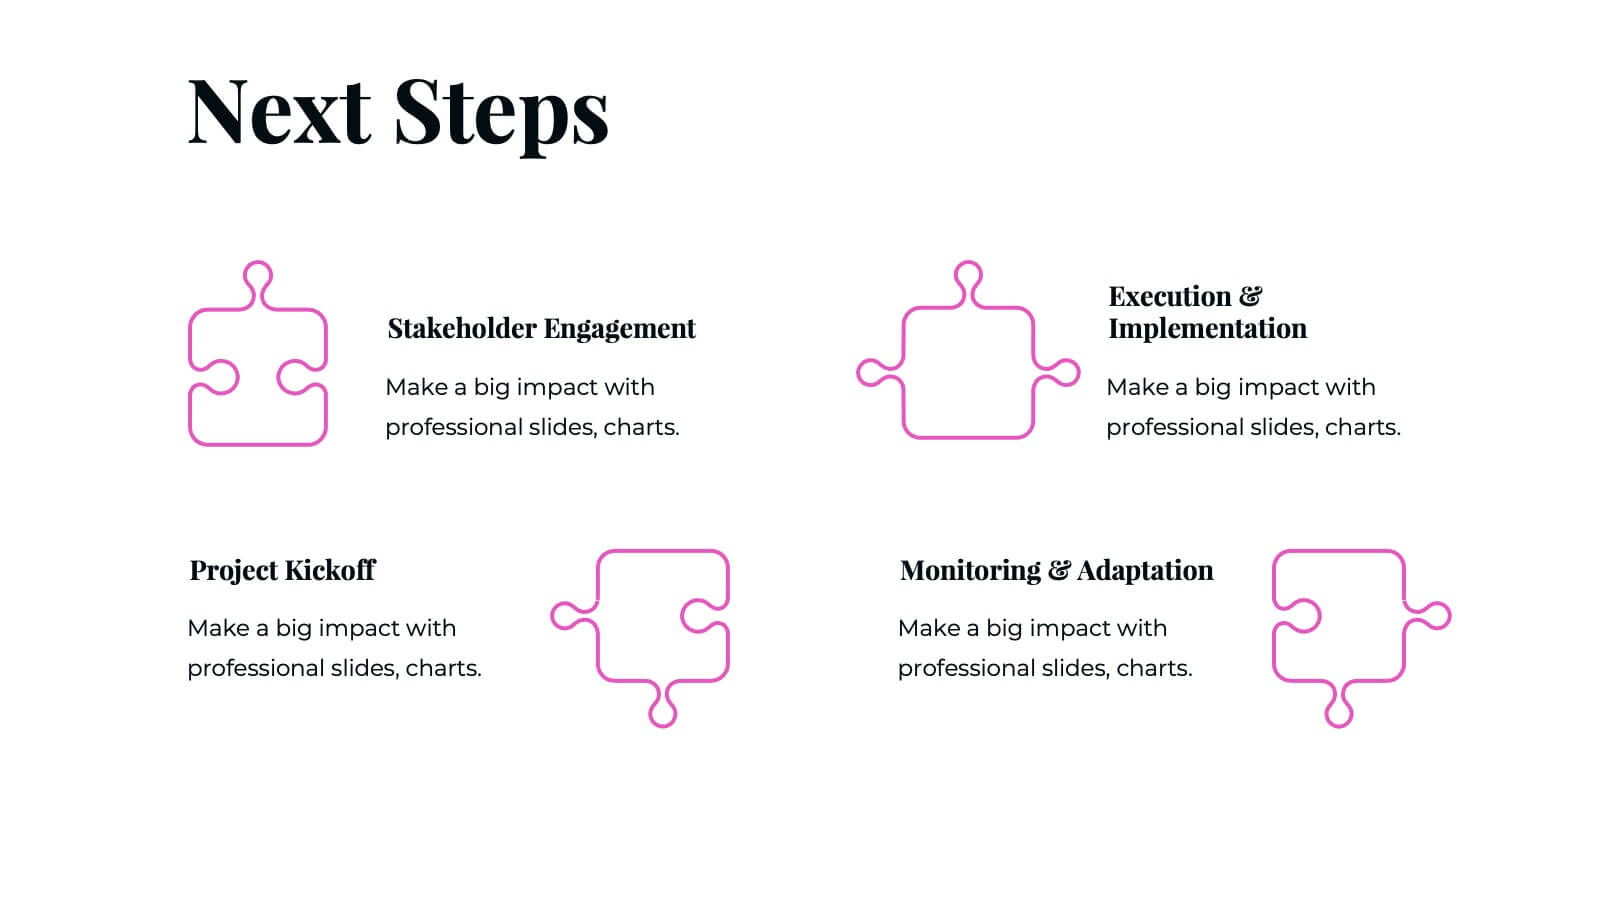
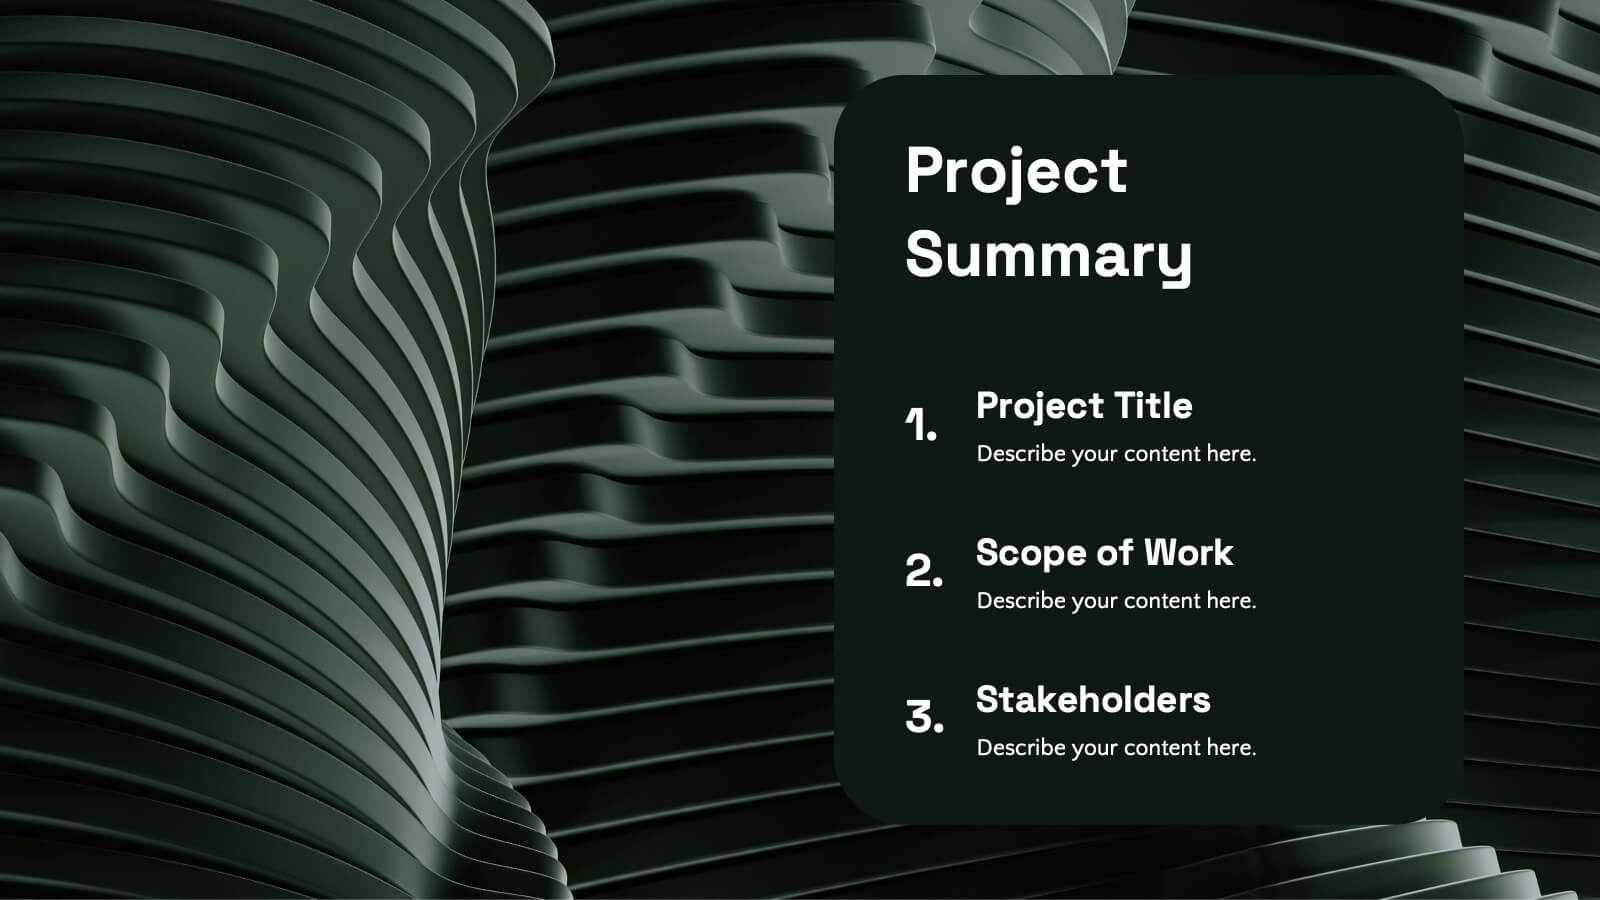
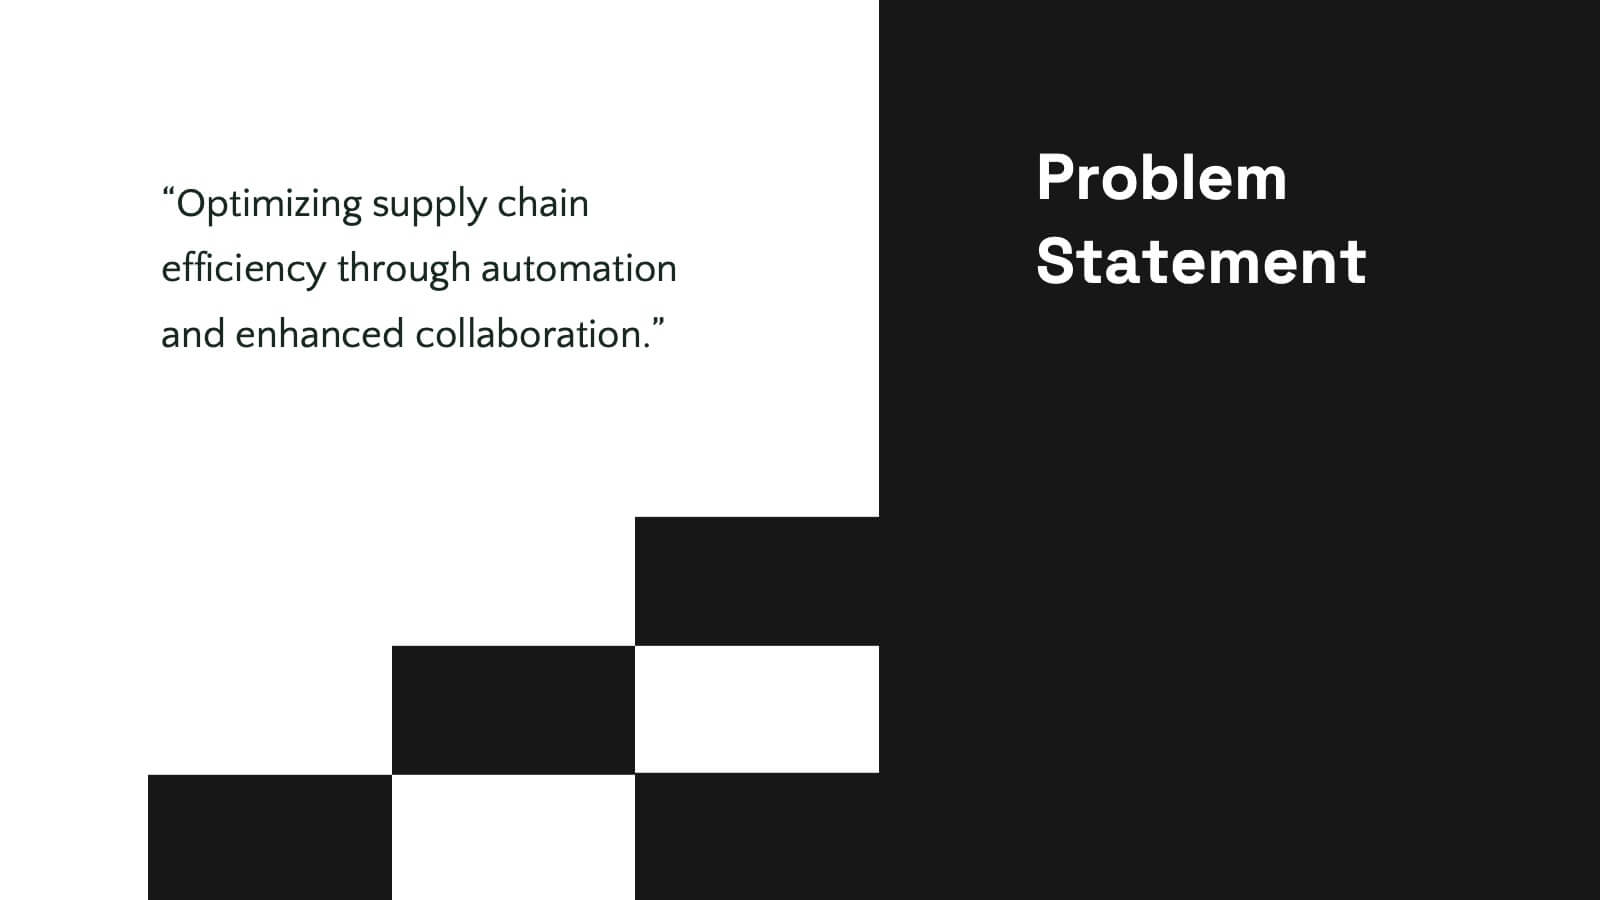
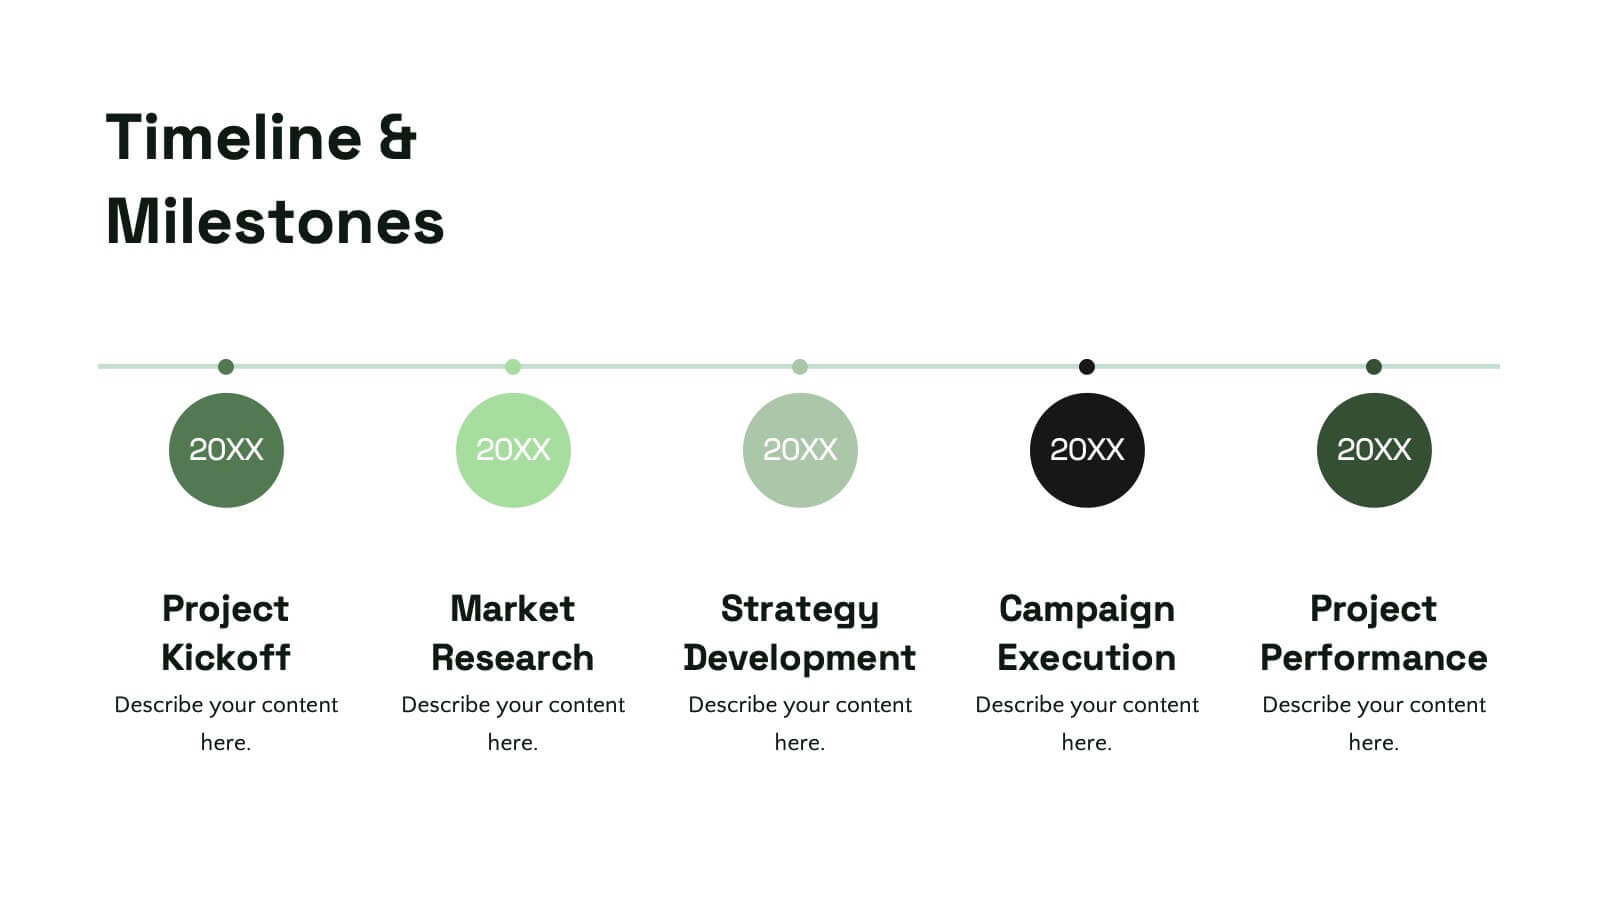
Moonstone Detailed Project Execution Plan Presentation
Create a compelling project execution plan with this vibrant and well-structured presentation template! Covering every key aspect from problem statements and objectives to risk management and quality assurance, this template provides a clear roadmap for your project. It’s perfect for organizing timelines, budget breakdowns, and stakeholder analysis. Compatible with PowerPoint, Keynote, and Google Slides for smooth presentations.


6 diapositivas
Growth Chart Infographic
A growth chart is a visual representation that shows the progress of an individual's growth over time. This infographic template is a visual representation that illustrates the growth and progress of various elements over time. These infographic charts are important tools to monitor growth patterns and help detect any potential issues. This growth chart infographic helps convey trends and insights in a clear and engaging manner. This template is compatible with Powerpoint, Keynote, and Google Slides. Allowing you to keep the design clean, easy to understand, and aligned with the message you want to convey.


7 diapositivas
McKinsey 7S Model Strategy Presentation
Bring clarity to complex organizational relationships with a clean, structured layout that highlights how key elements connect and influence performance. This presentation helps you explain core components, identify alignment gaps, and guide strategic decision-making with confidence. Easy to customize and fully compatible with PowerPoint, Keynote, and Google Slides.


7 diapositivas
Future Vision Infographic
Chart a course towards a visionary future with our Future Vision Infographic Template. This dynamic template is designed to help organizations articulate and visualize their long-term goals and strategies in a clear and compelling way. Each slide offers a unique blend of geometric designs and bold color palettes, ideal for engaging stakeholders and inspiring action. Perfect for corporate presentations, strategic meetings, or digital showcases, this template allows you to lay out your vision with precision. It guides viewers through your roadmap to success, highlighting key milestones and the innovative steps you plan to take. Customize each element to echo your organizational identity and values, ensuring that your future aspirations resonate deeply with your audience. Whether you're aiming to motivate your team, attract investors, or inform your partners, our Future Vision template provides a robust foundation for powerful storytelling and strategic clarity.

19 diapositivas
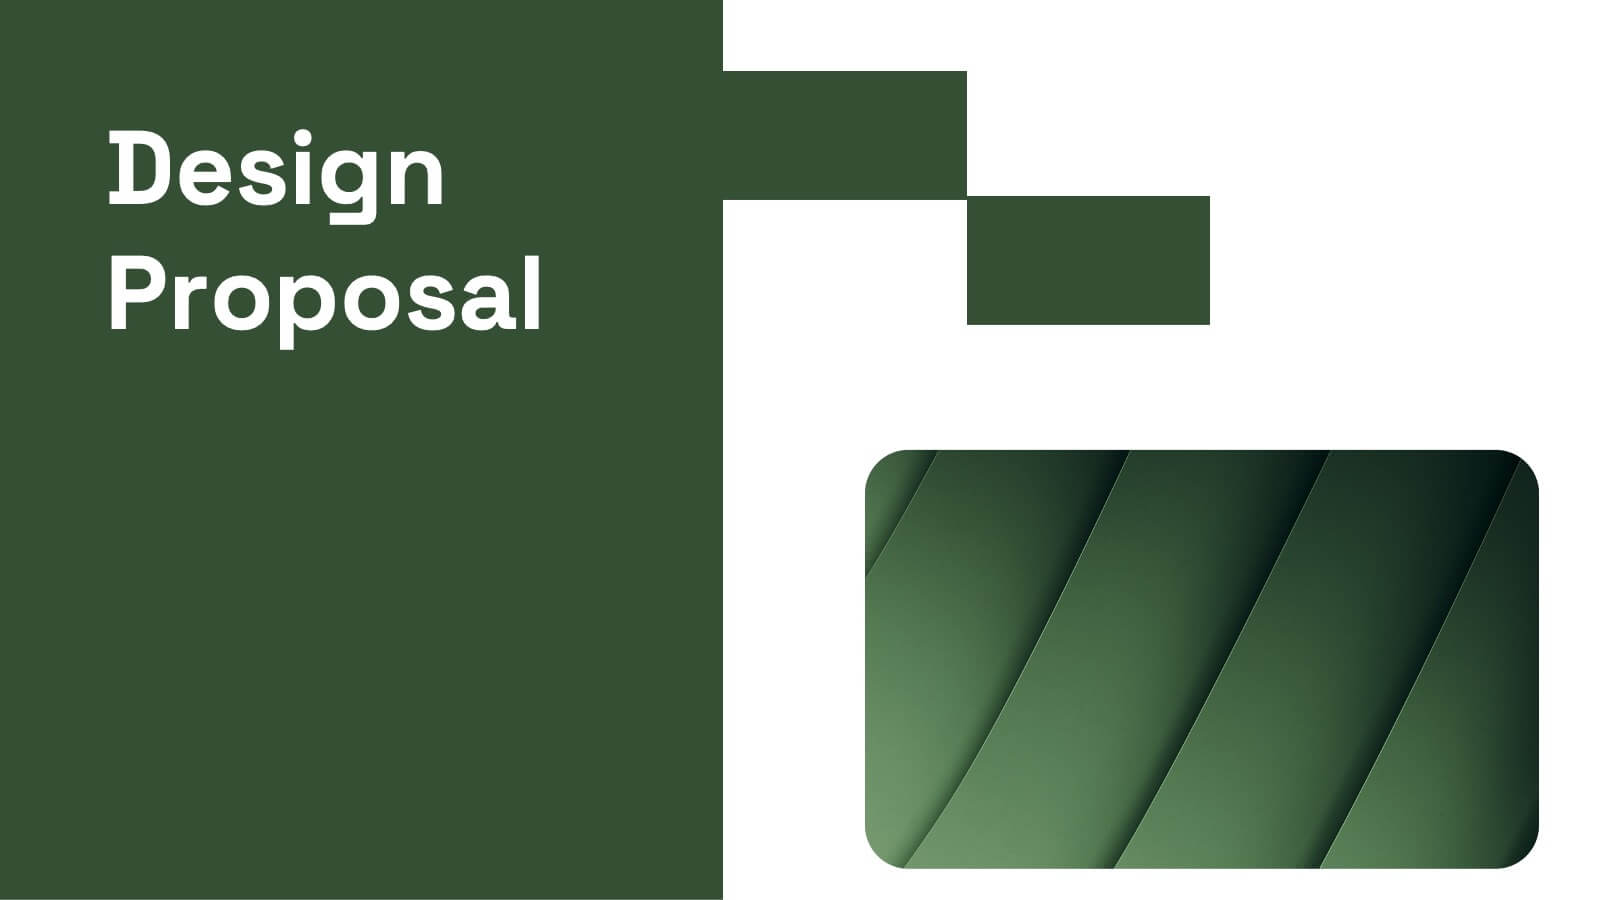
Tidal Design Proposal Presentation
Elevate your pitch with this sleek design proposal template! Perfect for presenting project details, objectives, methodology, and milestones, it ensures your ideas stand out. Impress stakeholders with clear, structured slides and professional aesthetics. Compatible with PowerPoint, Keynote, and Google Slides for a seamless presentation experience across all platforms.


7 diapositivas
Company Vision and Future Direction
Bring your company’s future into focus with this sleek, icon-led layout designed to showcase strategic goals, values, and long-term vision. Perfect for leadership presentations, investor updates, or team briefings, this slide turns abstract direction into a clear path forward. Fully compatible with PowerPoint, Keynote, and Google Slides.


21 diapositivas
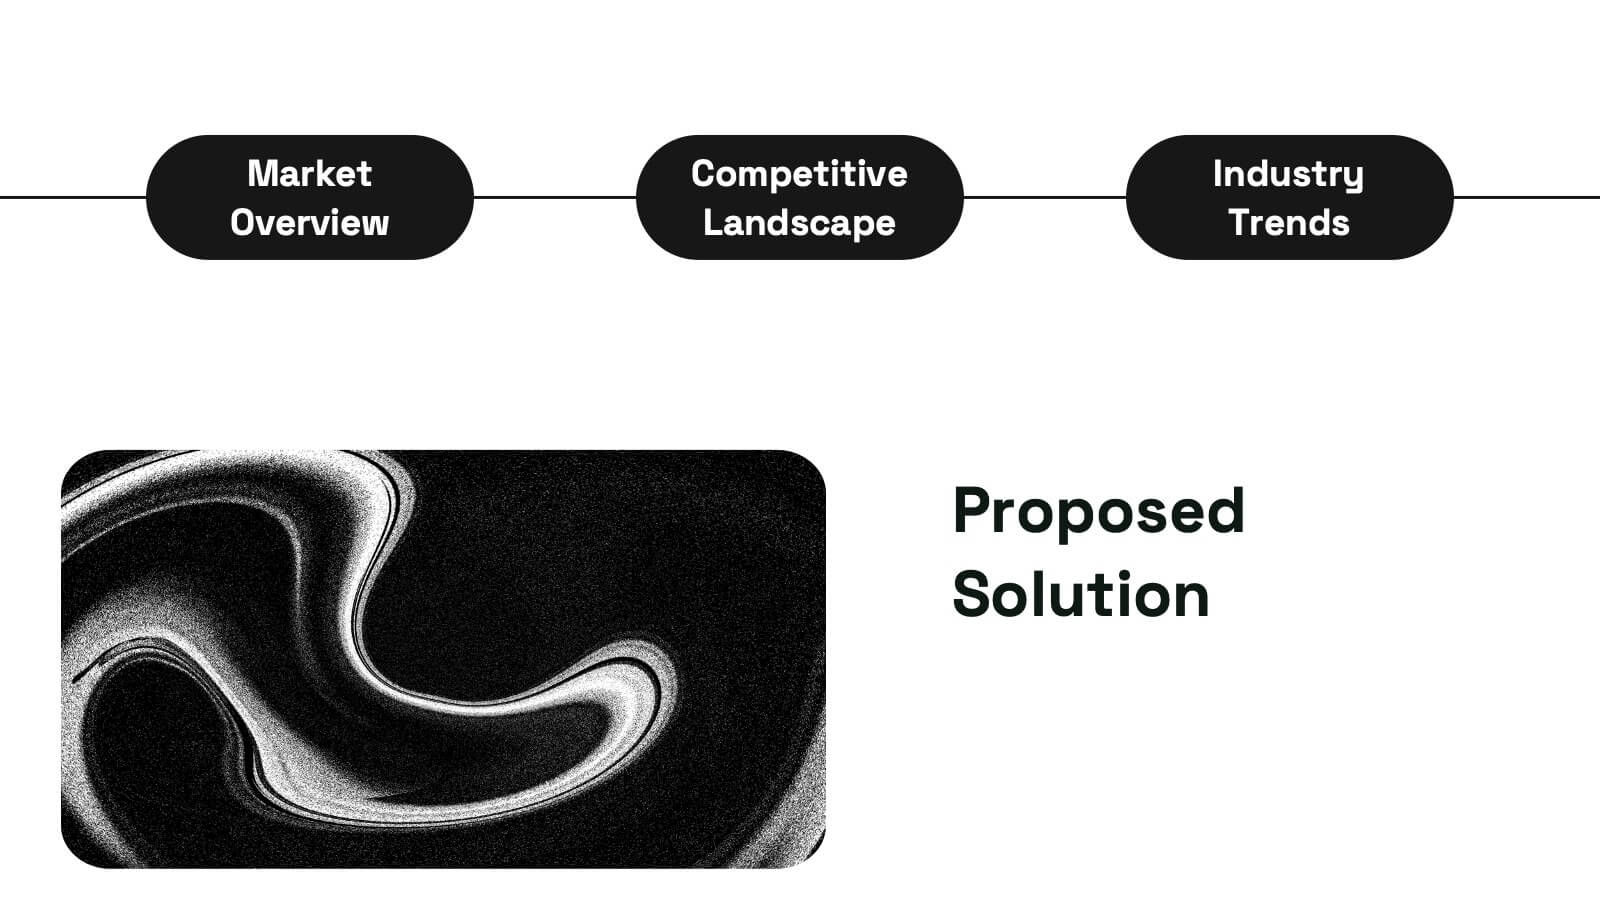
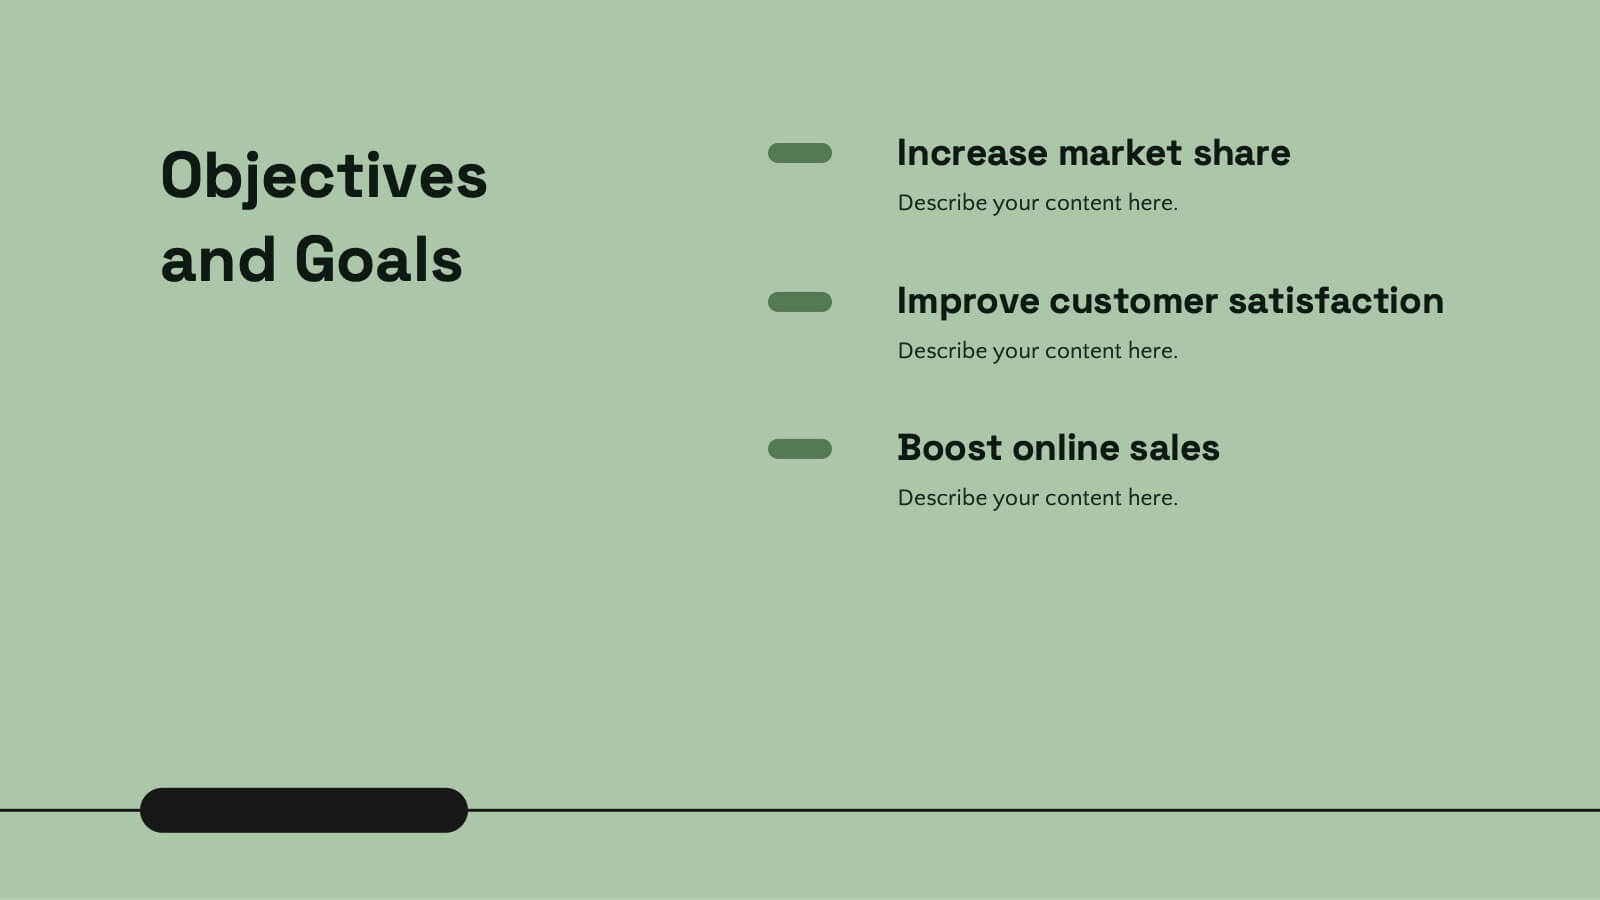
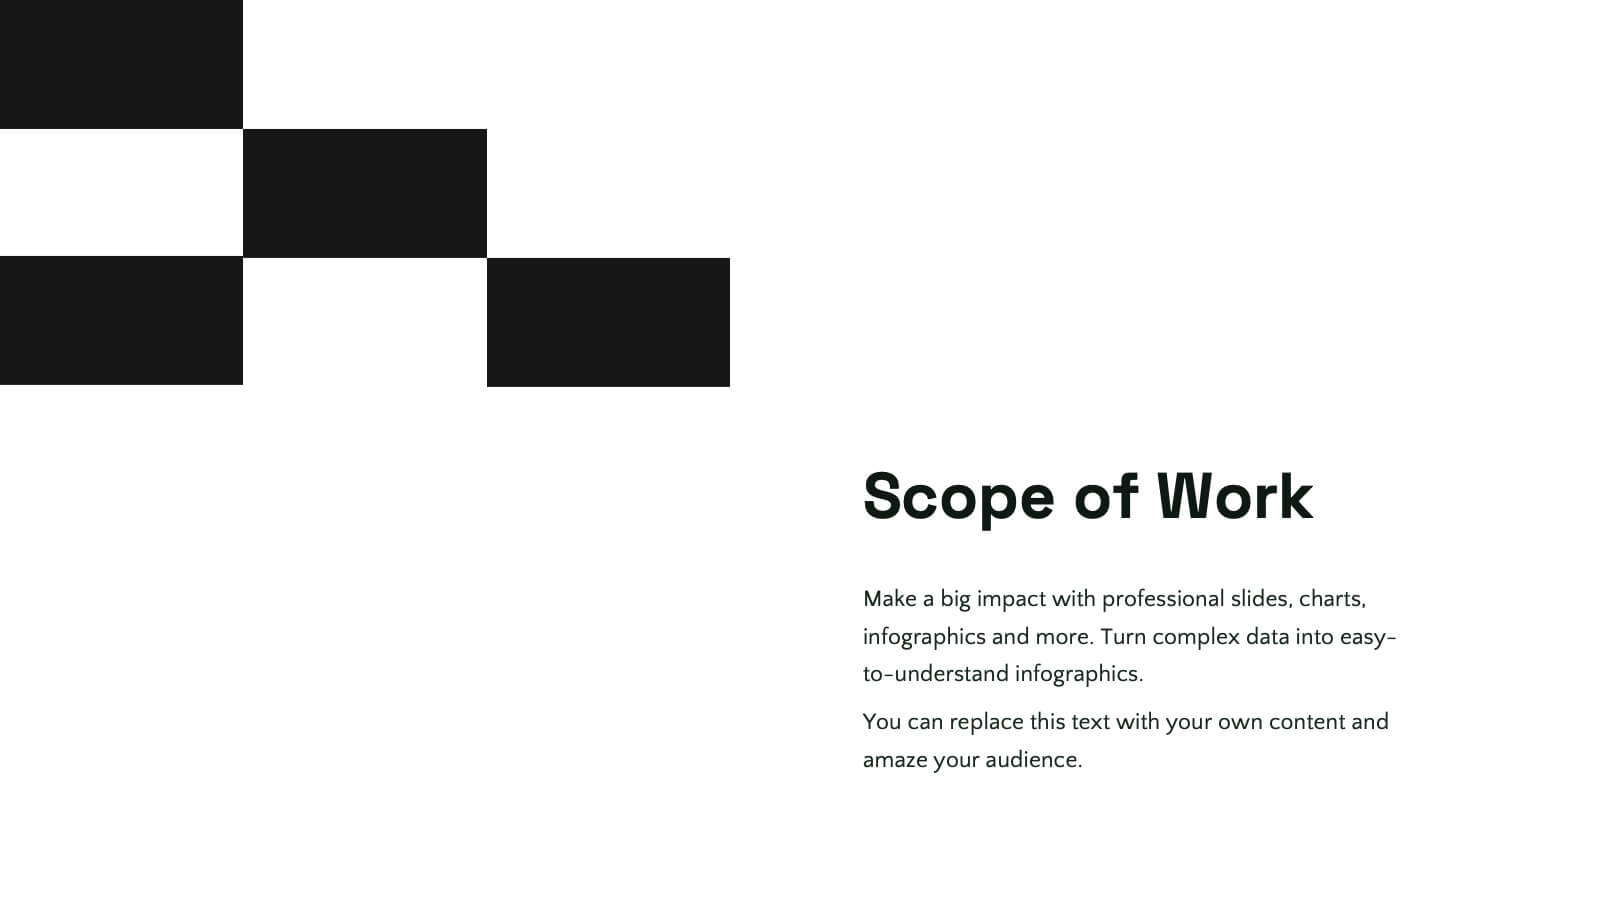
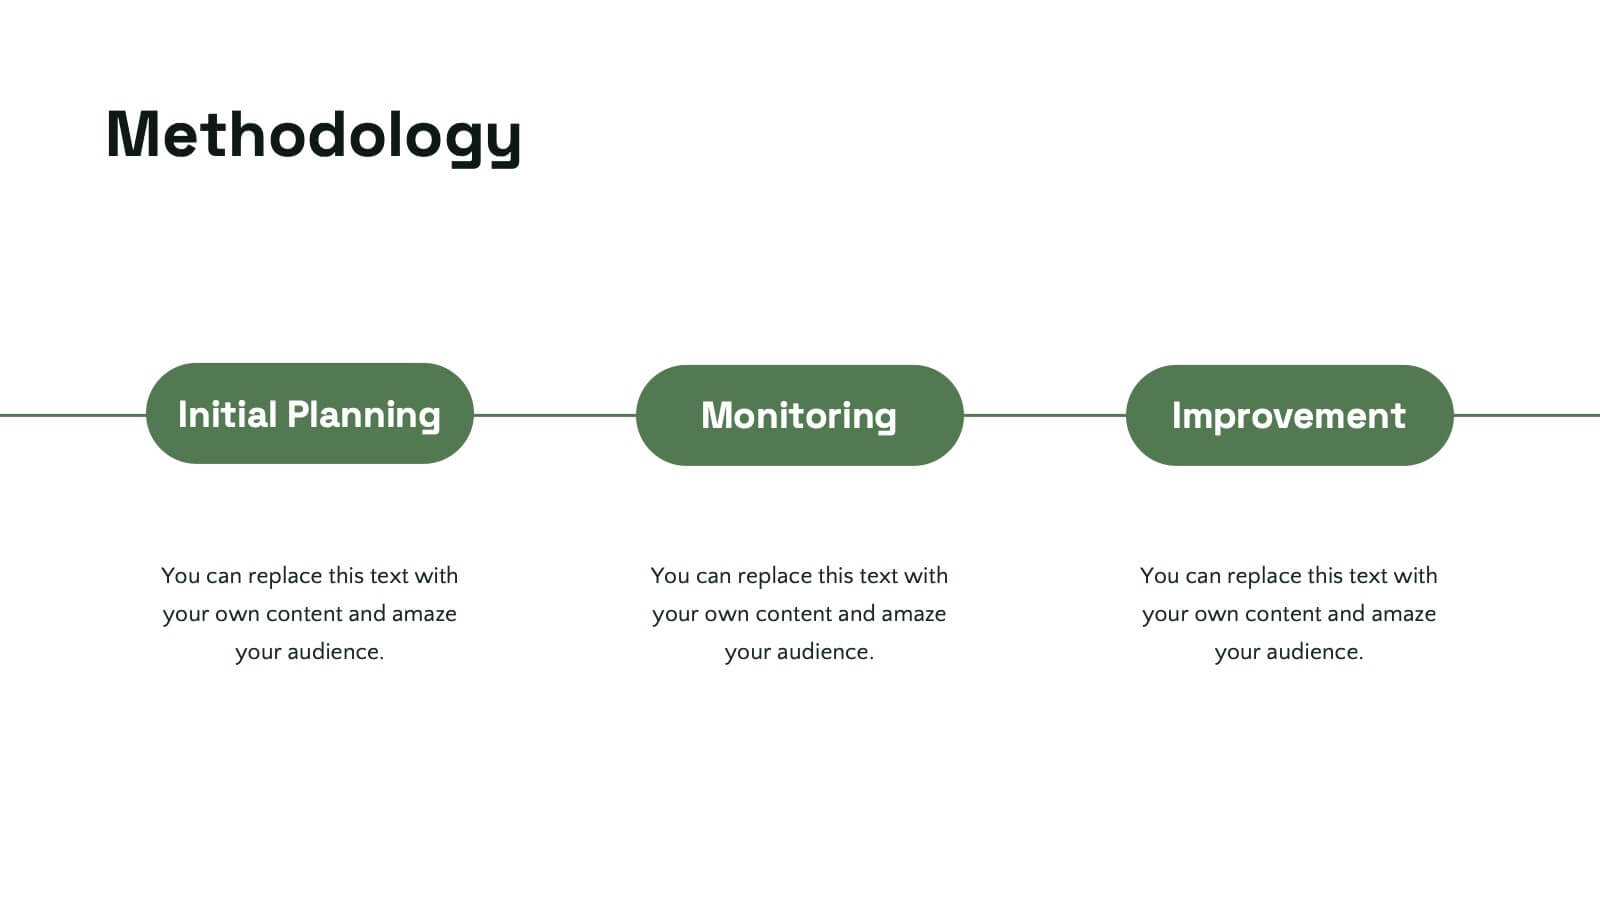
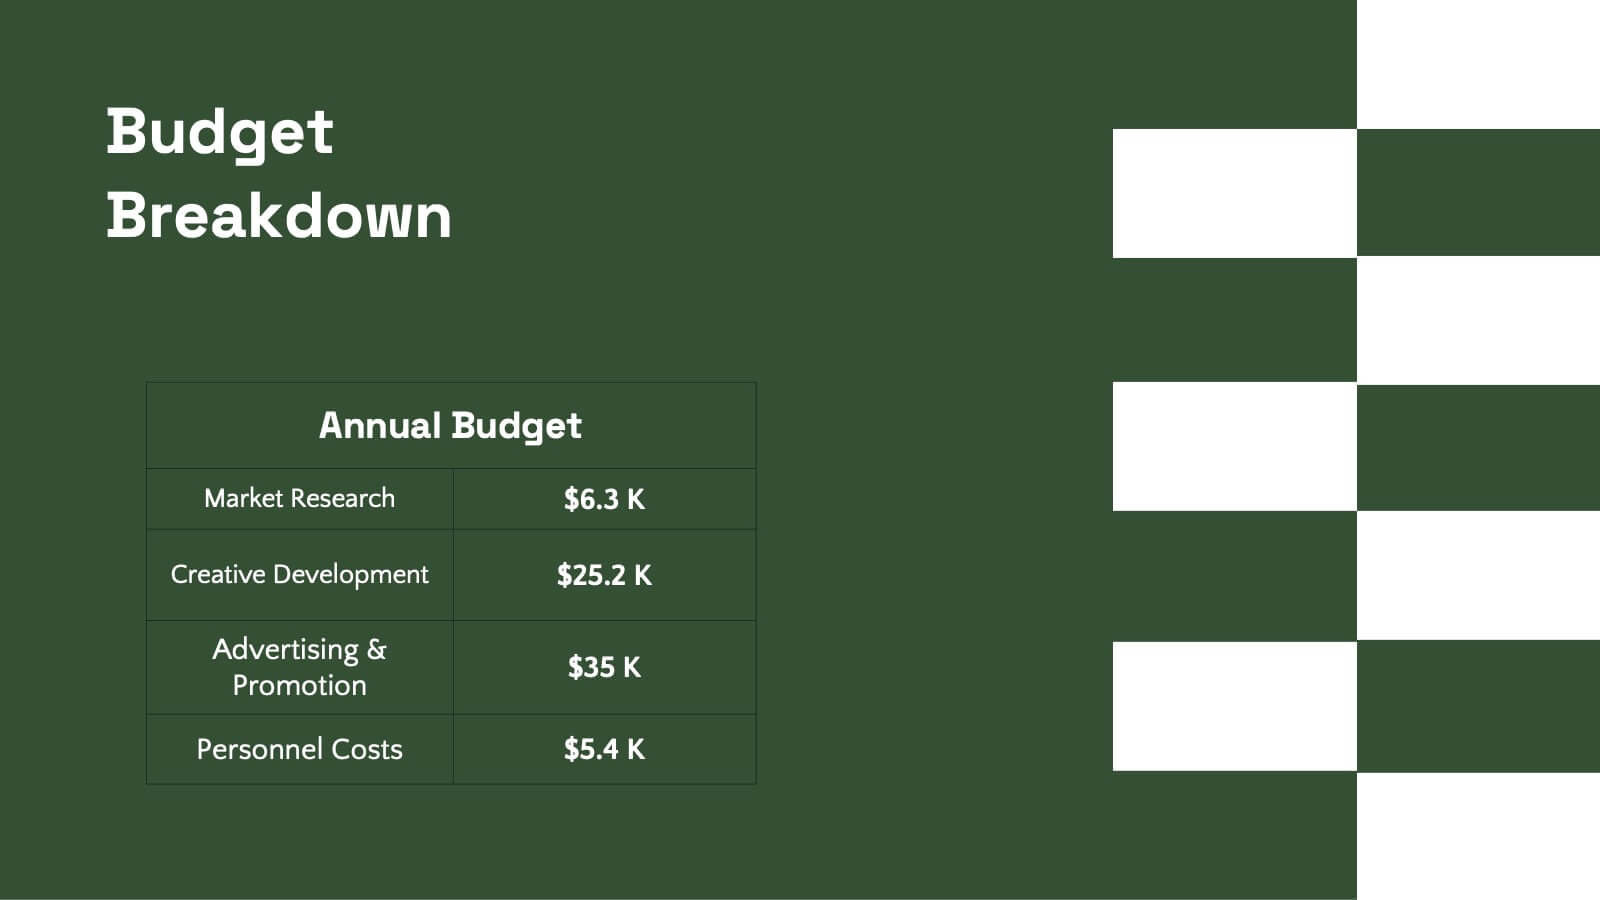
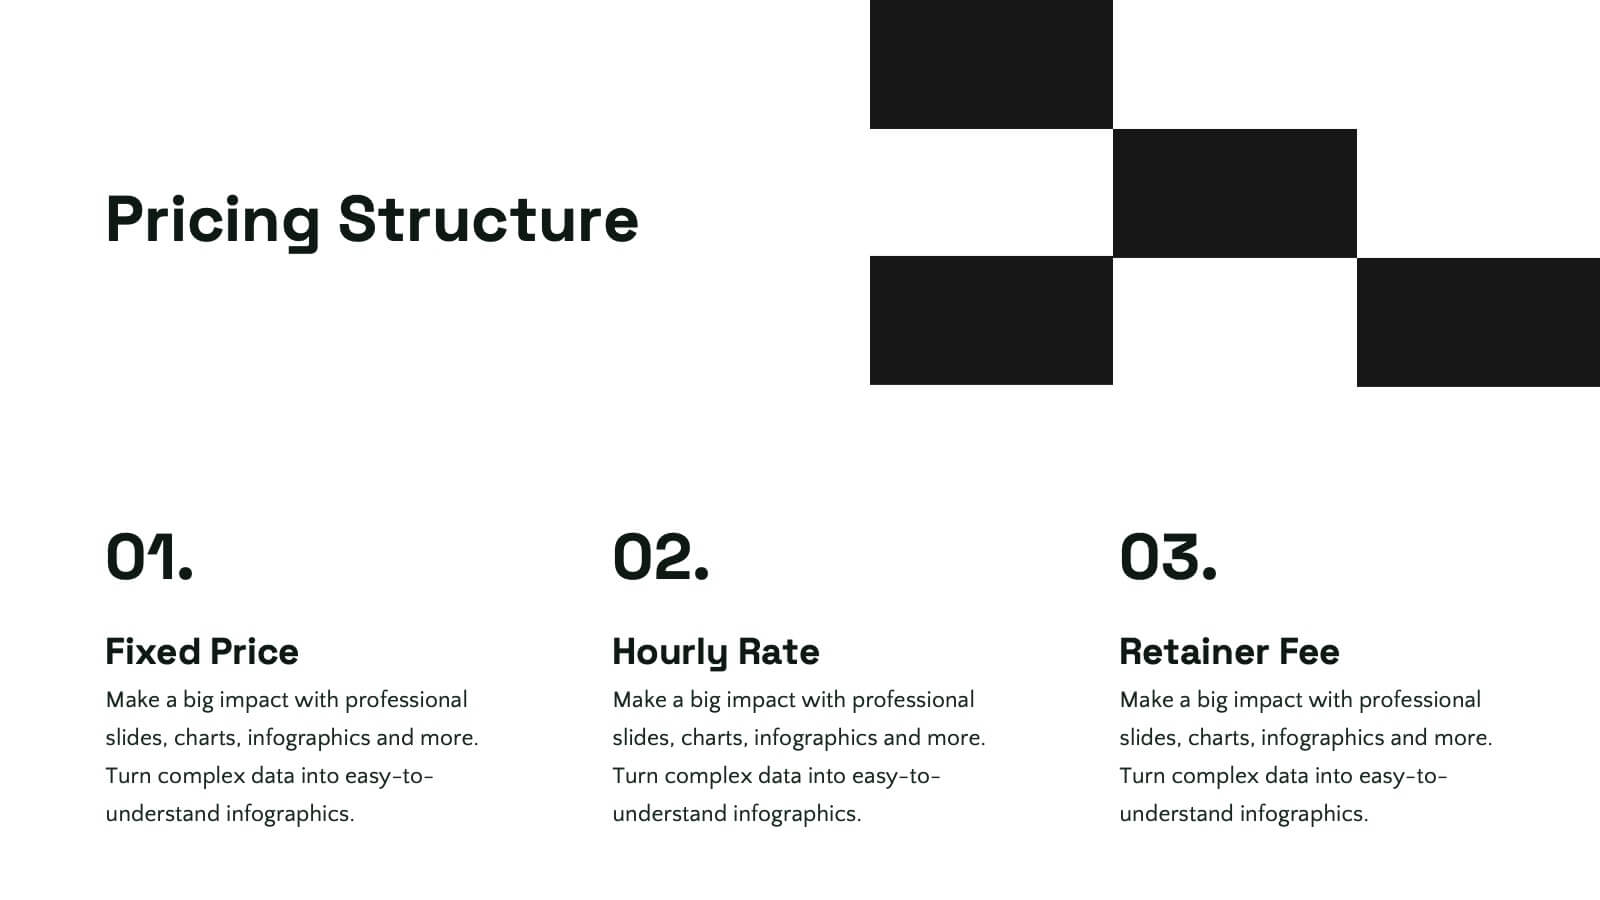
Frost Design Proposal Presentation
Present your design proposal with sophistication and clarity using this elegant template! Perfect for outlining your project summary, objectives, and proposed solutions, this template covers everything from scope of work and budget breakdowns to deliverables and team expertise. Fully compatible with PowerPoint, Keynote, and Google Slides, it's designed for seamless, professional presentations.


21 diapositivas
Cascade Marketing Proposal Template Presentation
Ignite your creativity with our dazzling Cascade Marketing Proposal Template Presentation! This captivating design brings your ideas to life, ensuring your presentation stands out. The sleek, dark theme is punctuated by electric blue accents, adding a modern, professional touch. Each slide is meticulously crafted, offering a perfect blend of visuals and content that keeps your audience engaged from start to finish. From the Company Overview to Growth Projections, every aspect of your pitch is highlighted with style and clarity. The template is fully customizable, allowing you to tailor it to your brand's identity effortlessly. Whether you're pitching to investors or presenting internally, this template has everything you need to make a lasting impression. Compatible with PowerPoint, Keynote, and Google Slides, it’s versatile and easy to use. Get ready to electrify your next presentation and leave your audience in awe!


4 diapositivas
Resource Mapping in African Regions Presentation
Visualize regional distribution clearly with the Resource Mapping in African Regions Presentation. This engaging slide highlights key areas using color-coded map segments, helping you present data like resource allocation, project focus, or regional analysis with clarity. Ideal for NGOs, researchers, or government briefings. Compatible with PowerPoint, Keynote, Canva, and Google Slides.