


Características


¿Tienes alguna pregunta?
Recomendar


10 diapositivas
National Distribution Network in the US Presentation
Present your logistics strategy with clarity using the National Distribution Network in the US Presentation. This slide visually maps out your key distribution hubs across the country, pairing each location with a numbered label and space for insights or logistics data. Ideal for supply chain overviews, retail operations, or partner briefings. Fully editable in Canva, PowerPoint, and Google Slides.


28 diapositivas
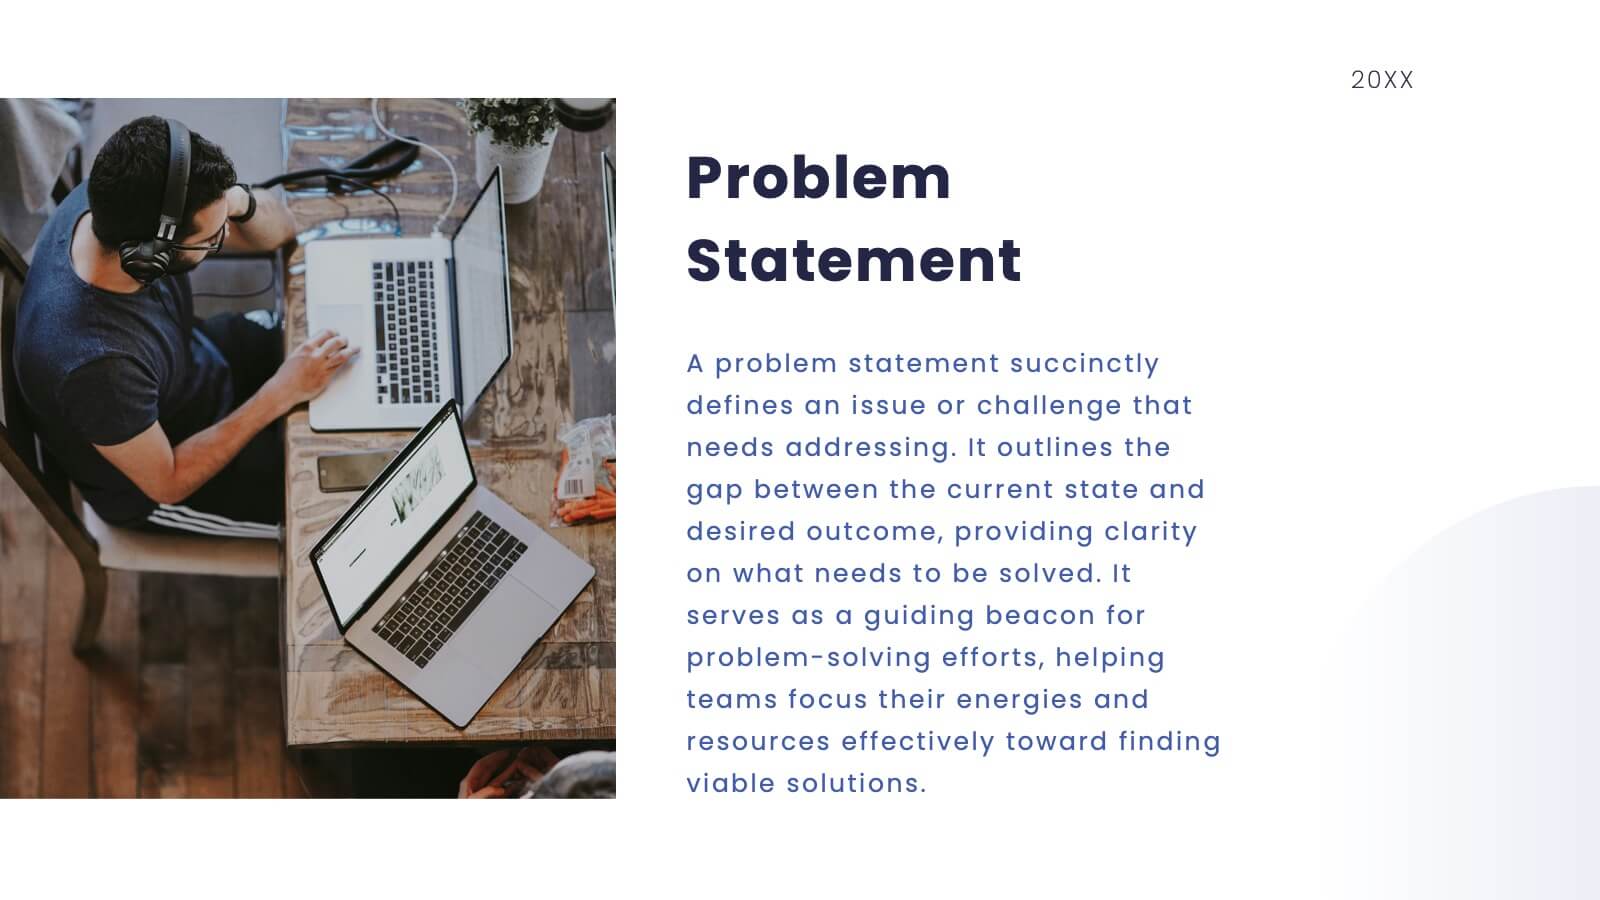
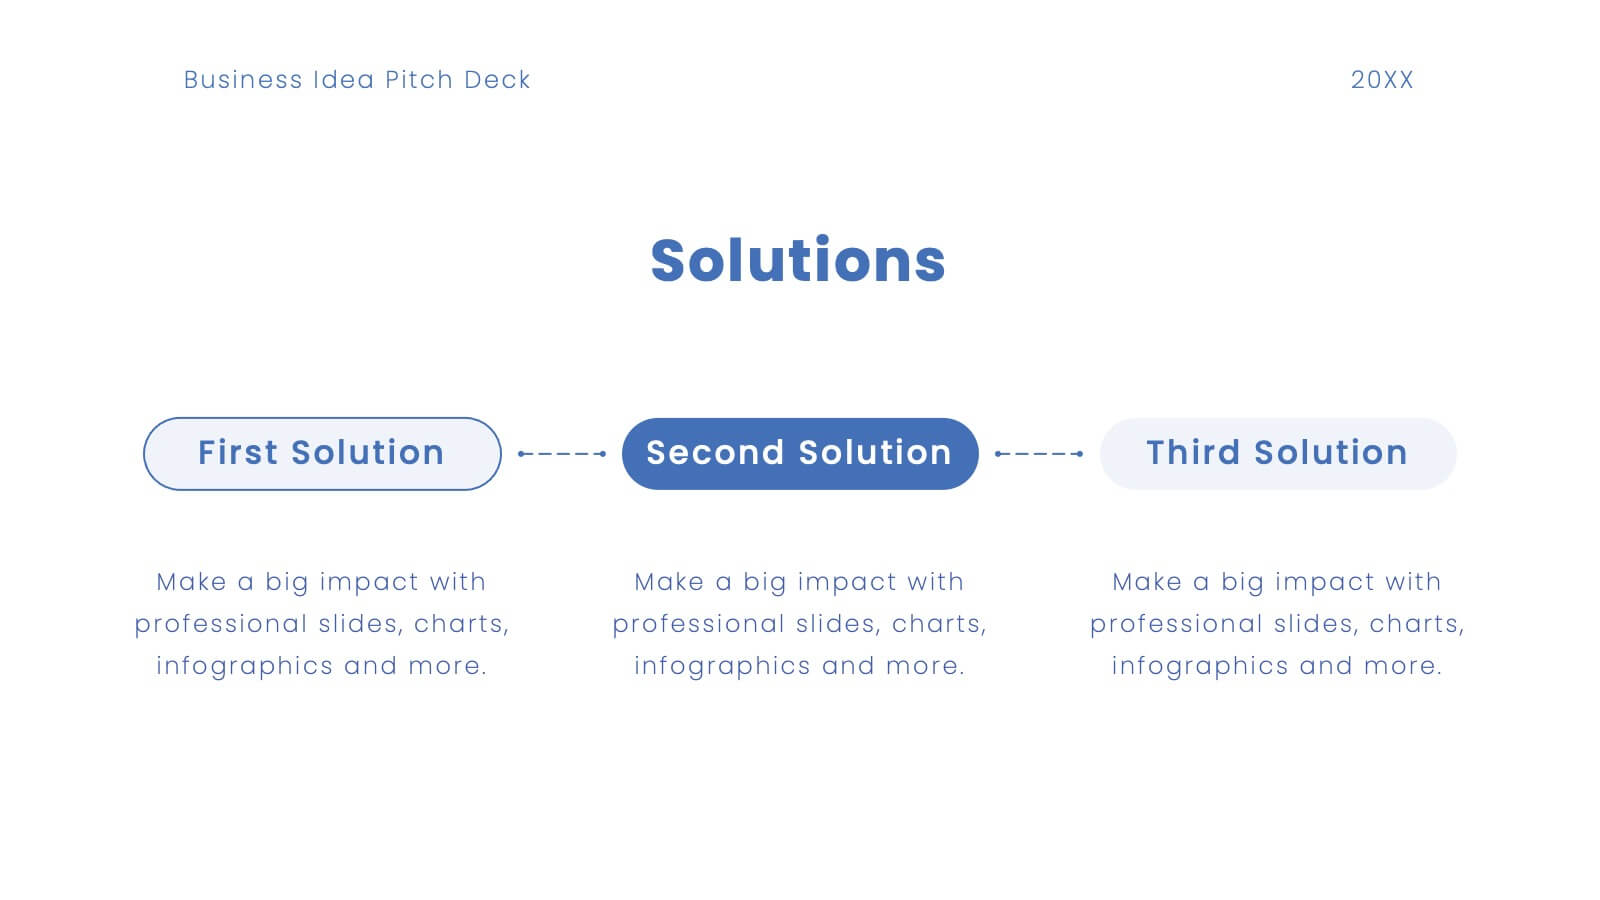
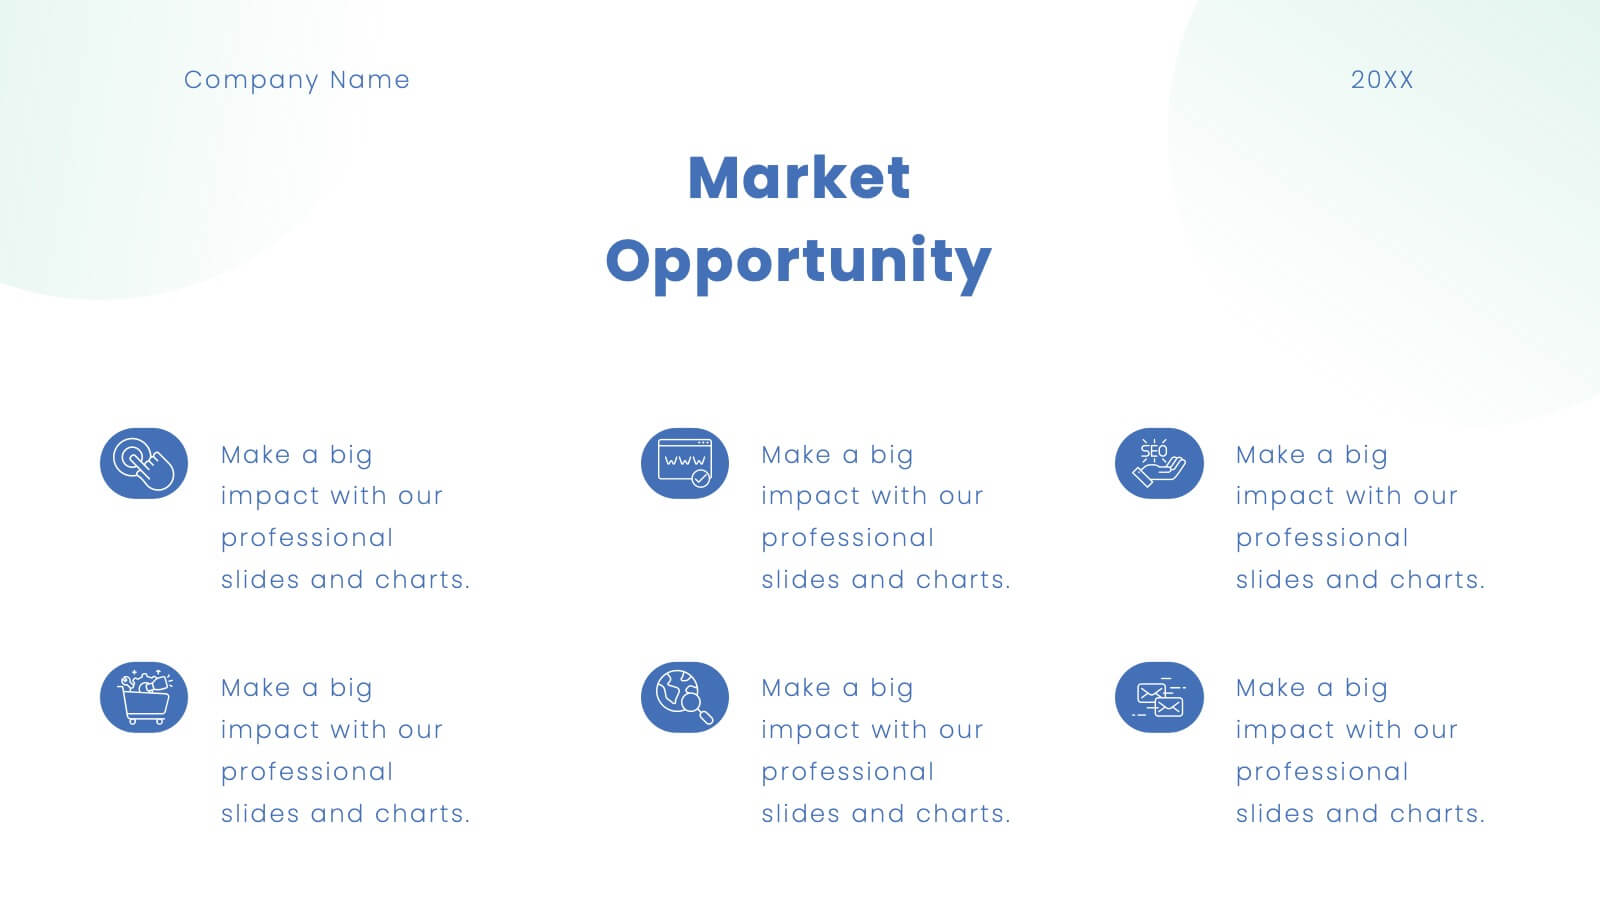
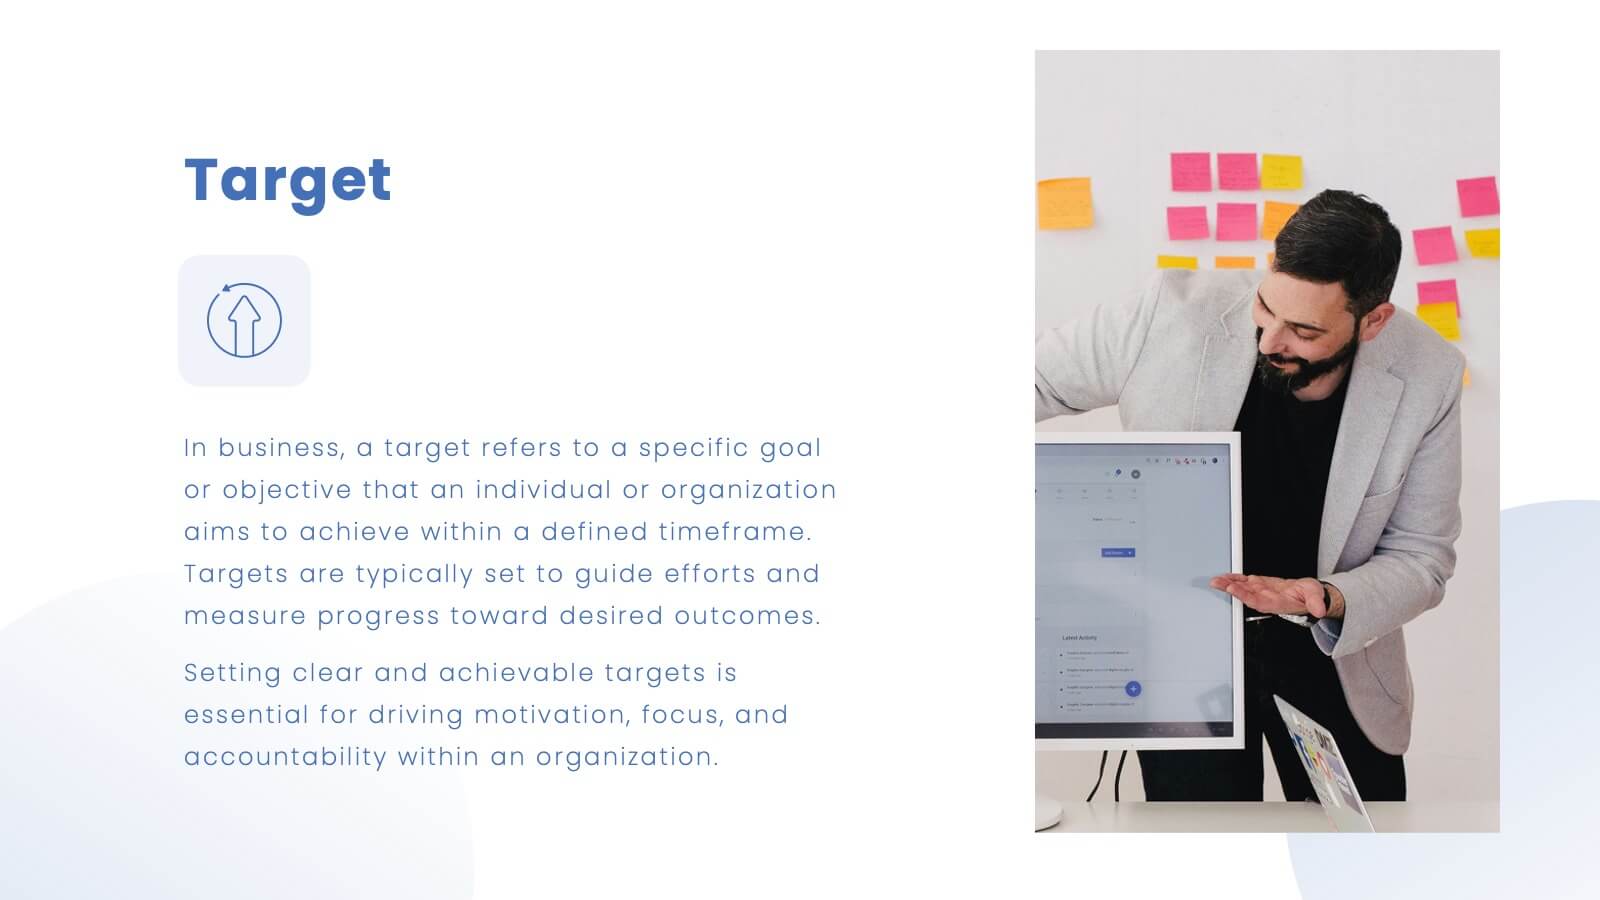
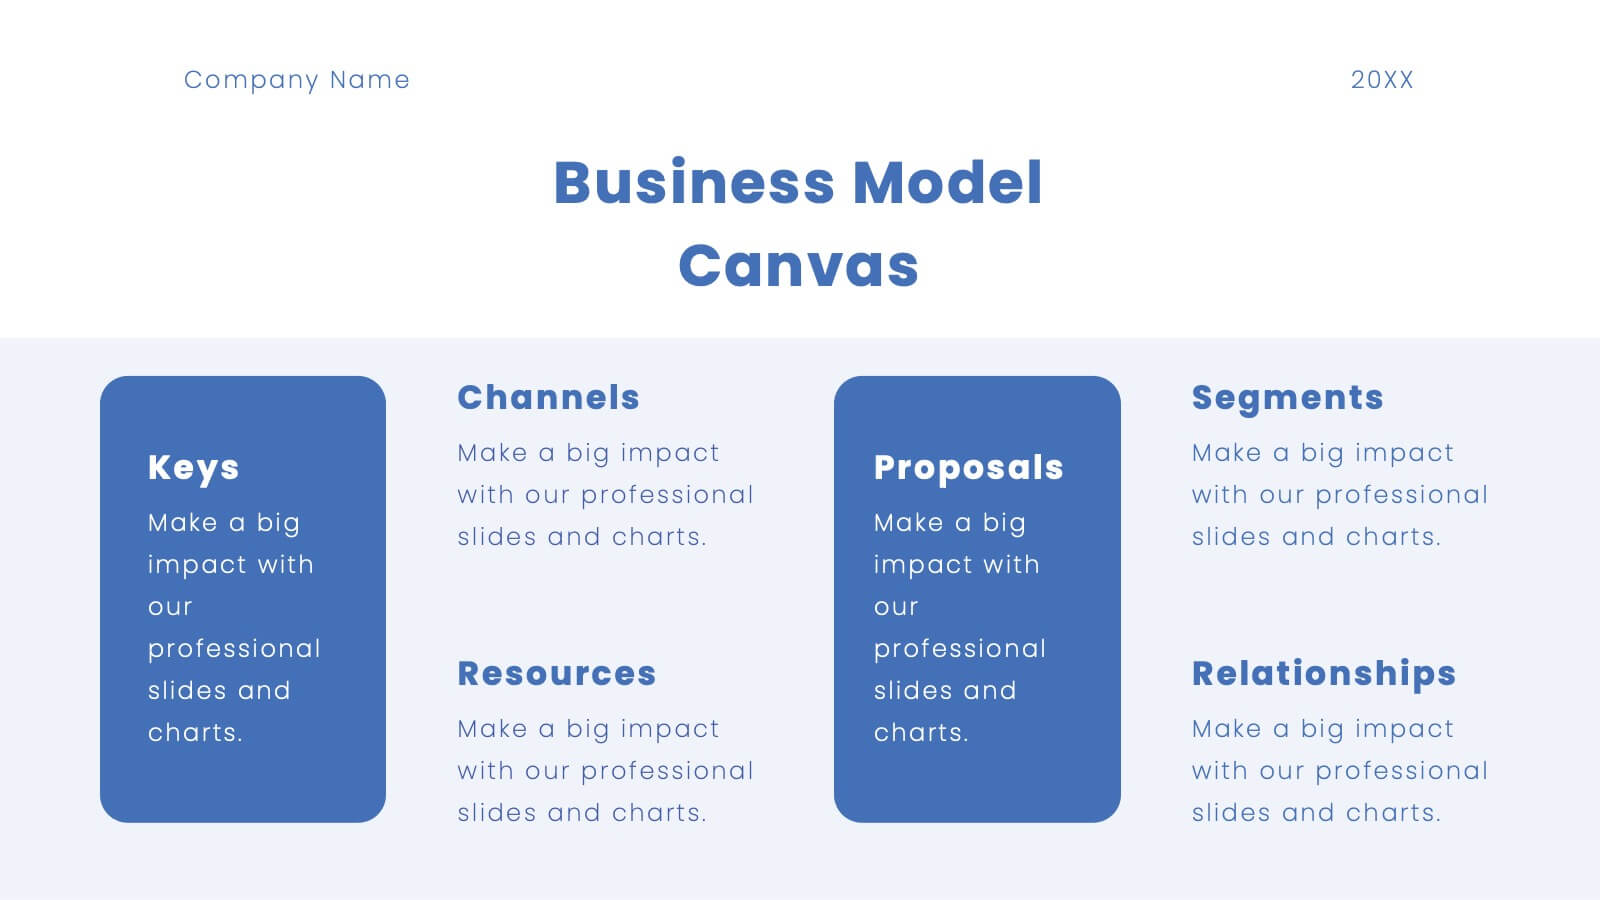
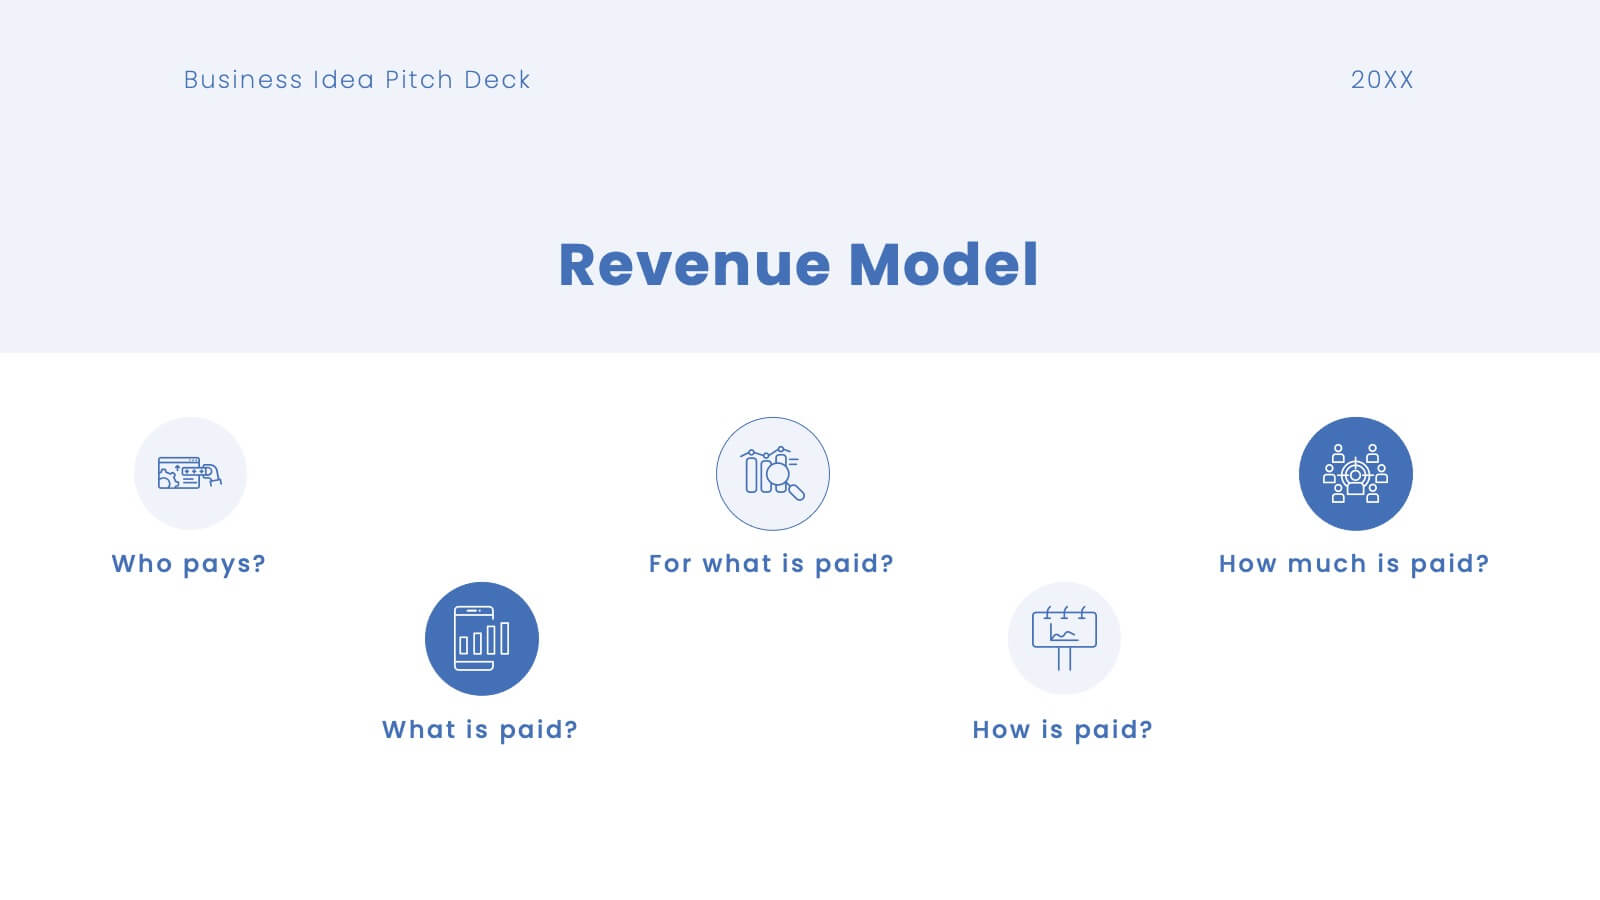
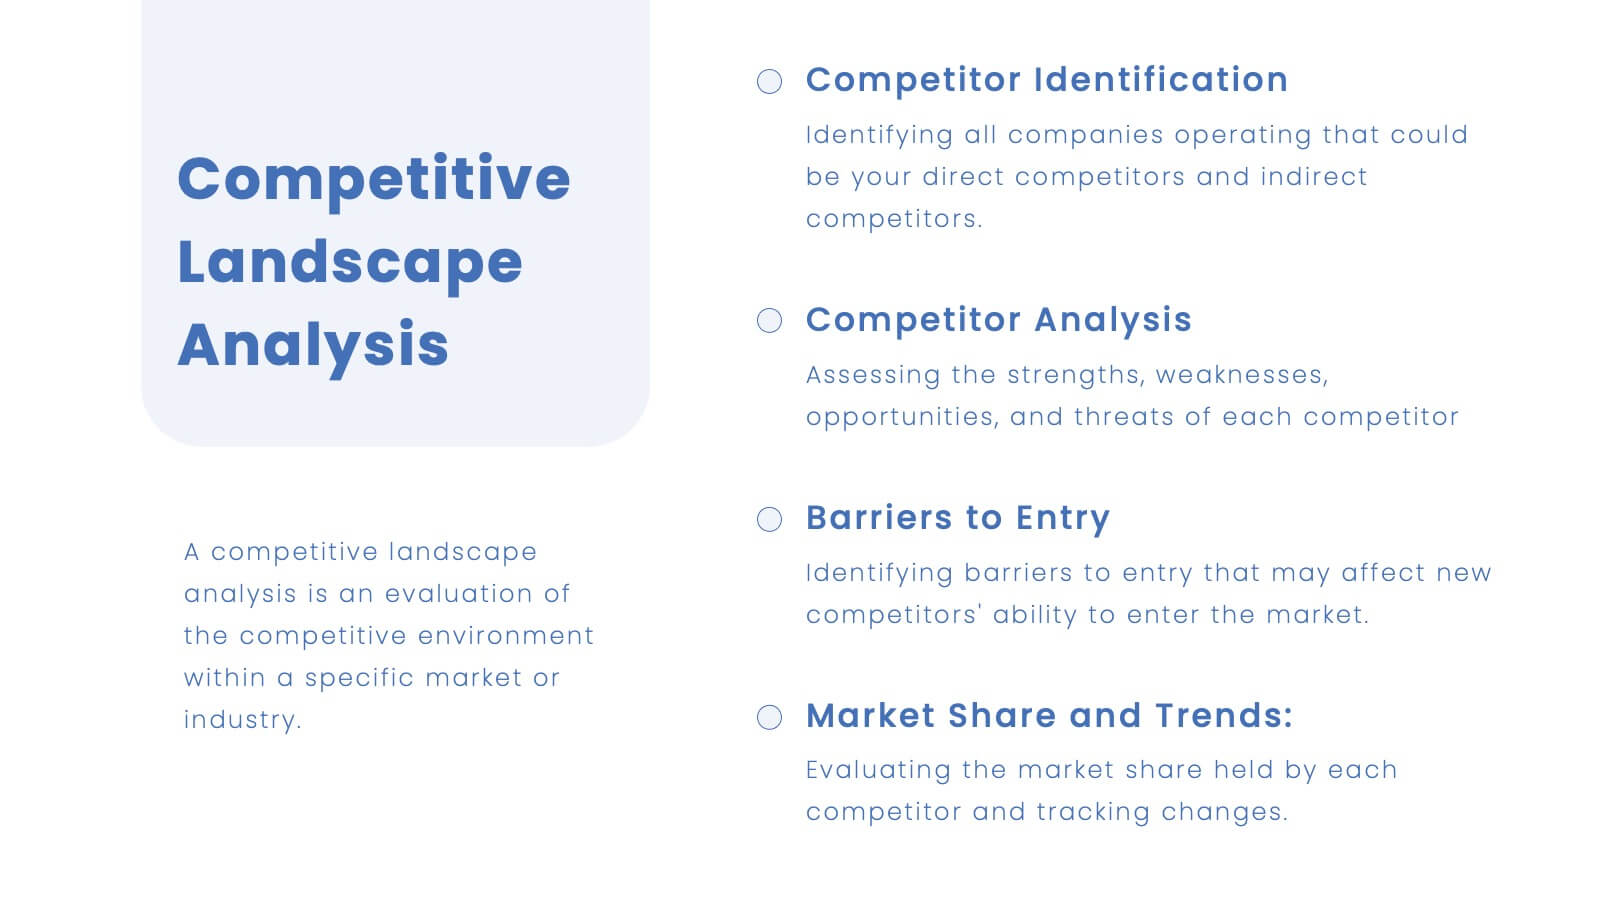
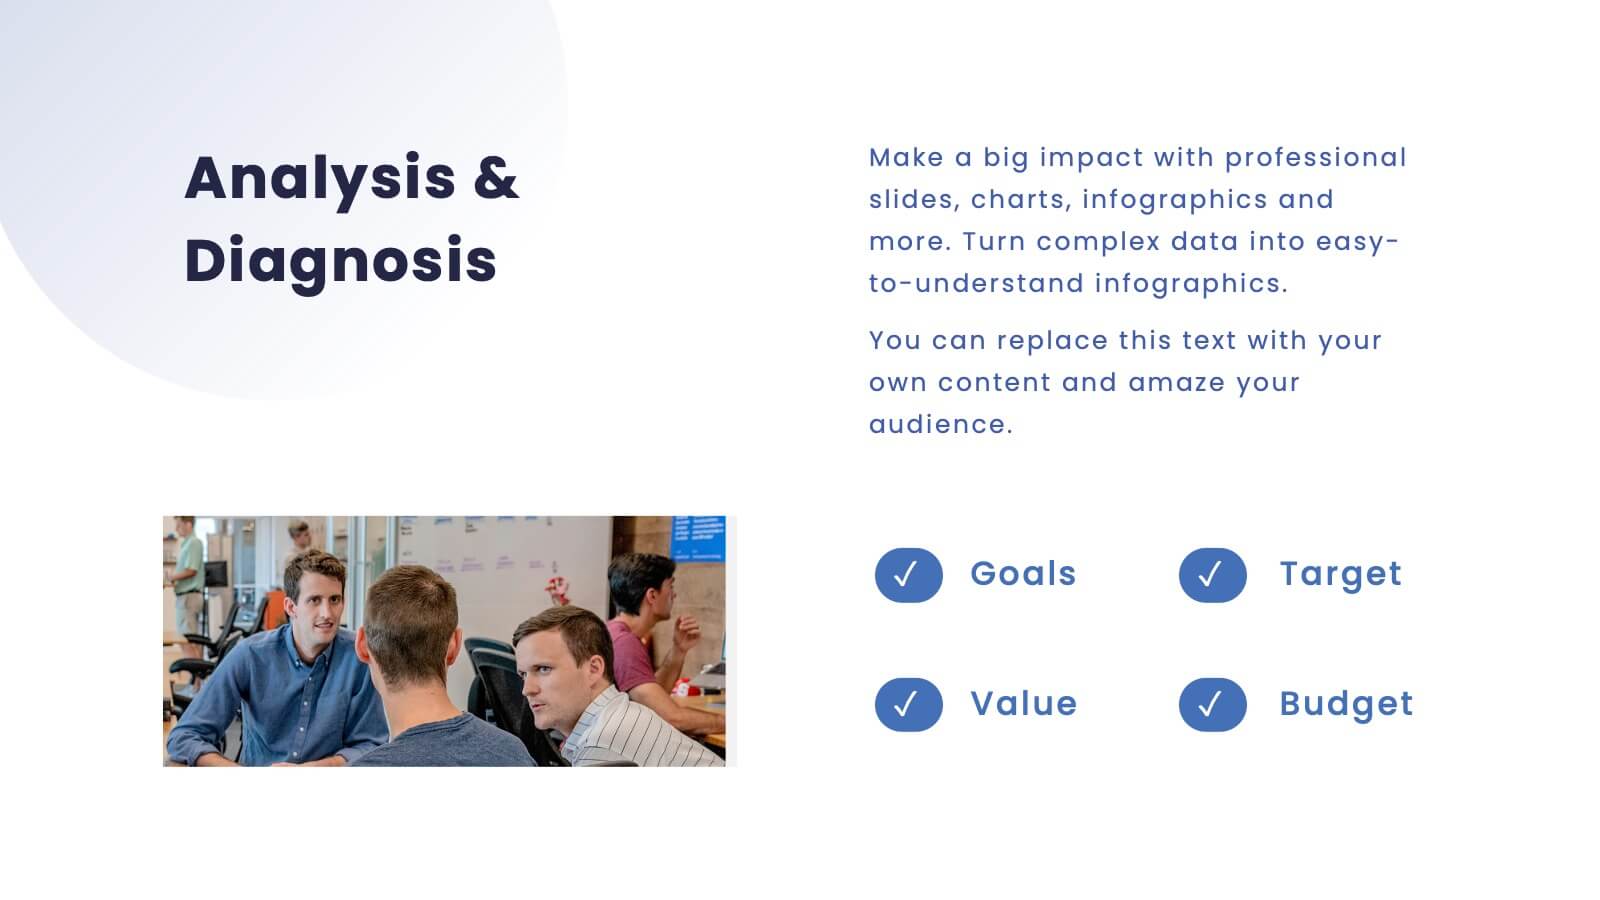
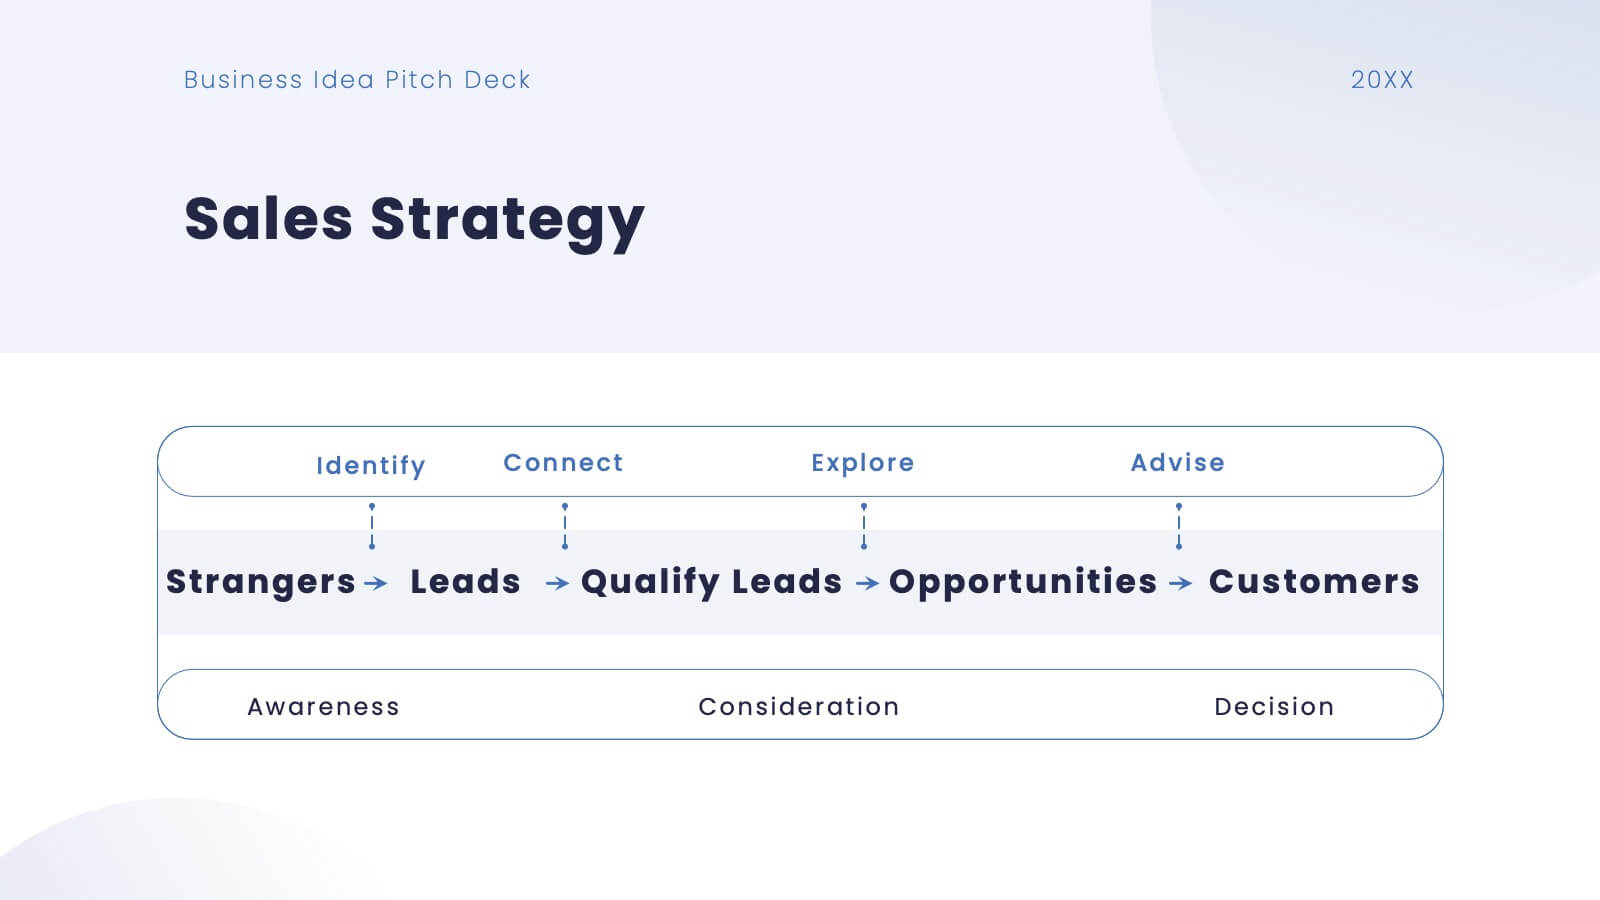
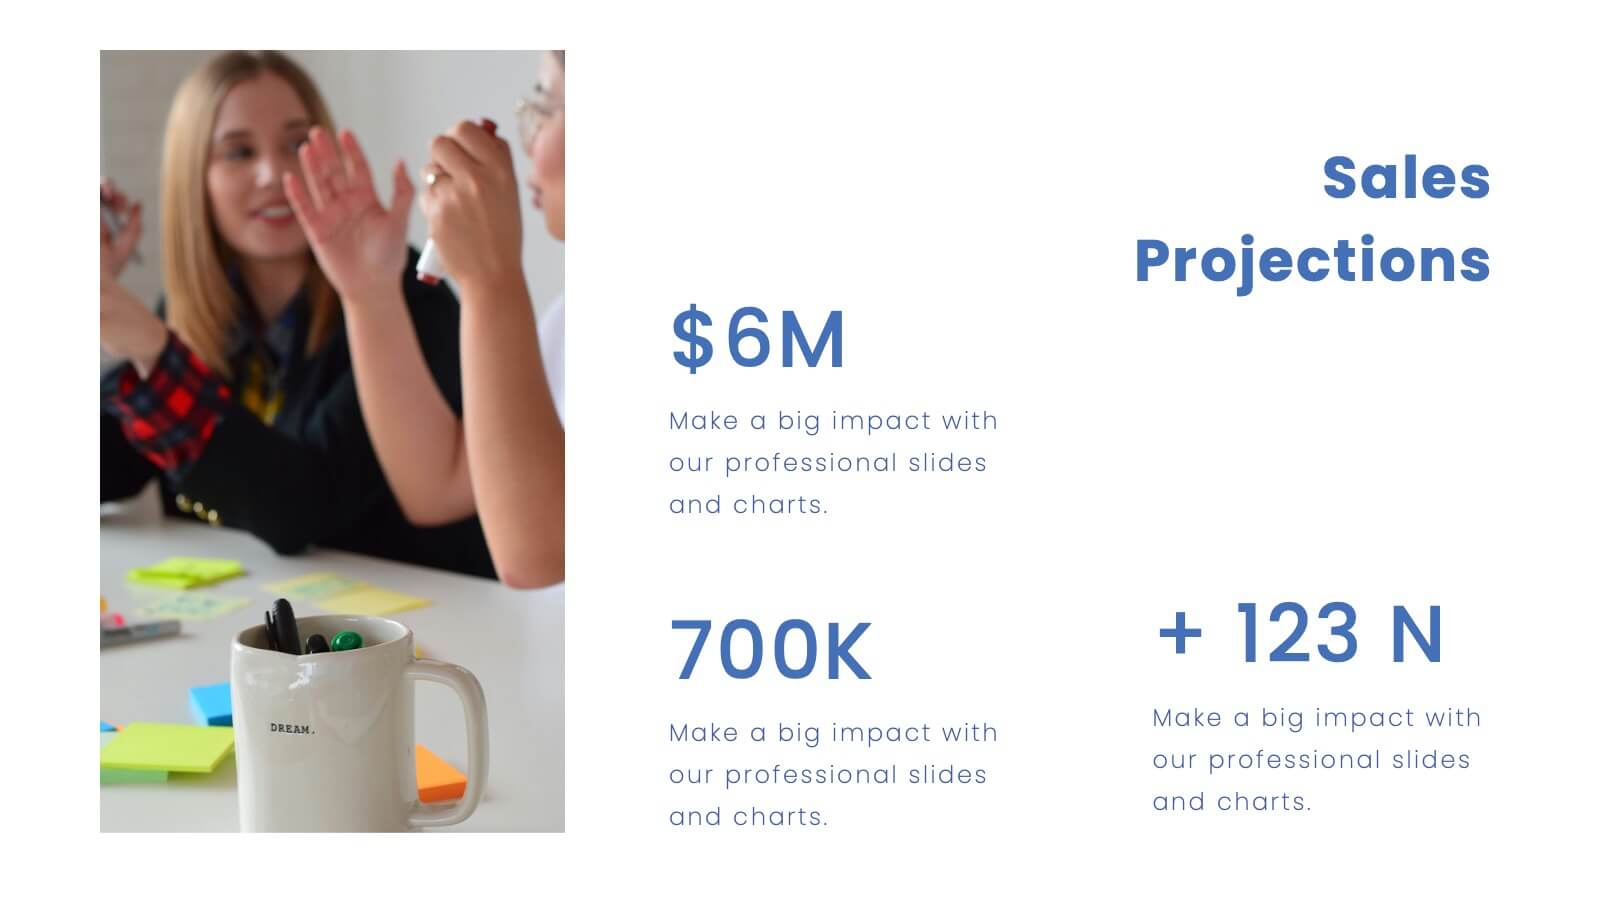
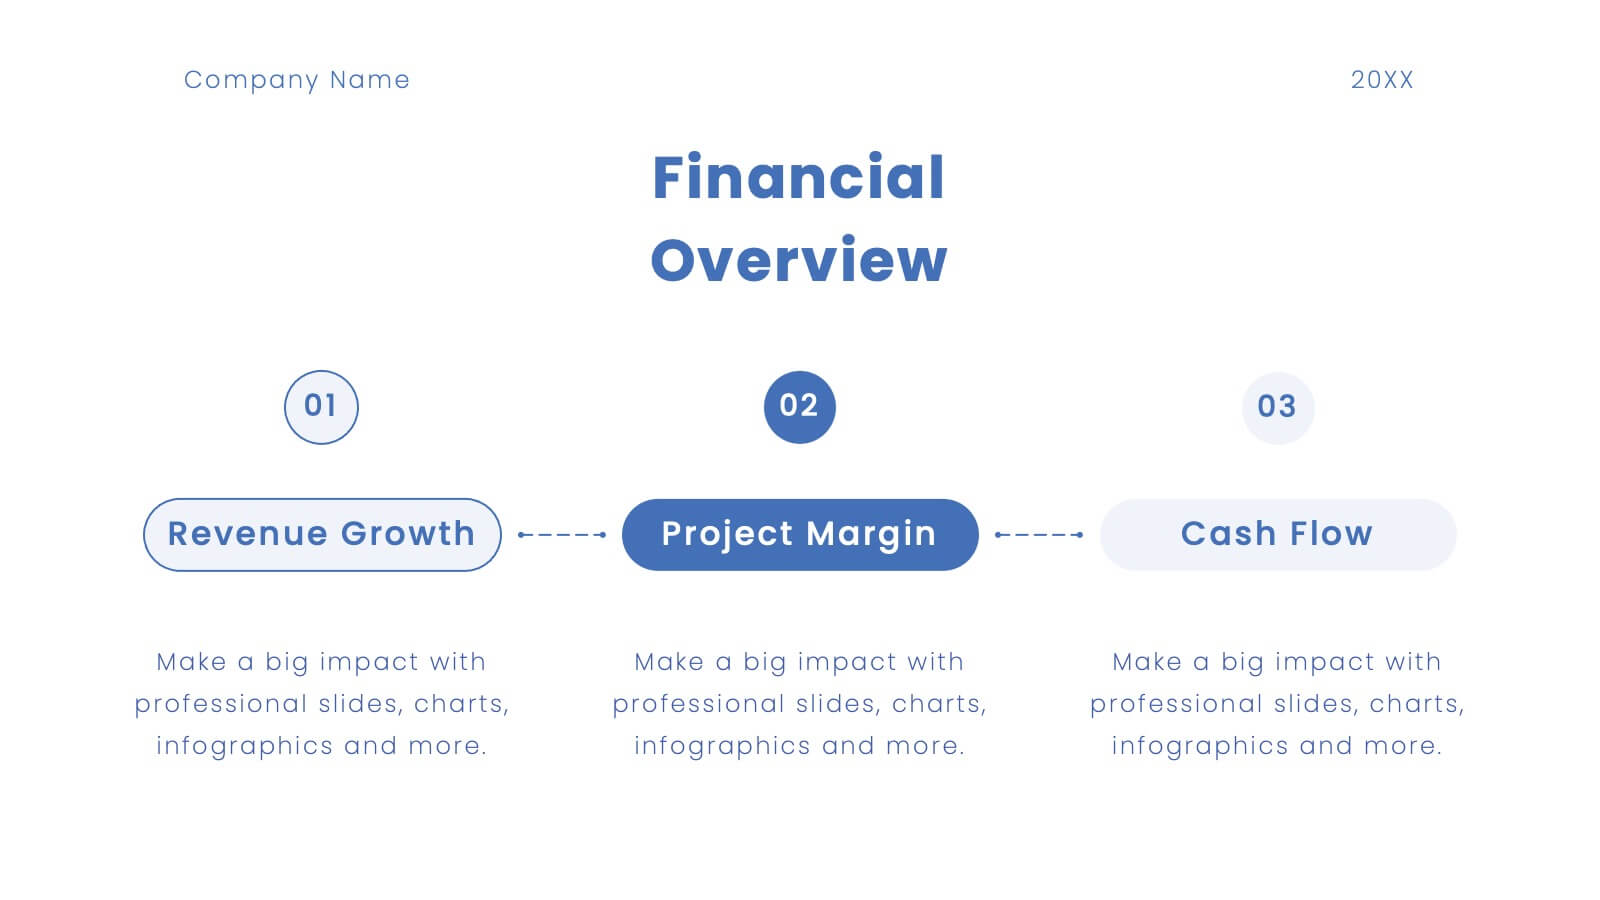
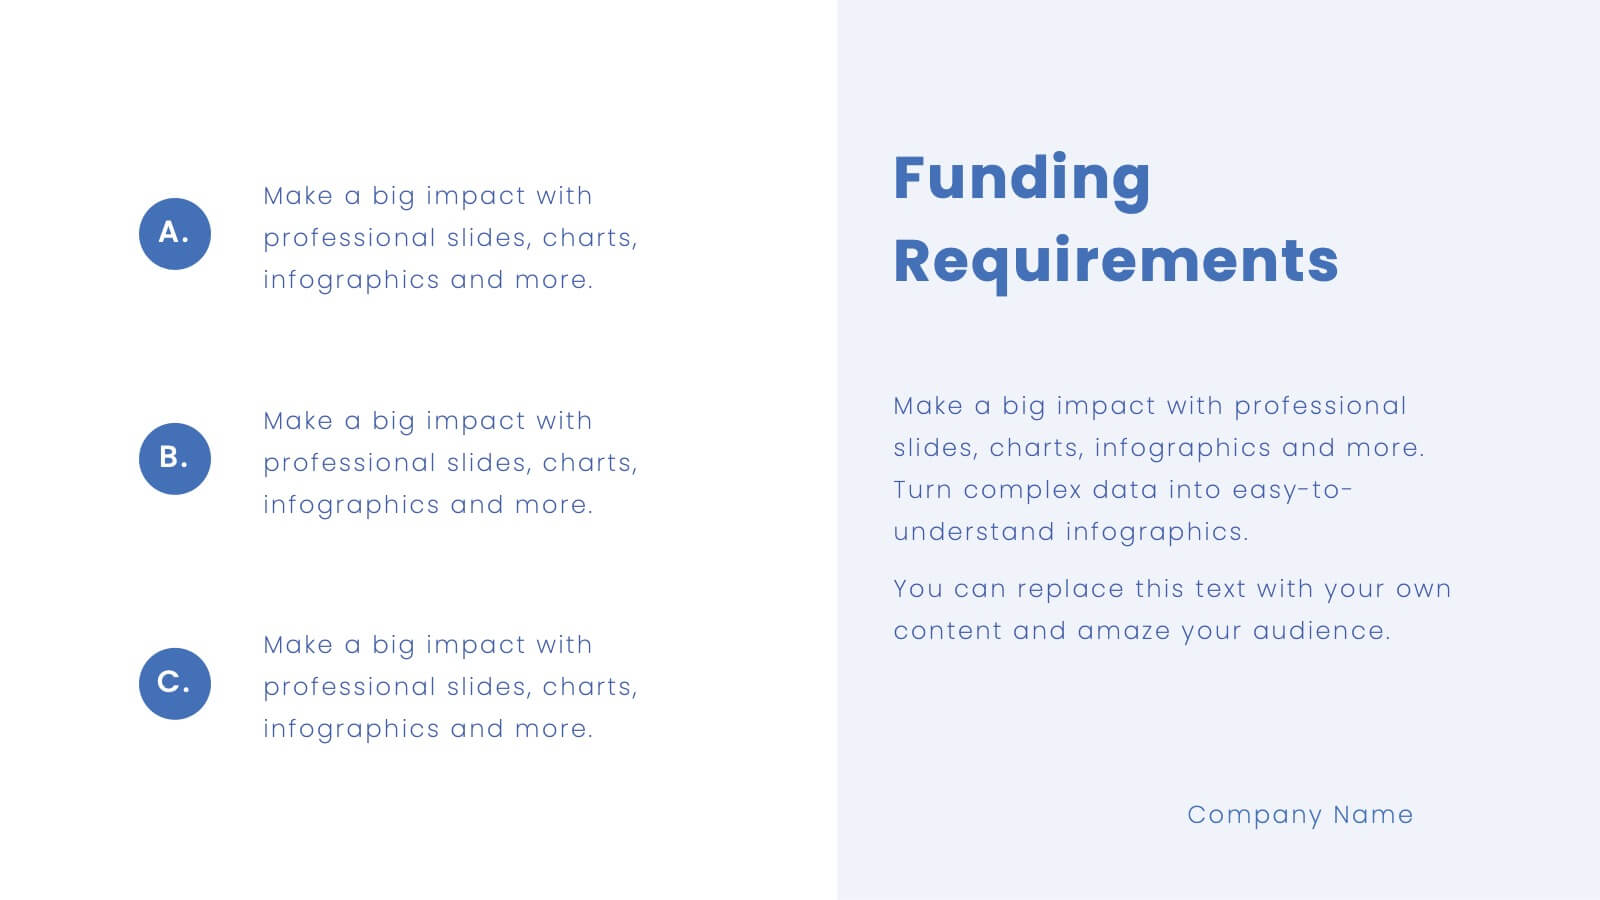
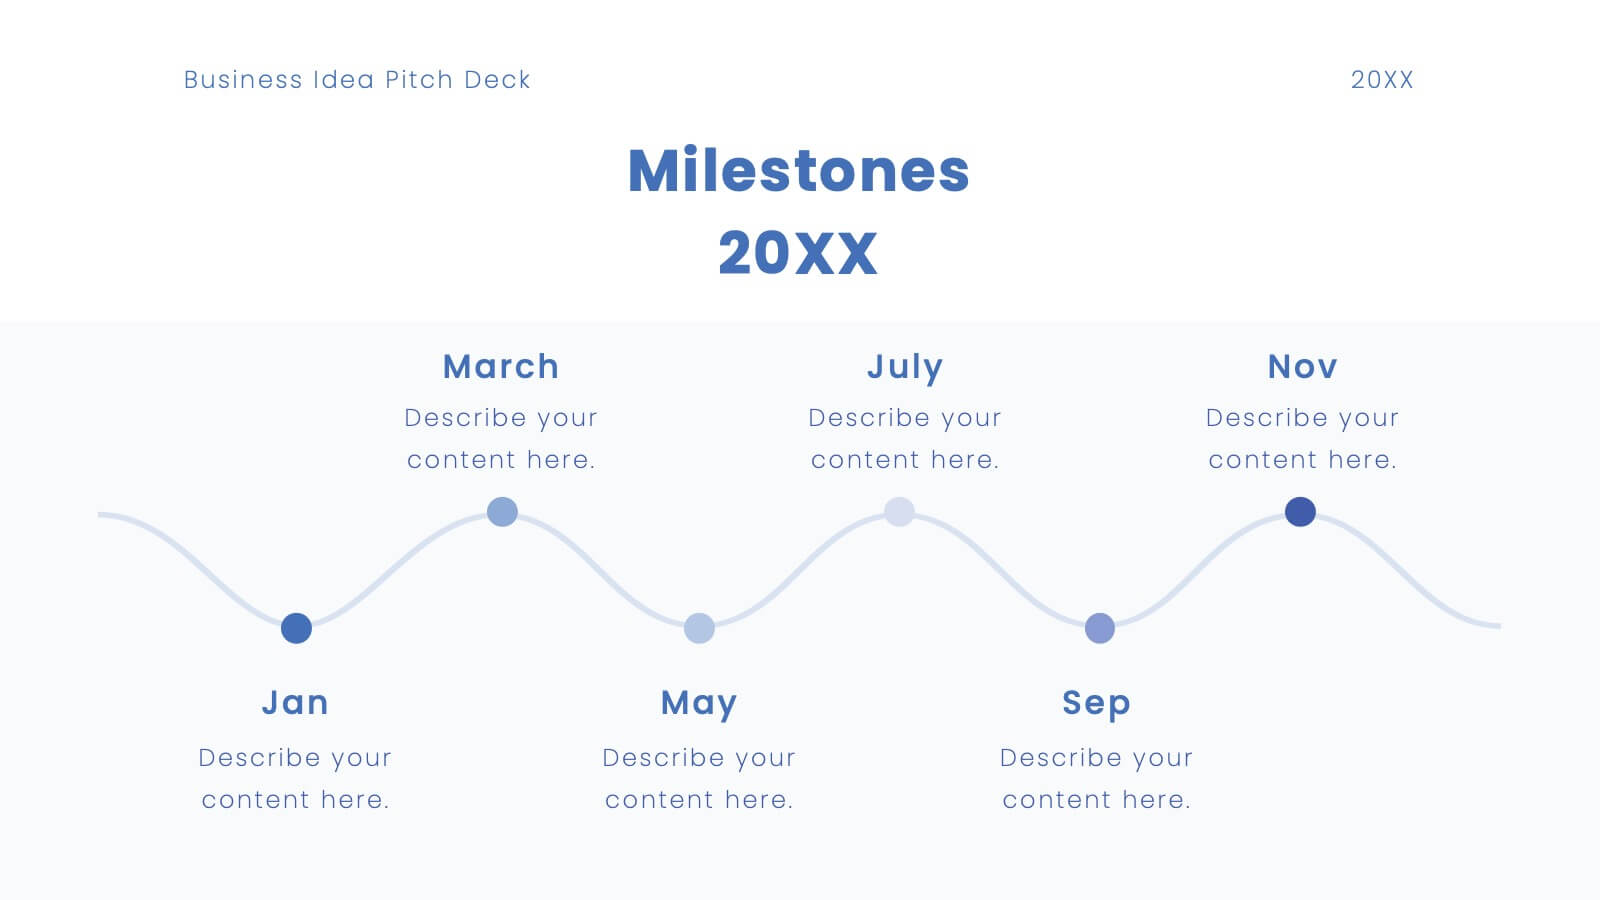
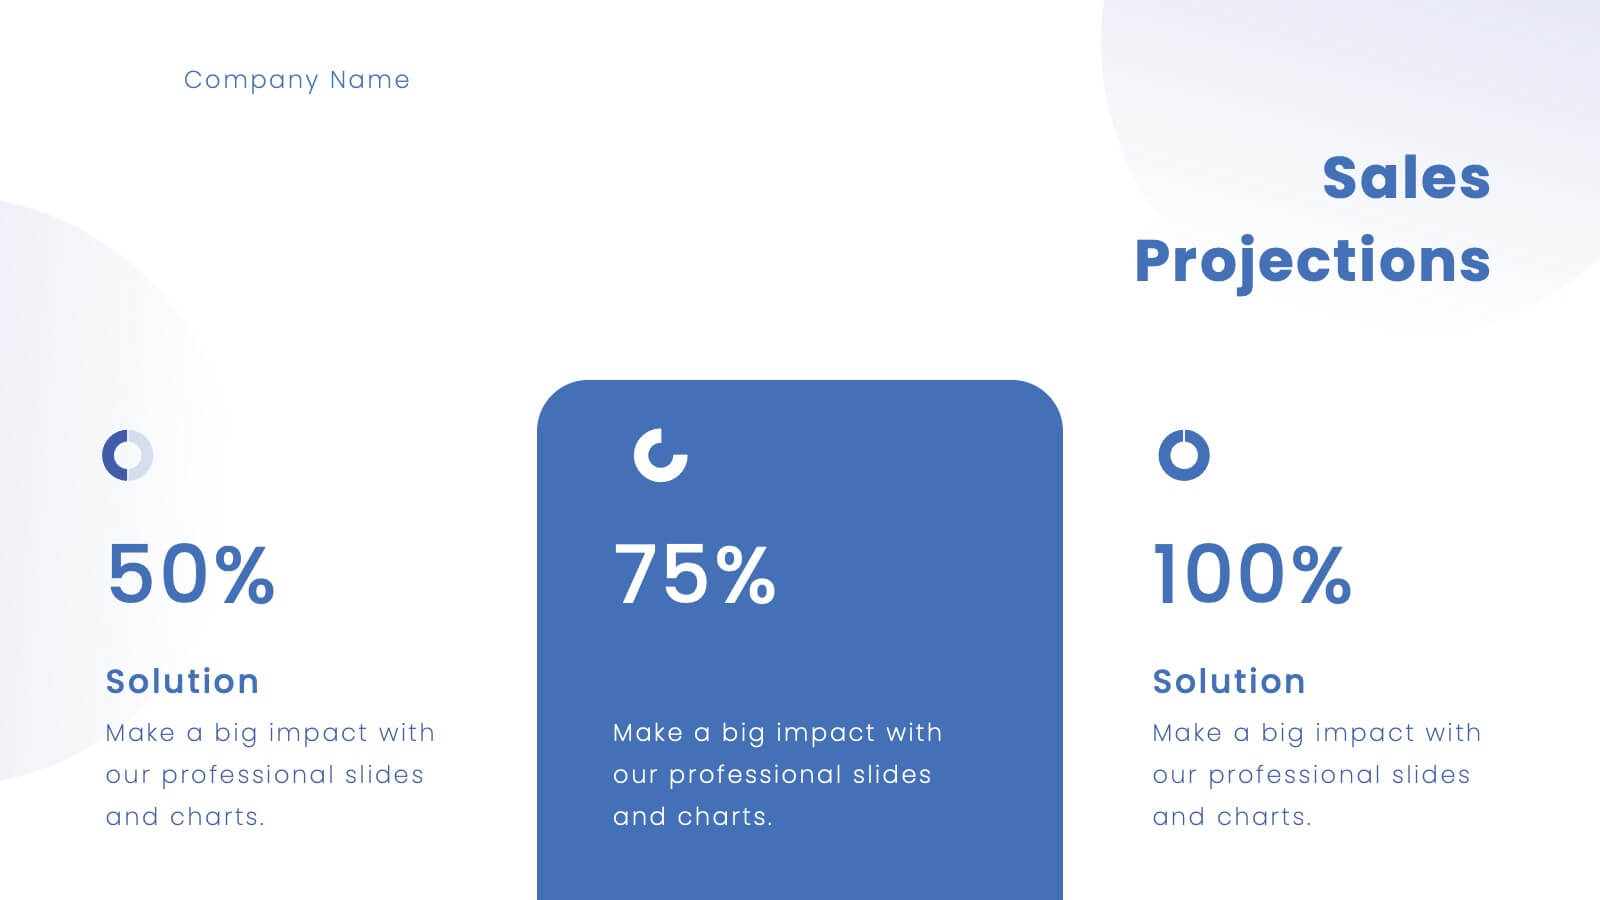
Platinum Business Idea Pitch Deck Presentation
Present your business idea with this sleek and professional pitch deck template! It includes everything from market opportunities to financial projections and sales strategies, providing a comprehensive structure for your pitch. Fully customizable and compatible with PowerPoint, Keynote, and Google Slides, this template is ideal for impressing investors and stakeholders.


8 diapositivas
End-to-End Supply Chain Optimization
Enhance your supply chain efficiency with this dynamic circular diagram slide. Ideal for logistics experts, supply chain strategists, and consultants, this template visually captures the continuous flow of an 8-step supply chain cycle. Each step is customizable with editable icons and text in PowerPoint, Keynote, and Google Slides.


6 diapositivas
Circular Motion Business Wheel Diagram Presentation
Showcase continuous processes or interconnected strategies with the Circular Motion Business Wheel Diagram Presentation. This visually engaging template features a six-part circular layout, ideal for illustrating business cycles, project workflows, or recurring tasks. Each segment includes customizable titles, icons, and content areas to support clarity and impact. Fully compatible with PowerPoint, Keynote, and Google Slides.


6 diapositivas
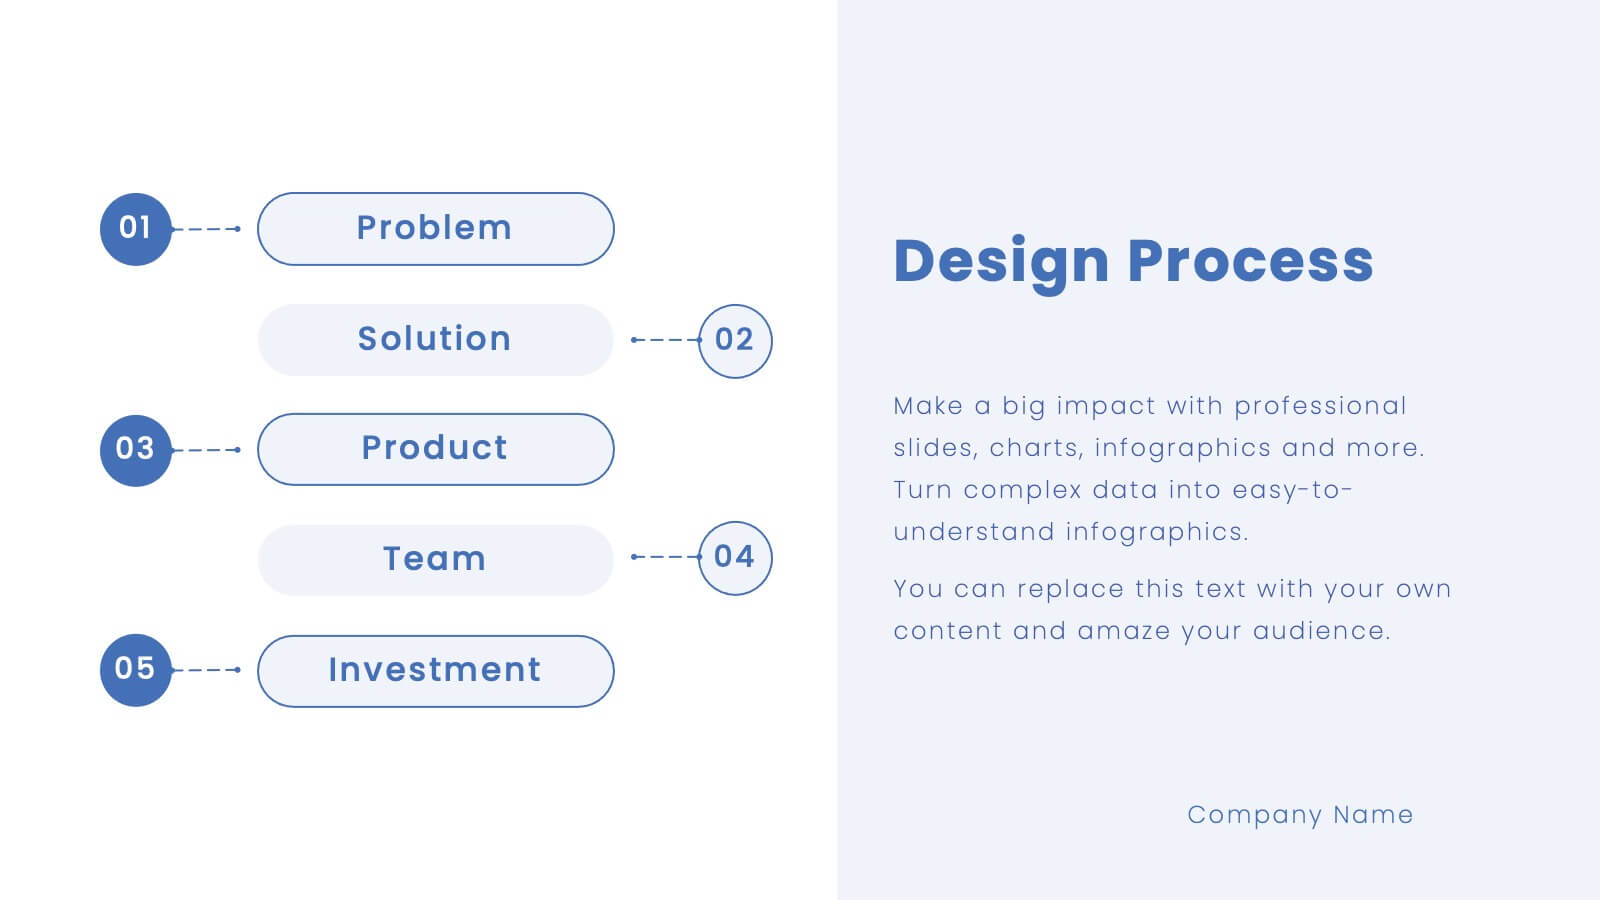
5-Stage Workflow Presentation
Turn complex processes into clear, visual stories with this structured step-by-step layout. Ideal for showcasing project stages, workflows, or development phases, it guides your audience through each milestone with precision and flow. Fully editable and compatible with PowerPoint, Keynote, and Google Slides for easy customization and professional results.


5 diapositivas
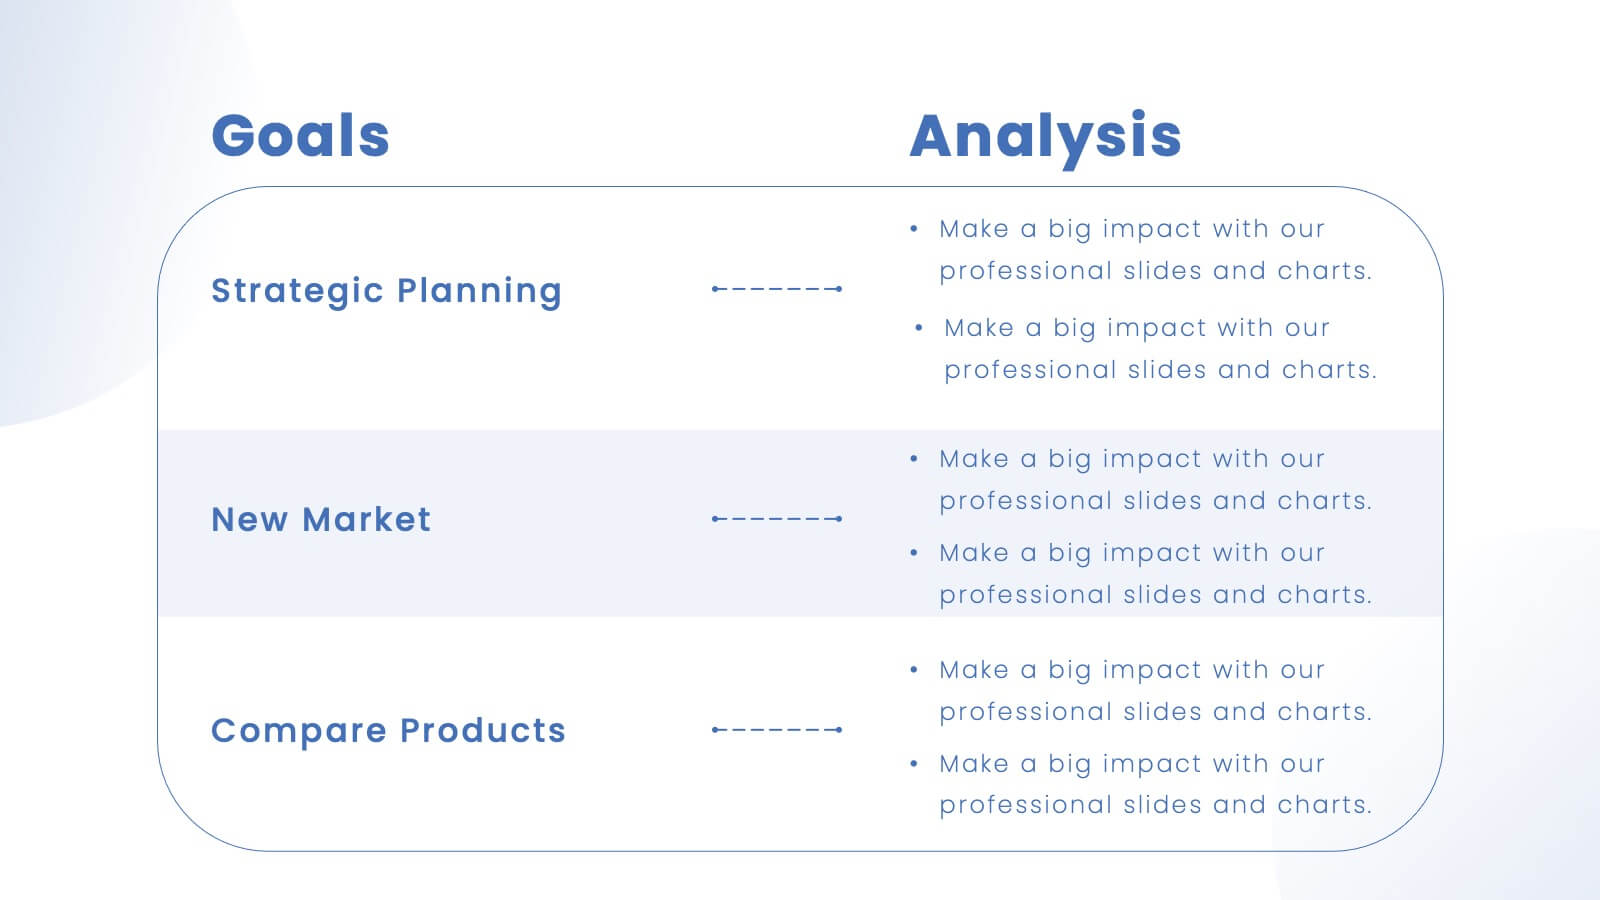
Business Objectives and Strategic Goals Presentation
Clarify your roadmap to success with this visually structured Business Objectives and Strategic Goals slide. Featuring five segmented goal icons arranged in a semi-circle layout, this template is perfect for strategic planning, quarterly reports, and team briefings. Each section allows space to detail your specific objectives with matching visuals for easy comprehension. Fully editable in PowerPoint, Keynote, and Google Slides.


26 diapositivas
Rob Presentation Template
The Rob template is a presentation with an elegant and clean look. This template uses mostly a white and black color scheme, with the background image being a marble design to give a more sophisticated look. The presentation uses a lot of images to communicate. This template has slides dedicated to displaying photograph this is a great presentation to use if you have photos that you want to make a statement. It offers a bold design that is visually pleasing to the audience and encourages them to pay close attention. The template includes all the components needed for a successful presentation.


3 diapositivas
Project Summary Data Report Presentation
Track and visualize project progress with the Project Summary Data Report template. This slide includes structured sections for project names, financial data, team size, duration, and task completion rates, making it ideal for business reviews and team meetings. Fully customizable and compatible with PowerPoint, Keynote, and Google Slides.


6 diapositivas
6-Step Circular Process Diagram Presentation
Bring your workflow to life with a clean circular layout that makes every phase feel connected and easy to follow. This presentation breaks complex processes into six intuitive steps, ideal for strategy, planning, or operations. Fully compatible with PowerPoint, Keynote, and Google Slides.


5 diapositivas
Investment and Wealth Planning Presentation
Visualize your financial strategy with this creative piggy bank diagram layout. Each quadrant highlights a different element of your investment plan—from savings and risk management to asset growth and long-term wealth goals. Perfect for financial advisors, business consultants, or educators. Fully editable in PowerPoint, Keynote, and Google Slides for easy customization


7 diapositivas
Company Title Infographic
This collection of slides is designed to vividly present company profiles and services, utilizing a dynamic color palette of blue, yellow, and white to create an engaging viewer experience. Each slide is meticulously crafted to cater to specific content, enhancing the presentation's overall effectiveness and appeal. Starting with the "Empathy Map" slide, it offers a detailed insight into customer perceptions and experiences, essential for tailoring services to meet client needs. The "SEO Report" slide focuses on showcasing quantifiable data, critical for evaluating marketing success. A dedicated "Portfolio" slide highlights past achievements, pivotal for attracting potential clients and investors by demonstrating proven capability and success. Further slides like "What We Do" and "Objectives" provide clear, straightforward layouts that detail the company’s primary activities and strategic goals, respectively. The "Projects" slide offers a glimpse into current and prospective projects, illustrating ongoing development and future aspirations. Ideal for stakeholder briefings, marketing pitches, or internal reviews, these templates support companies in communicating a cohesive and comprehensive narrative of their operational scope and strategic direction.


3 diapositivas
Professional Introduction Slide
Introduce team members with clarity and style using this profile-focused slide. Designed to highlight key stats, roles, and responsibilities, it’s perfect for internal presentations, onboarding, or proposals. Easily customizable in PowerPoint, Keynote, and Google Slides.


5 diapositivas
Hierarchical Structure in Triangle Format Presentation
Clearly illustrate levels of authority or stages of growth with the Hierarchical Structure in Triangle Format Presentation. This layout features a visually stacked triangle with color-coded segments, each layer representing a tier or level of information. Ideal for organizational charts, value pyramids, or priority structures. Each section includes a title, icon, and description area to keep your message clear and impactful. Fully editable in PowerPoint, Keynote, and Google Slides.


15 diapositivas
Business Infographic Presentation Template
A business is an organization engaged in commercial, industrial, or professional activities. A Business Infographic is a visual representation of information related to business topics like marketing, sales, finance, project management, customer service, and more. Using the graphics, charts, icons, and other design elements provided, create the best presentation. These infographics are usually used to help explain business concepts, show trends and results, and communicate information to employees, stakeholders, customers, and for students. Use this for presentations, reports and websites!


7 diapositivas
Food Infographic Presentation Template
A Food Infographic is a visual representation of information and data related to food. It can be used to educate people on various aspects of food such as its nutritional value, cooking methods, and recipes. This template can be presented in a variety of ways, including charts, graphs, illustrations, and images you can customize with your information. The goal of this Food Infographic is to make complex information about food more accessible and easy to understand for the general public. This template works with Powerpoint, Keynote, and Google Slides, so you can use it on any device.


7 diapositivas
Customer Success Journey Infographic
A customer journey infographic is a visual representation of your customer's experience with your company. It can help you gain insight into where they're struggling and how they feel about your product or service. This infographic template will help you understand the top factors that influence your customers' decisions, including the most common problems they face. With this template you'll also learn how their behaviors change over time—and how to structure marketing campaigns that stay with them throughout their journey. Fully customizable and compatible with Powerpoint, Keynote, and Google Slides.


5 diapositivas
Employee Training Roadmap Presentation
Take your team on a visual journey that maps out success, one milestone at a time. This roadmap presentation is perfect for outlining employee training stages in a clear, engaging way. Each point leads naturally to the next. Fully editable and compatible with PowerPoint, Keynote, and Google Slides for seamless use.