


Características


¿Tienes alguna pregunta?
Recomendar


6 diapositivas
Business Benefits Highlights Presentation
Bring your business advantages to life with a vibrant, structured layout that captures attention instantly. This professional design helps you showcase key strengths, achievements, or milestones with clarity and impact. Ideal for company overviews or reports, it’s fully compatible with PowerPoint, Keynote, and Google Slides for easy customization and presentation.


7 diapositivas
Work From Home Online Infographic
Work from home online refers to a work arrangement where individuals can perform their job responsibilities remotely, usually from their homes, using internet-connected devices like computers, laptops, tablets, or smartphones. Unveil the modern realm of remote work with our work from home online infographic. This visually engaging and informative template takes you on a journey through the digital landscape of remote work, showcasing its advantages, best practices, and the tools that enable seamless virtual collaboration. This infographic isn't just a visual guide it's a roadmap to thrive in the evolving world of work.


5 diapositivas
Operational Planning in 5 Key Steps Presentation
Present your operational roadmap with this dynamic 5-step arrow diagram. Each line represents a strategic input streamlined toward a unified goal. Ideal for workflows, business processes, or implementation plans. Fully editable in PowerPoint, Keynote, and Google Slides—perfect for team planning, operations meetings, and project execution strategies.


4 diapositivas
3-Level Tree Chart Presentation
Grow your ideas from concept to execution with this beautifully designed visual layout. Perfect for showcasing layered strategies, hierarchical processes, or business development stages, it balances clarity and creativity through a clean, tree-inspired design. Fully editable and compatible with PowerPoint, Keynote, and Google Slides for seamless professional use.


21 diapositivas
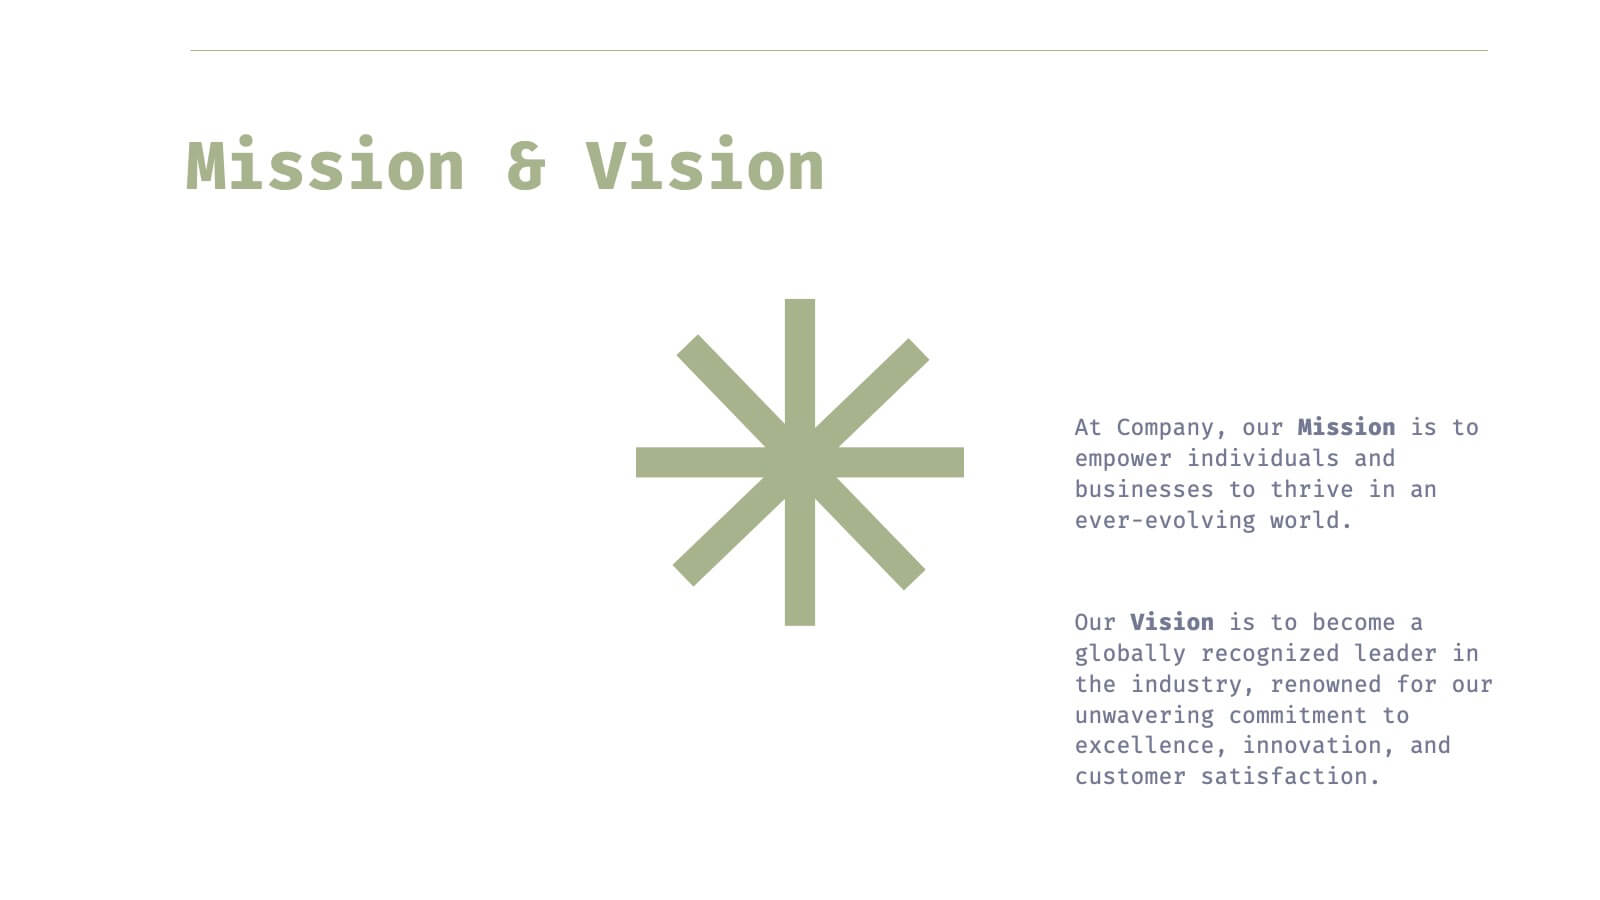
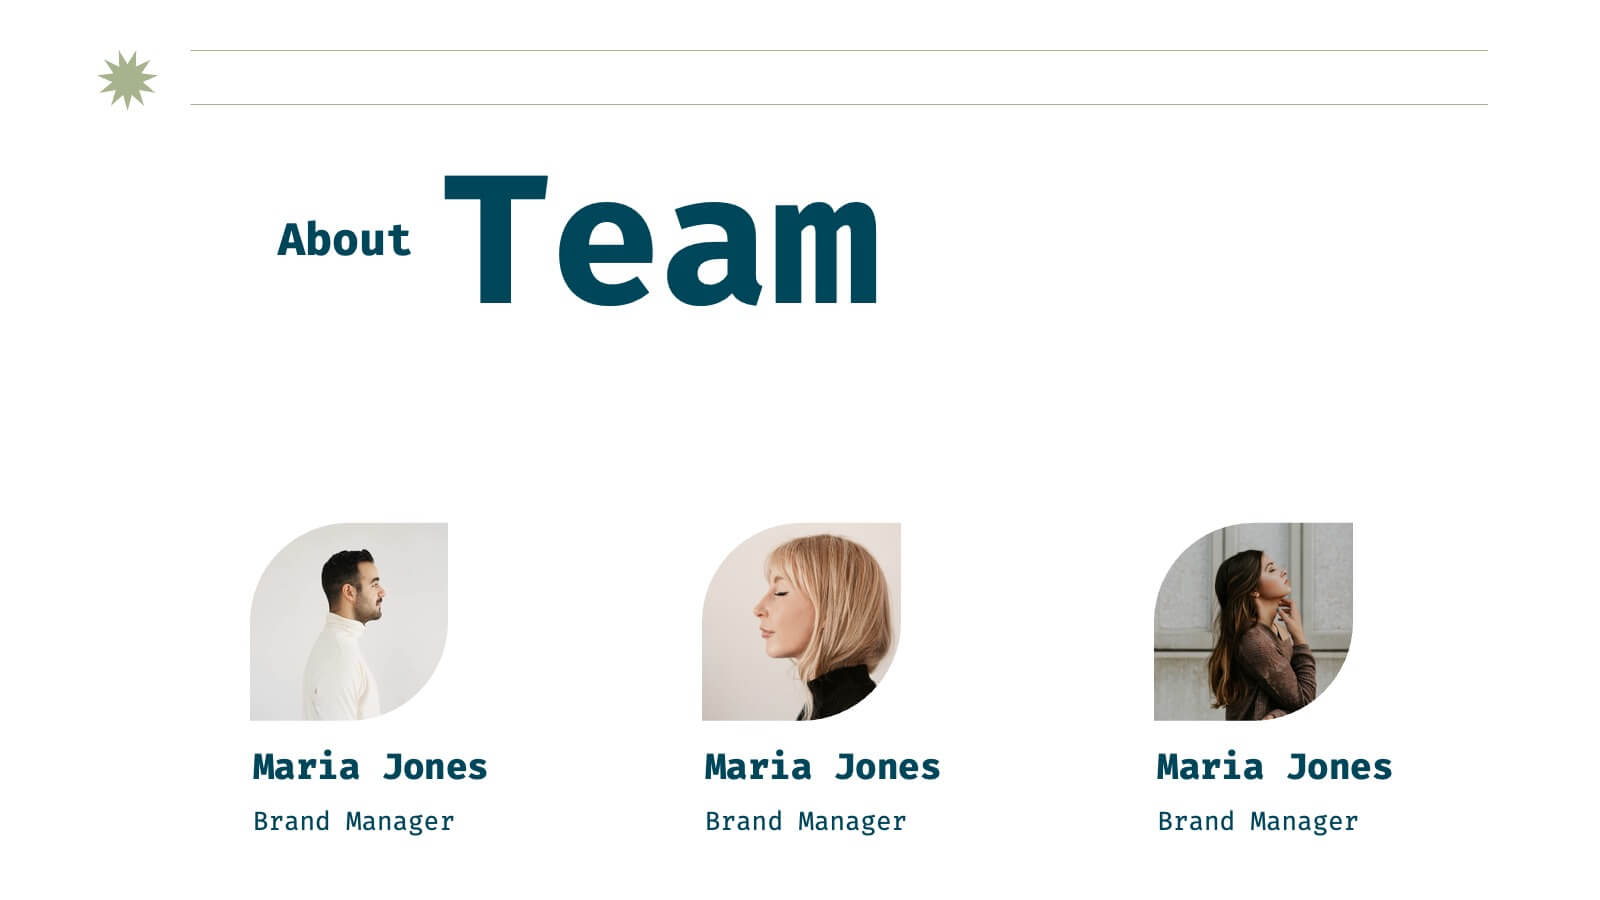
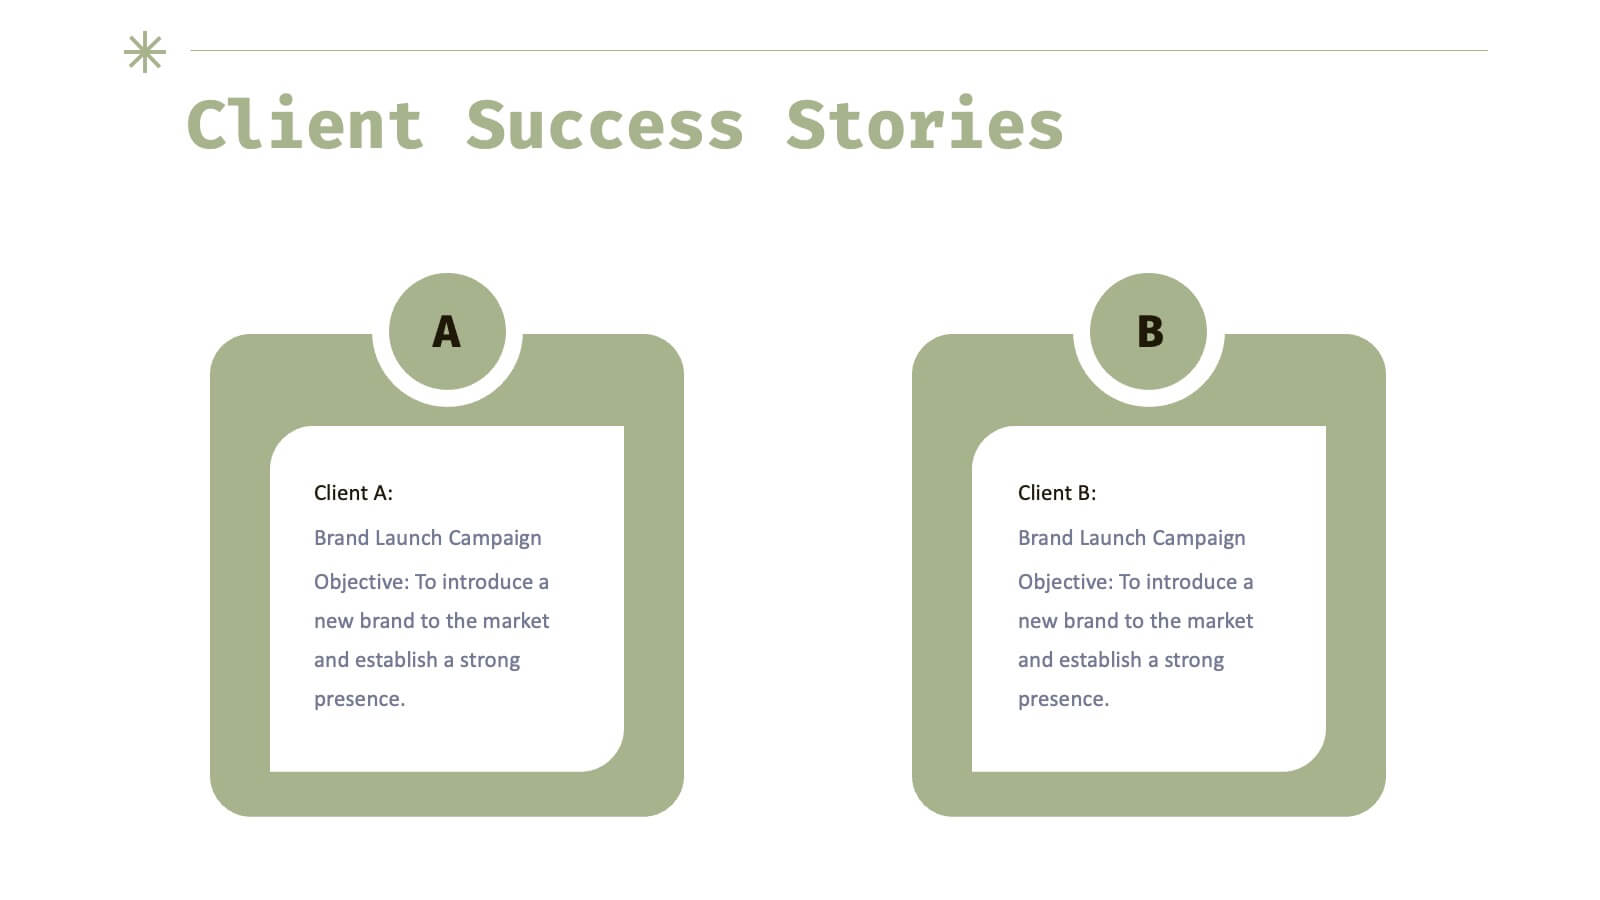
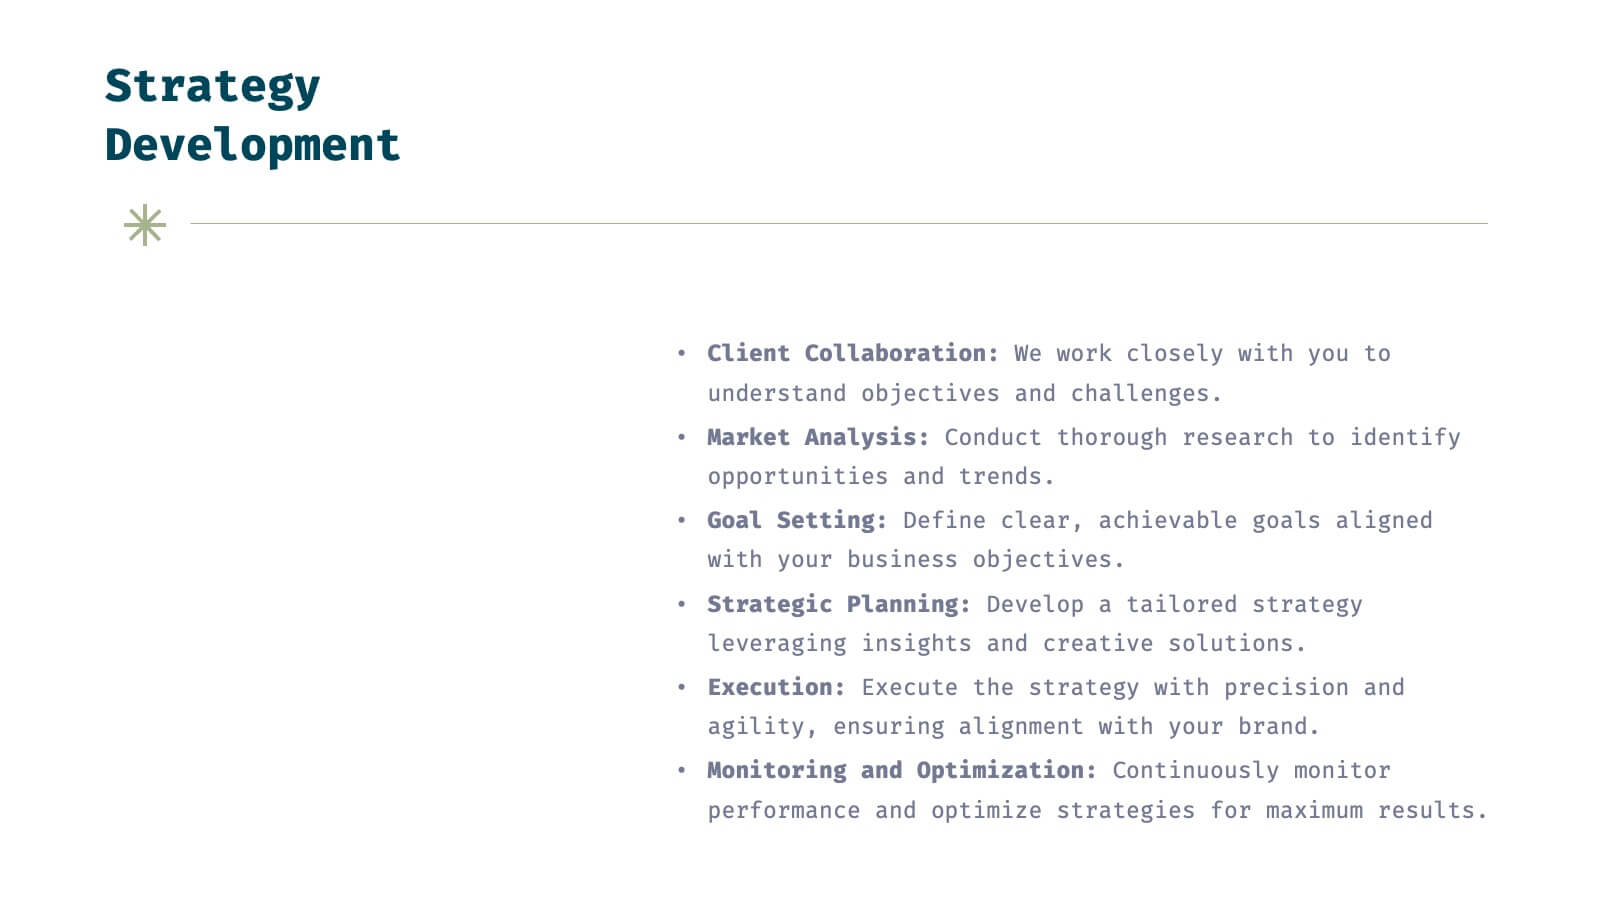
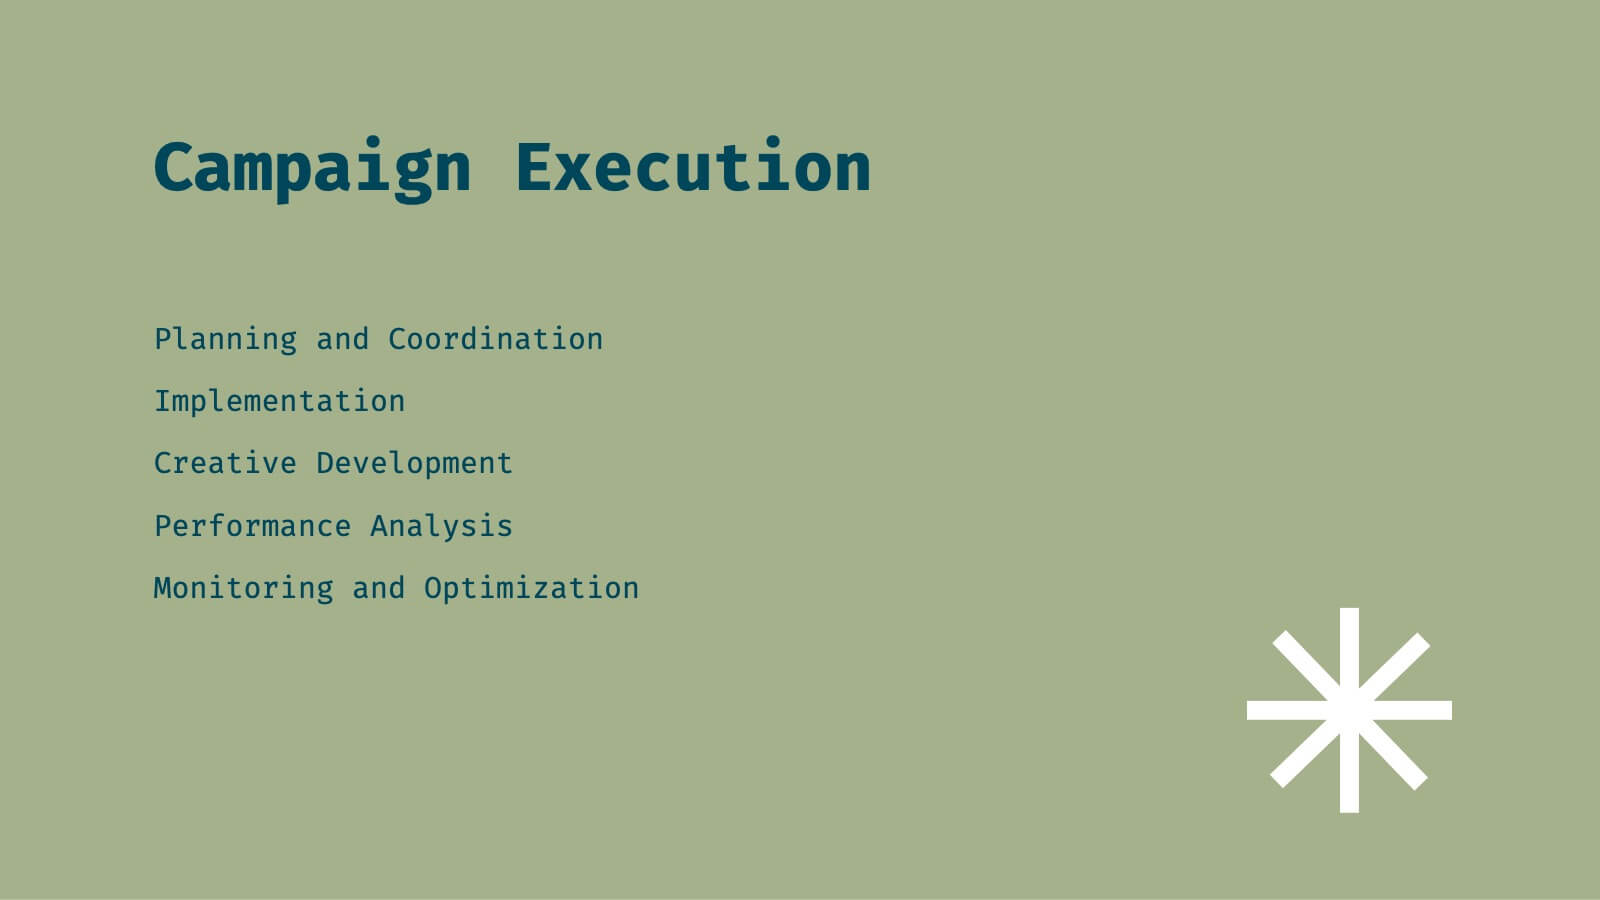
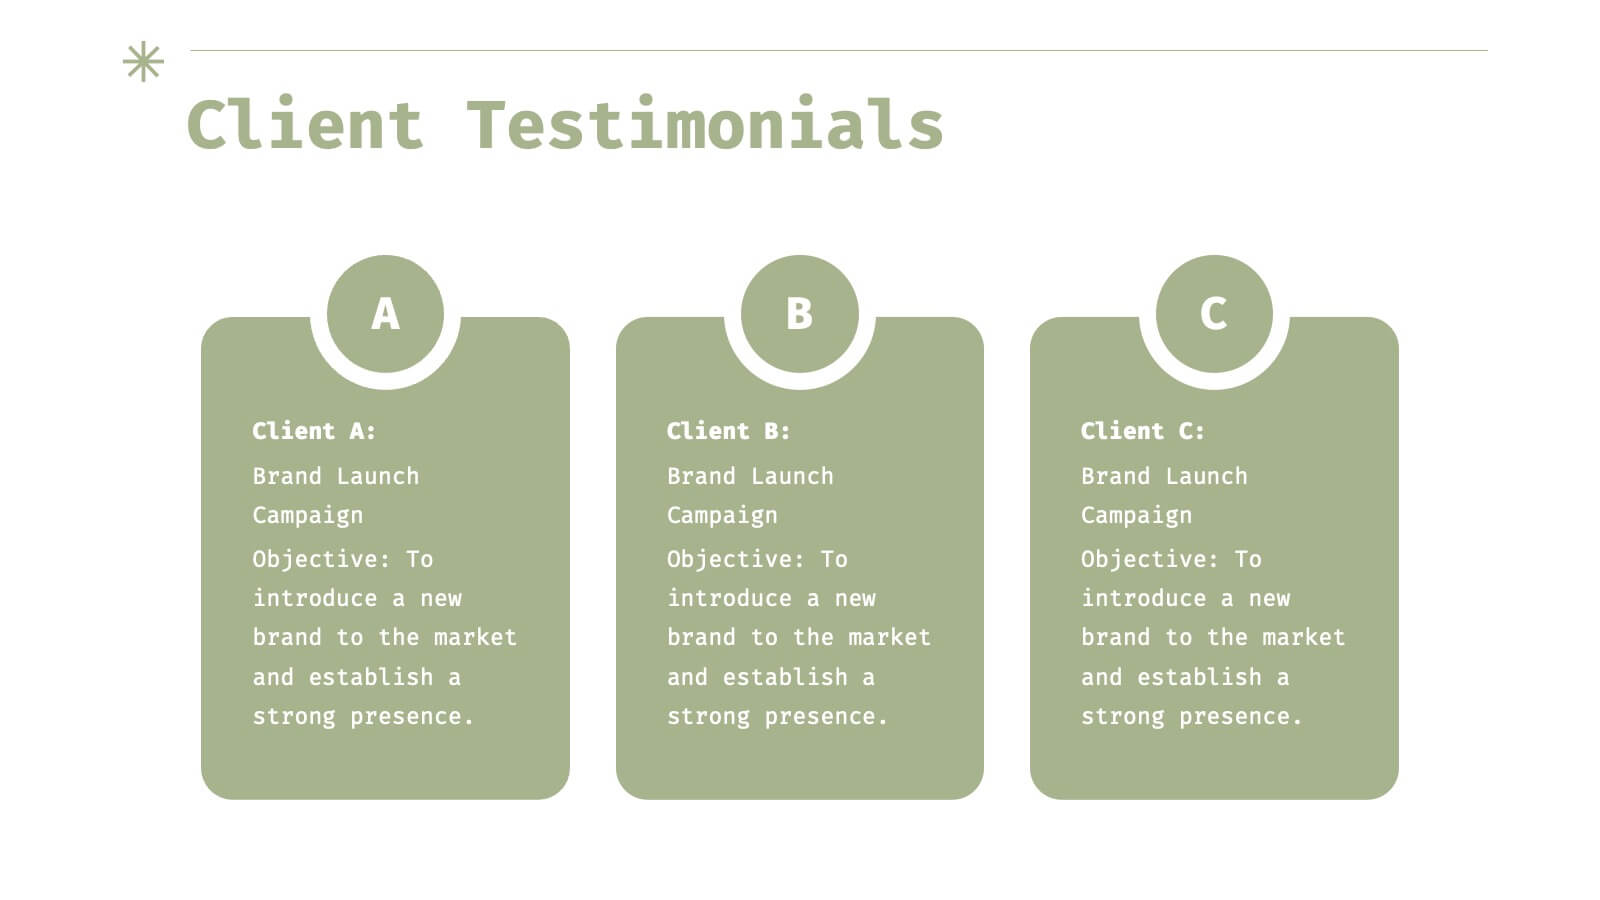
Helix Full-Service Agency Project Plan Presentation
Showcase your agency's expertise with this sophisticated, minimalistic presentation template. Designed to present comprehensive market analysis, strategy development, and client success stories, this template ensures your agency's capabilities are clearly communicated. Its clean design and professional layout make it perfect for building trust and credibility. Compatible with PowerPoint, Keynote, and Google Slides, it's versatile for any platform.


5 diapositivas
Marijuana Industry Infographics
The Marijuana Industry refers to the cultivation, production, distribution, and sale of marijuana or cannabis-related products. These vertical infographics are designed to provide an overview of the marijuana industry. They offer a comprehensive look at the various aspects of the industry, including its history, growth, legalization, medical and recreational uses, and more. Inform and educate your viewers about the various aspects of the marijuana industry. Present data, trends, and insights related to the industry. This template is an effective tool for presenting key information about the marijuana industry in a visually engaging manner.


7 diapositivas
Target Audience Demographics Slide Presentation
Capture attention with a clean, data-driven layout that makes understanding your audience quick and intuitive. This presentation helps you showcase key demographic insights, highlight behavioral patterns, and communicate strategic findings with clarity. Designed for easy editing and smooth workflow, it’s fully compatible with PowerPoint, Keynote, and Google Slides.


7 diapositivas
Psychology Infographic Presentation Template
Featuring our psychology infographic template made to provide you with a beautiful presentation that includes all the necessary elements for learning about psychology. Present your research and analysis in a clear, informative and engaging way with this template. Use the theme to highlight the most important concepts in psychology and explain each one with interesting facts, statistics and charts. Use this template to show information about the main topics or areas of psychology. This template is compatible with powerpoint and fully customizable to meet all your requirements!


5 diapositivas
Side-by-Side Features Comparison Presentation
Clearly compare product or service features with the Side-by-Side Feature Comparison Presentation. This layout is perfect for showcasing pros and cons, plan differences, or feature breakdowns across two options. With a clean visual structure and customizable labels, it's ideal for decision-making slides. Compatible with Canva, PowerPoint, Keynote, and Google Slides.


12 diapositivas
Market Analysis PESTEL Presentation
The "Market Analysis PESTEL" presentation efficiently segments essential factors that affect market trends into six categories: Political, Economic, Social, Technological, Environmental, and Legal. Each category is visually represented with a distinct color, allowing easy identification and organization of related data. The layout provides clear placeholders for inserting detailed information, making it a practical tool for presenting comprehensive market analyses. This visual framework supports strategic decision-making by highlighting external factors that might impact business environments.


6 diapositivas
Asia Map Population Infographic
Explore the demographic dynamics of Asia with our collection of infographic slides, designed to illustrate the population statistics across the continent. These templates are an essential tool for educators, demographers, and business analysts, providing detailed visualizations of population distribution, density, and growth trends. Each infographic combines the map of Asia with engaging graphical elements such as bar graphs, pie charts, and statistical callouts that emphasize key data points like total population, urban versus rural distribution, and demographic forecasts. The color-coding and spatial arrangements on the map effectively highlight variations and trends across different countries and regions, making complex data easy to understand and visually compelling. Fully customizable, these templates allow you to adjust the data presentation to suit specific needs or focuses, such as comparing population growth rates or highlighting demographic challenges. Whether used in presentations, reports, or educational materials, these slides offer a comprehensive and accessible way to communicate the demographic landscape of Asia.


7 diapositivas
Timeline Schedule Infographics
A Timeline Schedule is an effective way to communicate complex schedules or timelines. It's a constructive tool for coordinating work and managing projects. This template can help you build a timeline, show the overview and present your value proposition. This timeline Infographic can be used for any business, personal, or academic project. This is a fully editable template so you can change the color, size and everything as per your needs. The timeline charts have been designed with various categories and time range pattern through which you can plan your projects in an effective way!


6 diapositivas
Shopping Pricing Tables Infographic
Pricing tables are visual tools commonly used on websites, product pages, and marketing materials to showcase different pricing options for products or services. This infographic template displays different pricing plans or packages offered by a business or service provider. This provides a clear comparison of features, benefits, and costs, helping viewers make informed decisions about which option best suits their needs and budget. This infographic is designed to help customers quickly compare features, costs, and benefits of each plan, aiding in their decision-making process. Compatible with Powerpoint, Keynote, and Google Slides.


6 diapositivas
Change Management Model Infographics
Navigate organizational change effectively with our Change Management Model infographic template. This template is fully compatible with popular presentation software like PowerPoint, Keynote, and Google Slides, allowing you to easily customize it to illustrate and communicate the key components of a change management model. The Change Management Model infographic template offers a visually engaging platform to outline the stages, strategies, and best practices for managing change within an organization. Whether you're a change management professional, business leader, or team member involved in change initiatives, this template provides a user-friendly canvas to create informative presentations and educational materials. Optimize your change management processes with this SEO-optimized Change Management Model infographic template, thoughtfully designed for clarity and ease of use. Customize it to showcase the change model you're using, steps involved, communication strategies, and the importance of addressing resistance to change. Ensure that your audience gains valuable insights into effective change management. Start crafting your personalized infographic today to navigate change with confidence.


8 diapositivas
Team Performance and Sports Analysis Presentation
Highlight team rankings and sports metrics with the Team Performance and Sports Analysis template. Featuring a dynamic race track-inspired layout with numbered positions, icons, and vivid color coding, it’s ideal for comparing performance. Fully customizable in Canva, PowerPoint, and Google Slides to match your sport, brand colors, and presentation goals.


6 diapositivas
Home Security Infographics
Enhance your home security awareness with our Home Security infographic template. This template is fully compatible with popular presentation software like PowerPoint, Keynote, and Google Slides, allowing you to easily customize it to illustrate and communicate various aspects of home security measures and best practices. The Home Security infographic template offers a visually engaging platform to outline home security strategies, including alarm systems, surveillance, access control, and safety tips. Whether you're a homeowner, security professional, or simply interested in safeguarding your property and loved ones, this template provides a user-friendly canvas to create informative presentations and educational materials. Optimize your home security with this SEO-optimized Home Security infographic template, thoughtfully designed for clarity and ease of use. Customize it to showcase security device options, safety checklists, emergency procedures, and the importance of a secure home environment, ensuring that your audience gains valuable insights into this critical aspect of personal safety. Start crafting your personalized infographic today to bolster your home security knowledge and practices.


6 diapositivas
Social Media Analytics Infographic
Social Media Analytics refers to the process of collecting, analyzing, and interpreting data from social media platforms to gain insights into audience behavior, content performance, and overall social media effectiveness. This template showcases key concepts and insights related to social media analytics. This template is designed to help individuals and businesses understand and leverage the power of data-driven analysis to enhance their social media strategies. This template is perfect to optimize your social media presence, improve engagement, and drive meaningful results. Compatible with Powerpoint, Keynote, and Google Slides.