


Características


¿Tienes alguna pregunta?
Recomendar


5 diapositivas
Business Insight Iceberg Presentation
Visualize surface-level data and deeper insights with the Business Insight Iceberg Presentation. Perfect for showcasing organizational structure, decision-making layers, or strategy breakdowns. Each editable layer helps communicate complexity clearly and effectively. Fully compatible with PowerPoint, Keynote, and Google Slides—ideal for professionals, analysts, and educators aiming for clarity and impact.


6 diapositivas
Credit Card Comparison and Benefits Presentation
Clearly compare features, perks, and advantages of different credit card options using this visually dynamic infographic slide. With side-by-side sections, icons, and clean labeling, this layout makes it easy to present pros and cons, reward tiers, or service details. Ideal for financial services, banking presentations, or consumer education. Compatible with PowerPoint, Keynote, and Google Slides for seamless customization.


4 diapositivas
Blue Ocean Innovation Approach Presentation
The Blue Ocean Innovation Approach Presentation offers a clear and modern layout for visualizing strategic innovation. Featuring layered diamond shapes representing Cost, Value Innovation, and Buyer Value, this slide helps explain how businesses can move beyond competition by creating new market spaces. Each section includes editable titles and text boxes, ideal for outlining strategies, key concepts, or benefits. Designed for consultants, strategists, and business leaders, the template is fully customizable in PowerPoint, Keynote, and Google Slides. Perfect for presenting blue ocean thinking in a polished, professional format.


5 diapositivas
Digital Strategy and Online Campaigns Presentation
Aim for success with the Digital Strategy and Online Campaigns Presentation. This template uses a dynamic target and arrow graphic to represent strategic goals, campaign directions, and marketing focus. Ideal for showcasing KPIs, digital initiatives, and performance insights. Fully customizable in PowerPoint, Keynote, and Google Slides.


10 diapositivas
Business Growth through Target Market Analysis Presentation
Showcase how strategic insights drive expansion with this step-by-step infographic. Designed with layered growth icons and space for titles and text, this layout helps illustrate the phases of market targeting, consumer profiling, and sales development. Perfect for marketing strategies, business development roadmaps, and client presentations. Fully customizable in PowerPoint, Keynote, and Google Slides


6 diapositivas
Scrum Team Roles and Sprint Planning Presentation
Visualize your Agile workflow with this Scrum team diagram. Highlight roles, responsibilities, and key sprint planning phases in a clear, circular flow. Ideal for project managers, team leads, or Agile coaches. Fully editable in PowerPoint, Keynote, and Google Slides to support your software development or Agile training presentations.


4 diapositivas
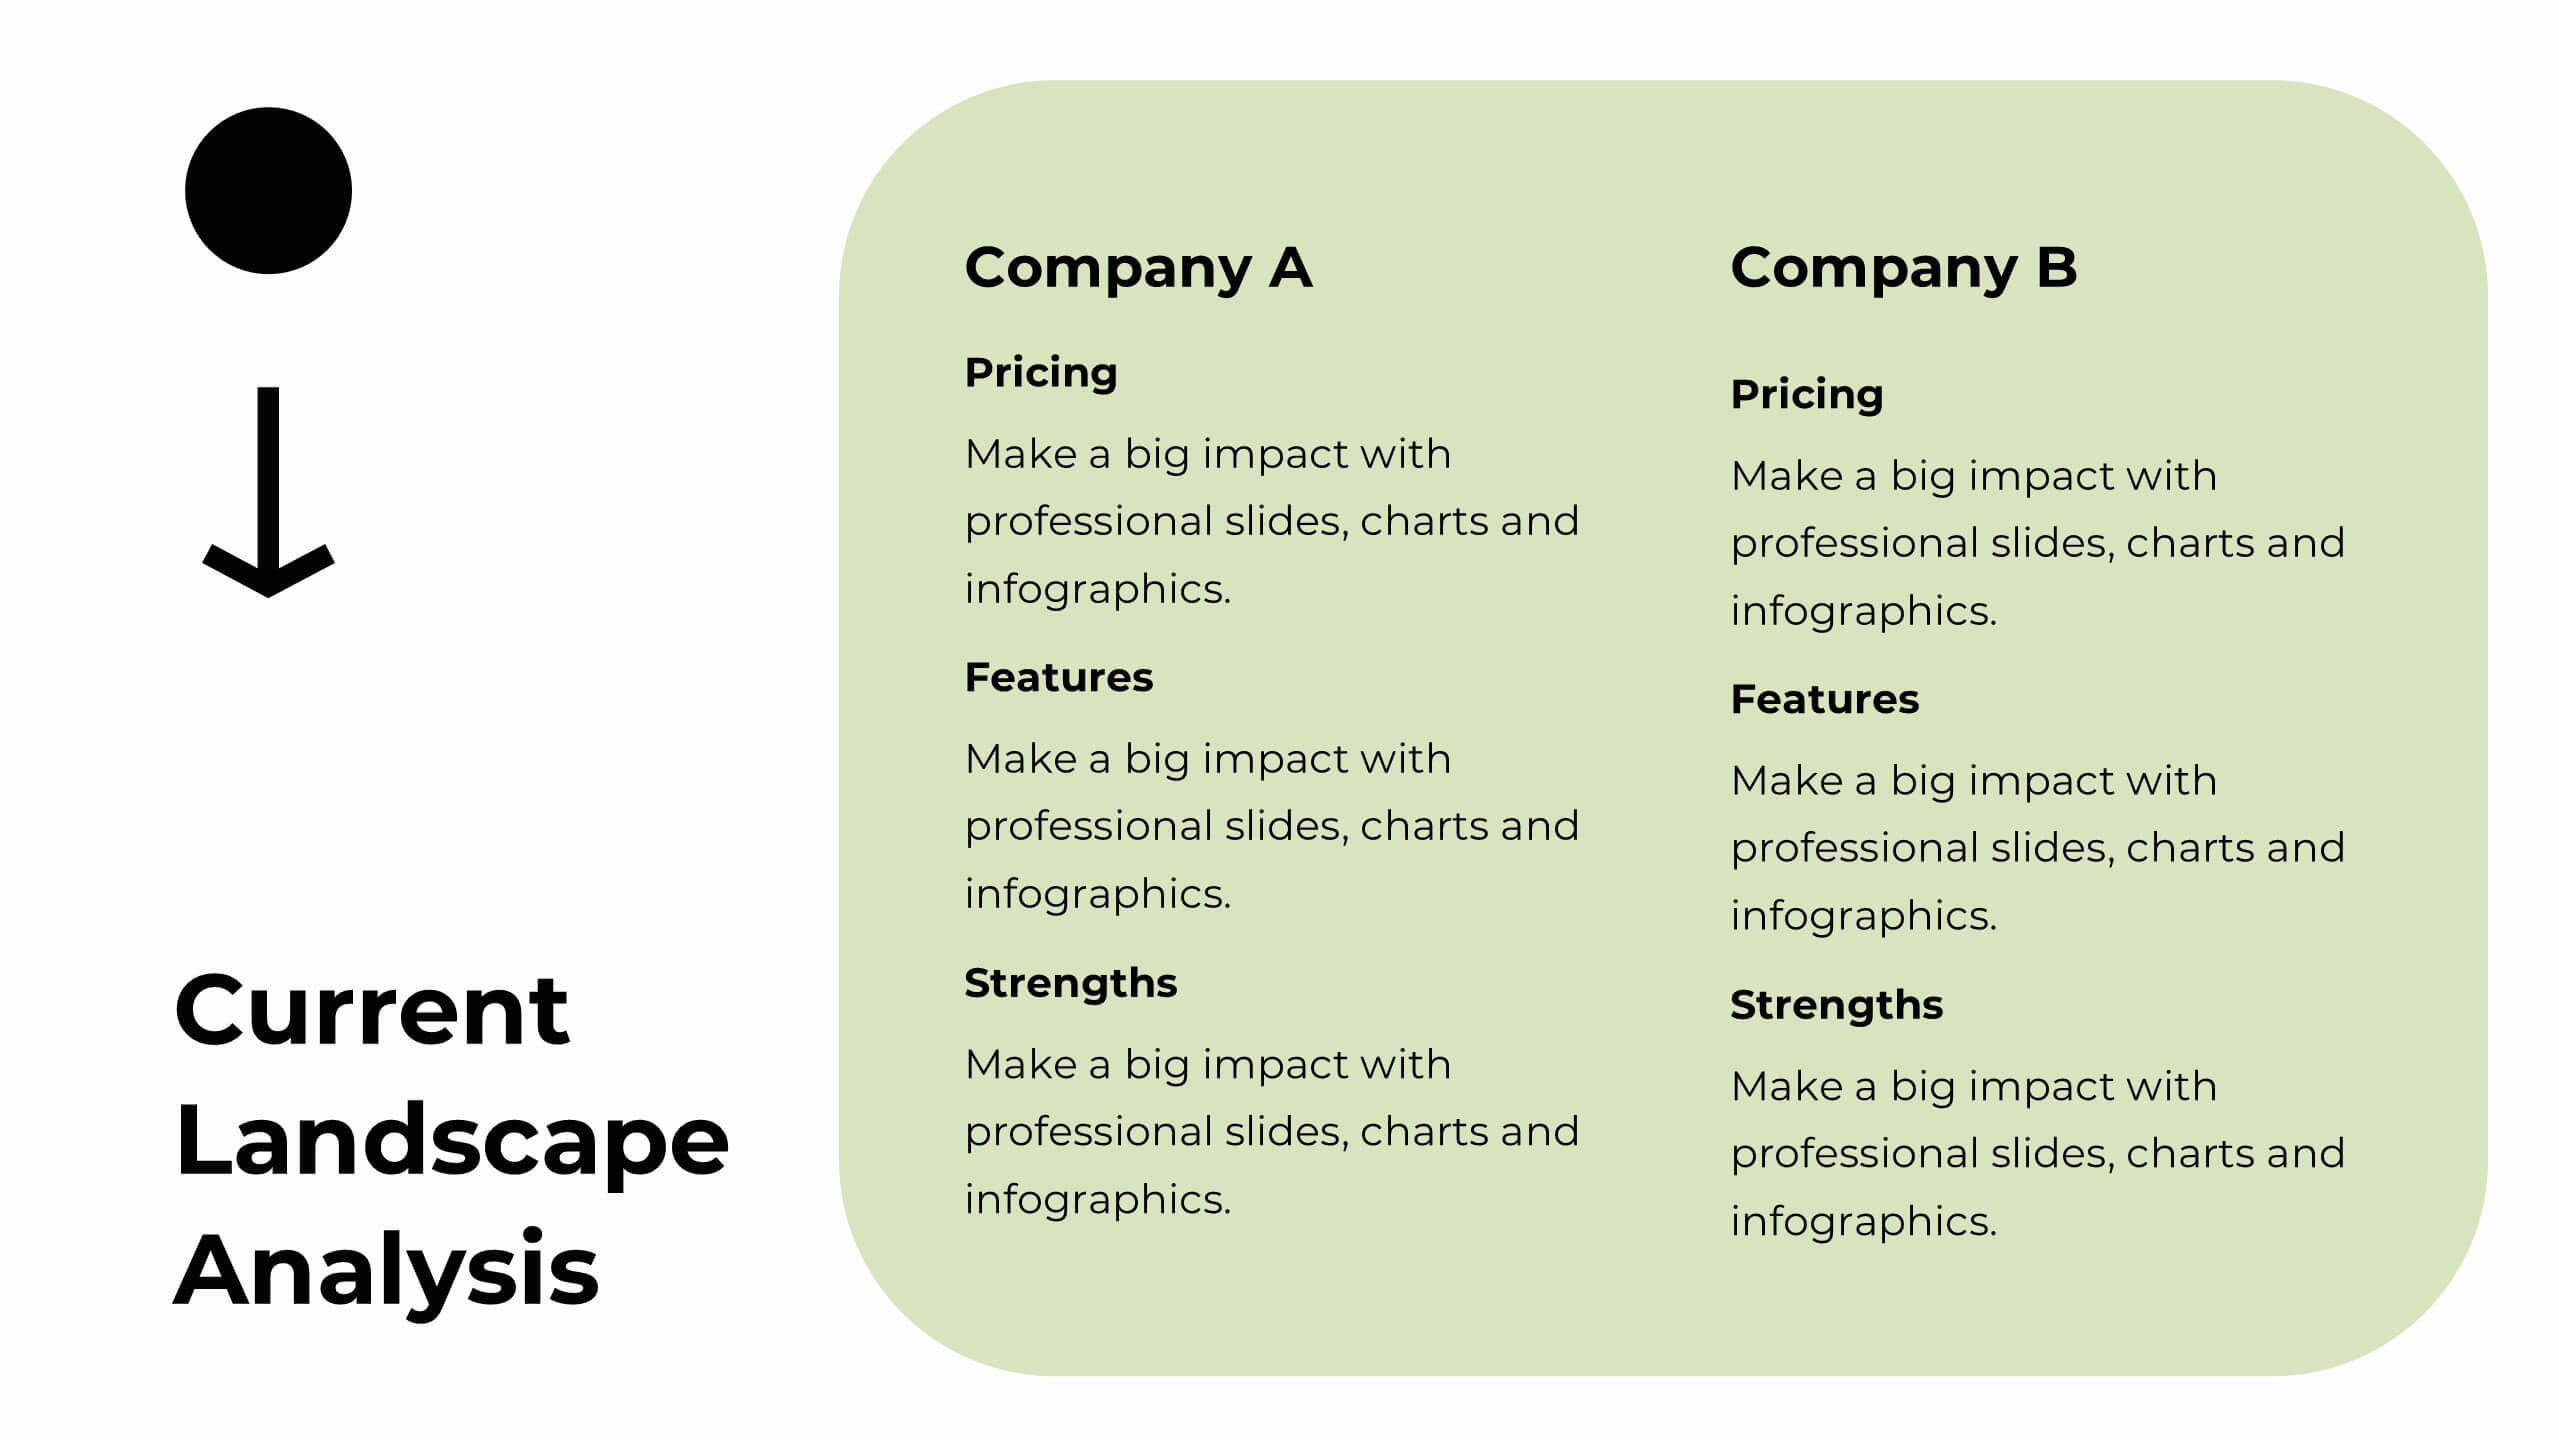
Cost Comparison Analysis Chart Presentation
Turn your price evaluations into something visually compelling with this sleek and modern layout. Perfect for showcasing product features, service packages, or market comparisons, it simplifies decision-making with a clear side-by-side design. Fully editable and compatible with PowerPoint, Keynote, and Google Slides for effortless customization.


4 diapositivas
Attention-Interest-Desire-Action Sales Strategy Presentation
Highlight each phase of your sales journey with this clean and modern AIDA model layout. Designed for clarity, it uses bold semicircle visuals and directional arrows to guide your audience from capturing attention to driving action. Perfect for sales teams, marketers, and consultants. Fully editable in PowerPoint, Keynote, and Google Slides.


22 diapositivas
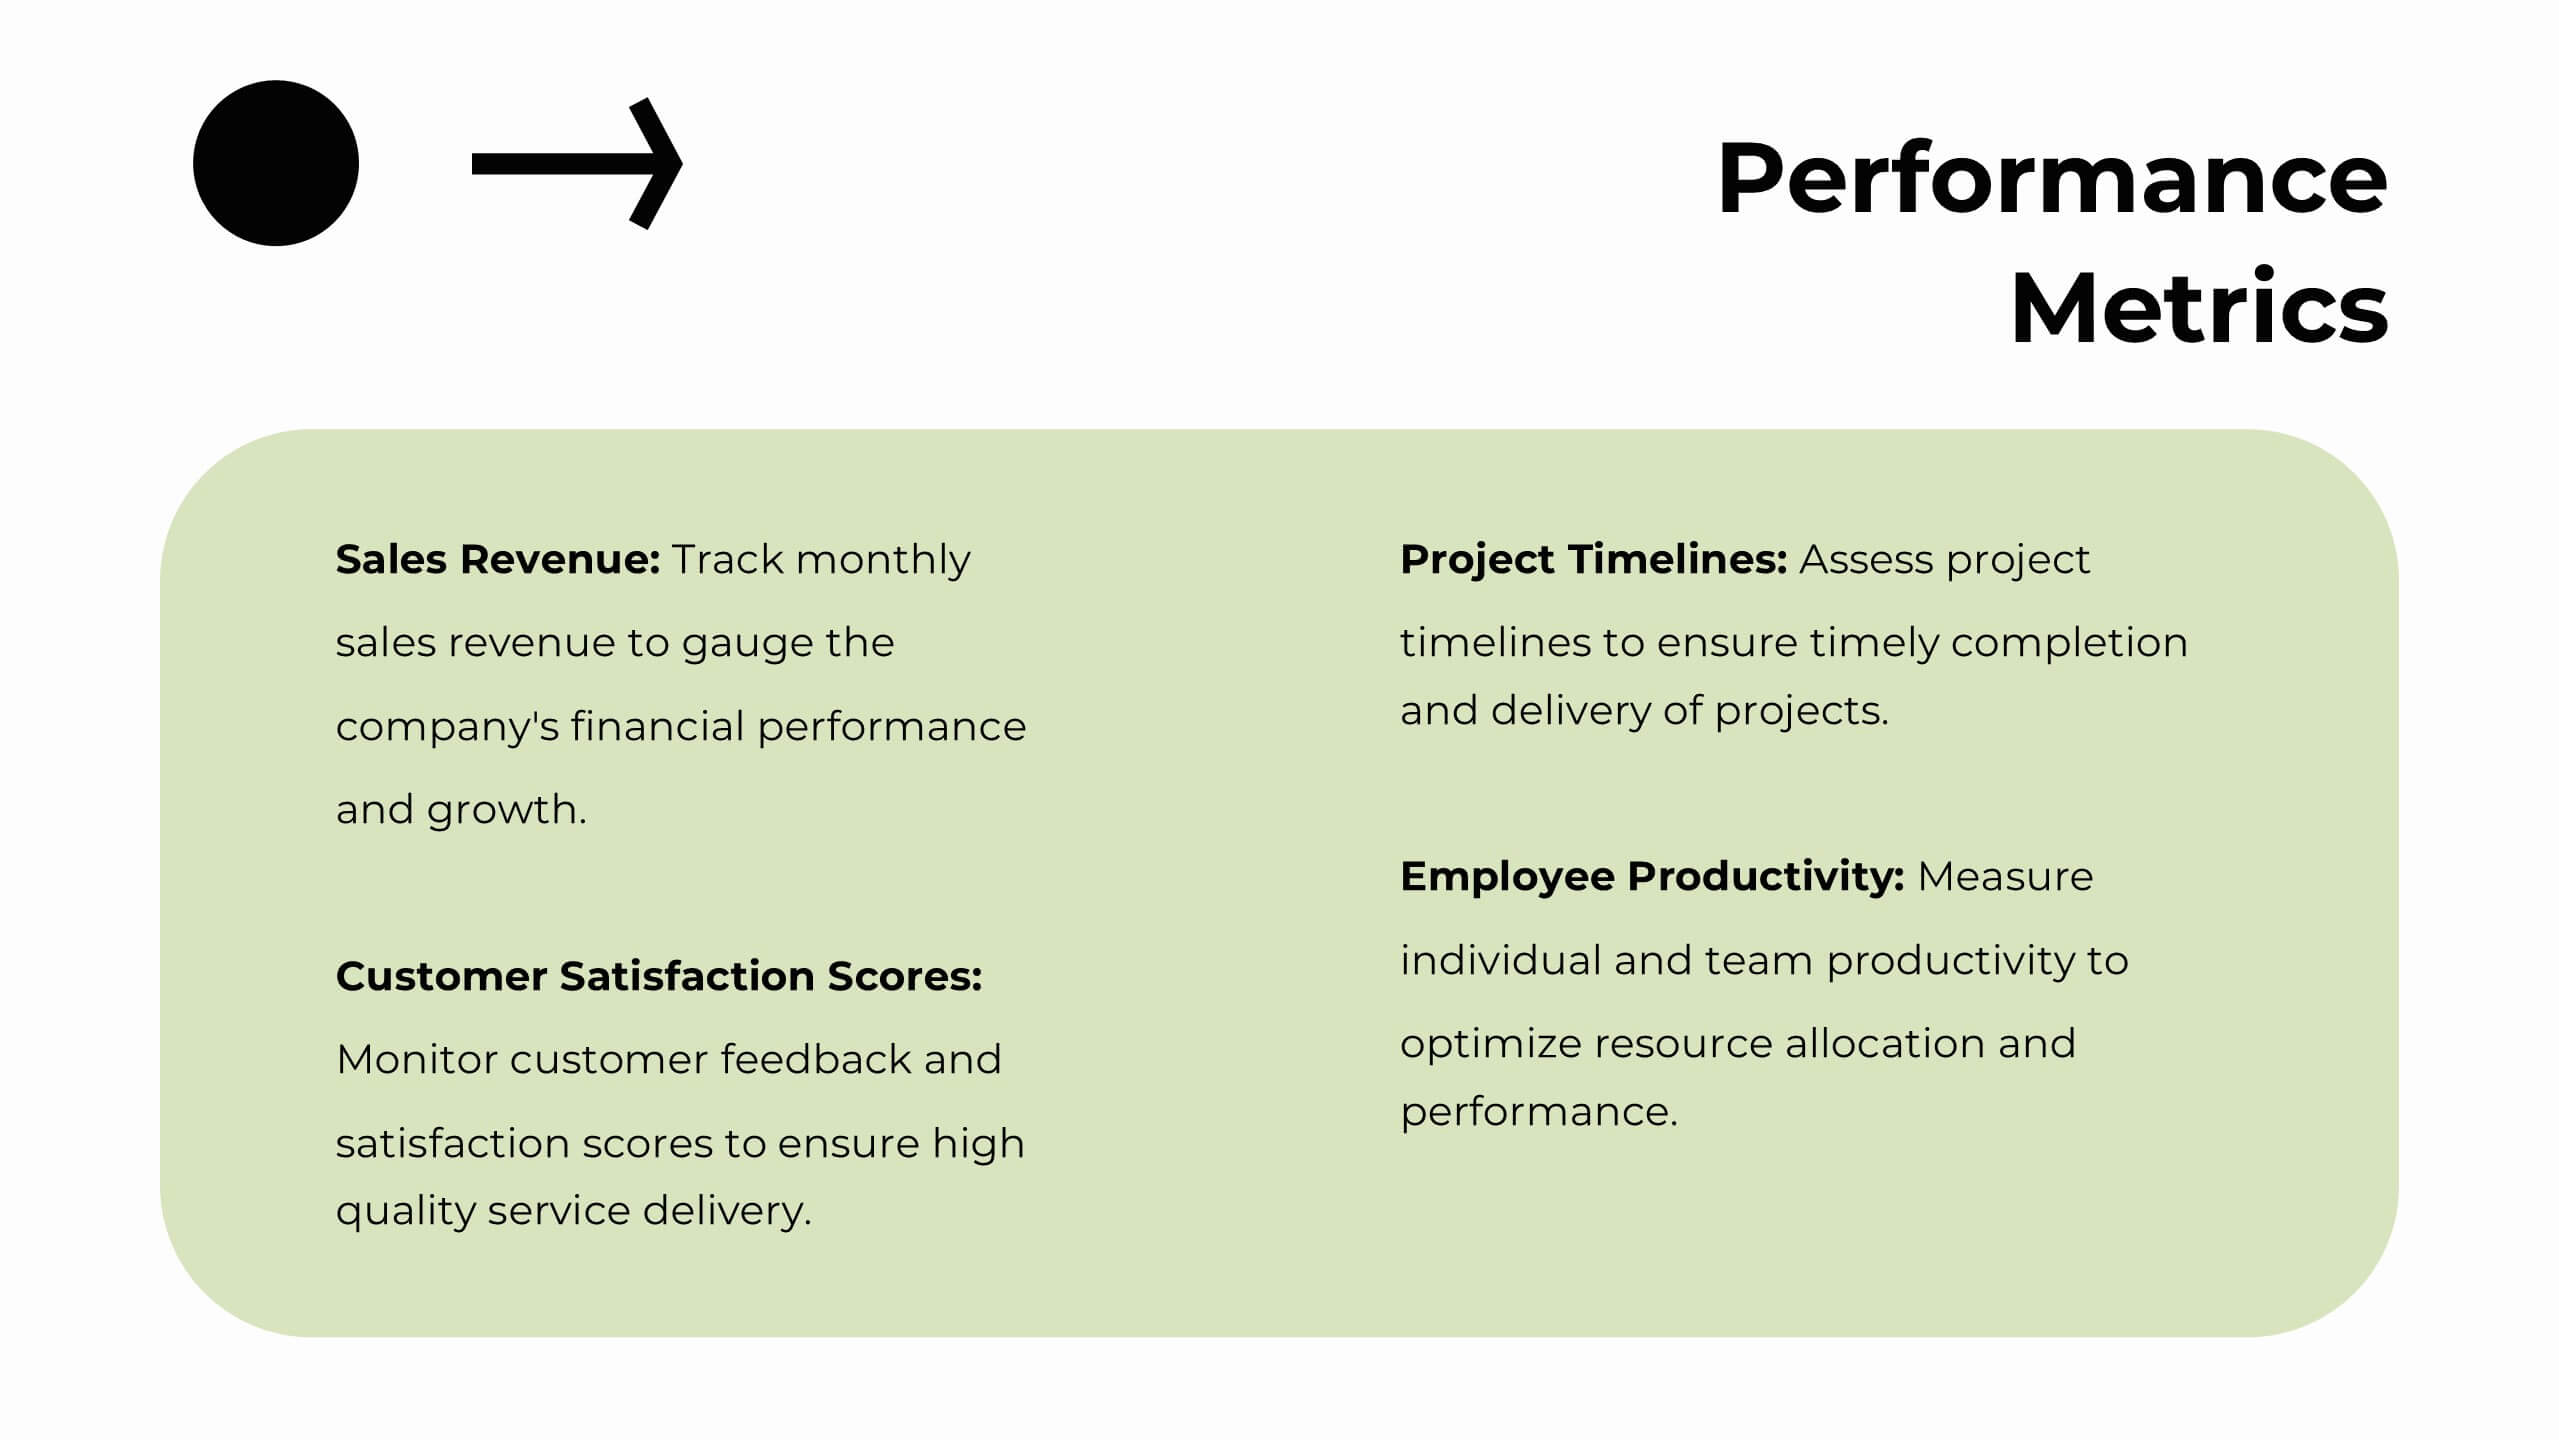
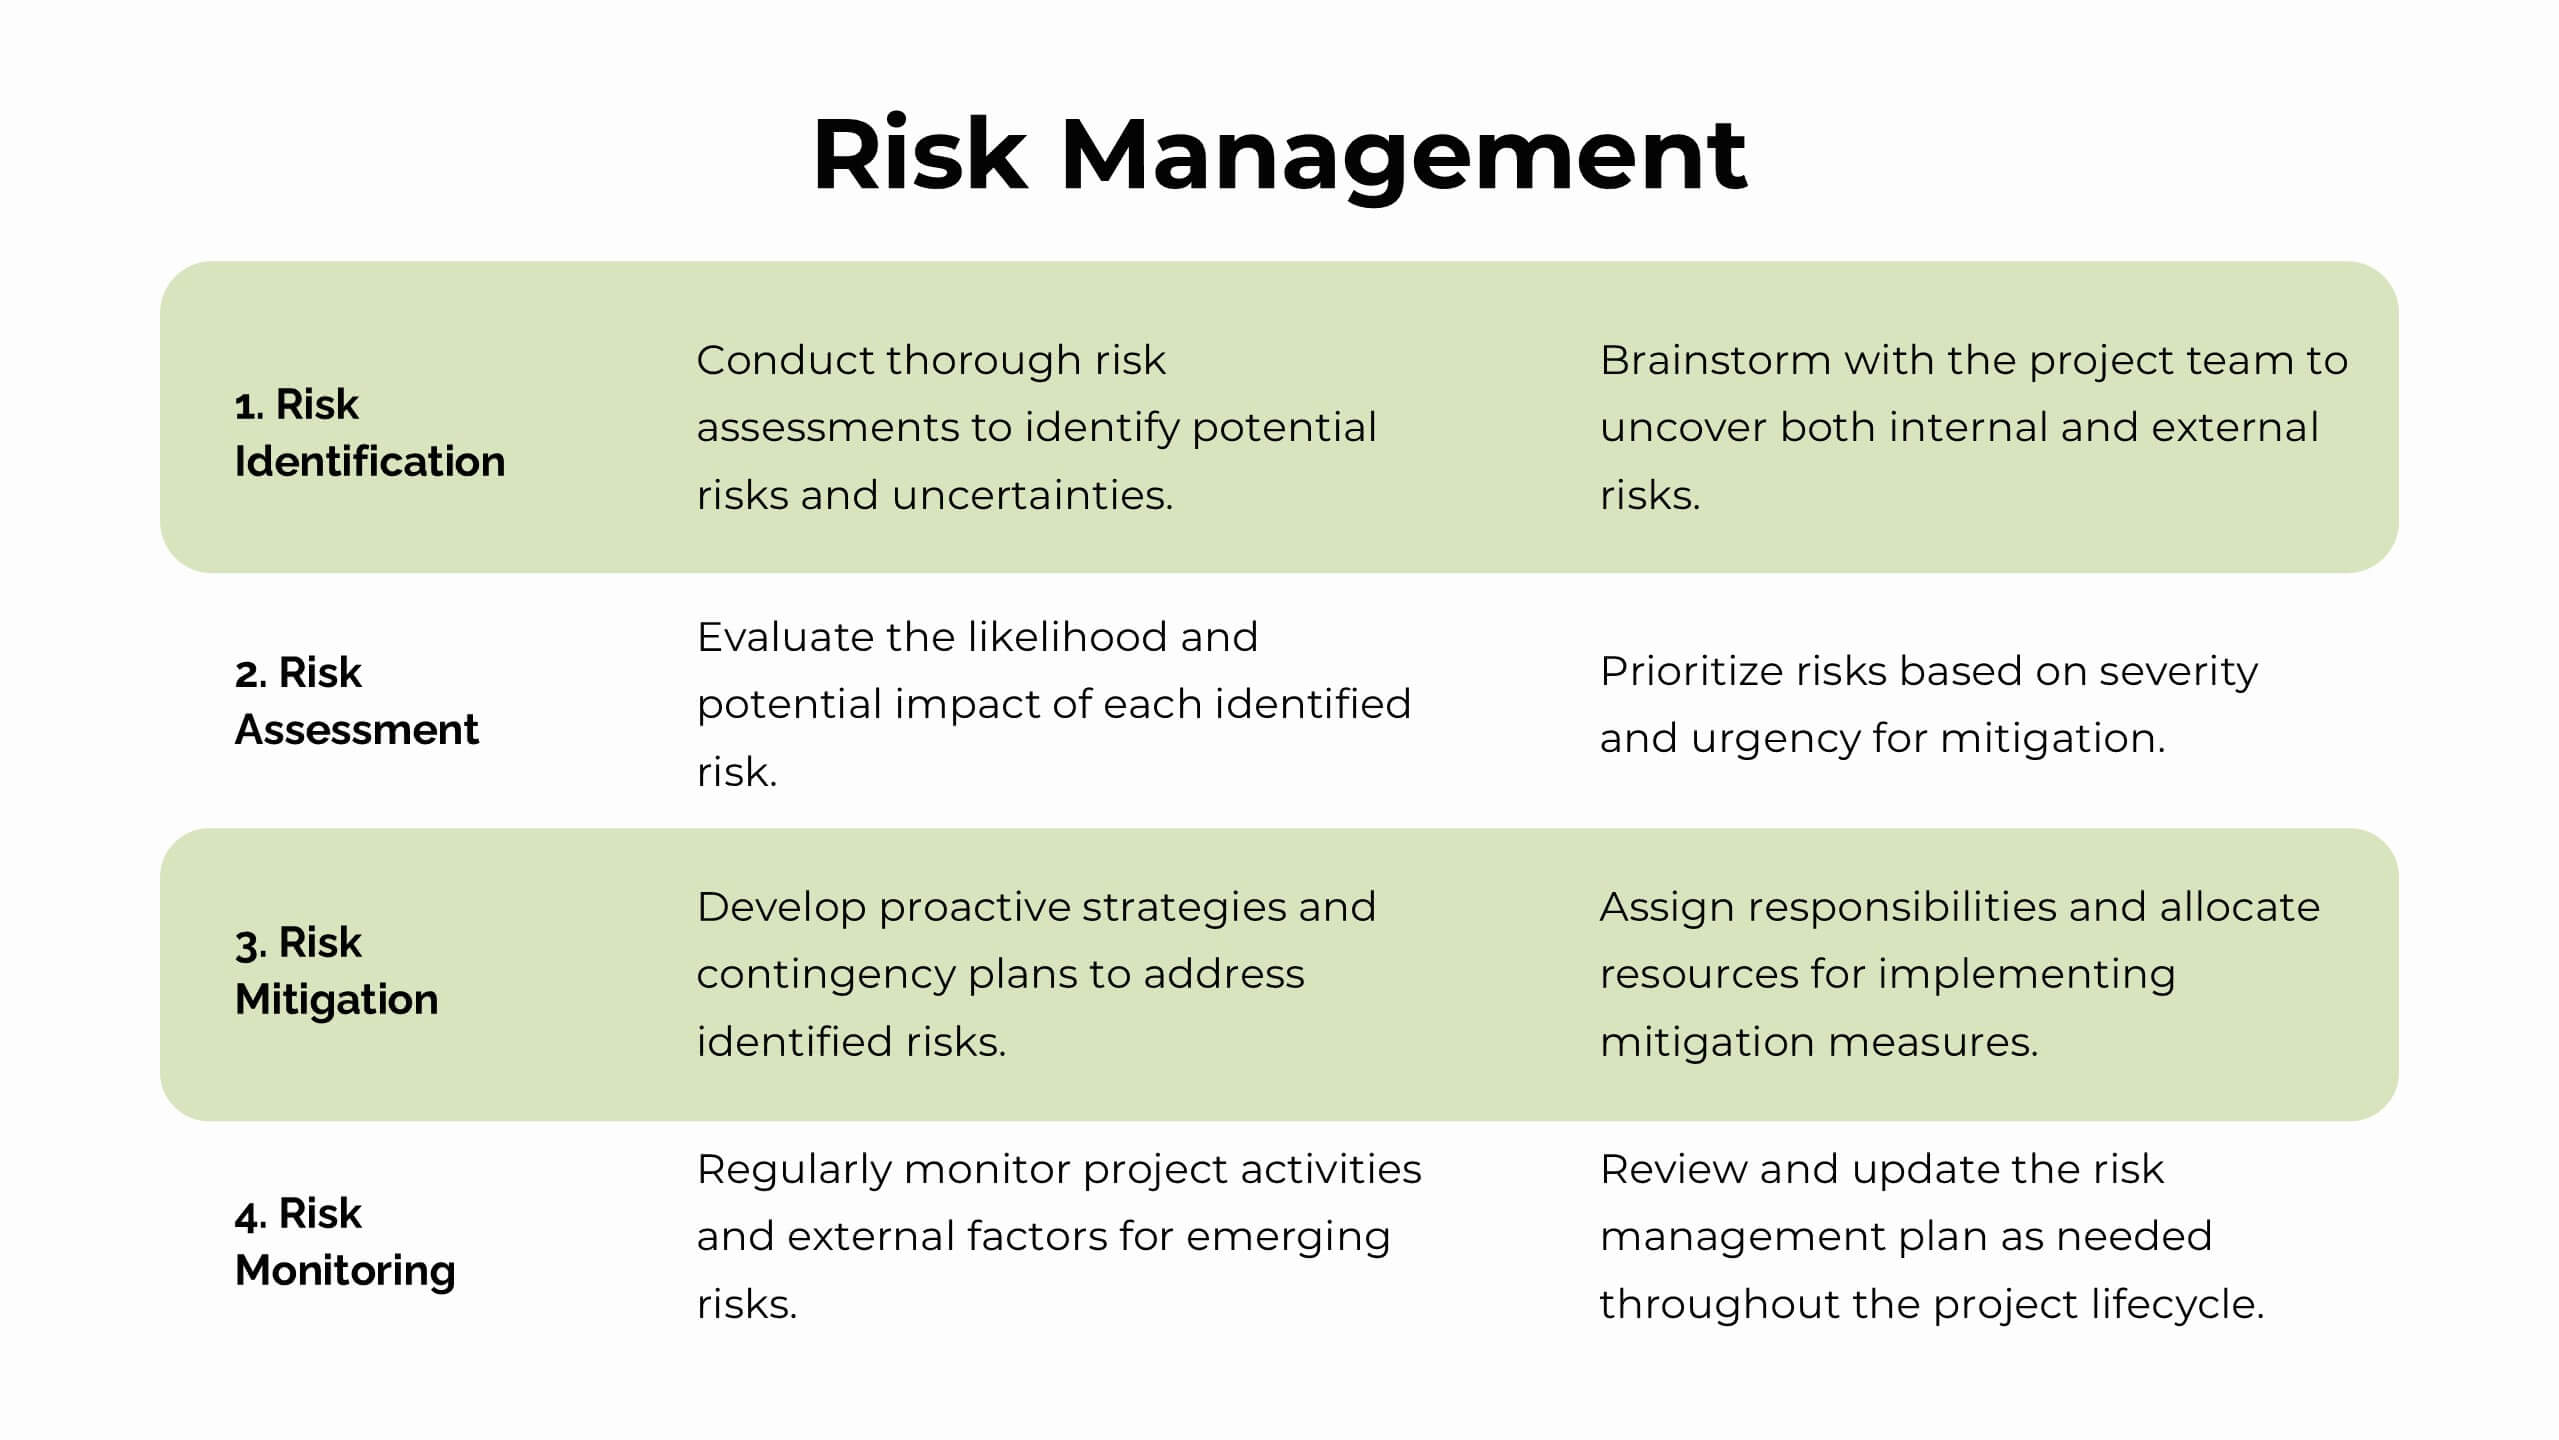
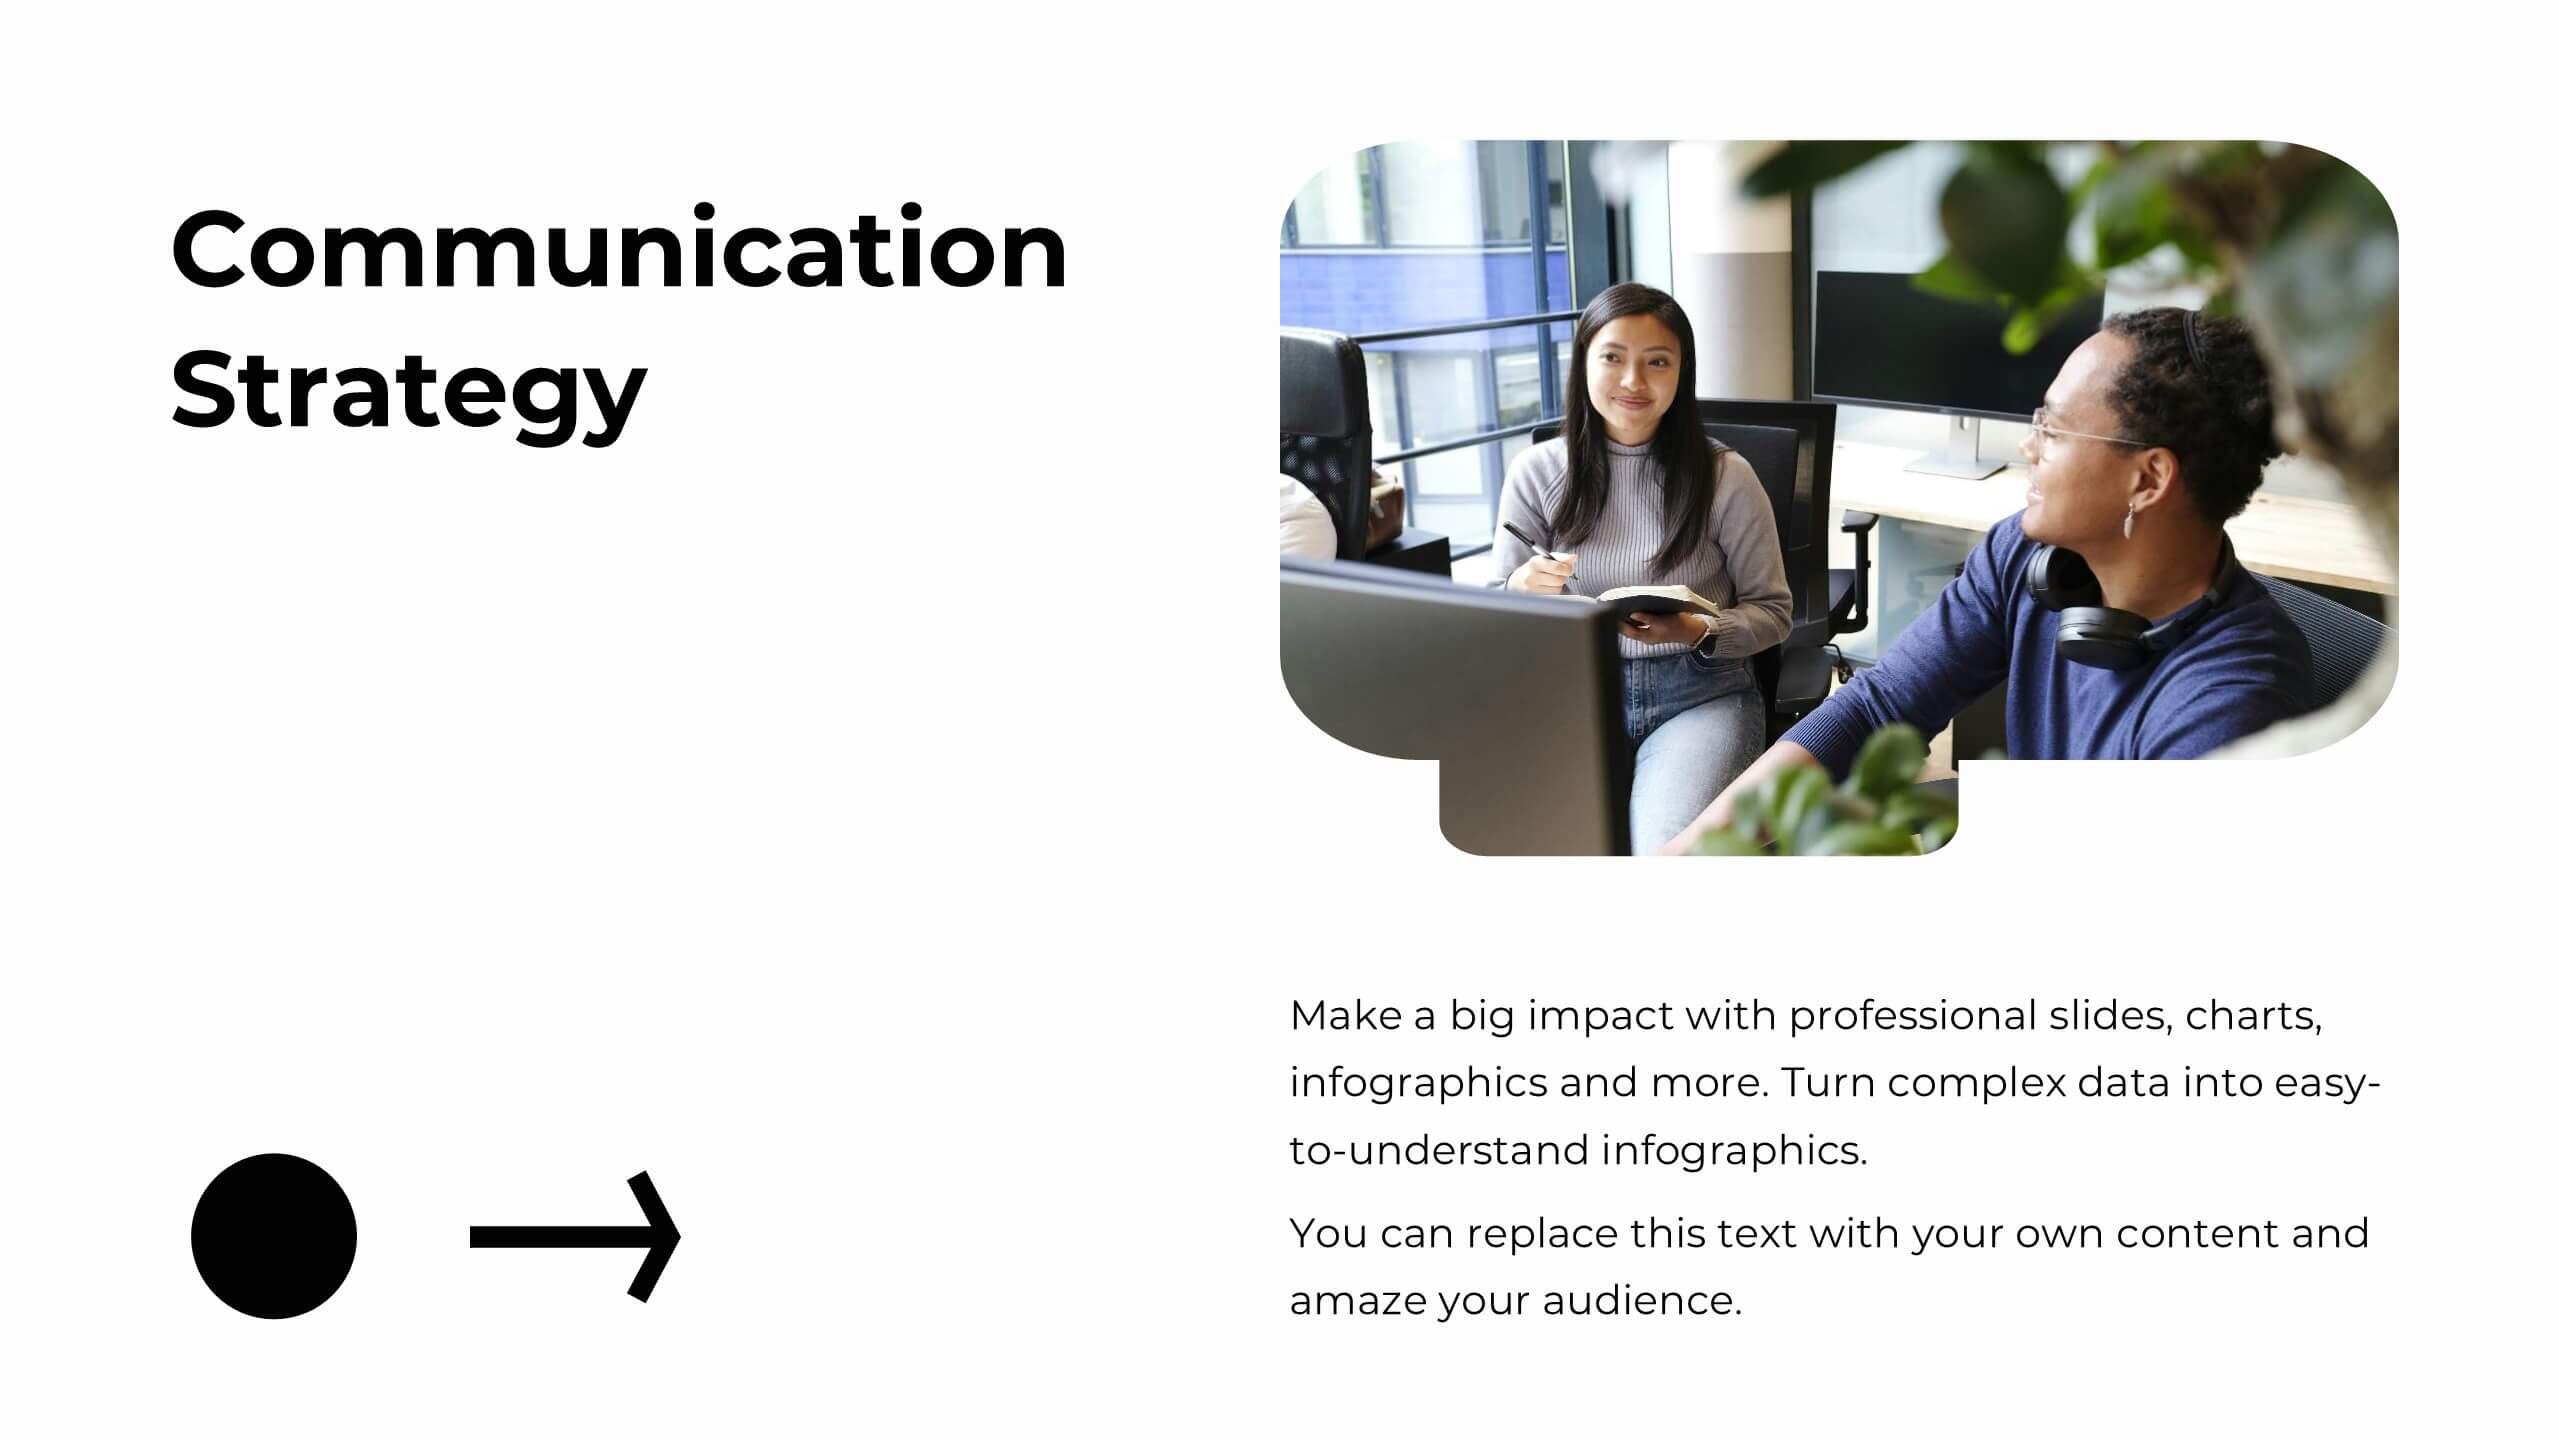
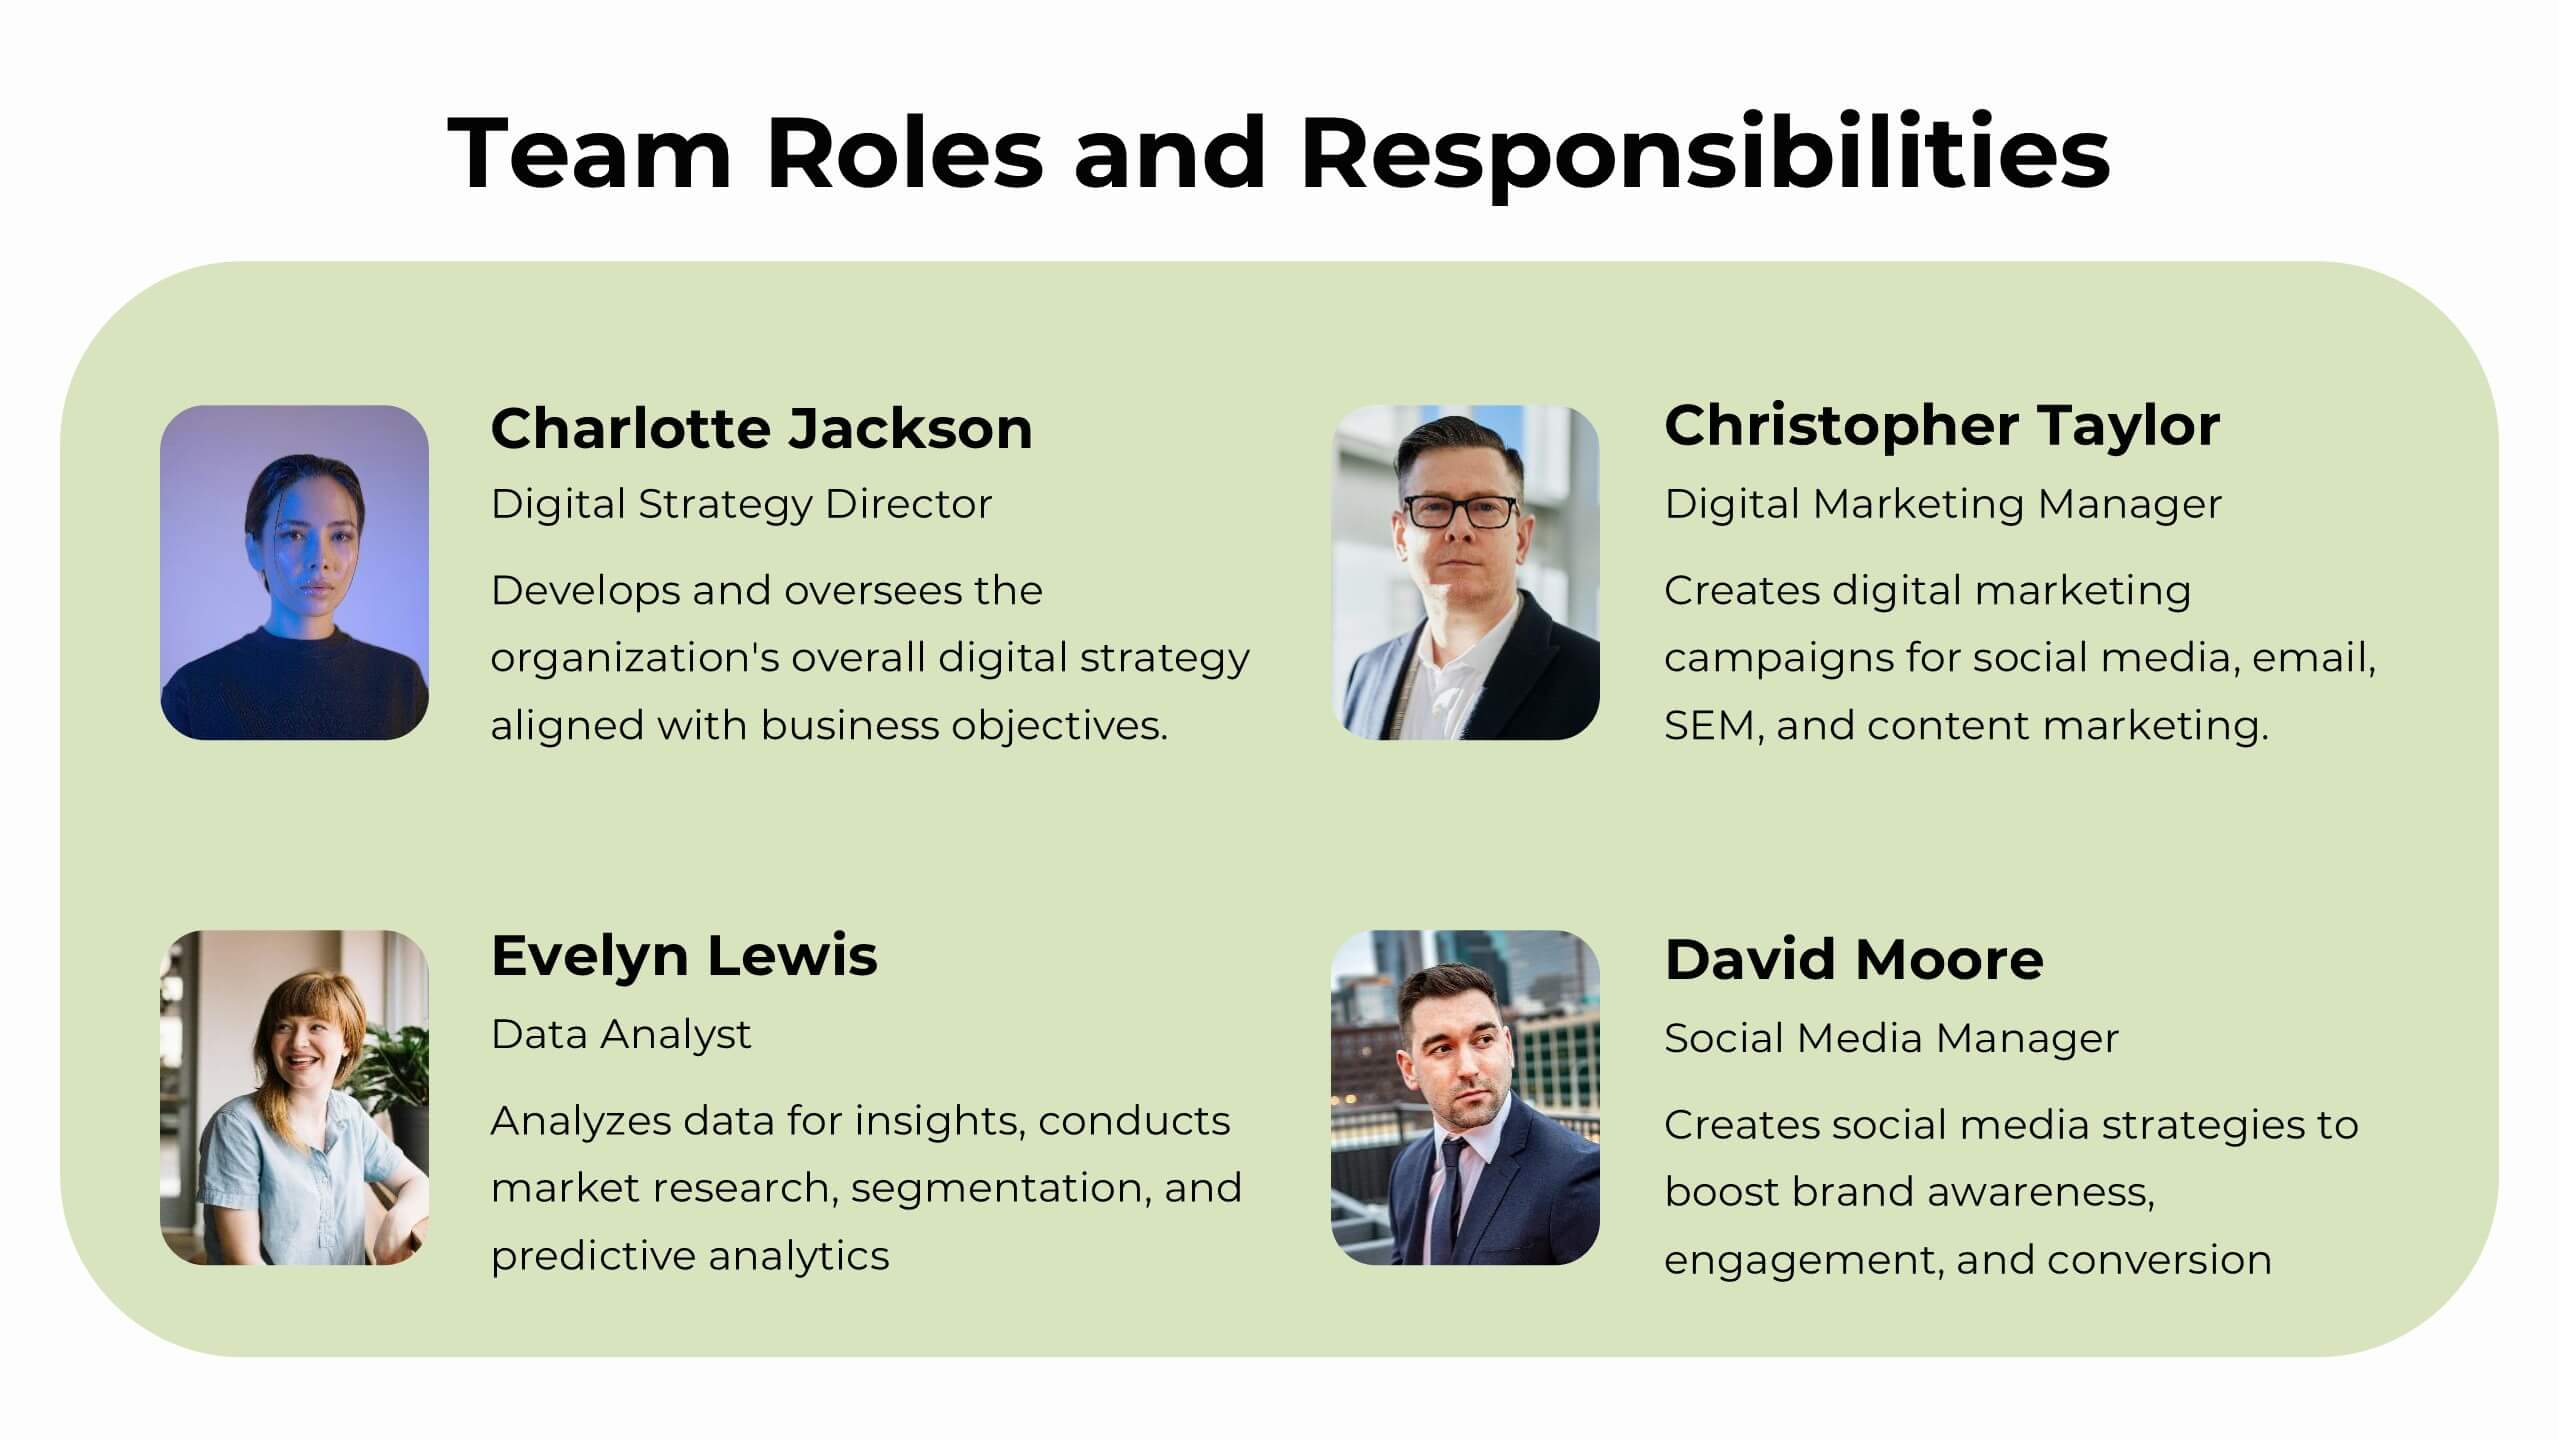
Inspirae Project Status Report Presentation
This sleek and modern project status report presentation template is designed to help you effectively communicate progress, challenges, and key insights. It covers essential sections such as performance metrics, sales performance, risk assessments, and strategic initiatives, ensuring a comprehensive overview. Compatible with PowerPoint, Keynote, and Google Slides for seamless customization.


24 diapositivas
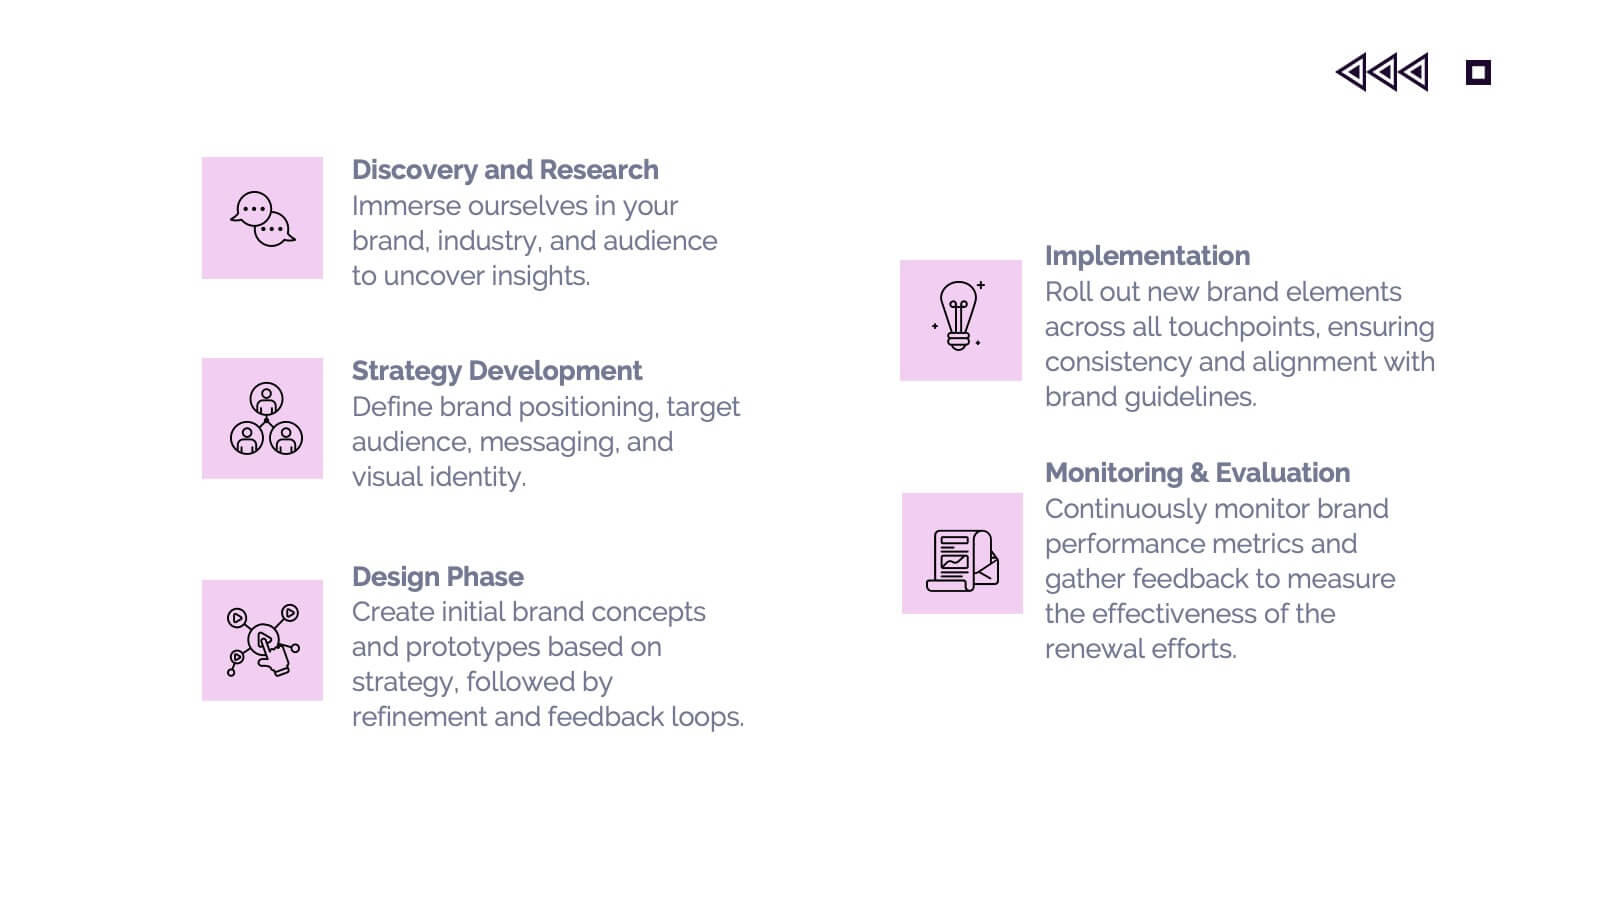
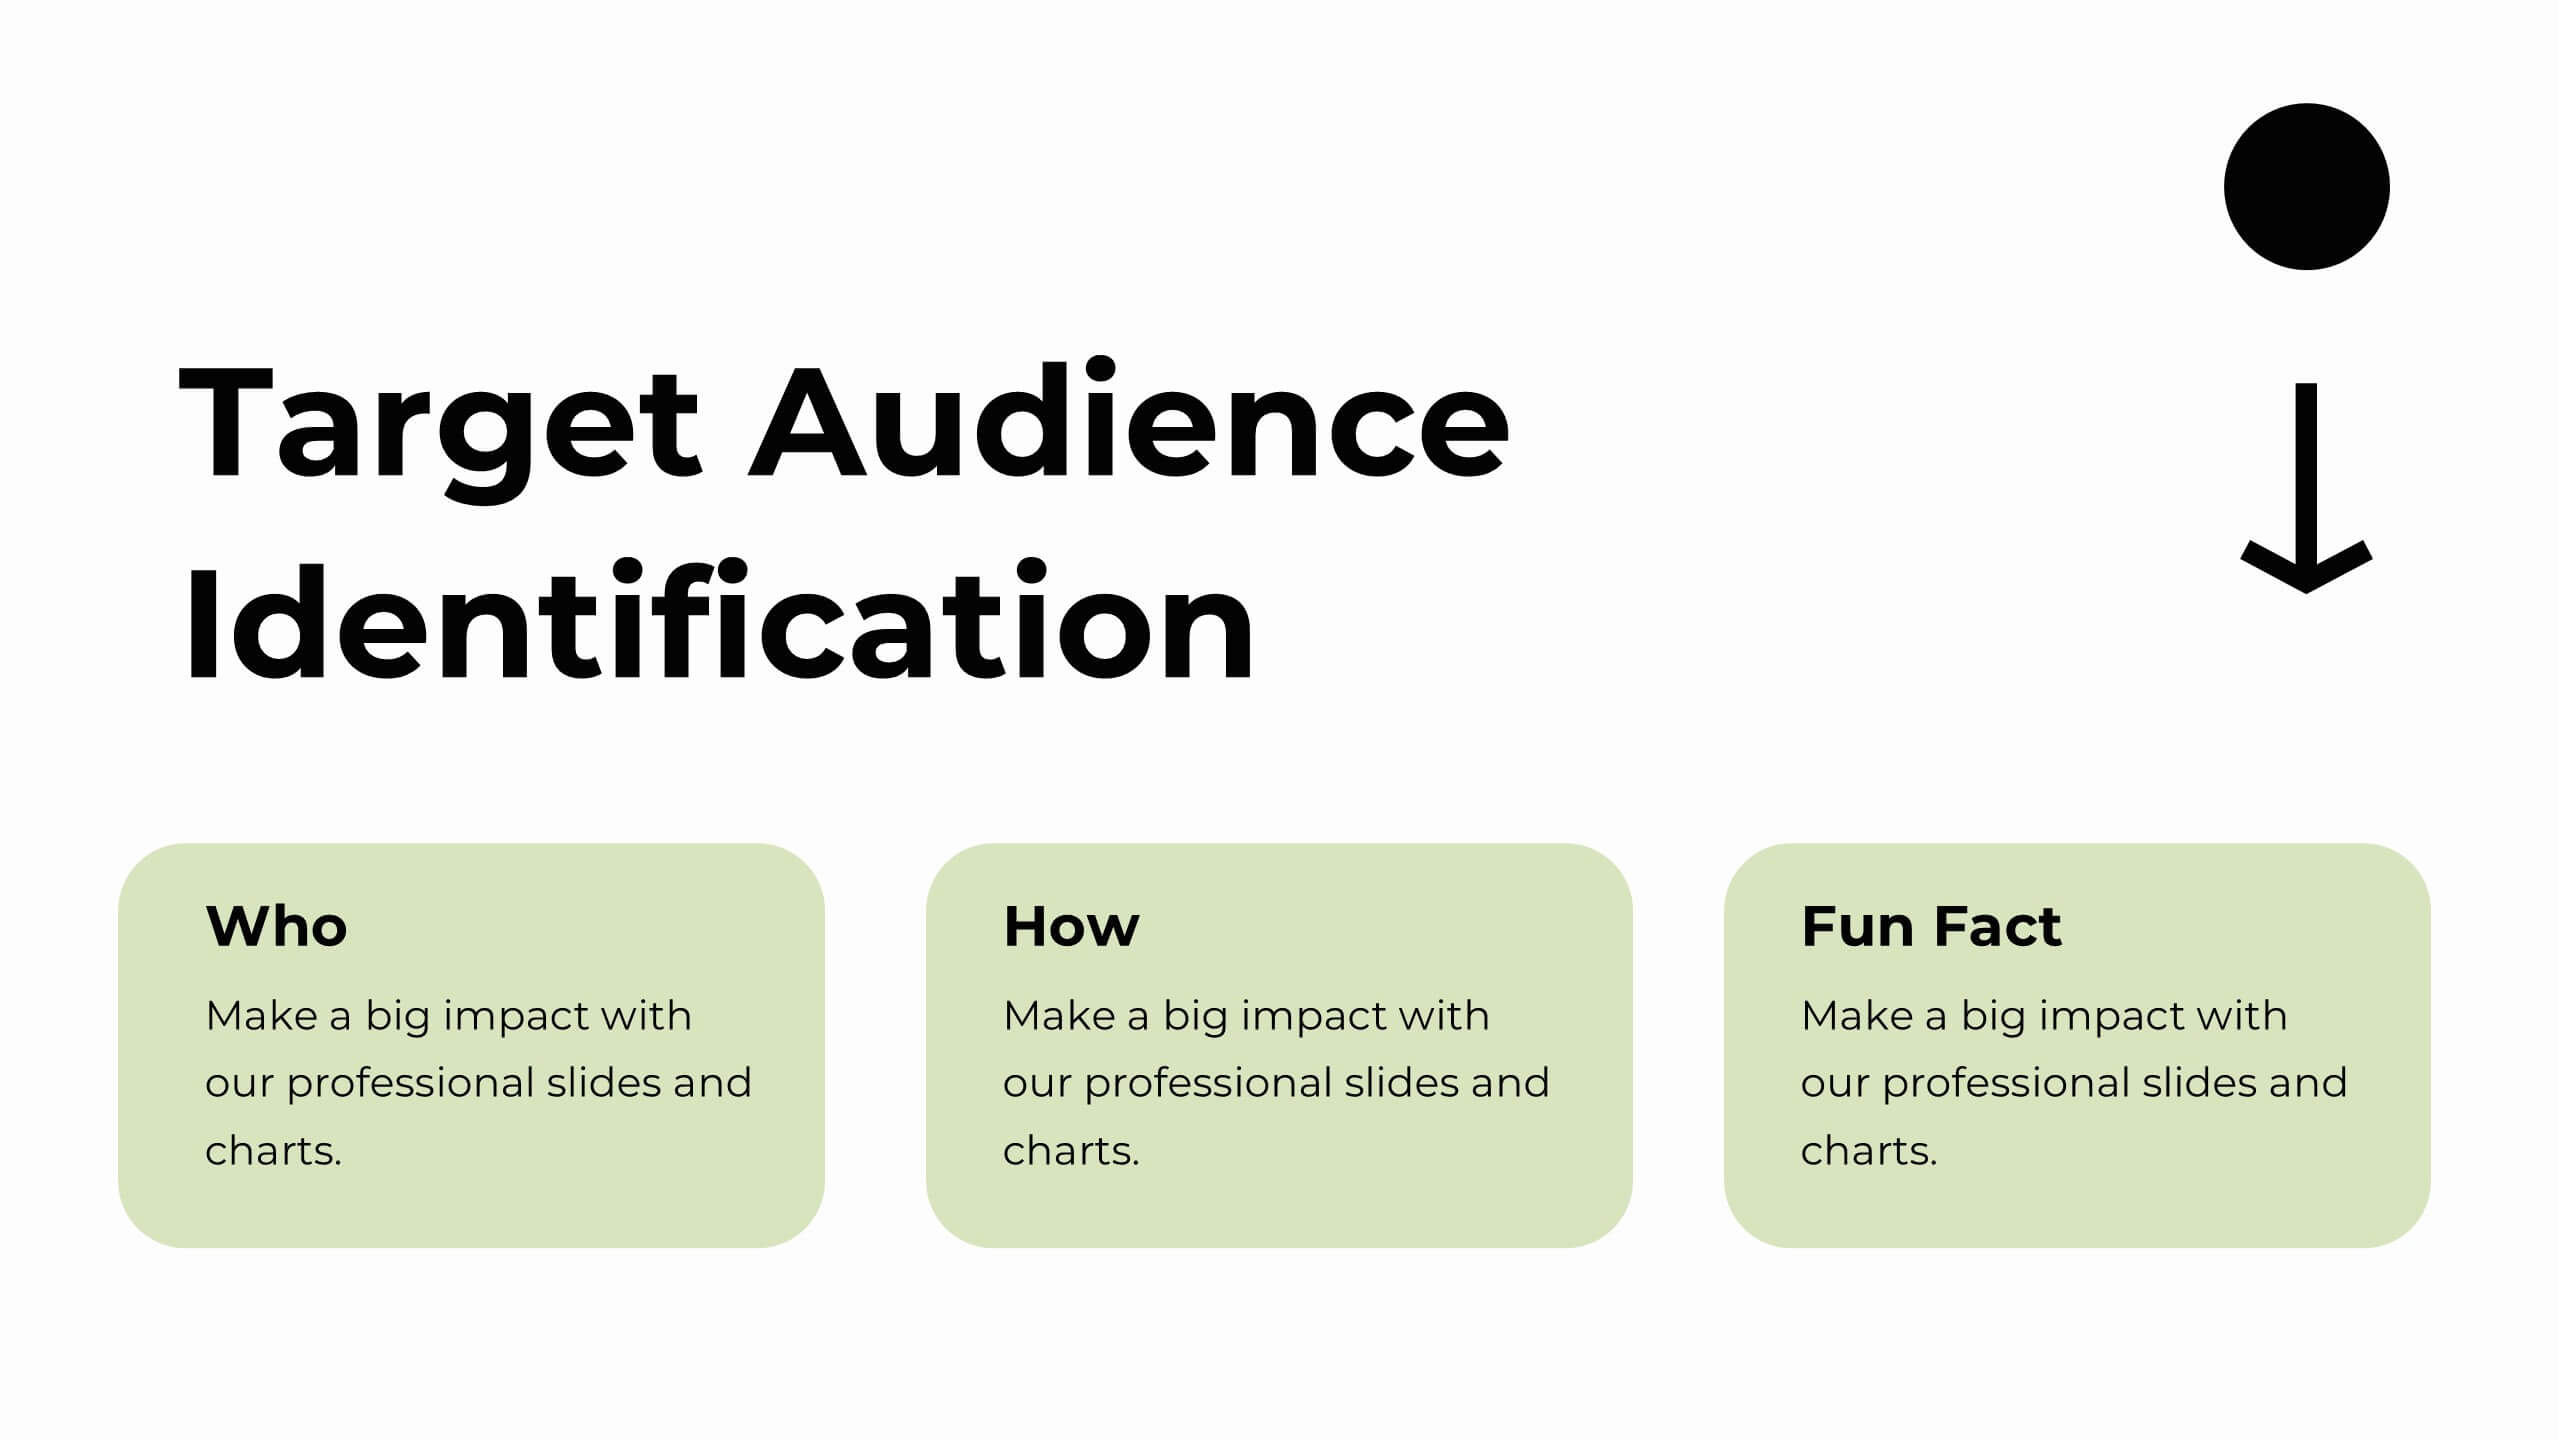
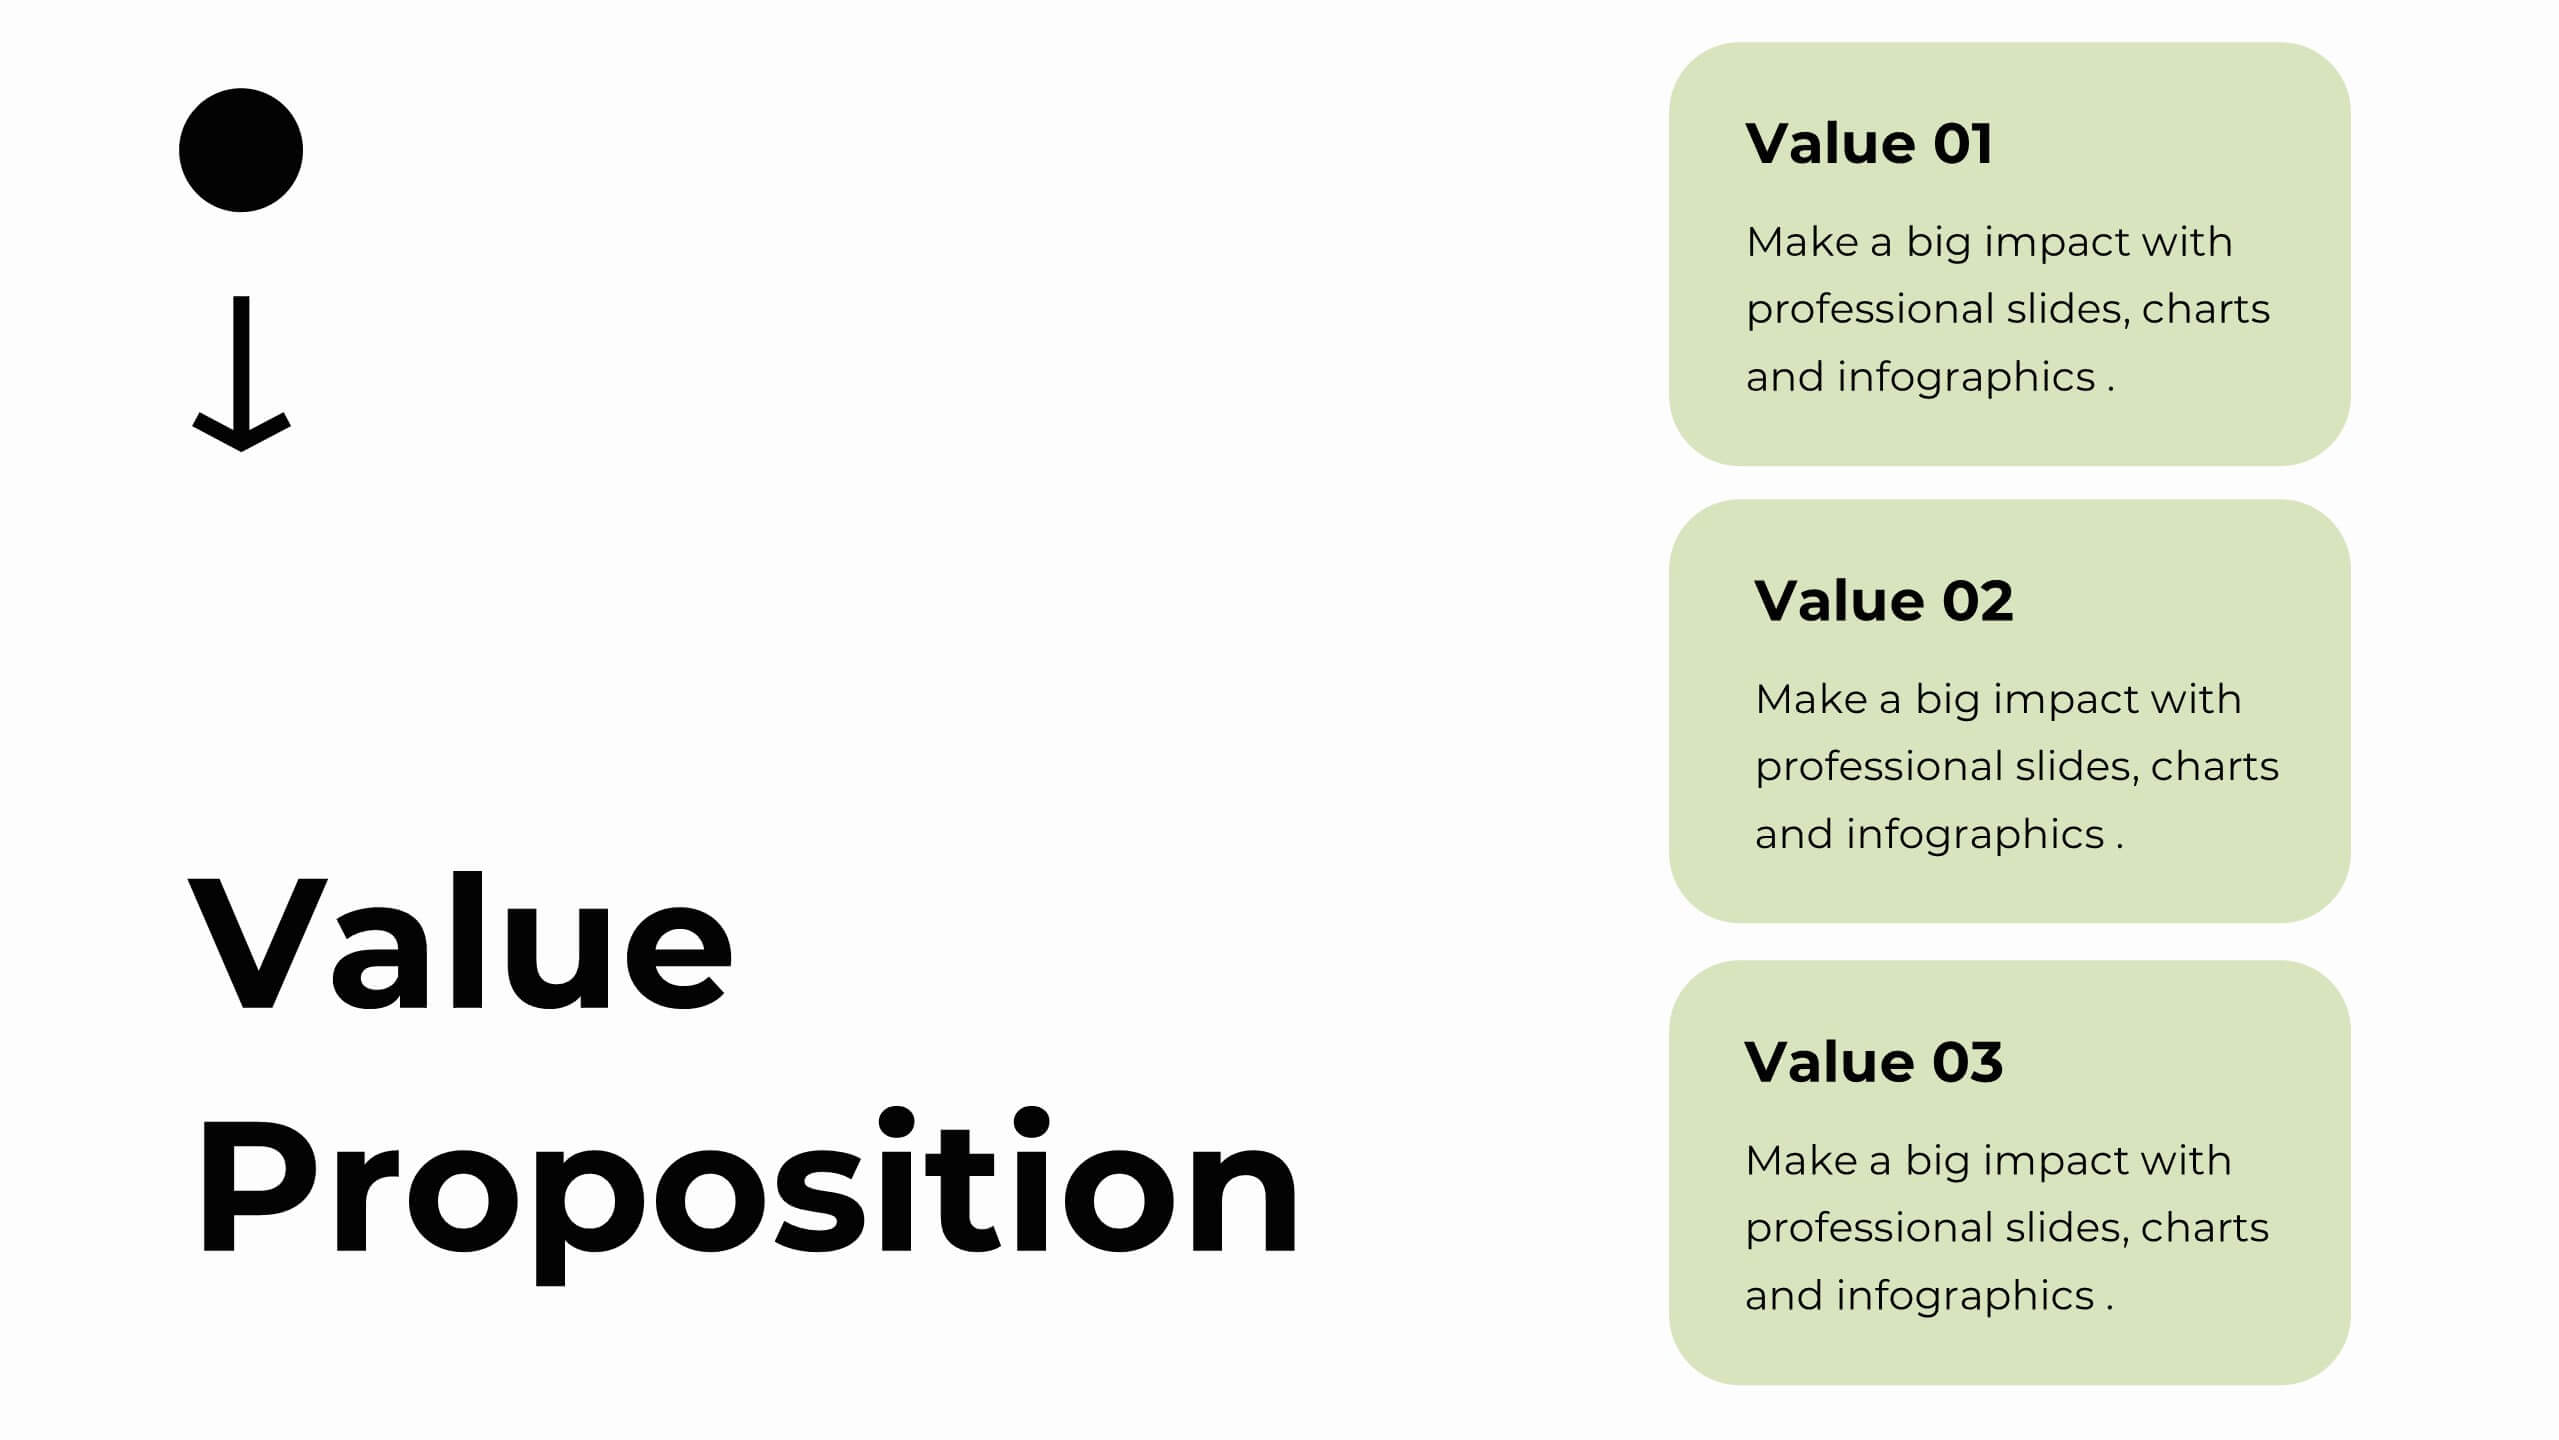
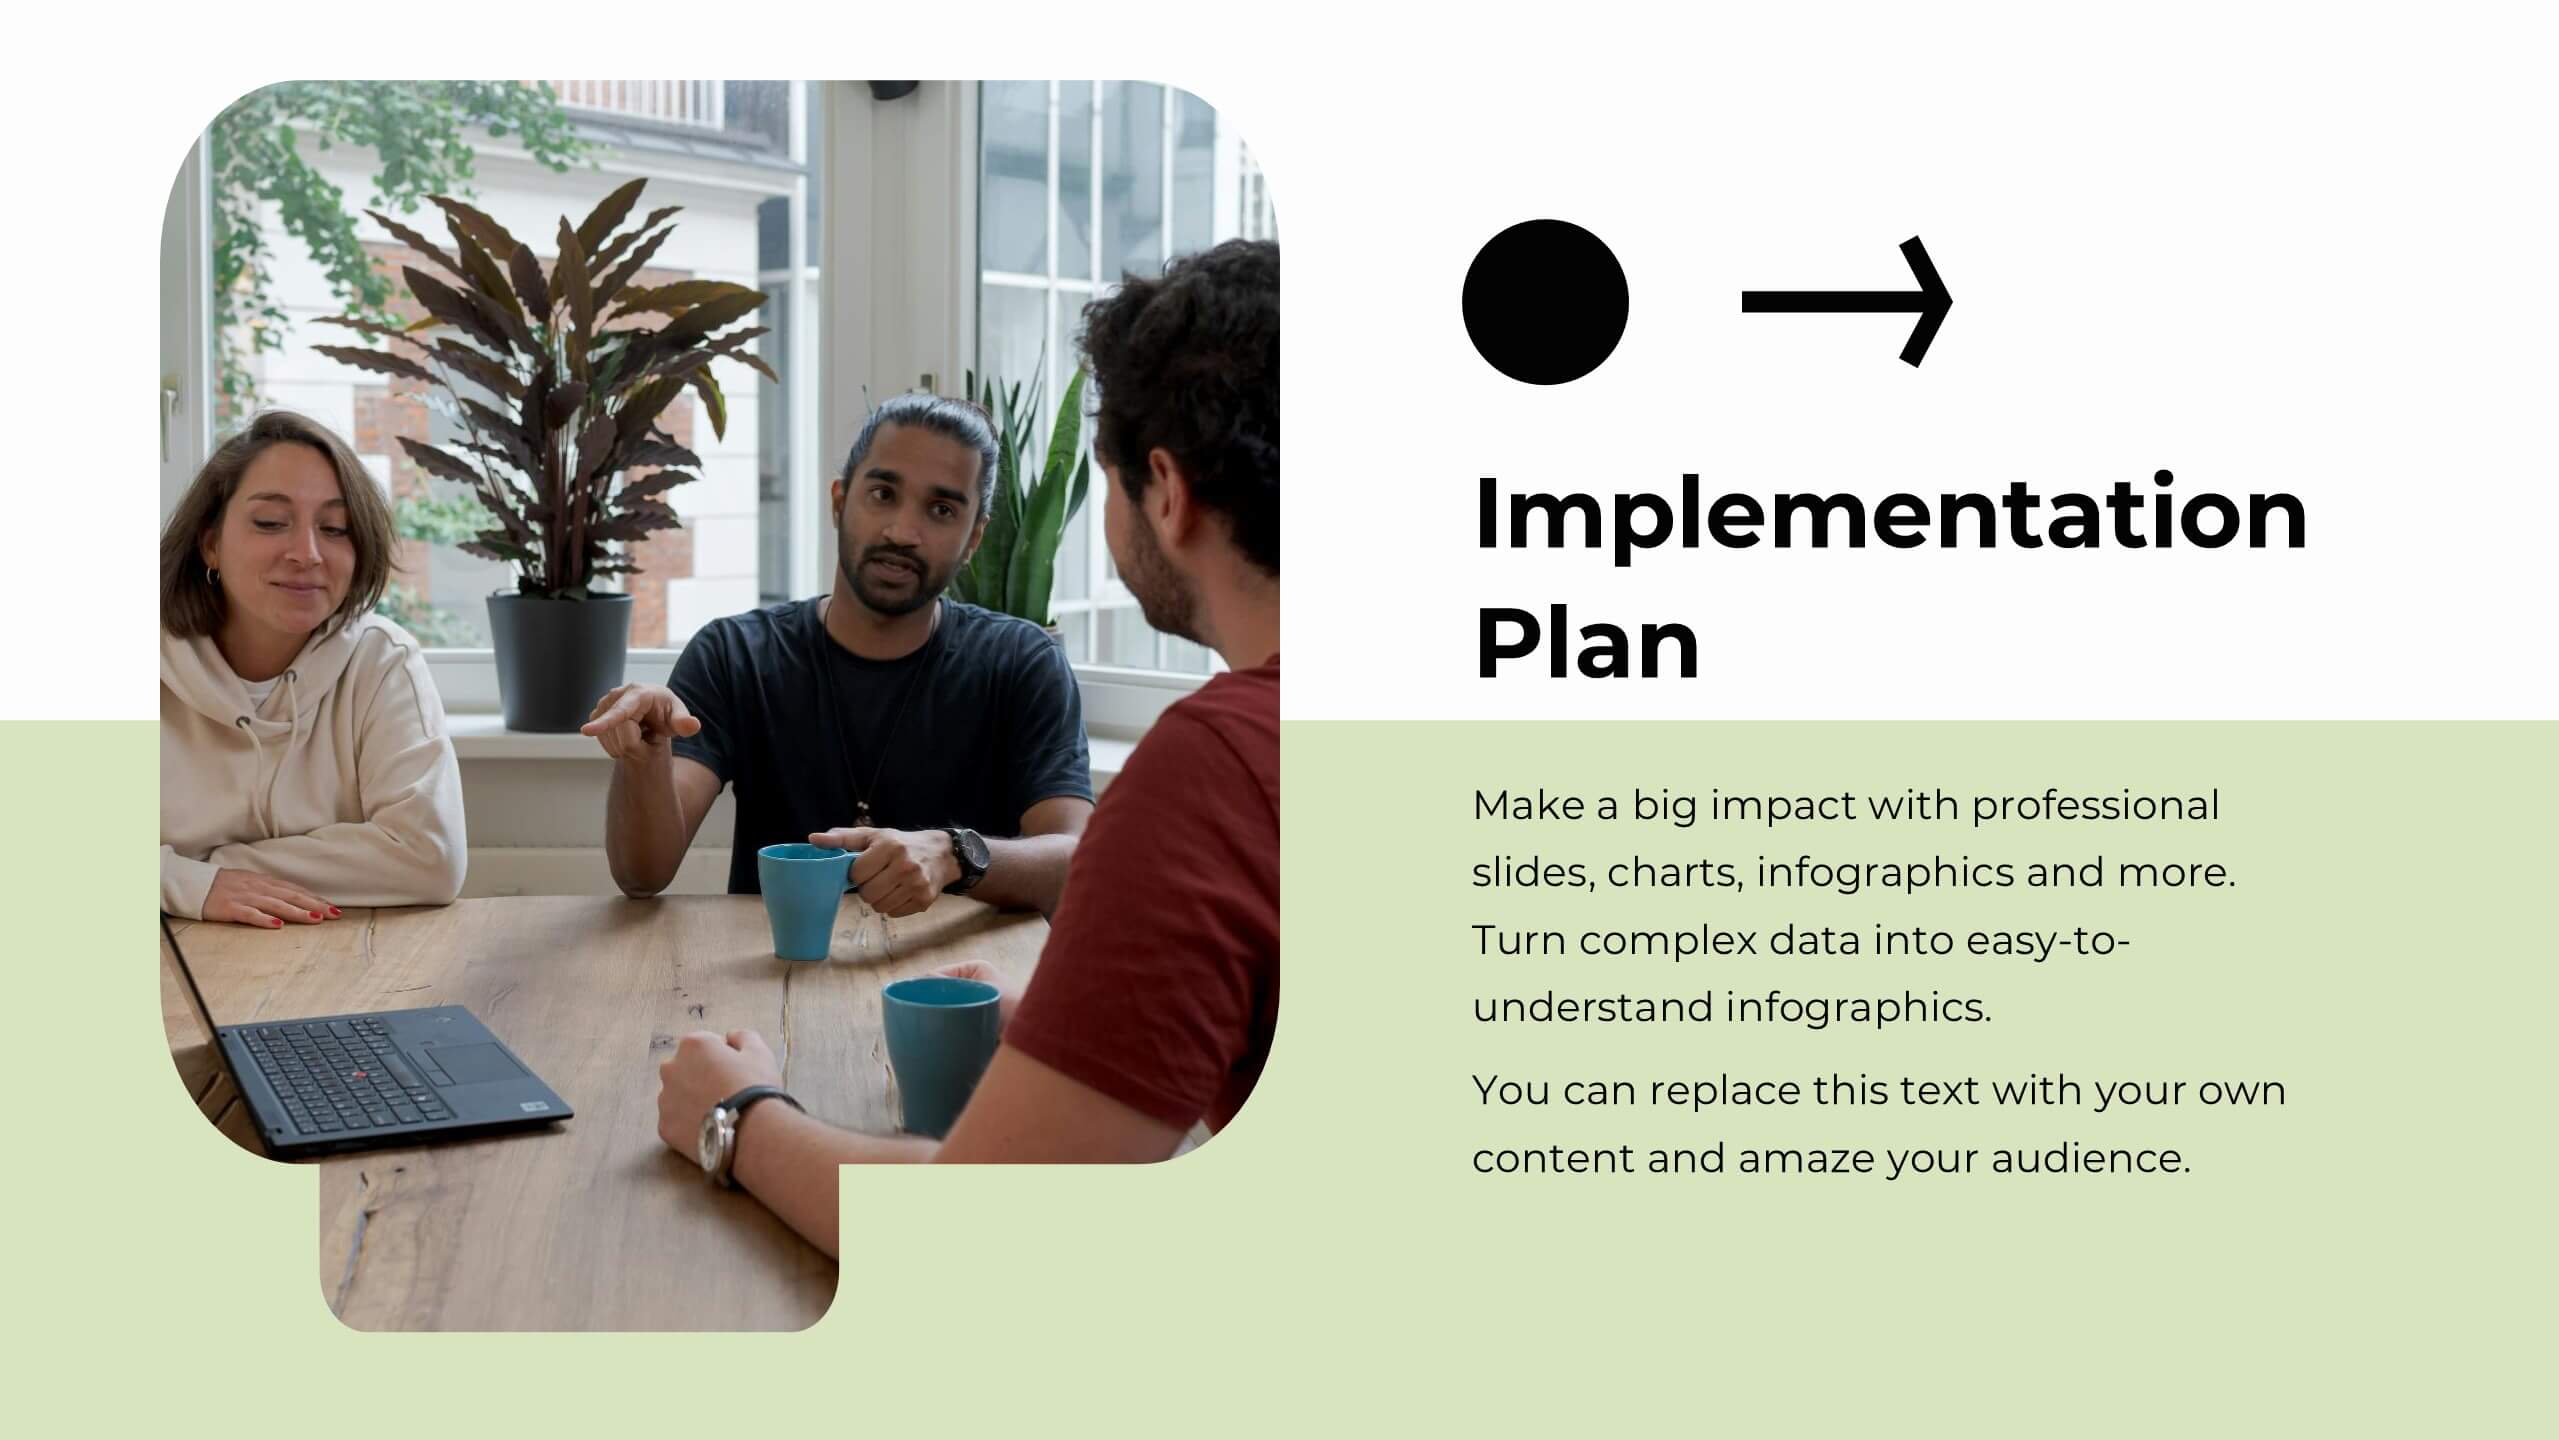
Djinn Brand Identity Presentation
Unleash the power of your brand with this sleek and modern presentation template! From brand identity components to target audience personas, this template covers everything you need to craft a cohesive and compelling brand strategy. Whether showcasing brand guidelines or success stories, it’s designed for maximum clarity and impact. Compatible with PowerPoint, Keynote, and Google Slides for effortless presentations.


23 diapositivas
Wendigo Agency Portfolio Presentation
This sleek agency portfolio template showcases your mission, services, and success stories with modern flair. From case studies and strategy development to campaign execution and client testimonials, it’s designed to highlight your agency’s strengths. Perfect for agency presentations across PowerPoint, Keynote, and Google Slides, this template makes your content shine effortlessly.


4 diapositivas
Customer Feedback Report Presentation
Transform audience insights into actionable strategies with this clean, data-focused presentation. Designed to highlight customer satisfaction trends, improvement areas, and feedback analysis, it helps visualize complex information with clarity and flow. Fully customizable and compatible with PowerPoint, Keynote, and Google Slides for a polished, professional, and presentation-ready report.


5 diapositivas
Buyer Journey Infographic Presentation
Understanding how buyers move from awareness to action becomes effortless with this clean, visual presentation. It guides you through each stage, helping you explain behaviors, insights, and touchpoints with clarity. Easy to customize and fully compatible with PowerPoint, Keynote, and Google Slides.
20 diapositivas
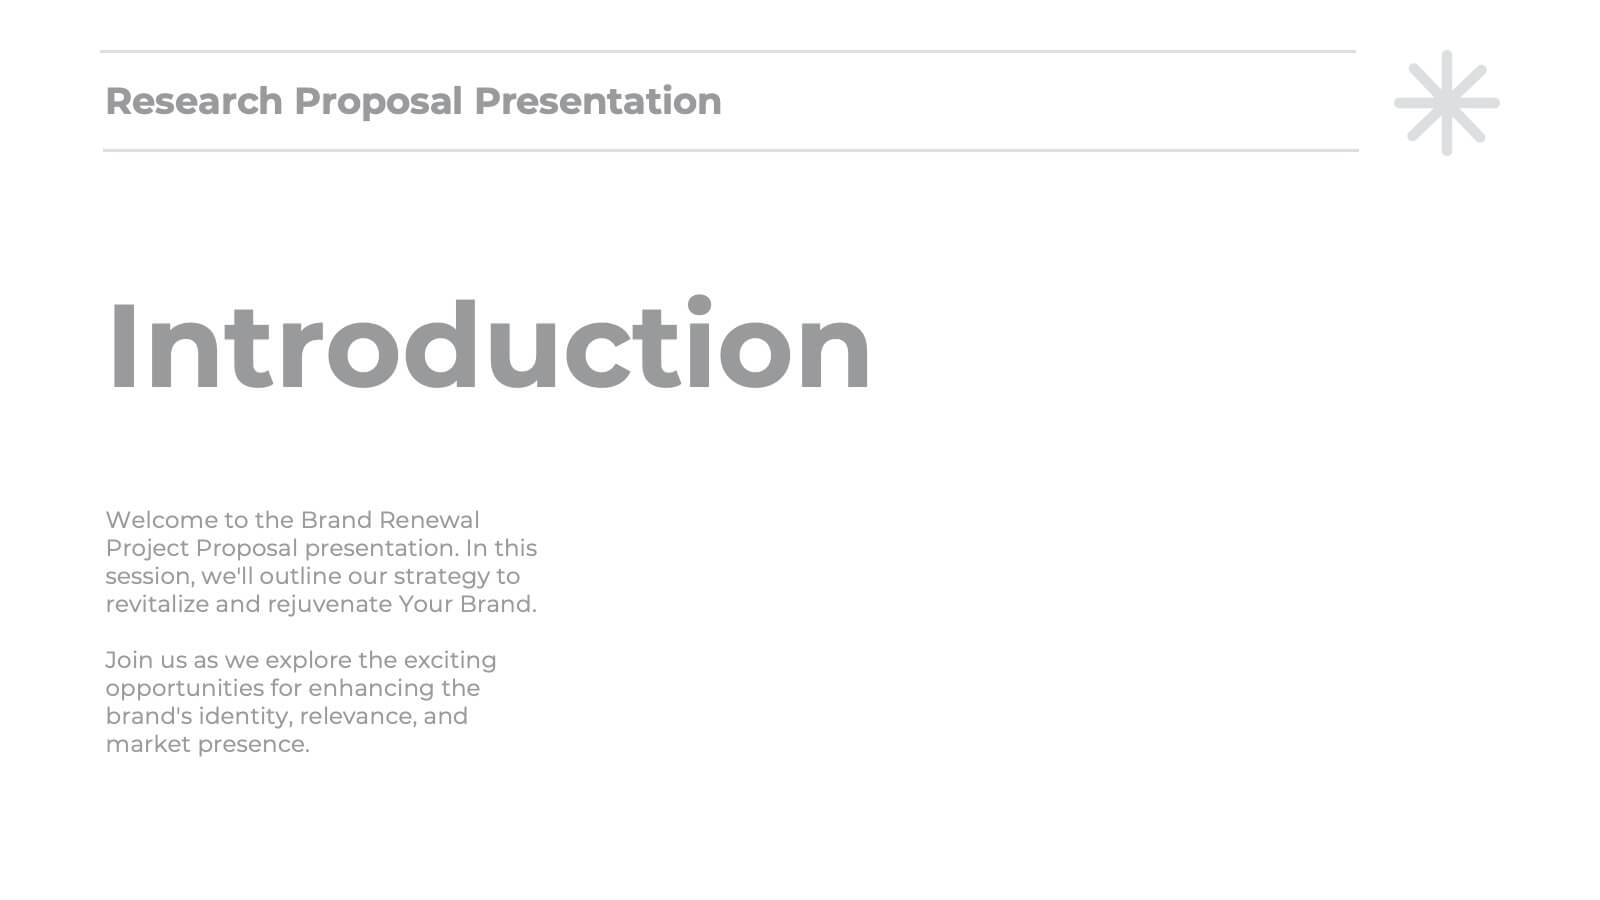
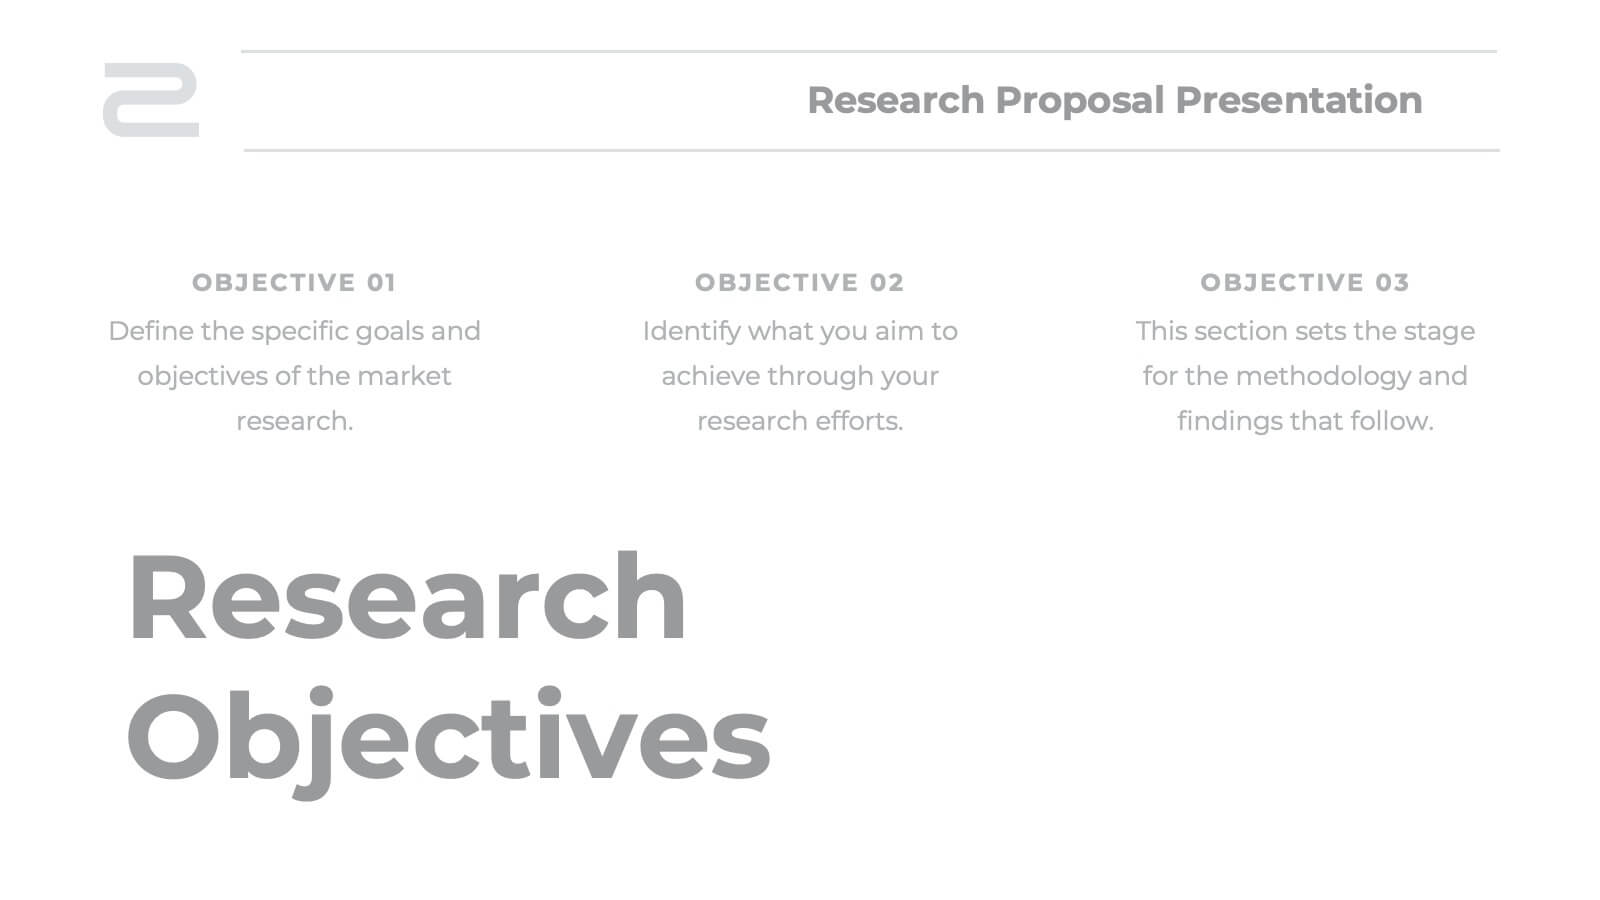
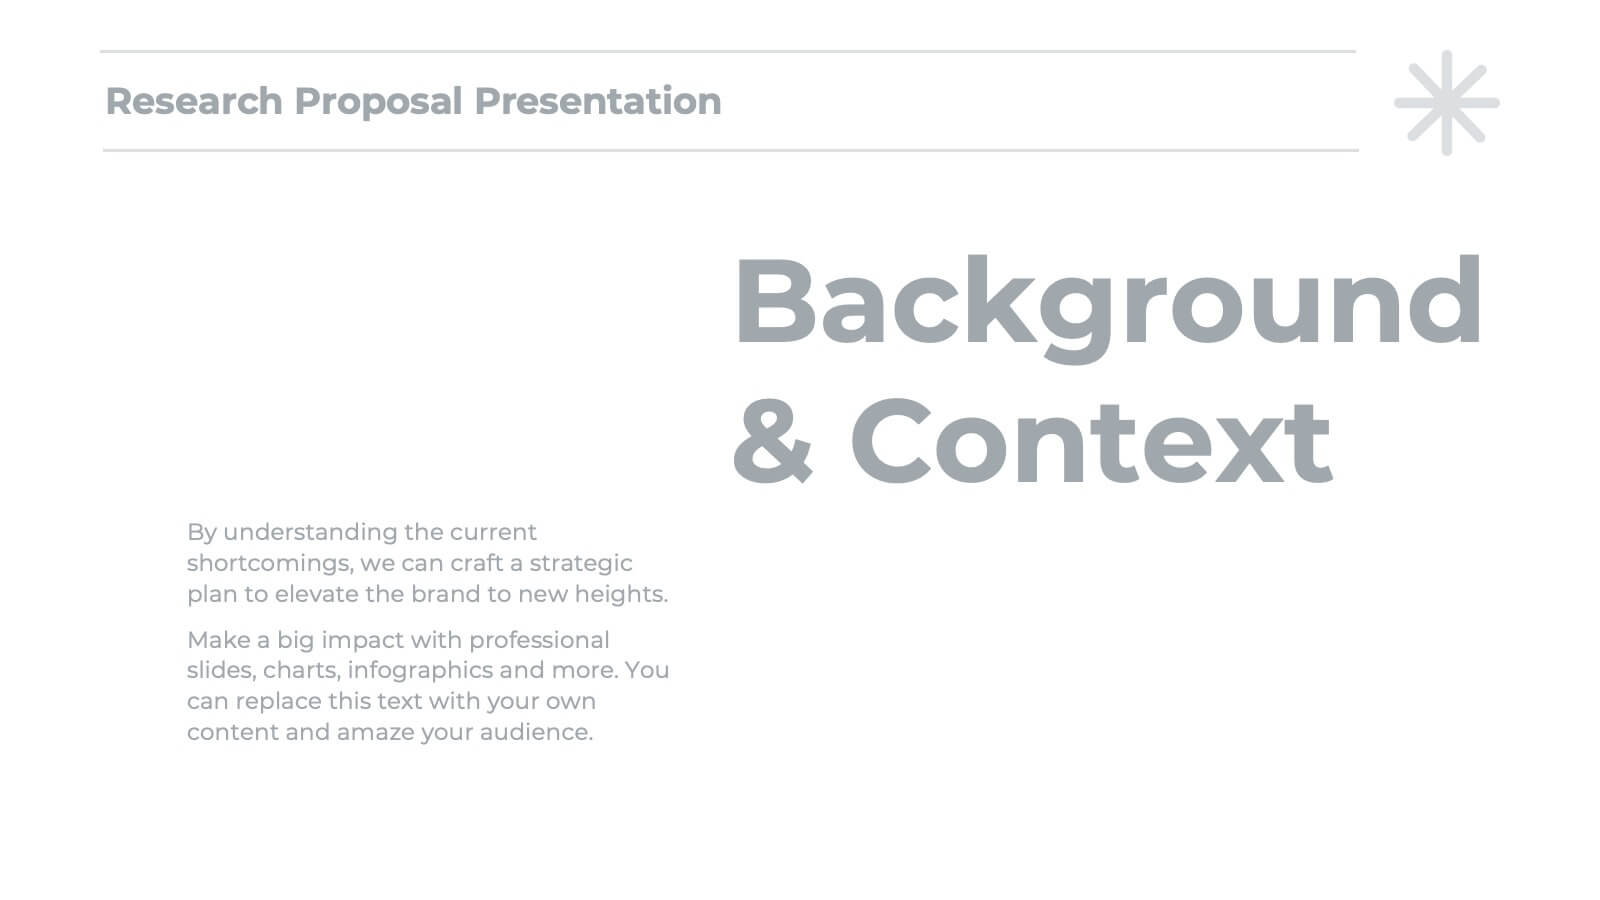
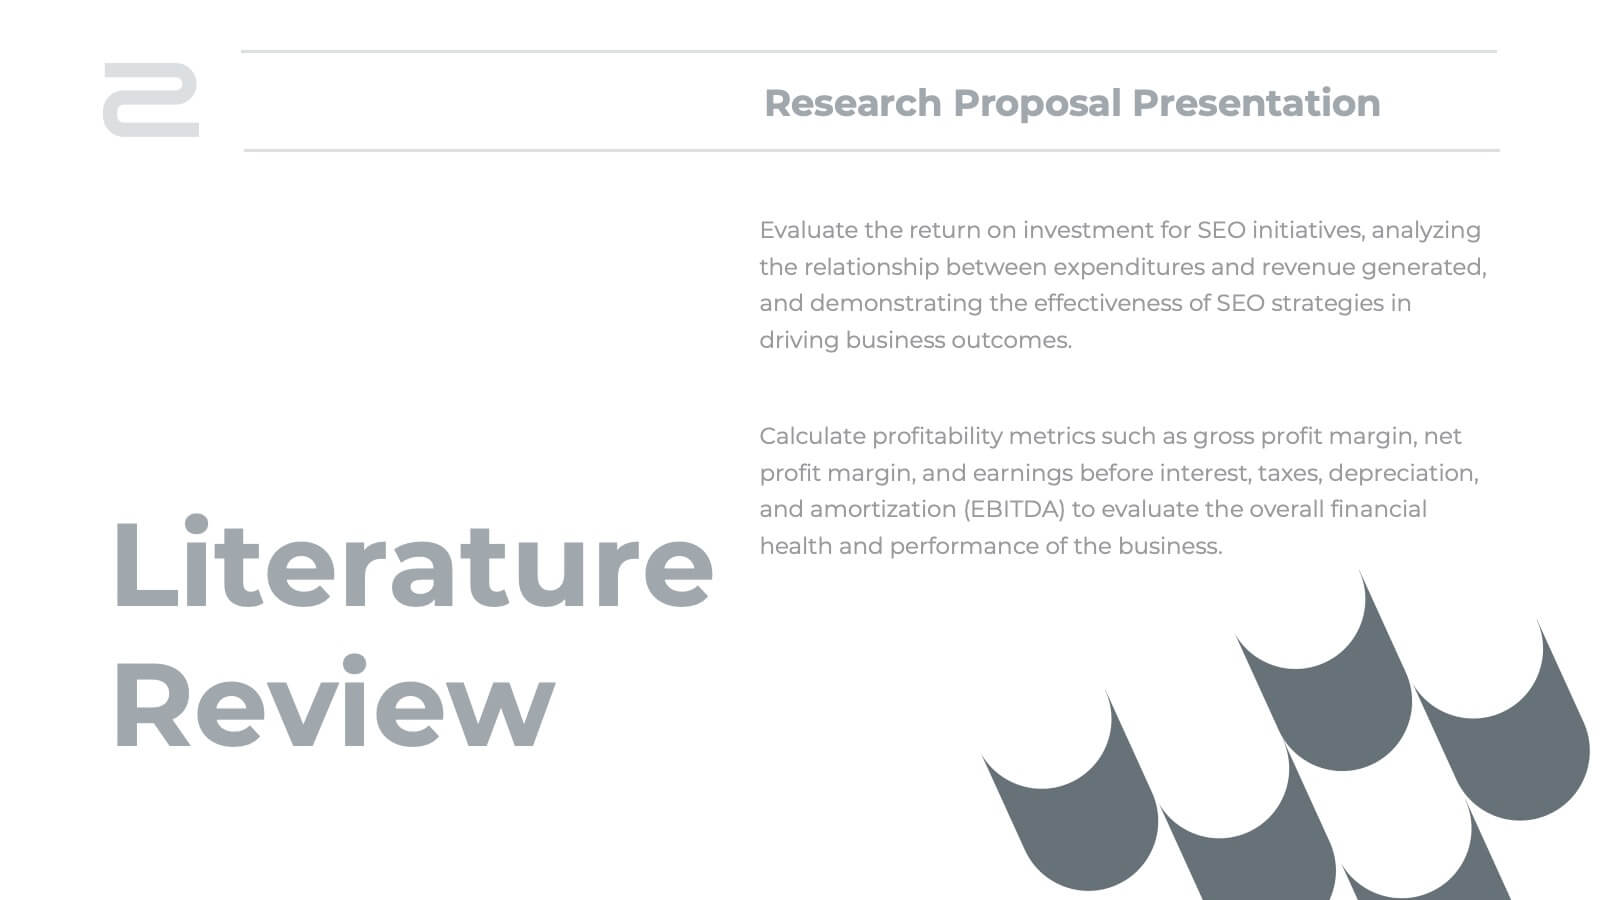
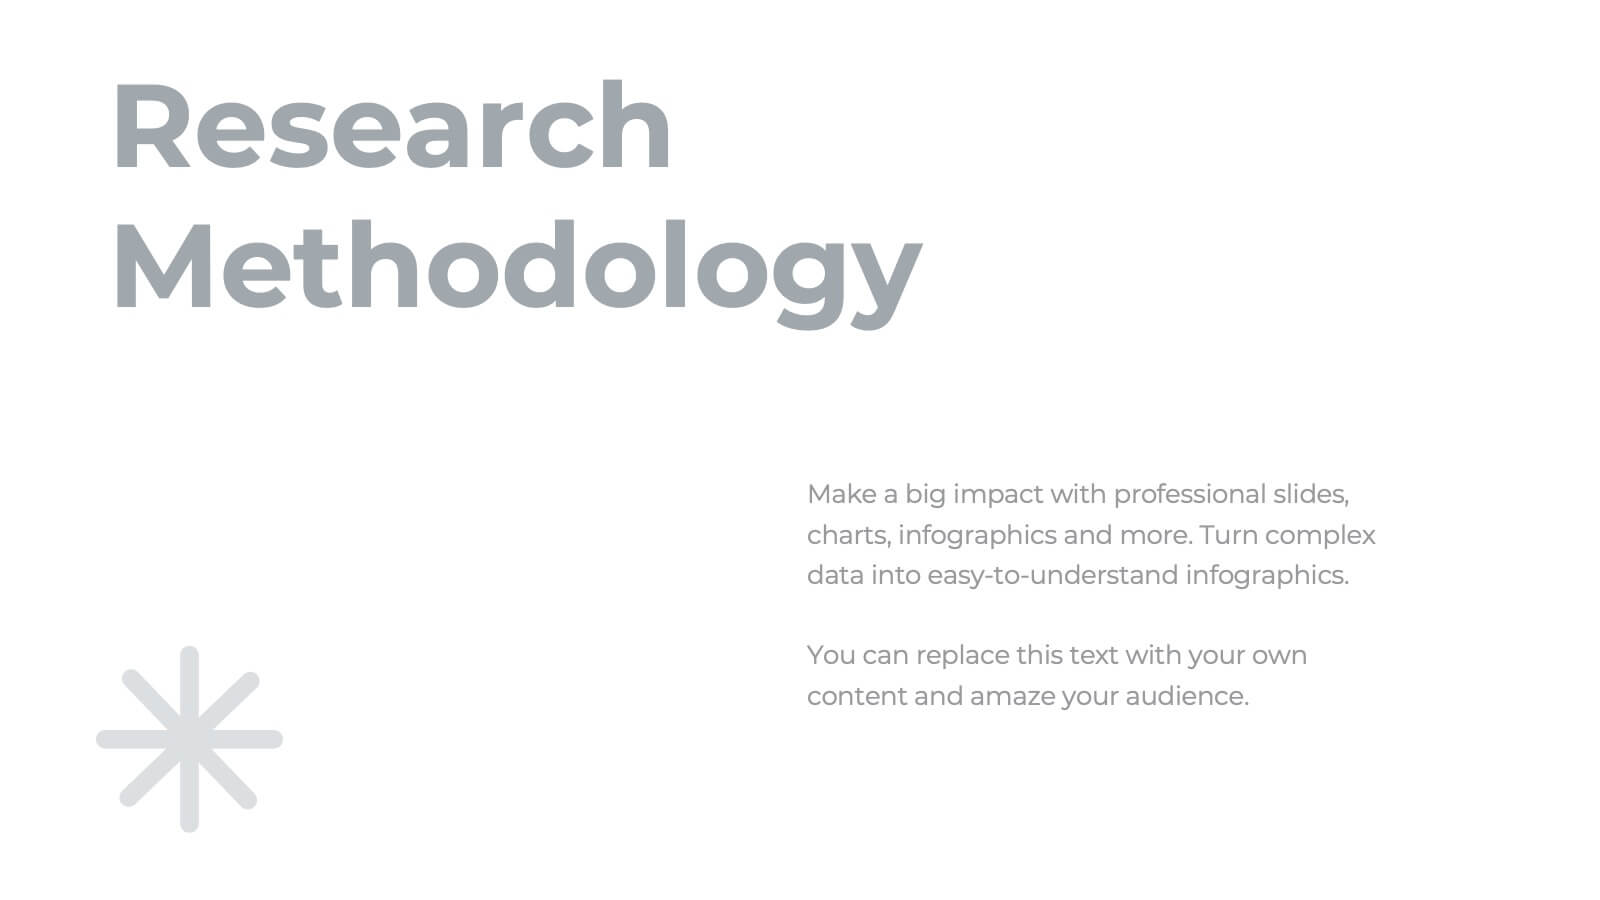
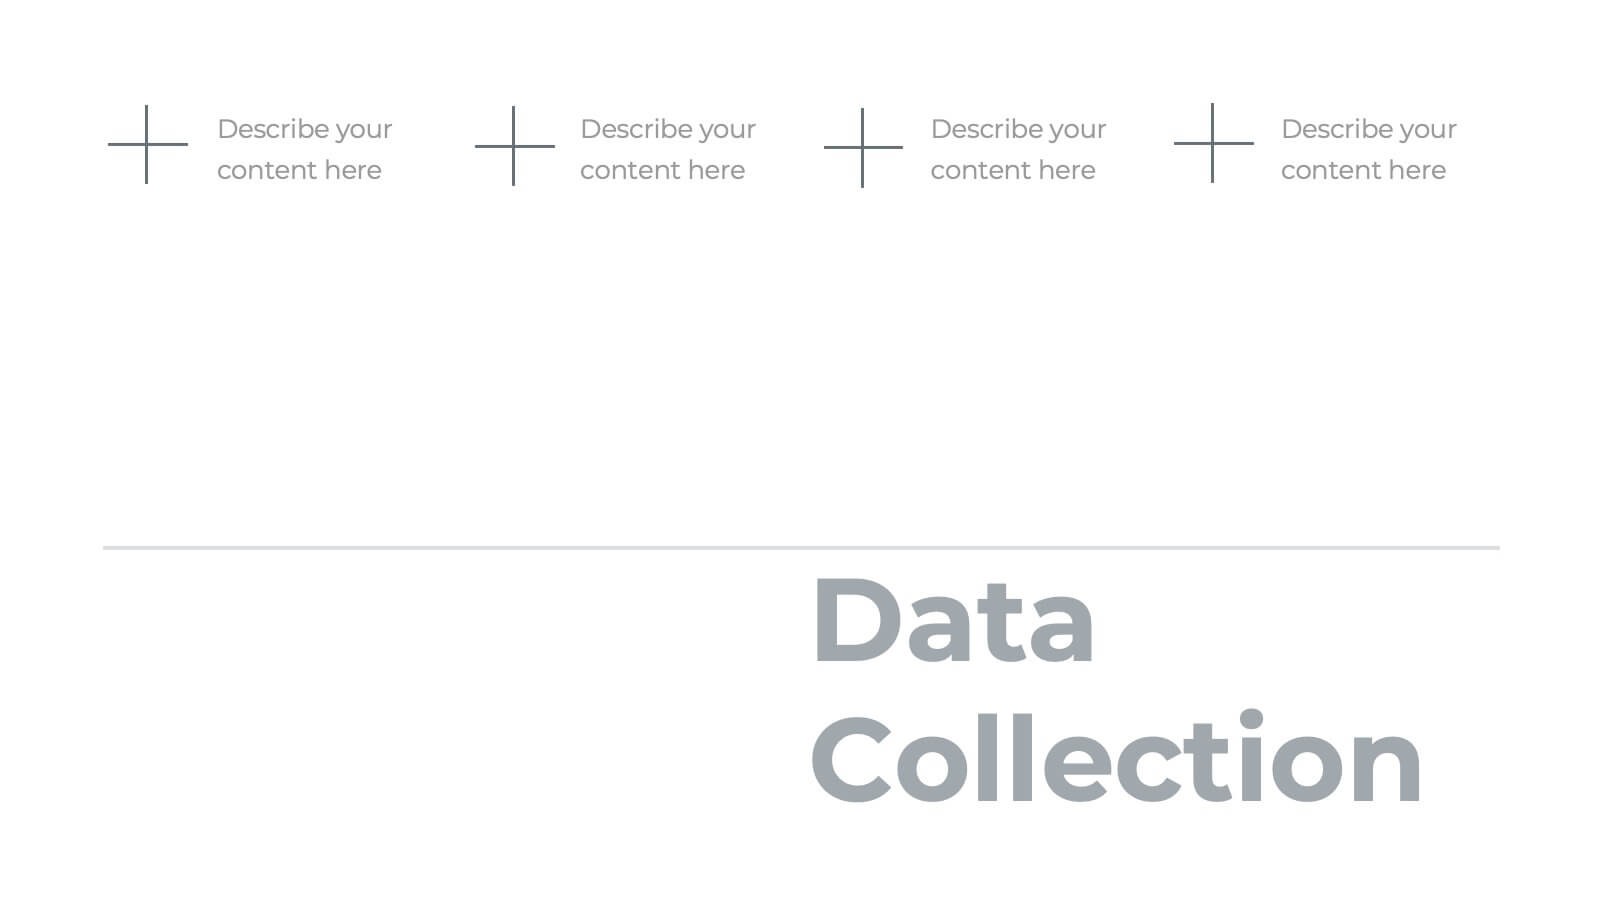
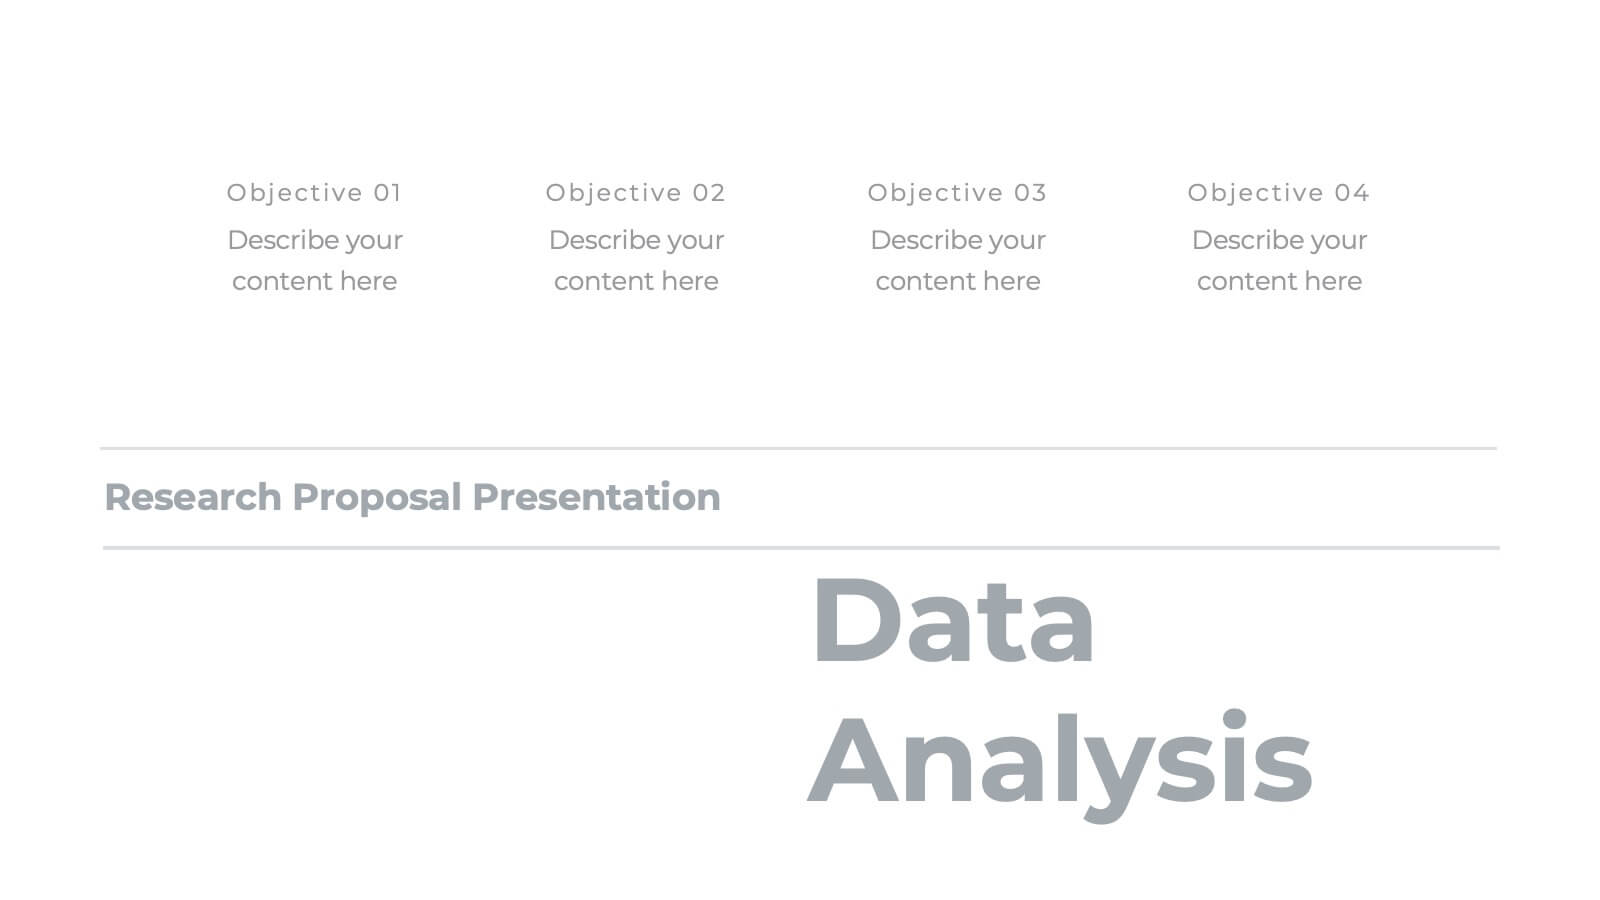
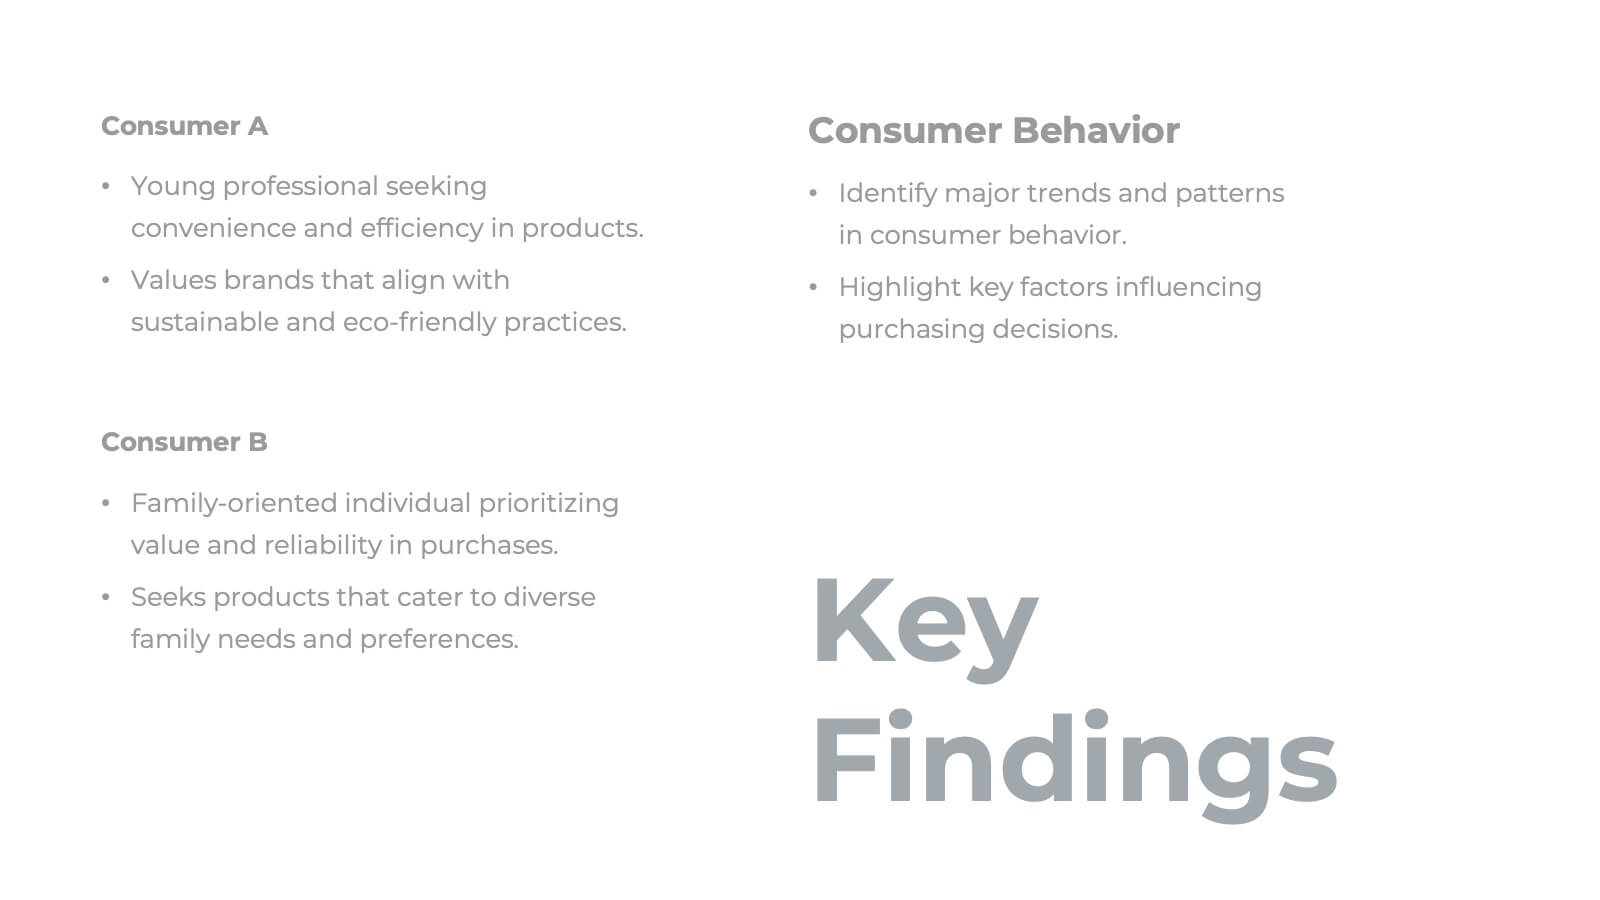
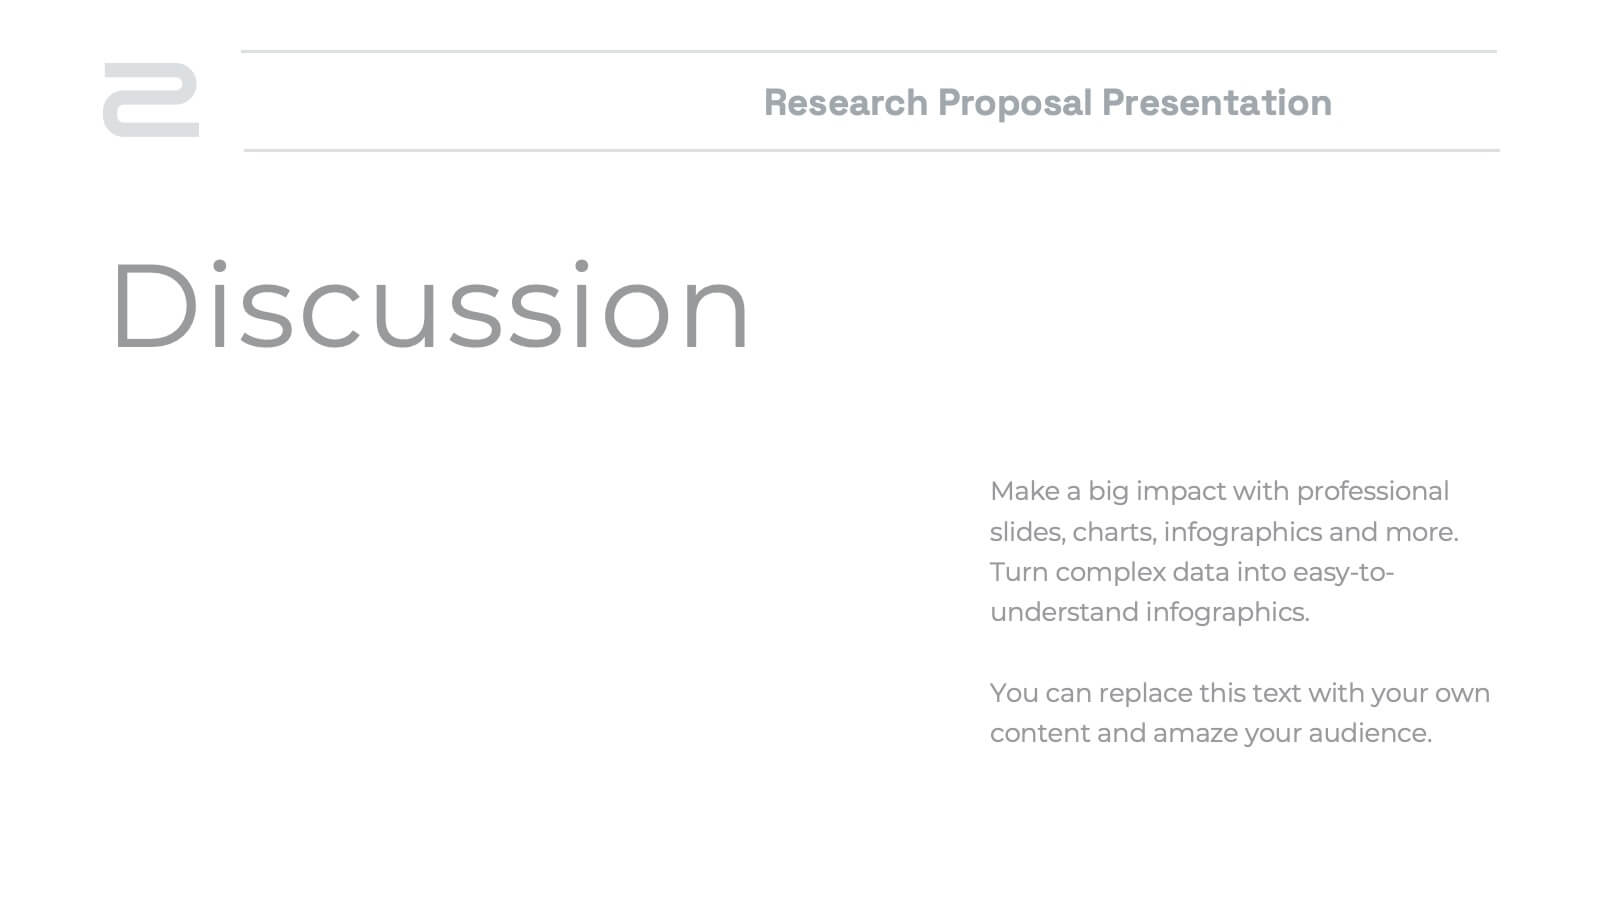
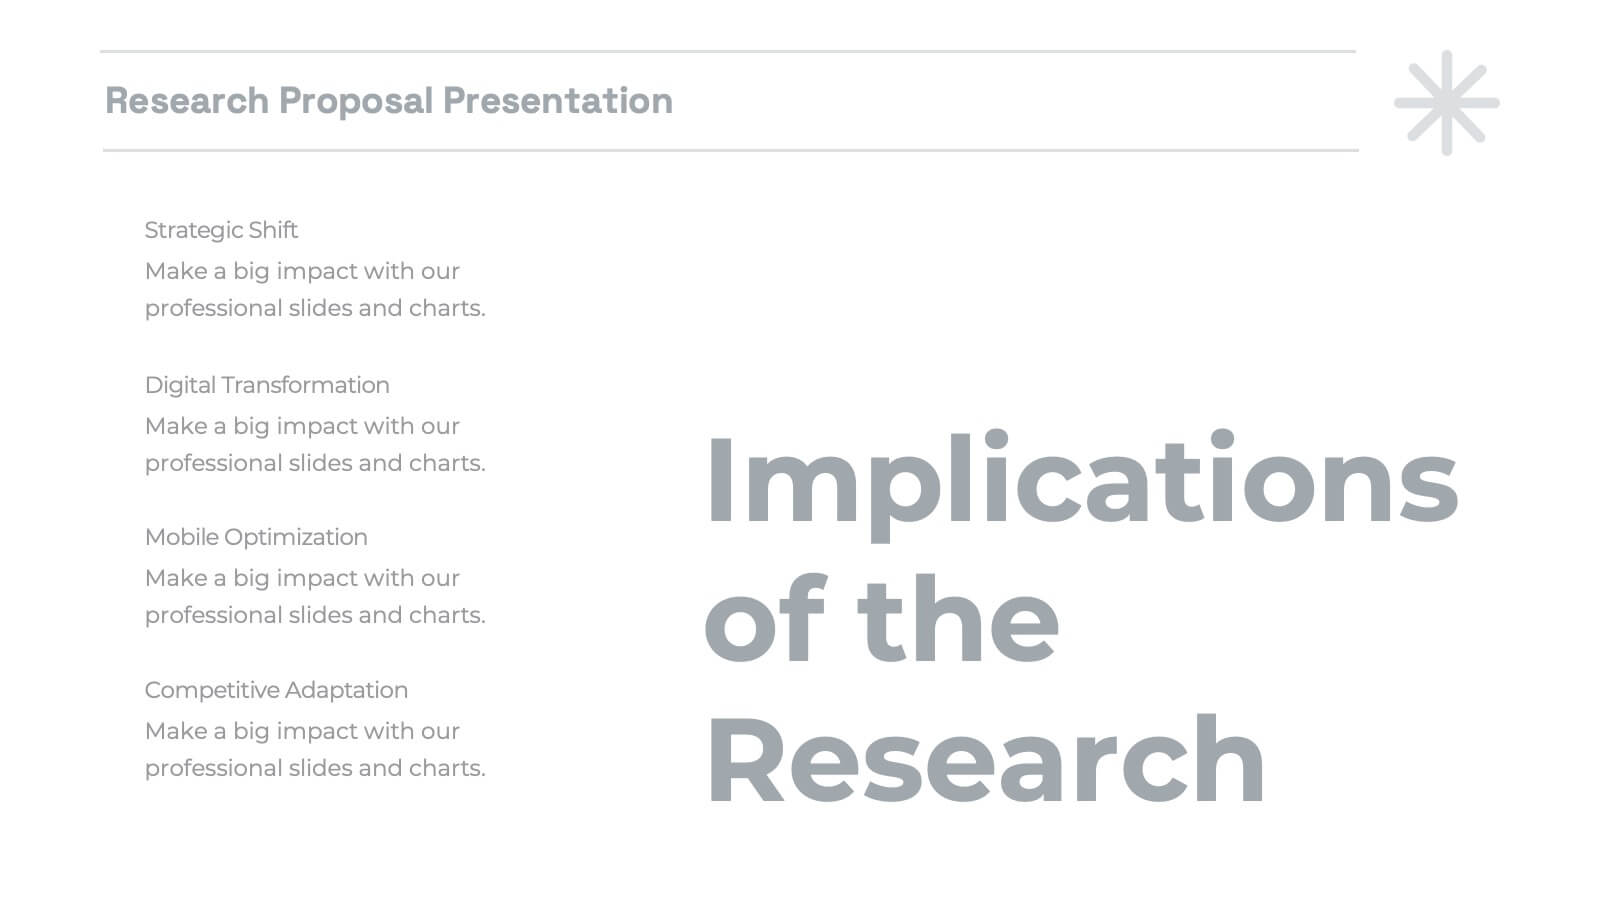
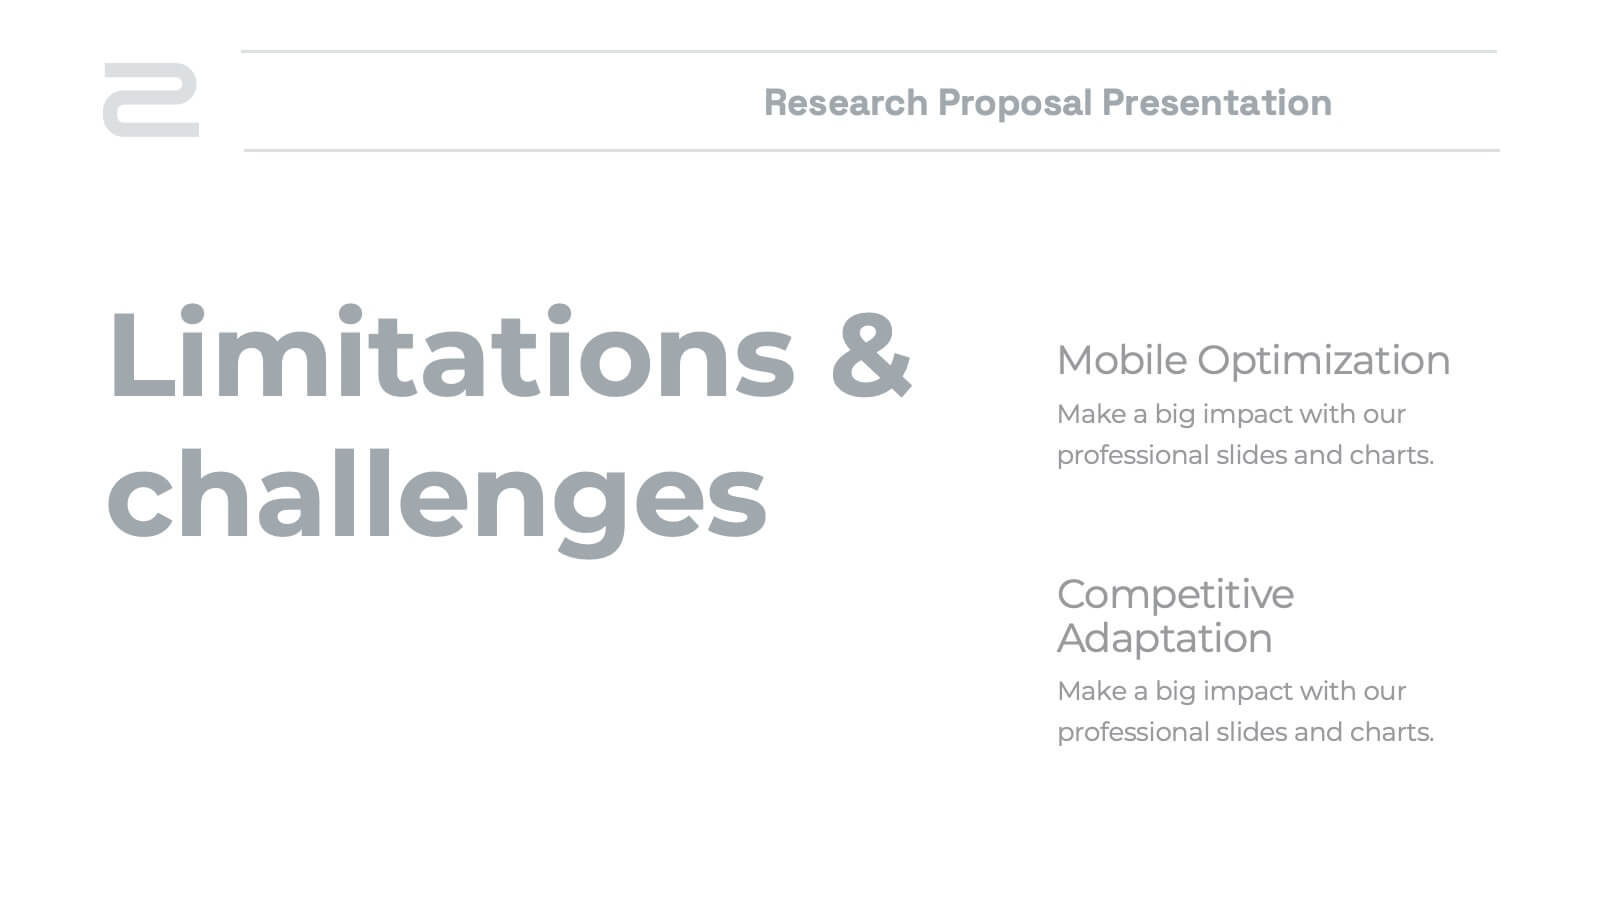
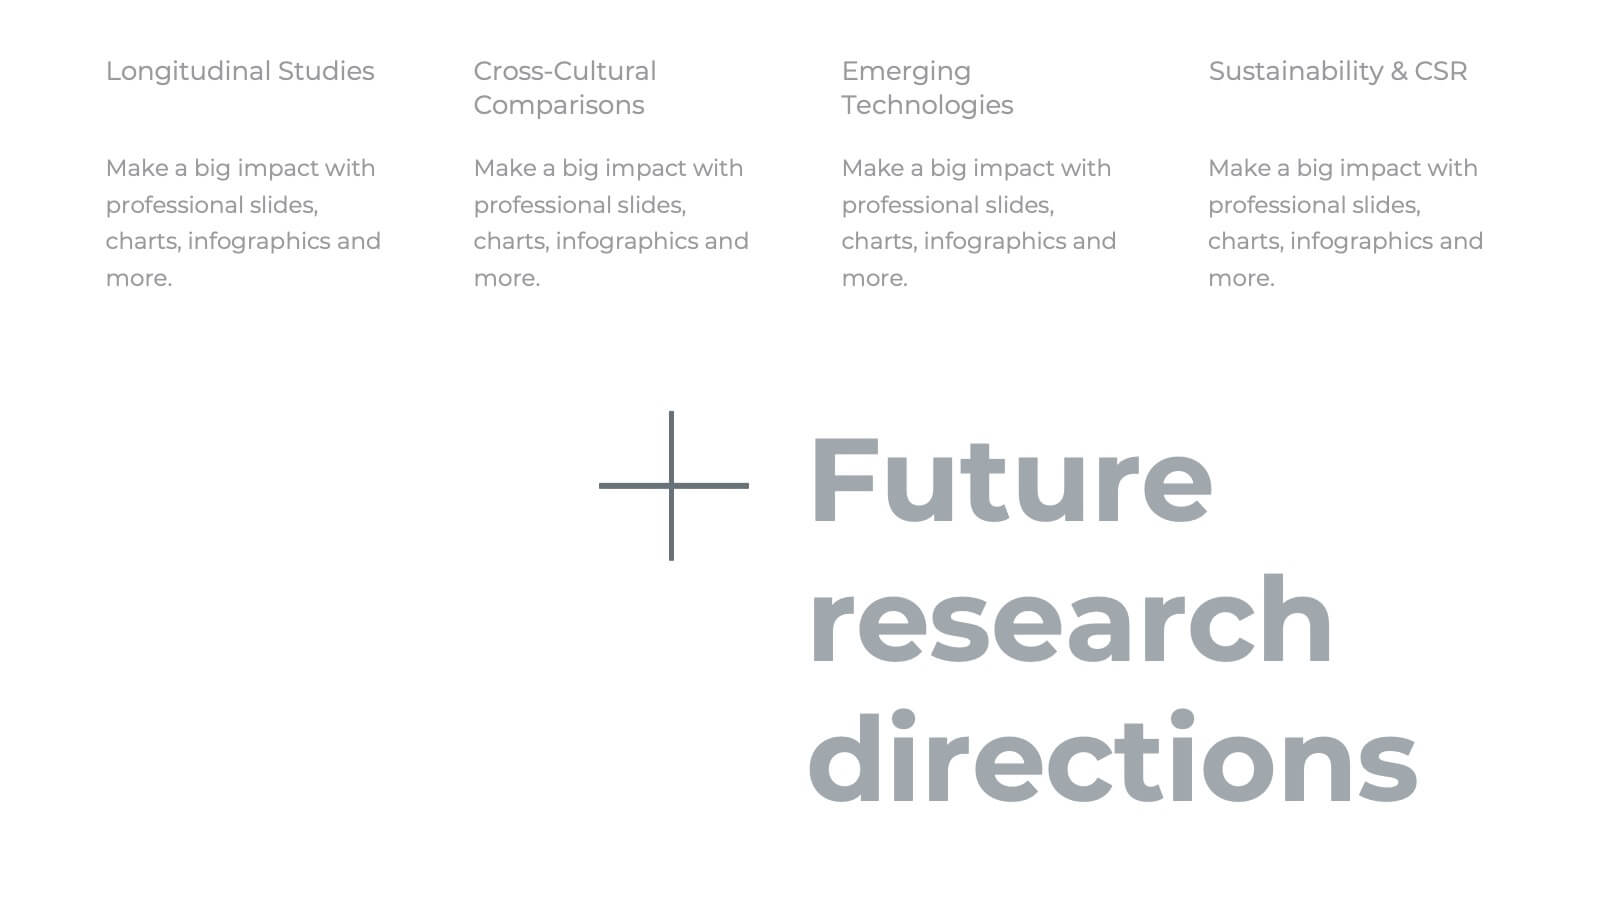
Malachite Research Proposal Presentation
Present your research findings with clarity and professionalism using this structured research presentation template! Covering all essential elements, from research objectives and methodology to key findings and implications, this template ensures your work is communicated effectively. It's perfect for academic, corporate, or scientific presentations. Compatible with PowerPoint, Keynote, and Google Slides, it's versatile and ready for your next project.
23 diapositivas
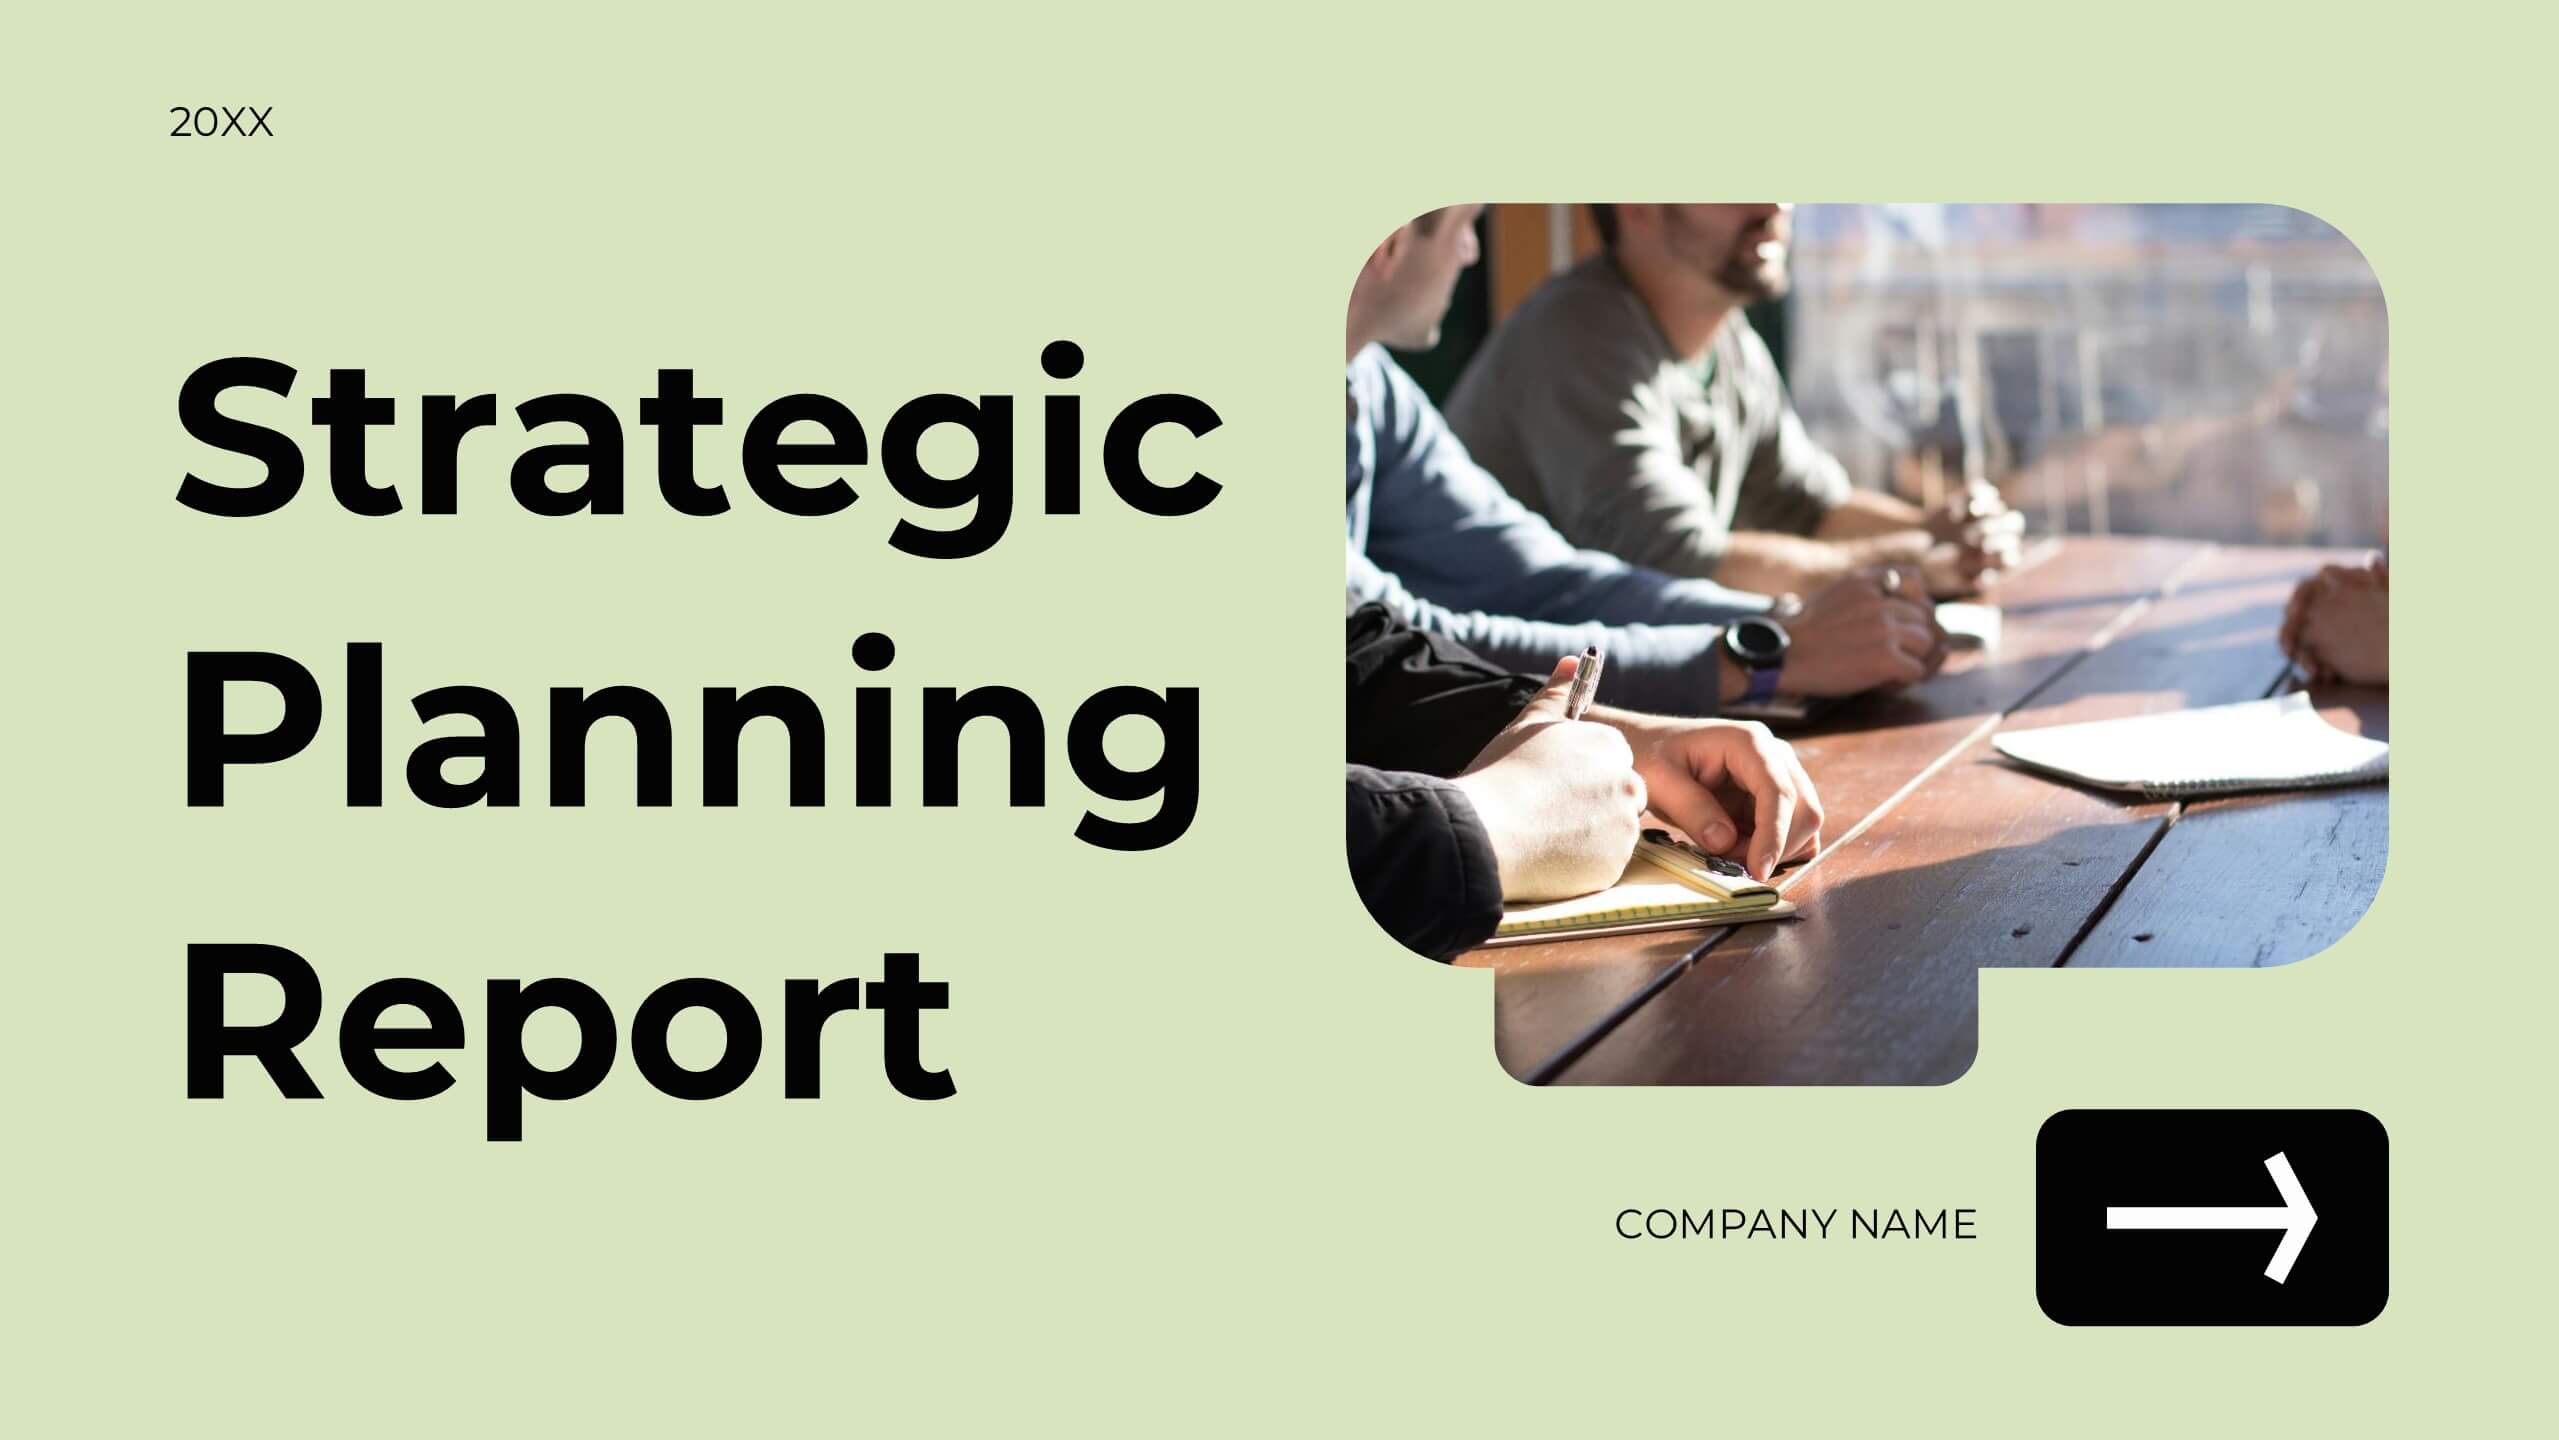
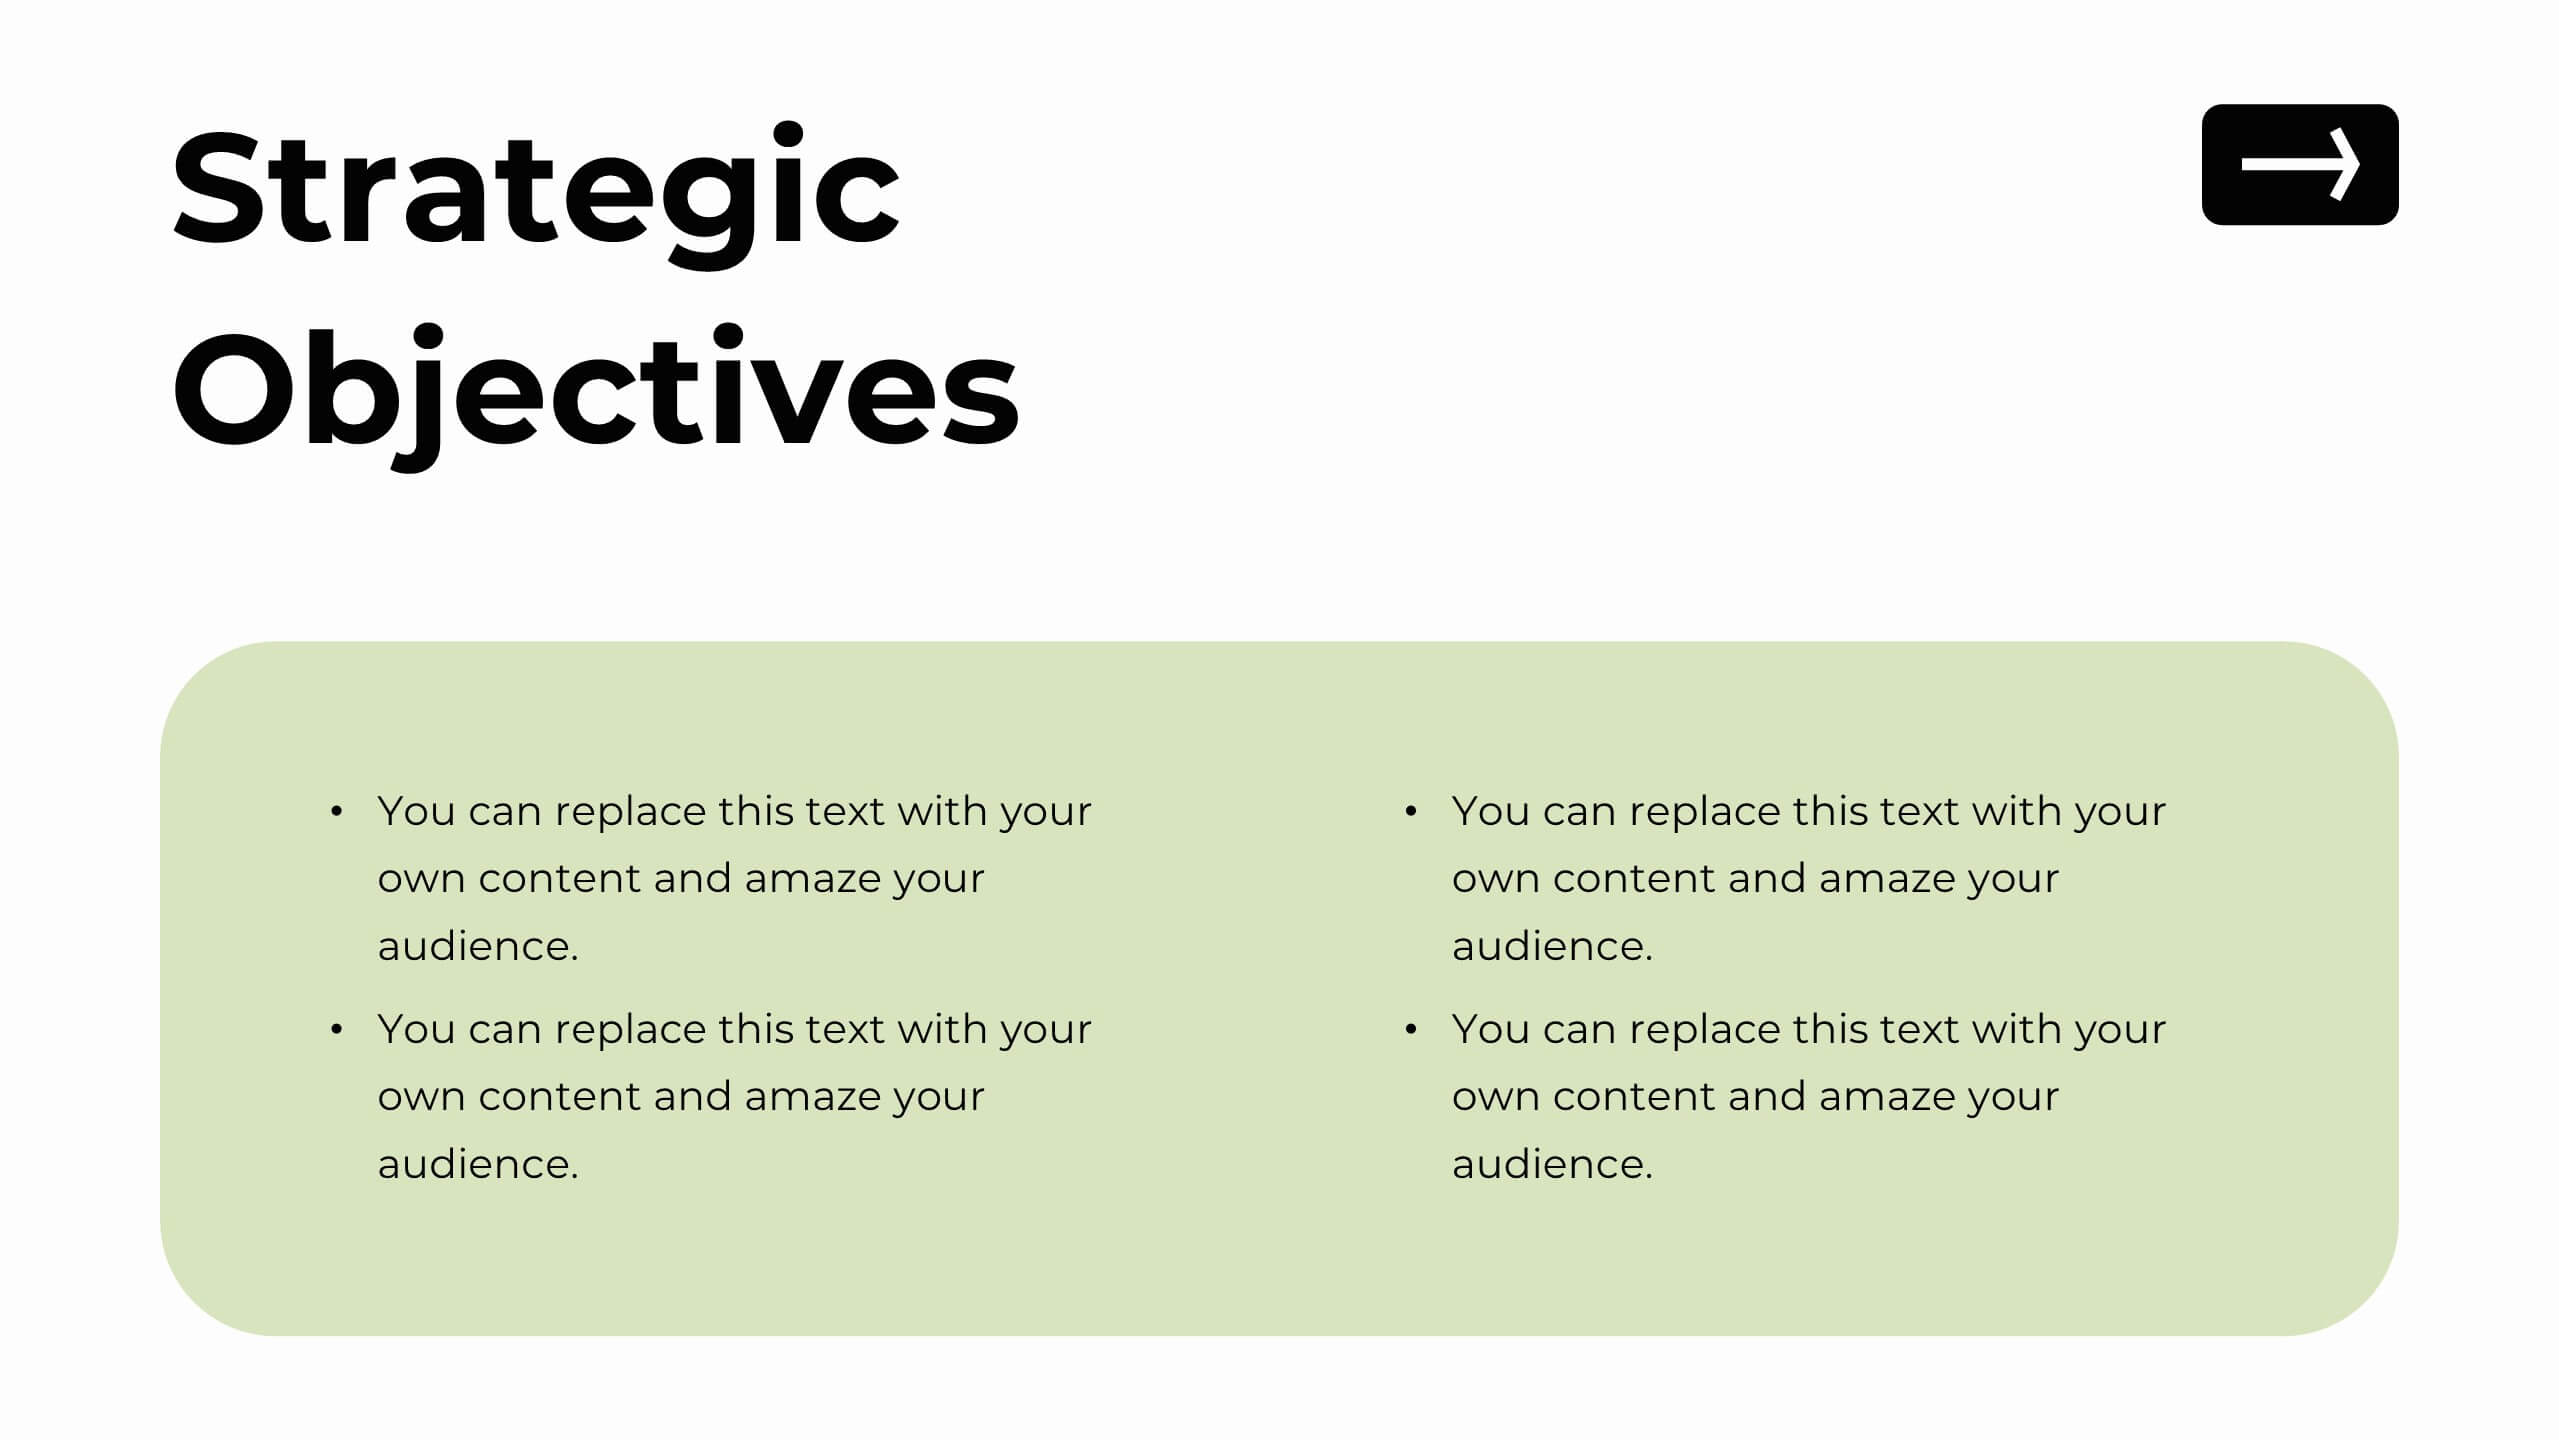
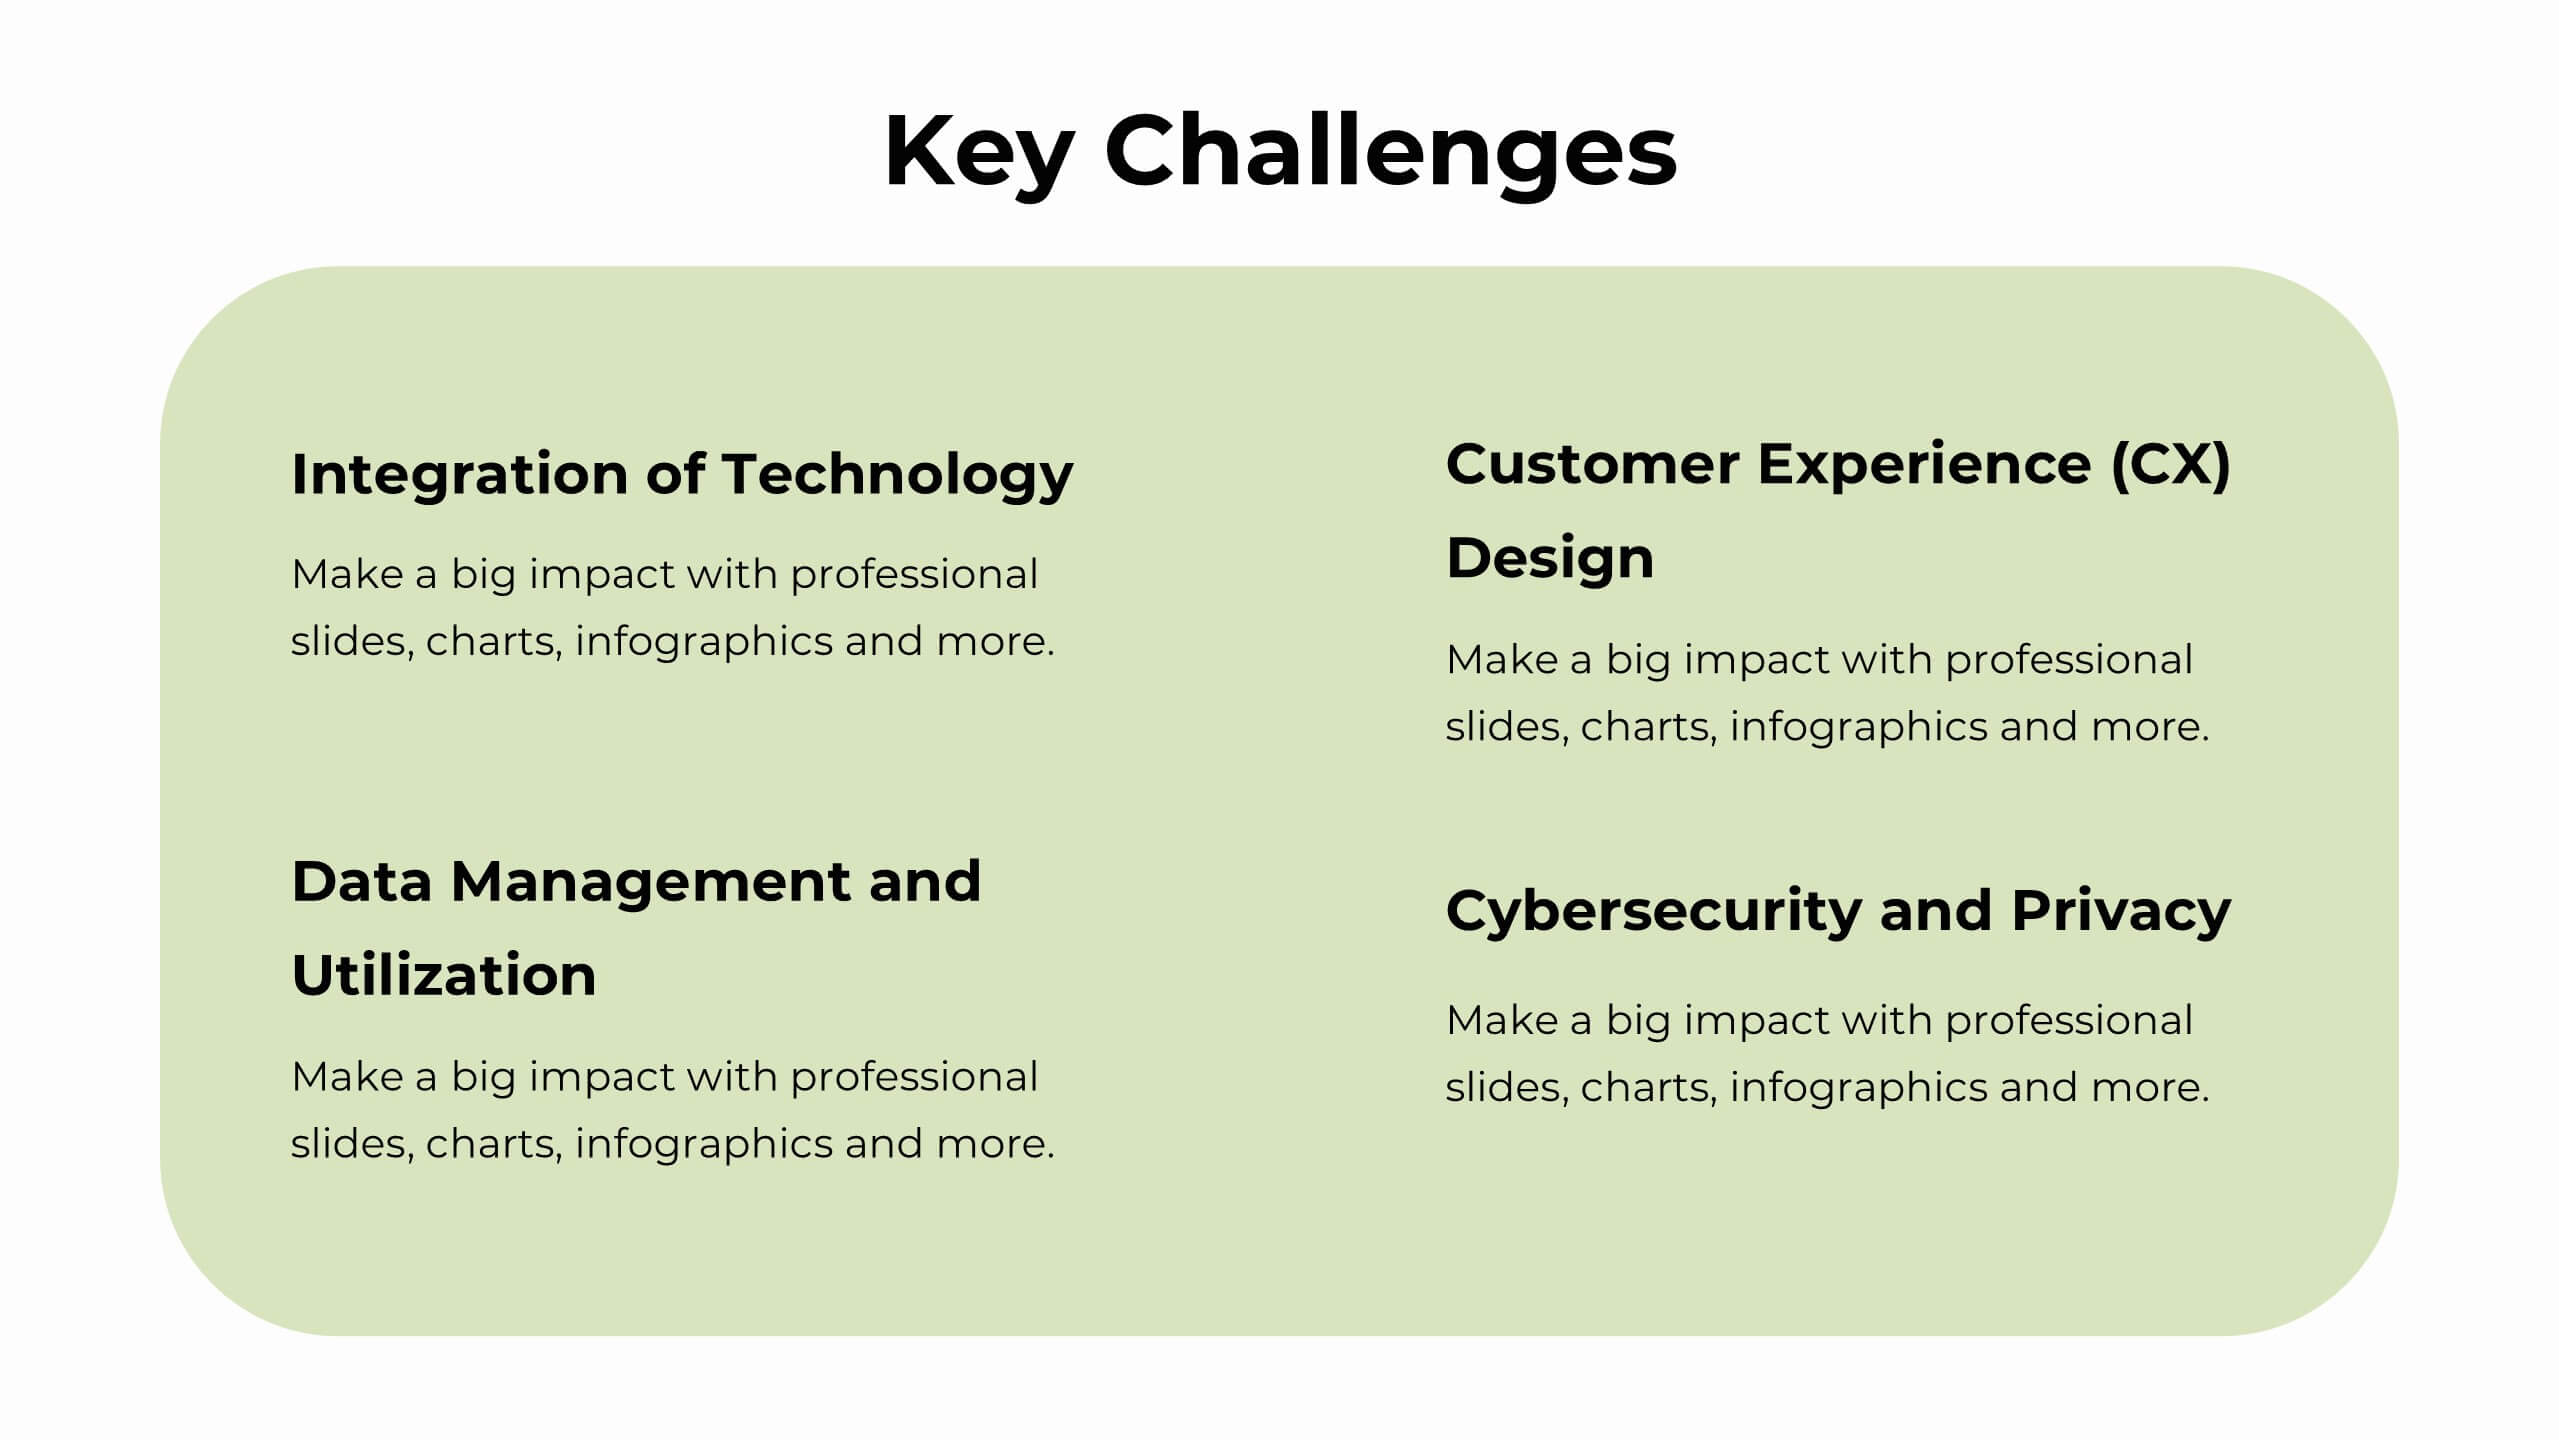
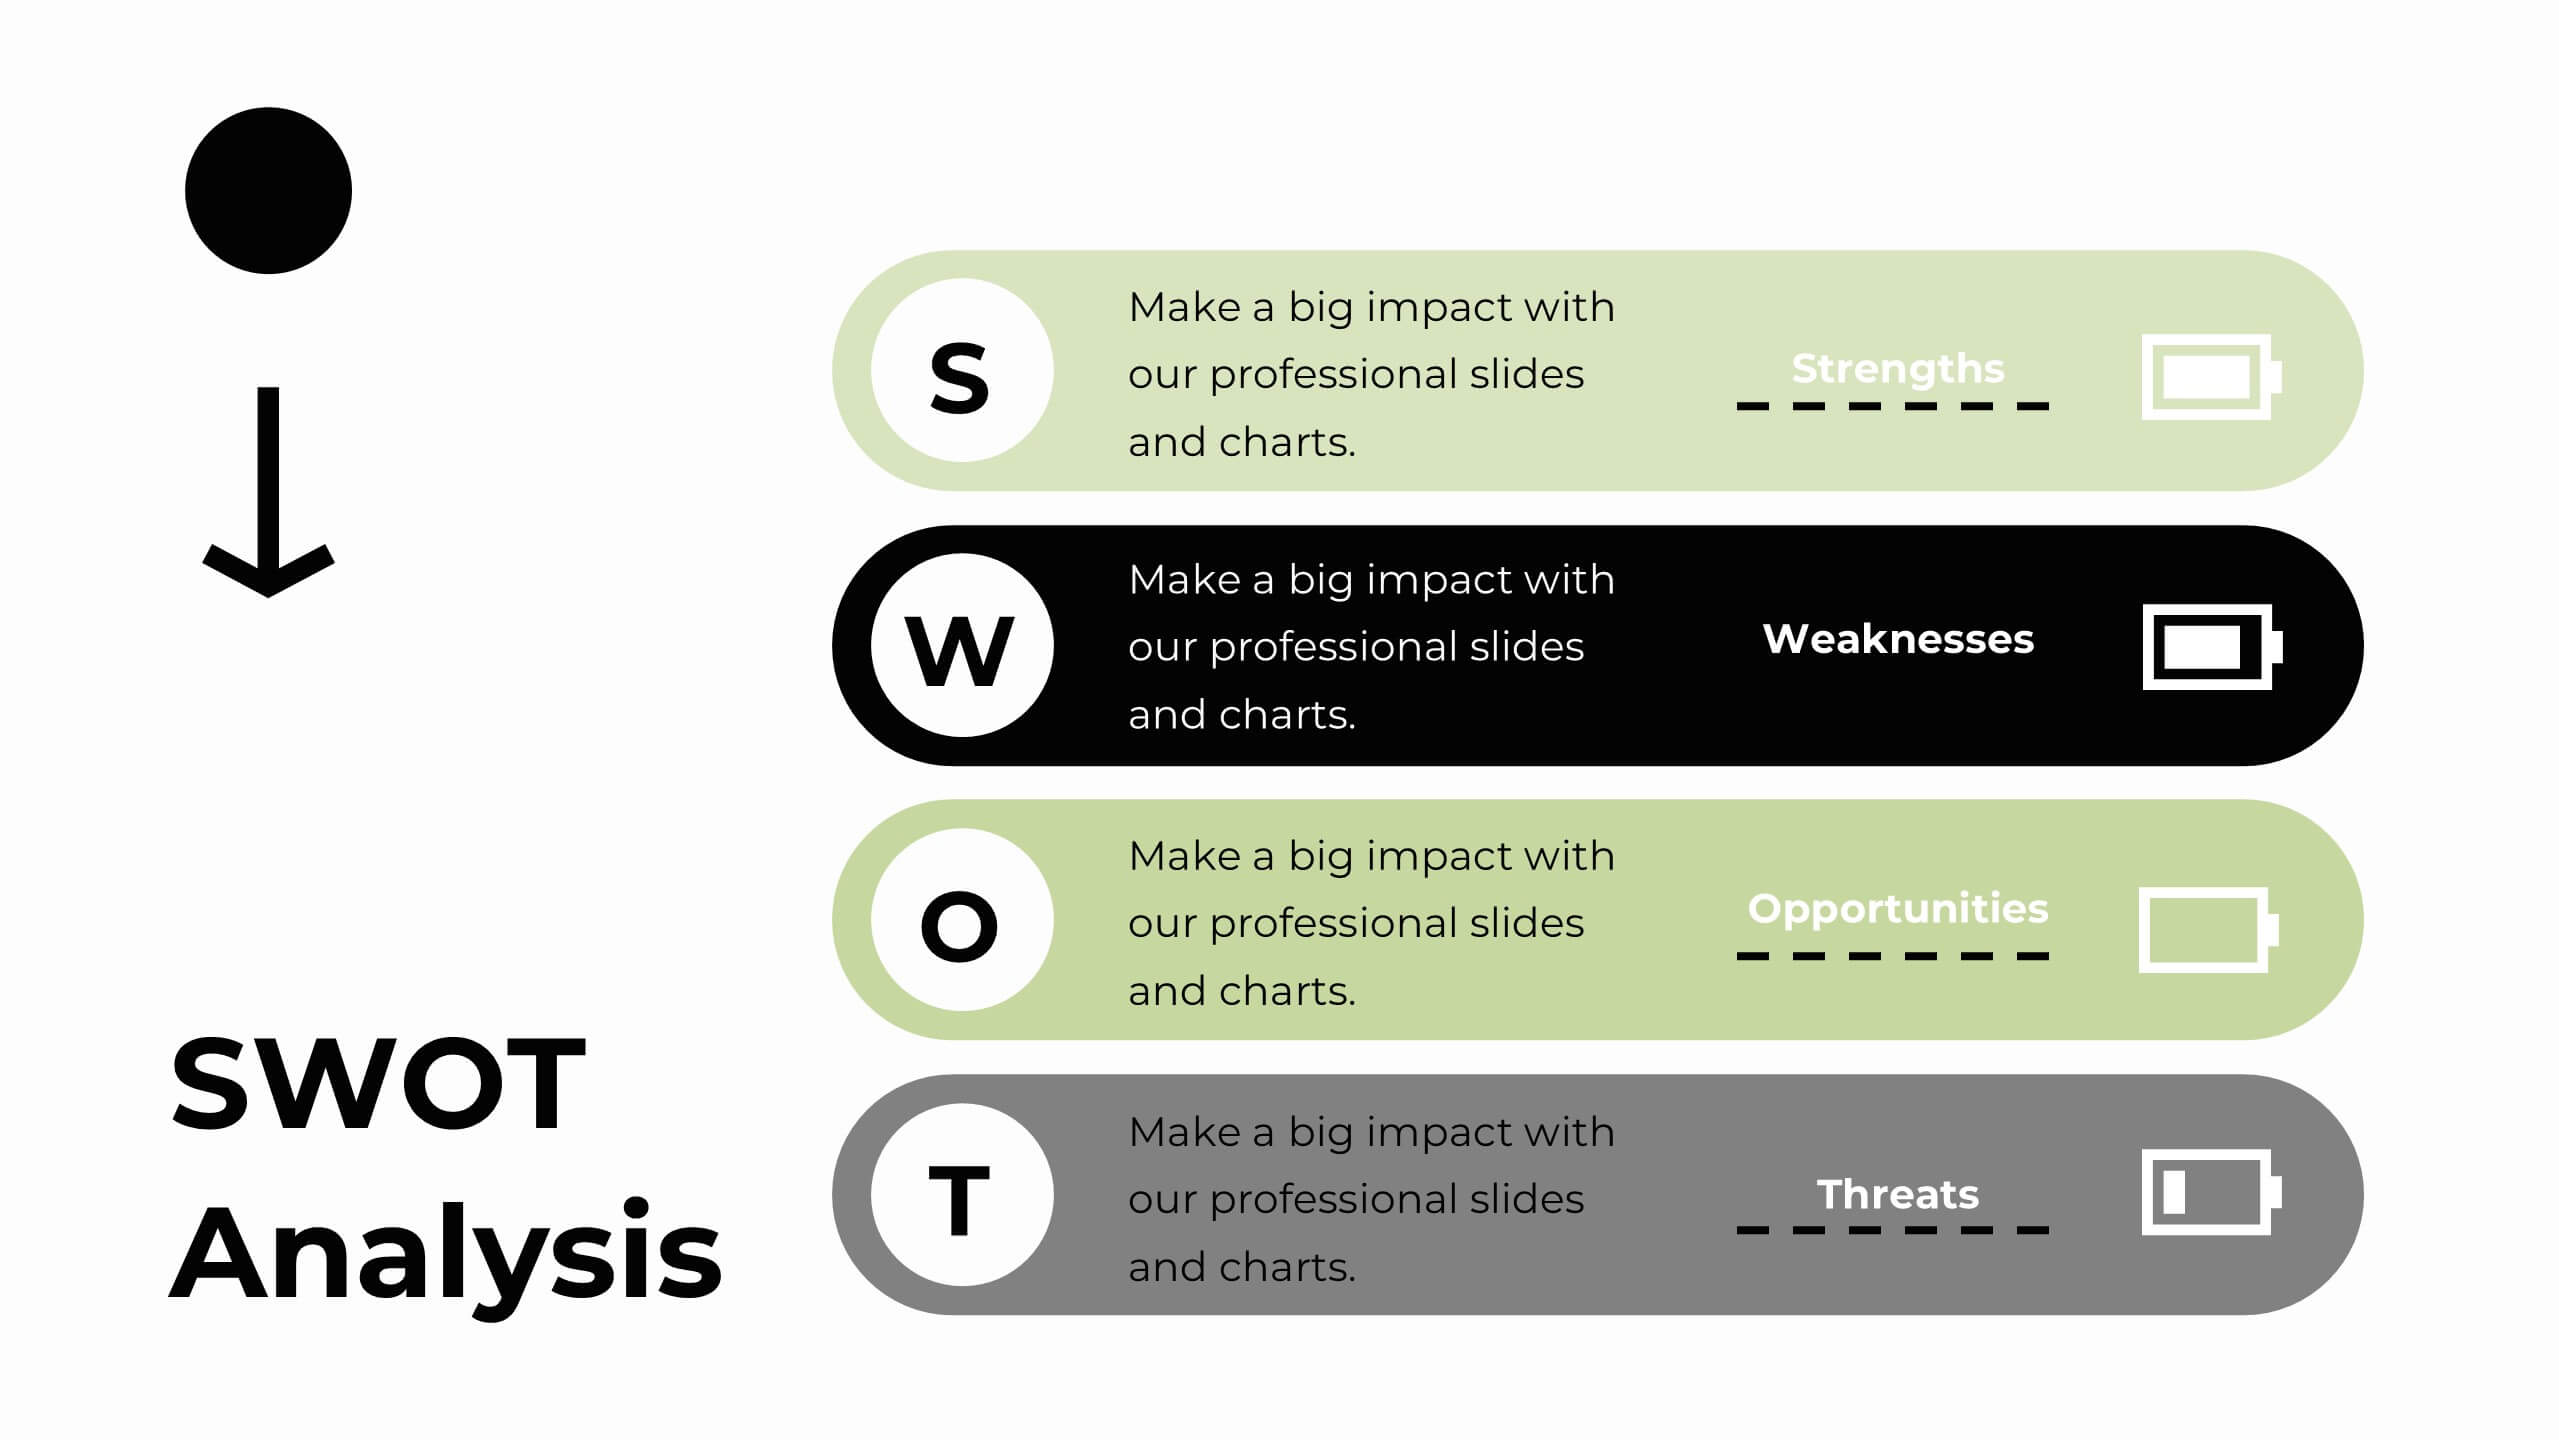
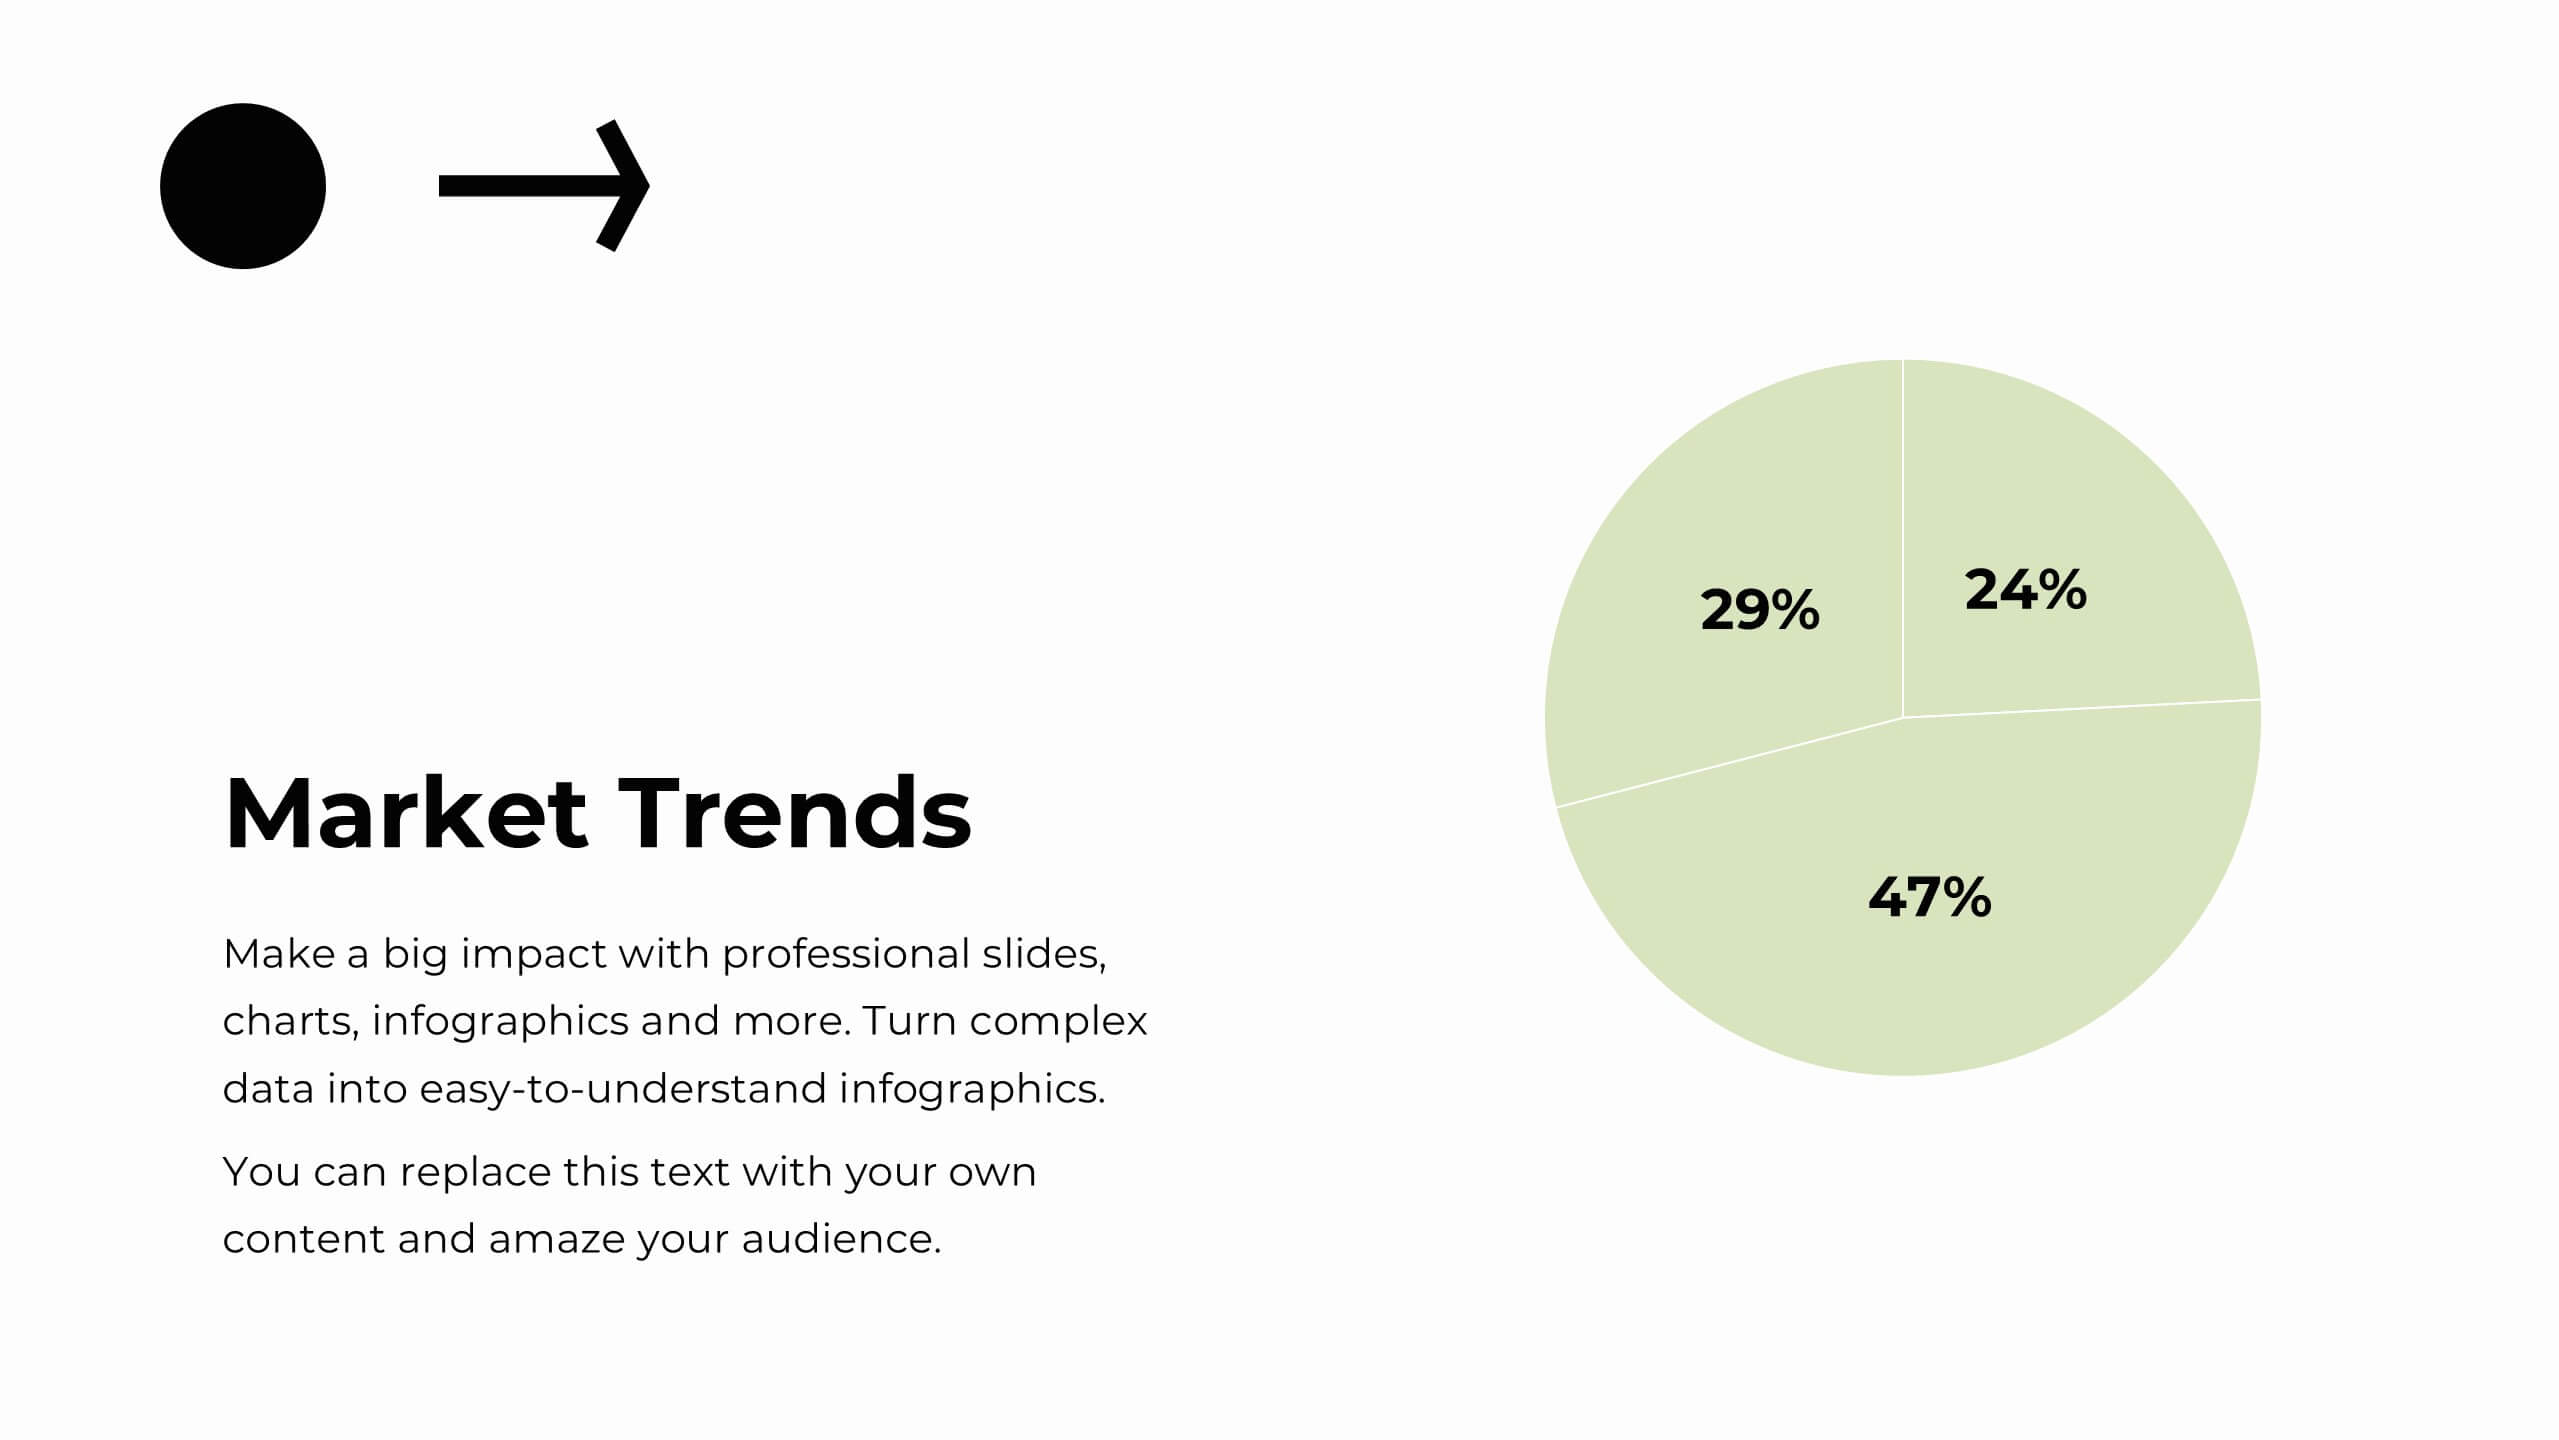
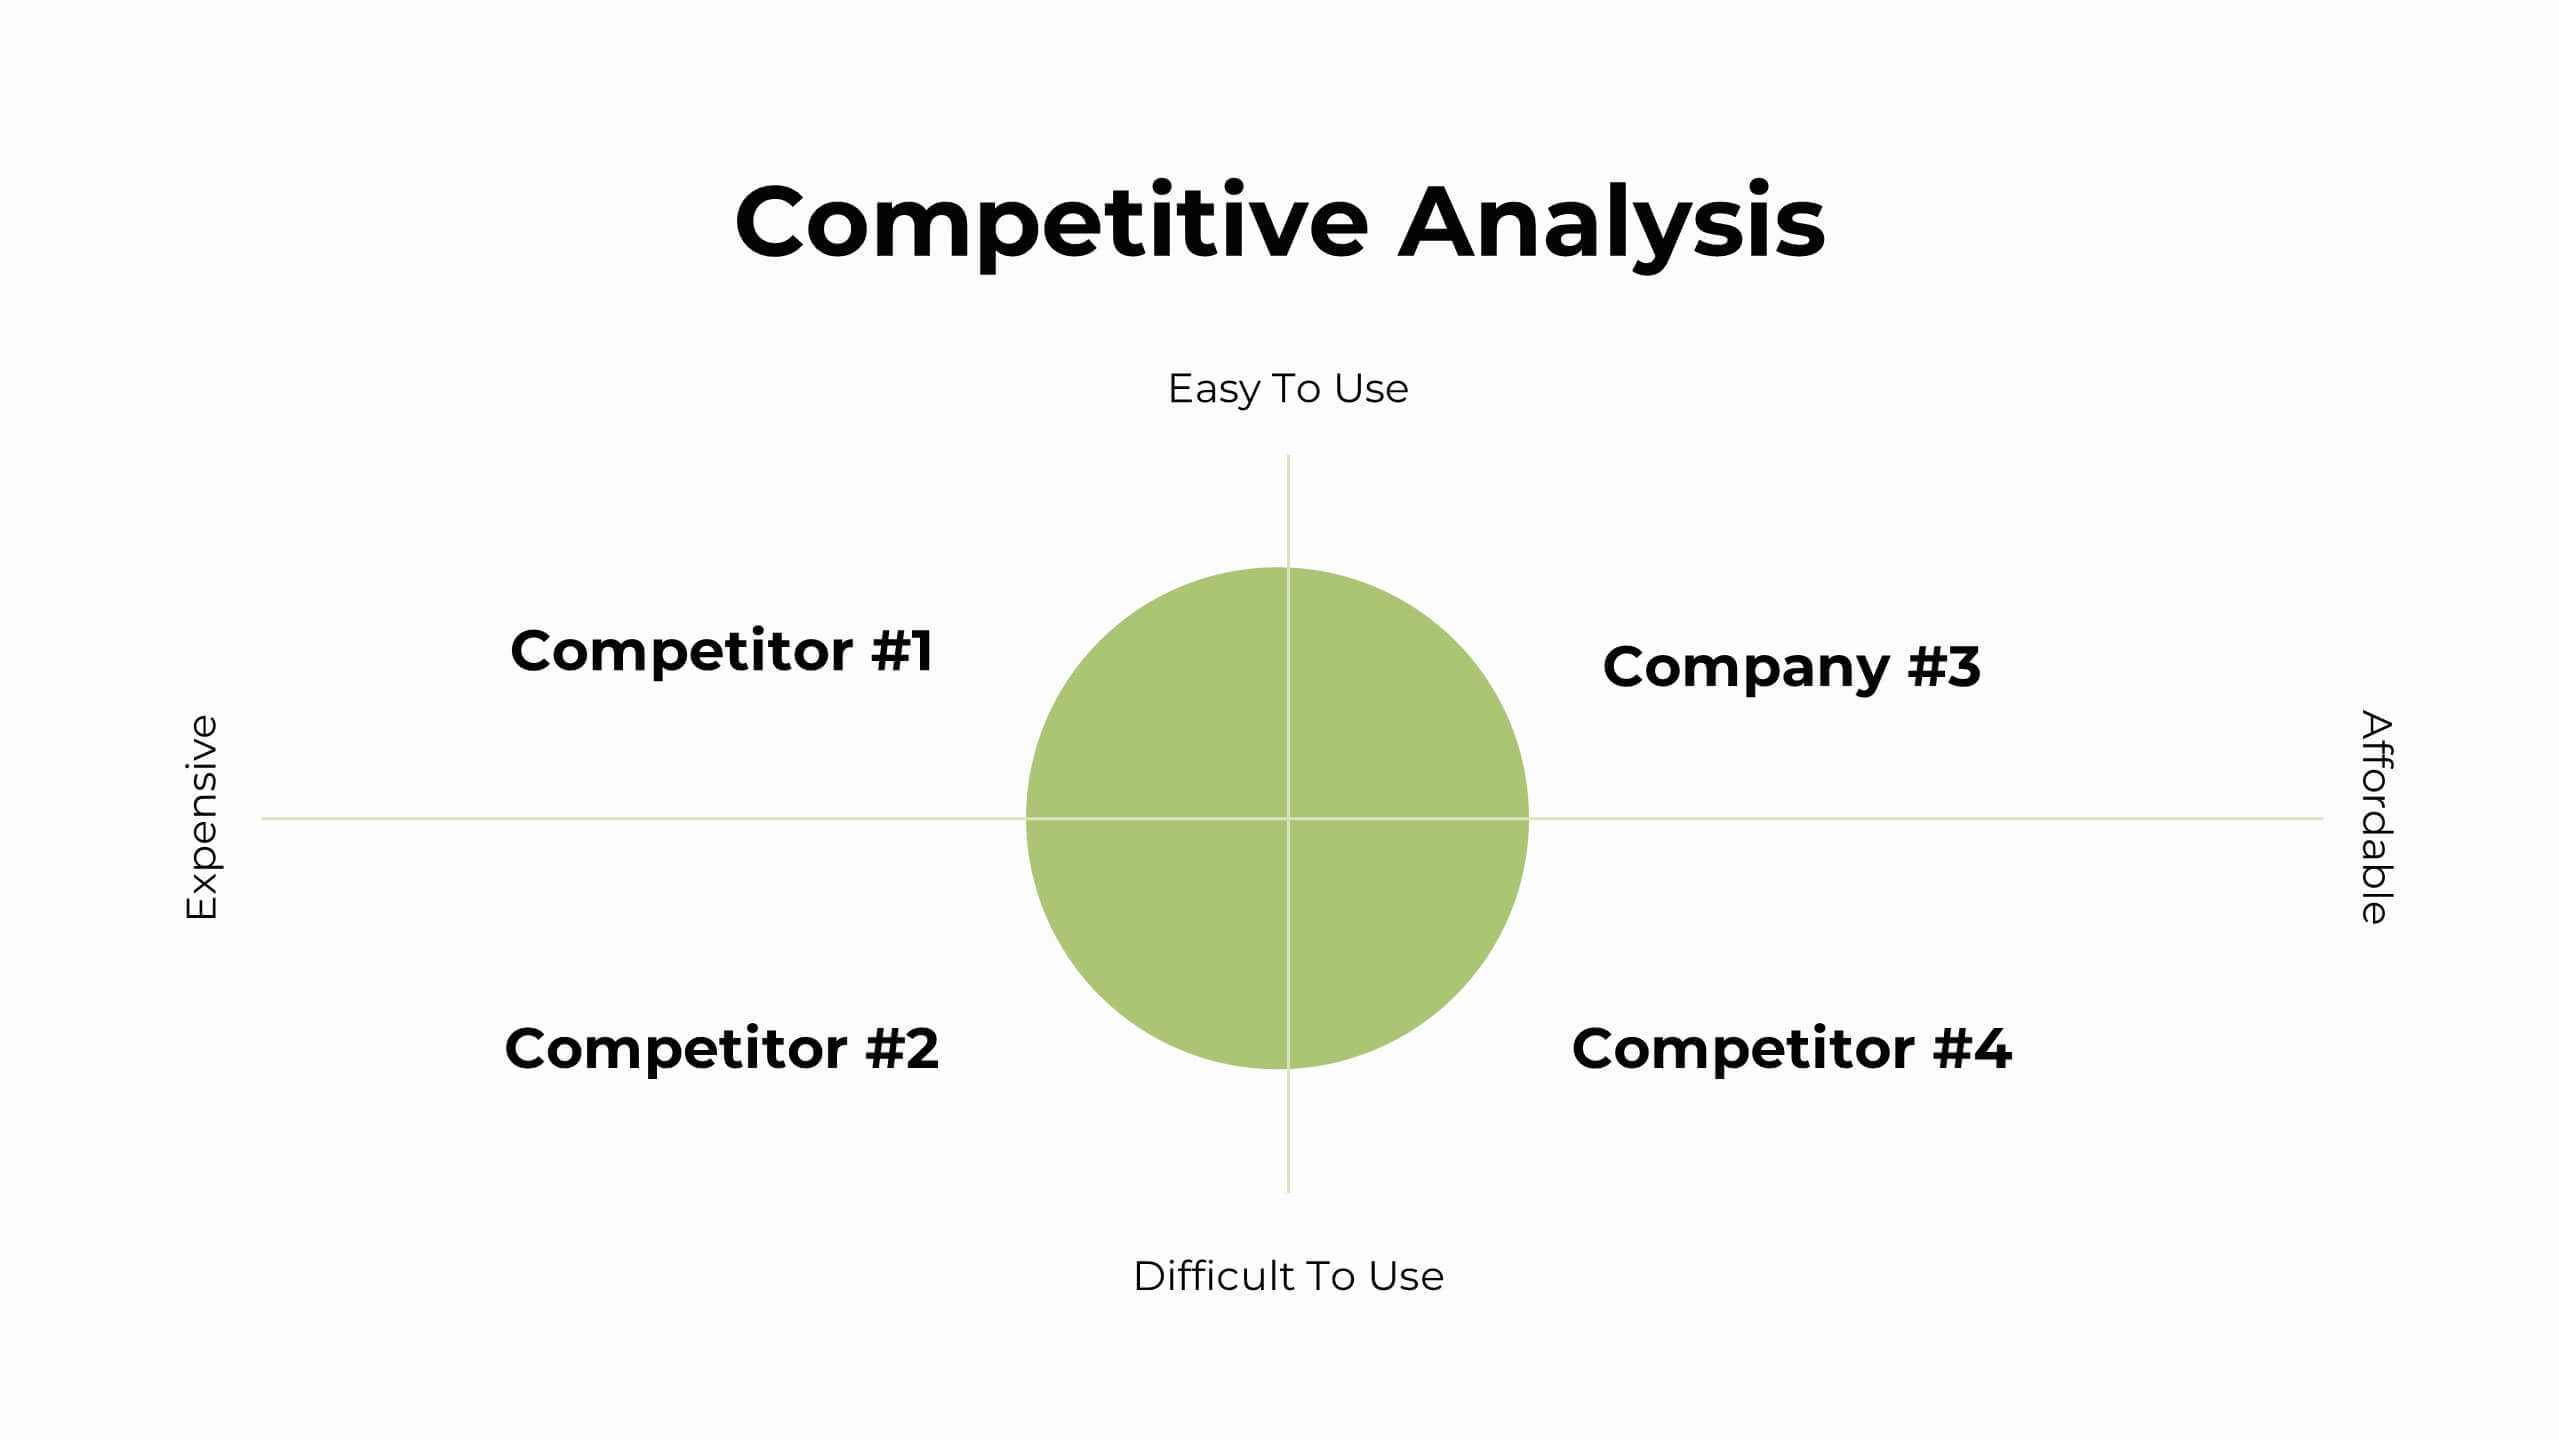
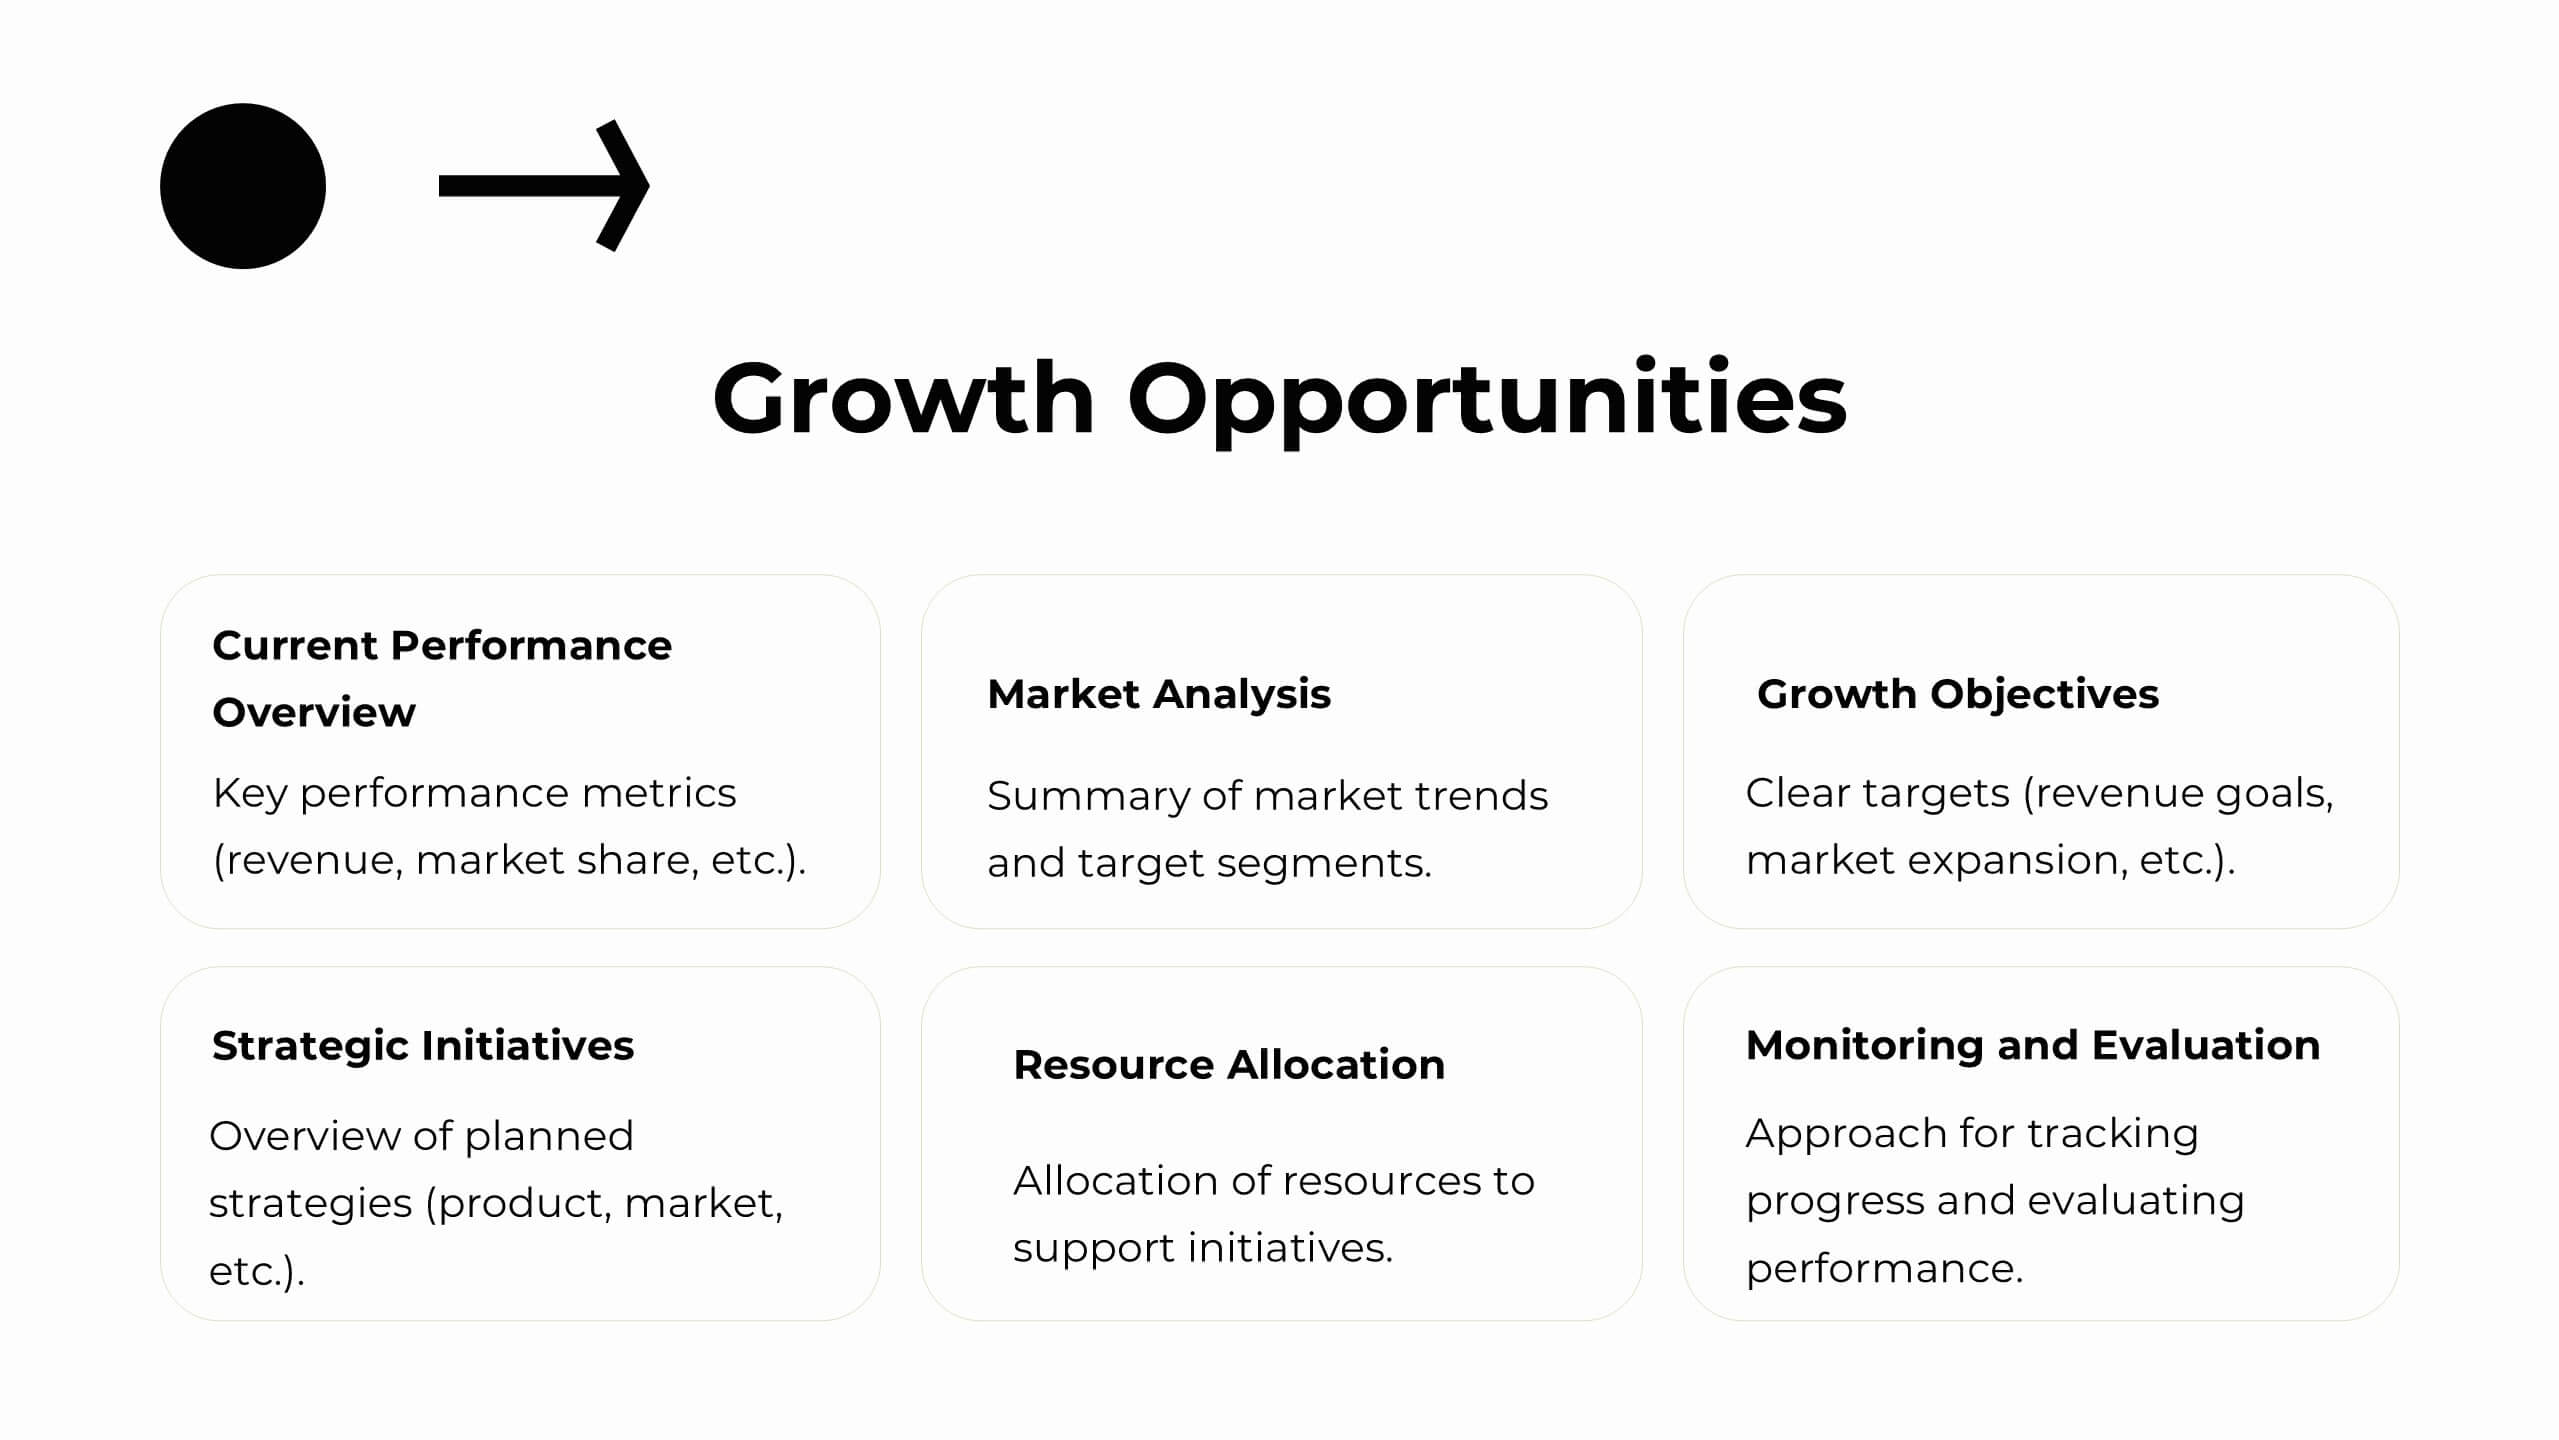
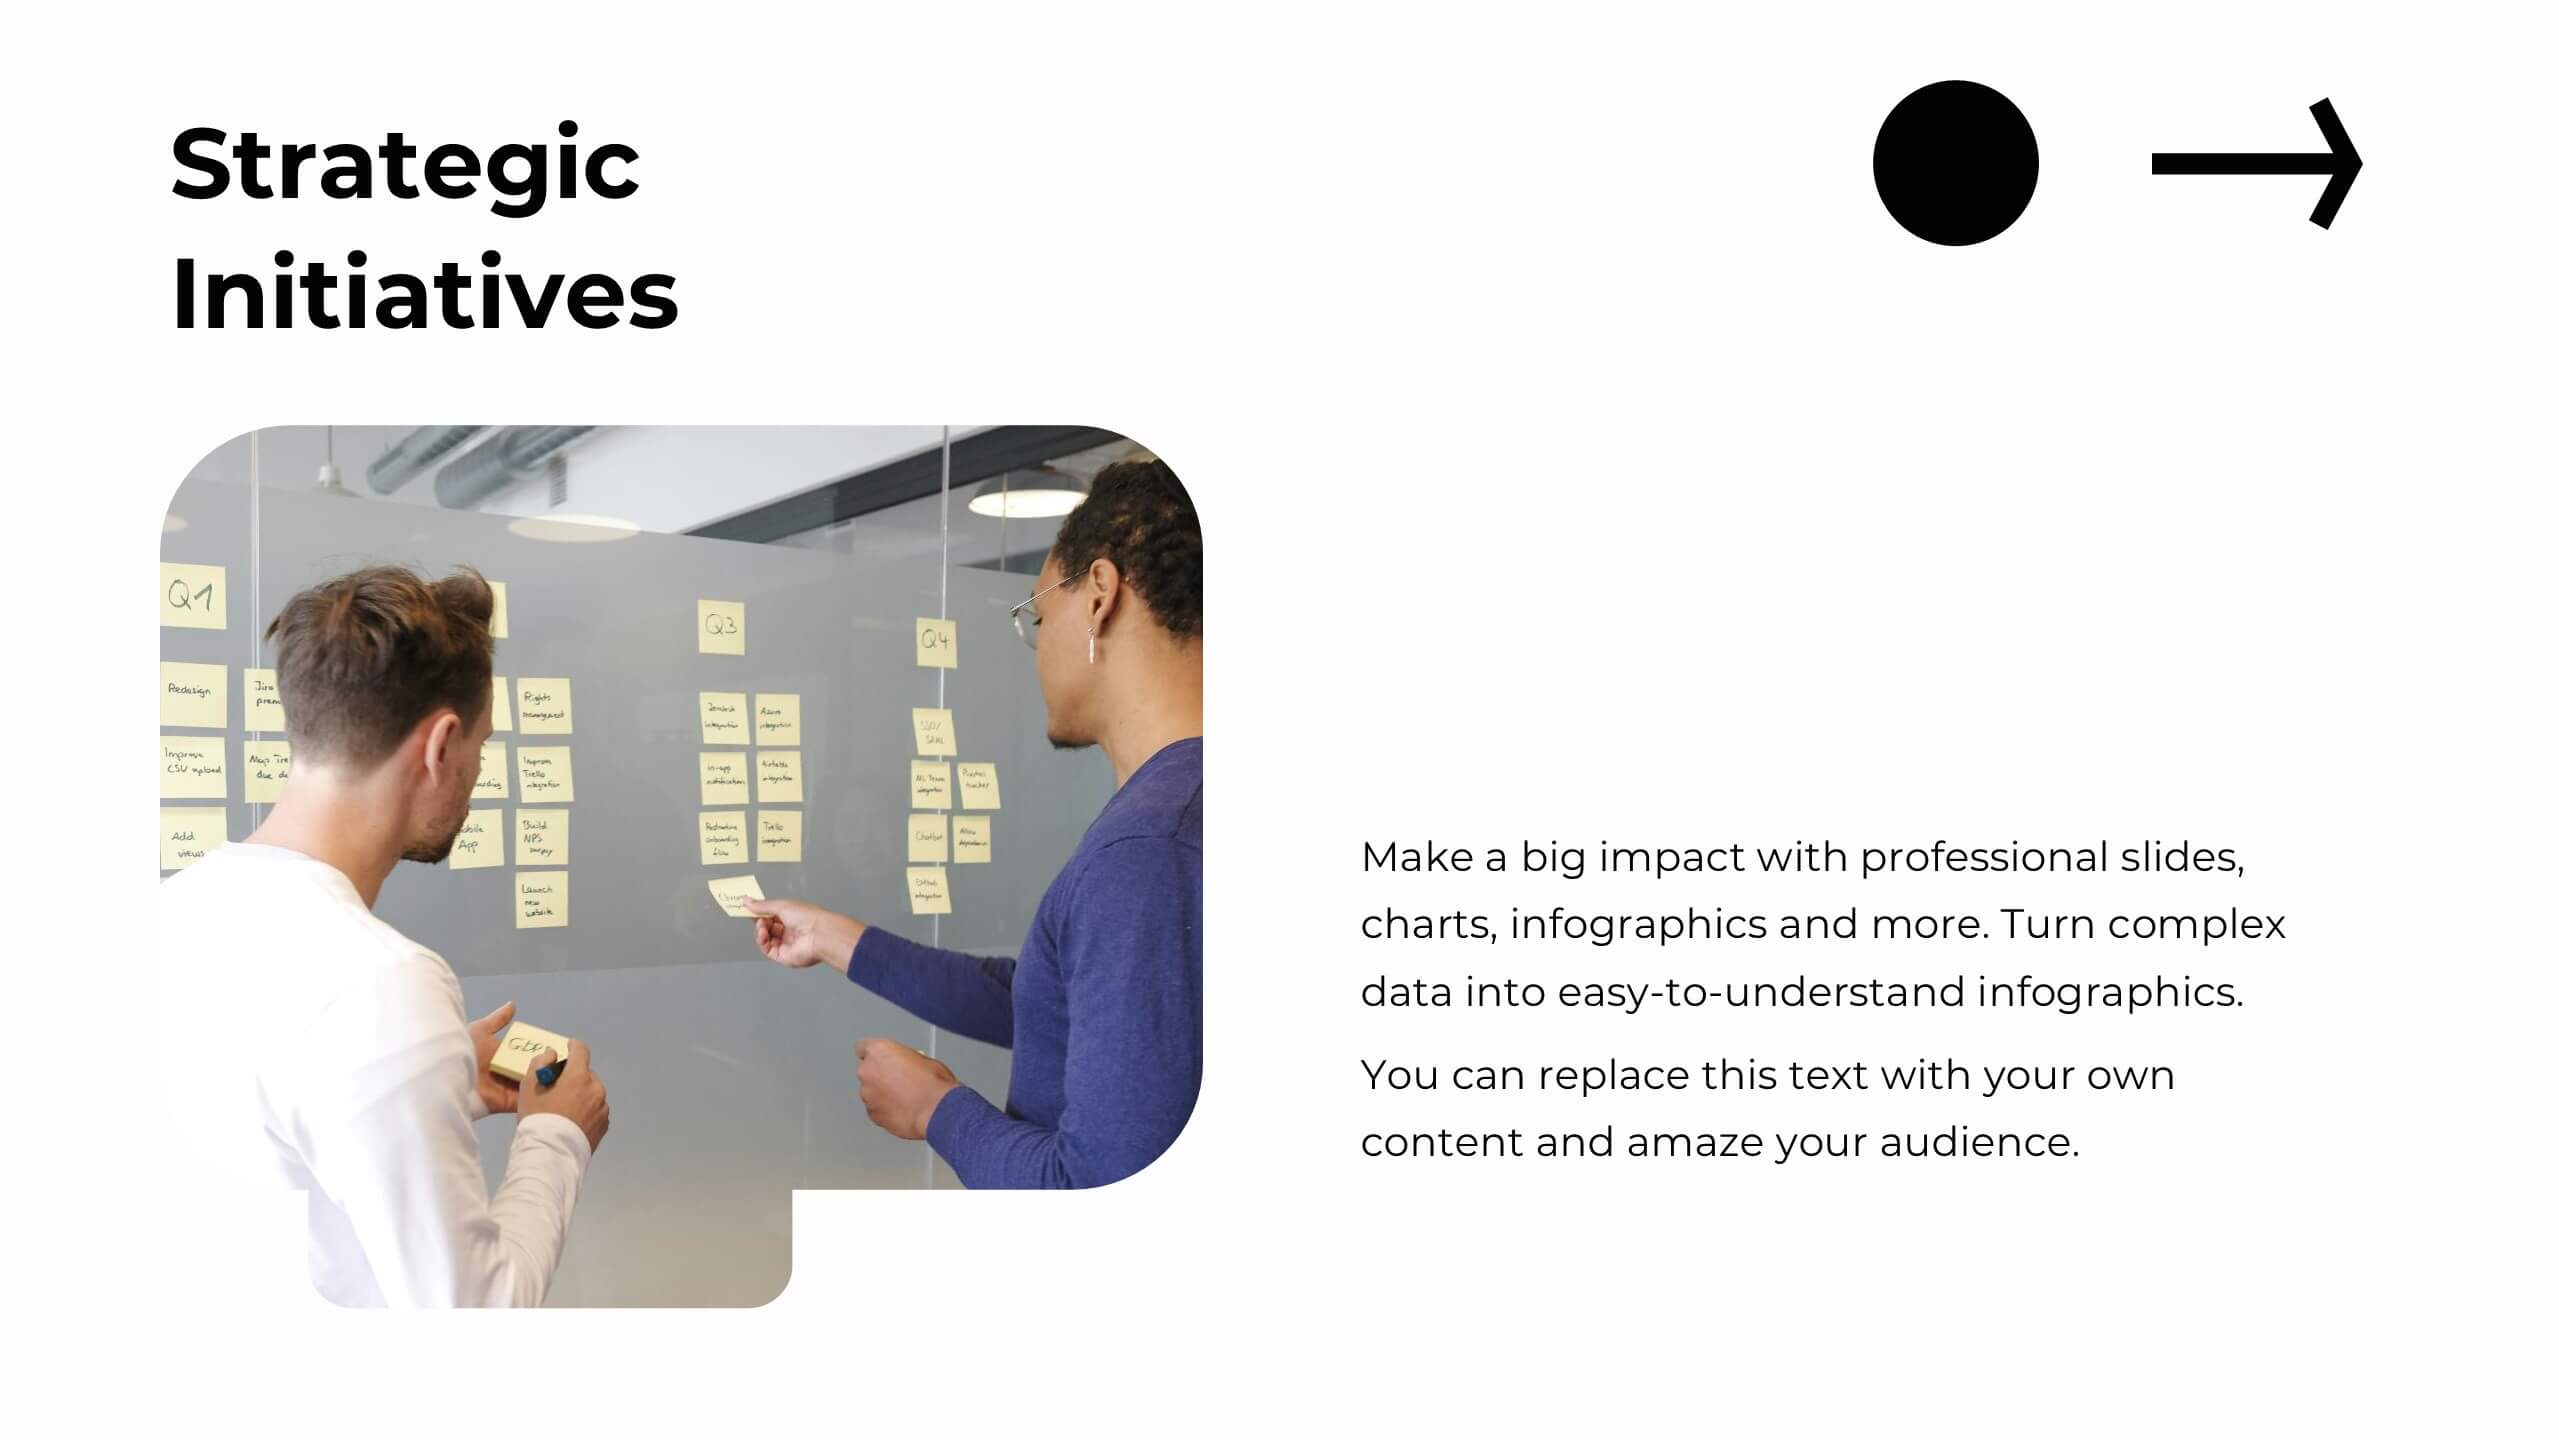
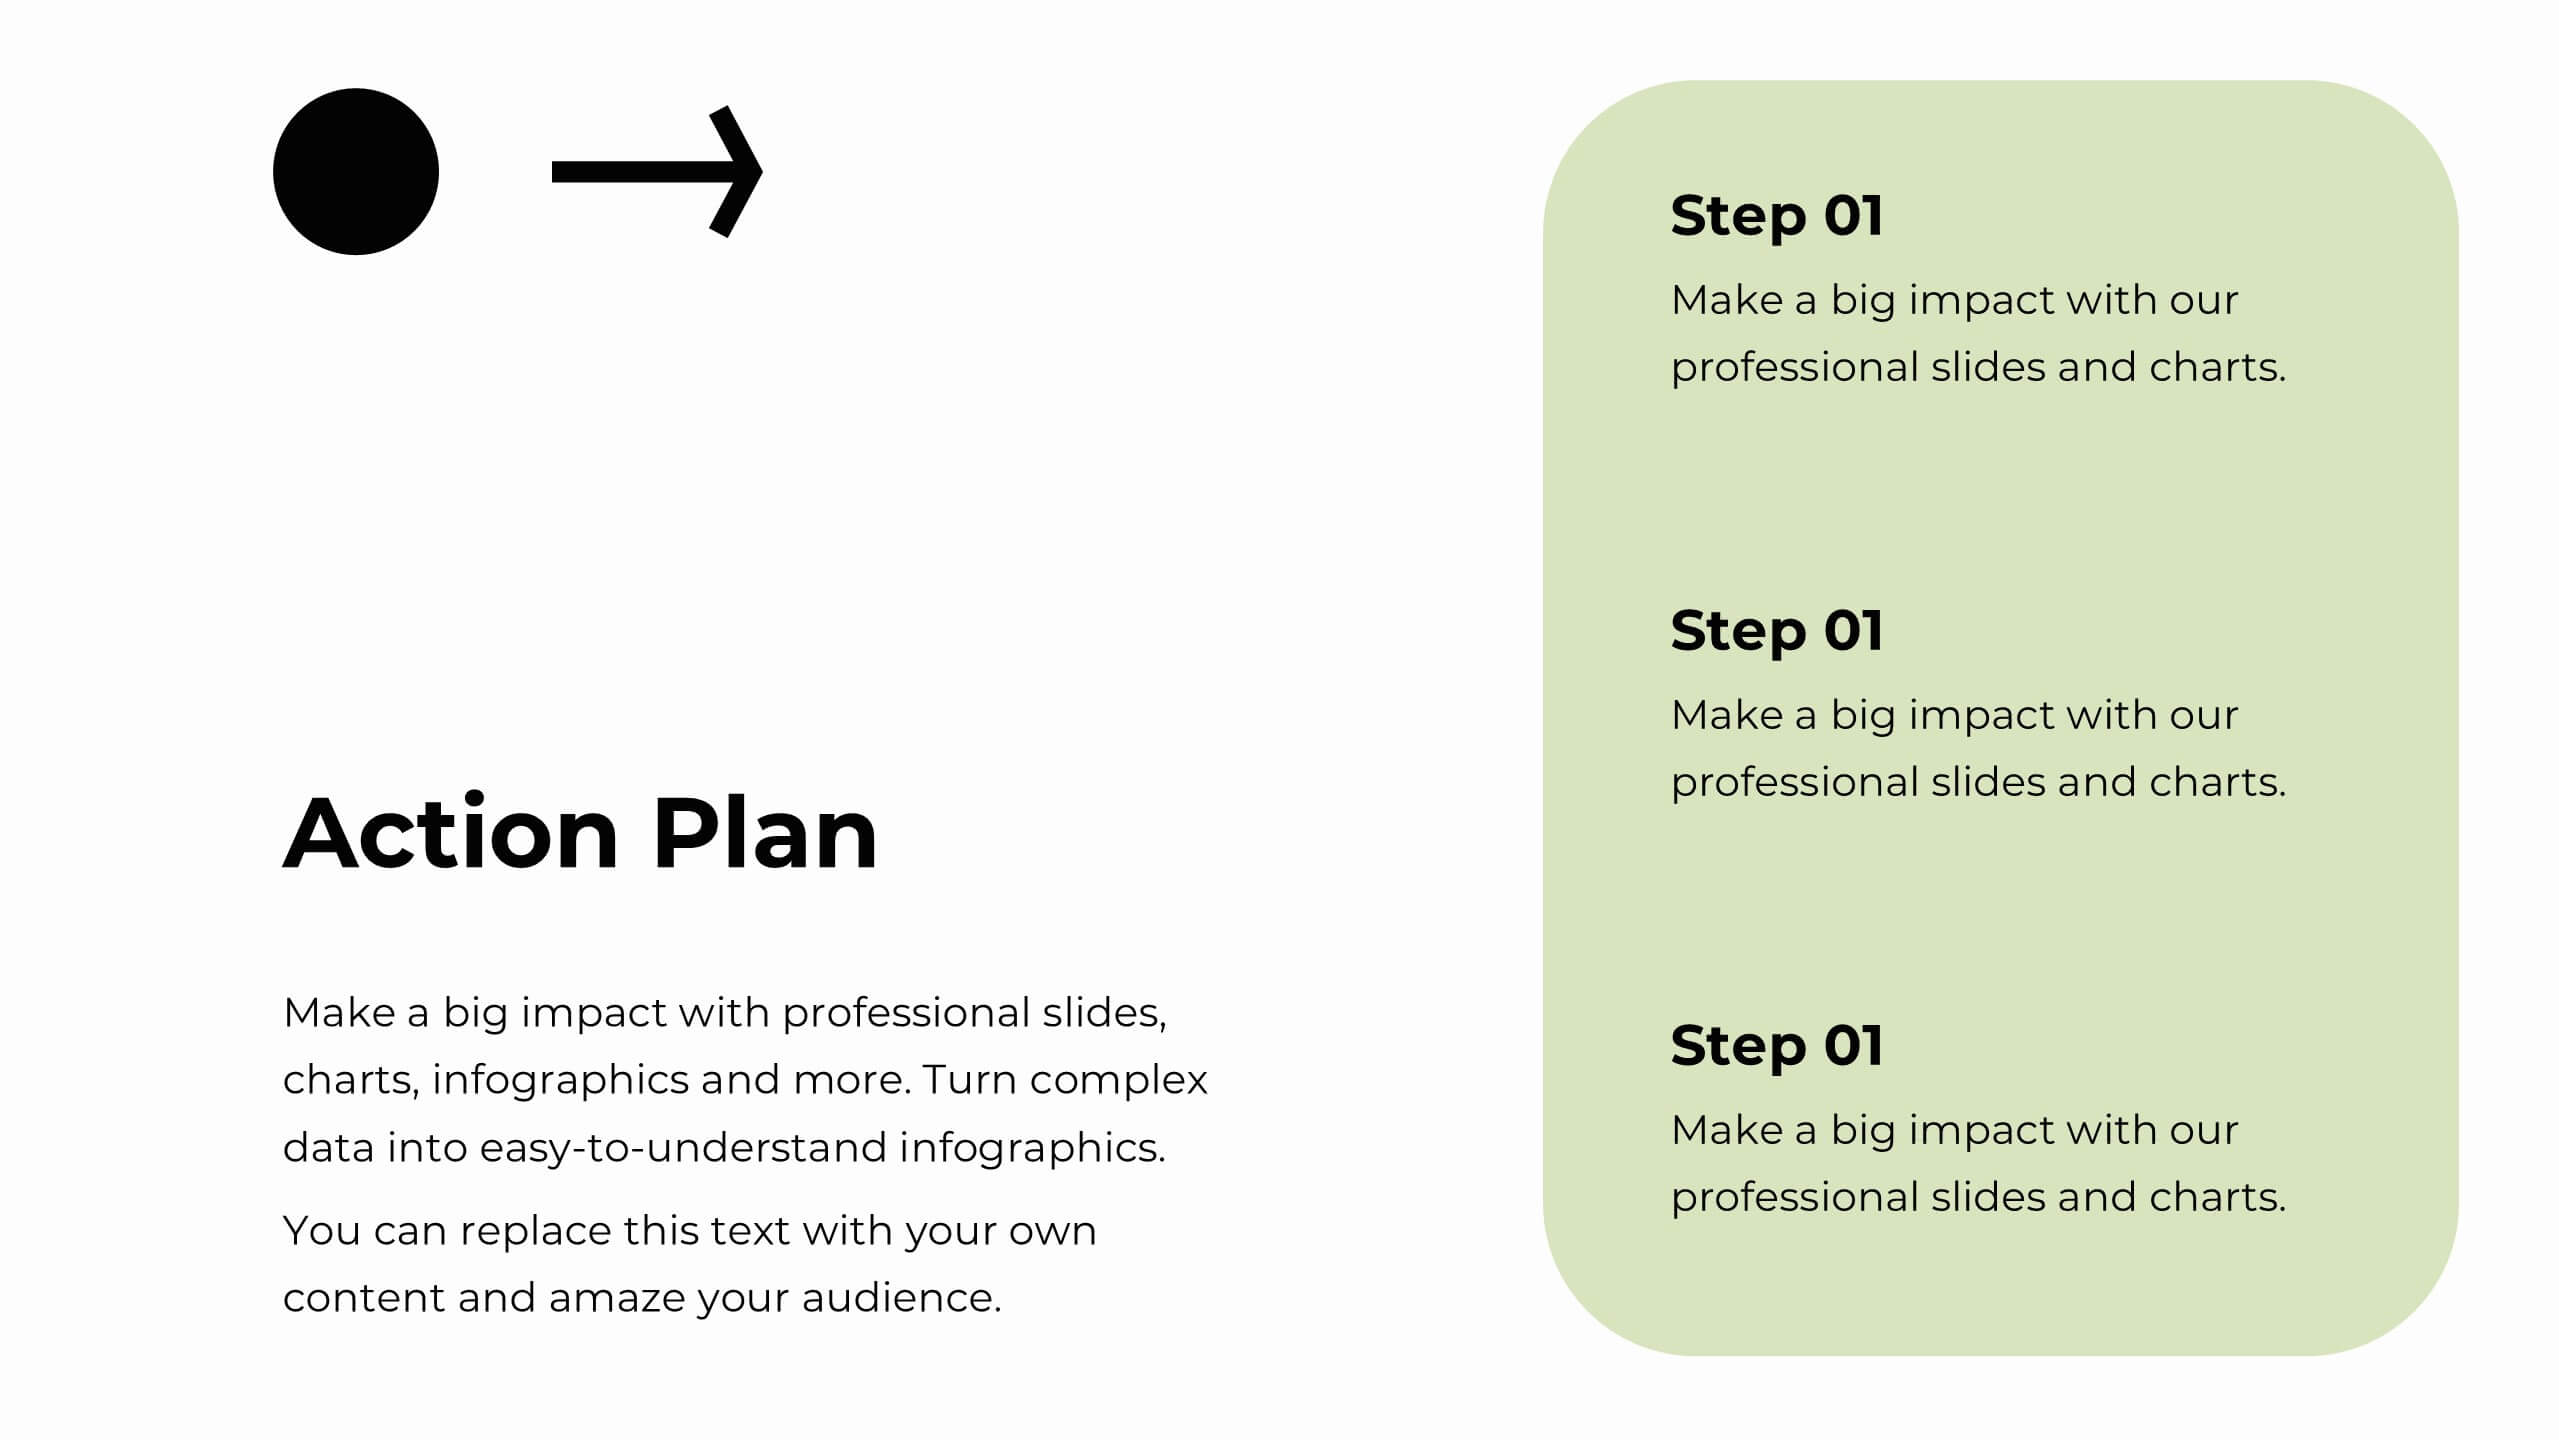
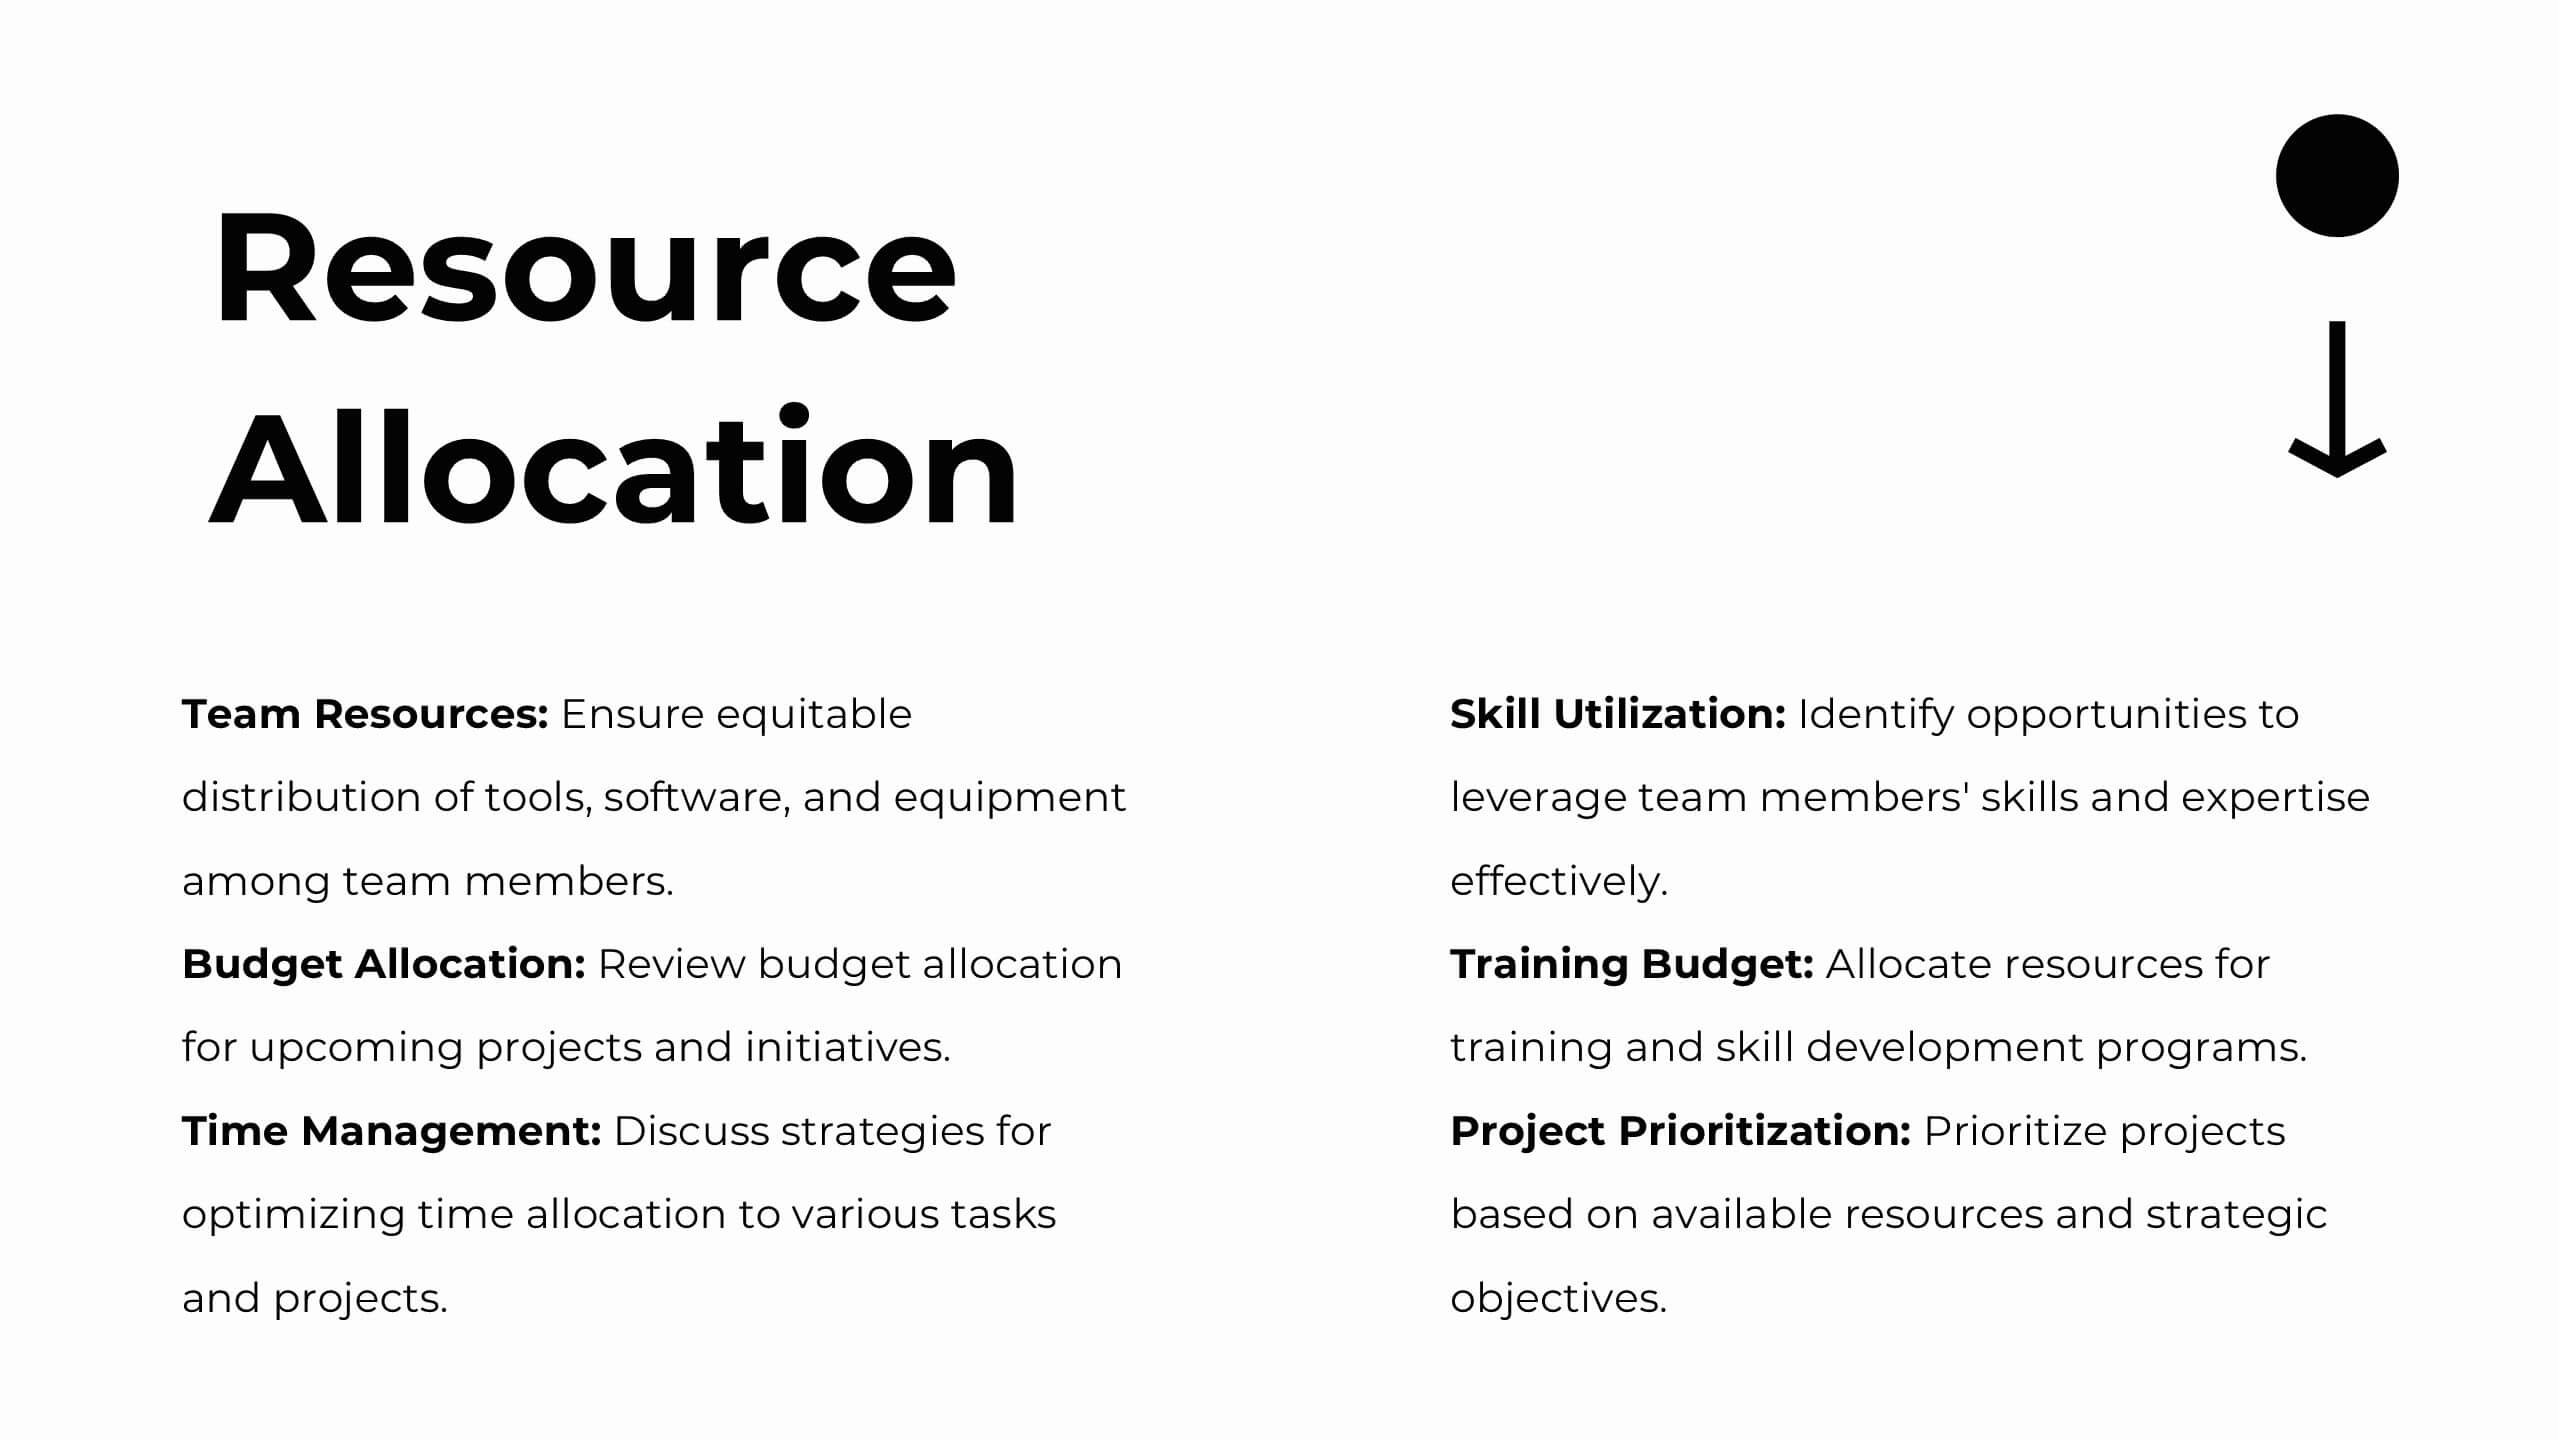
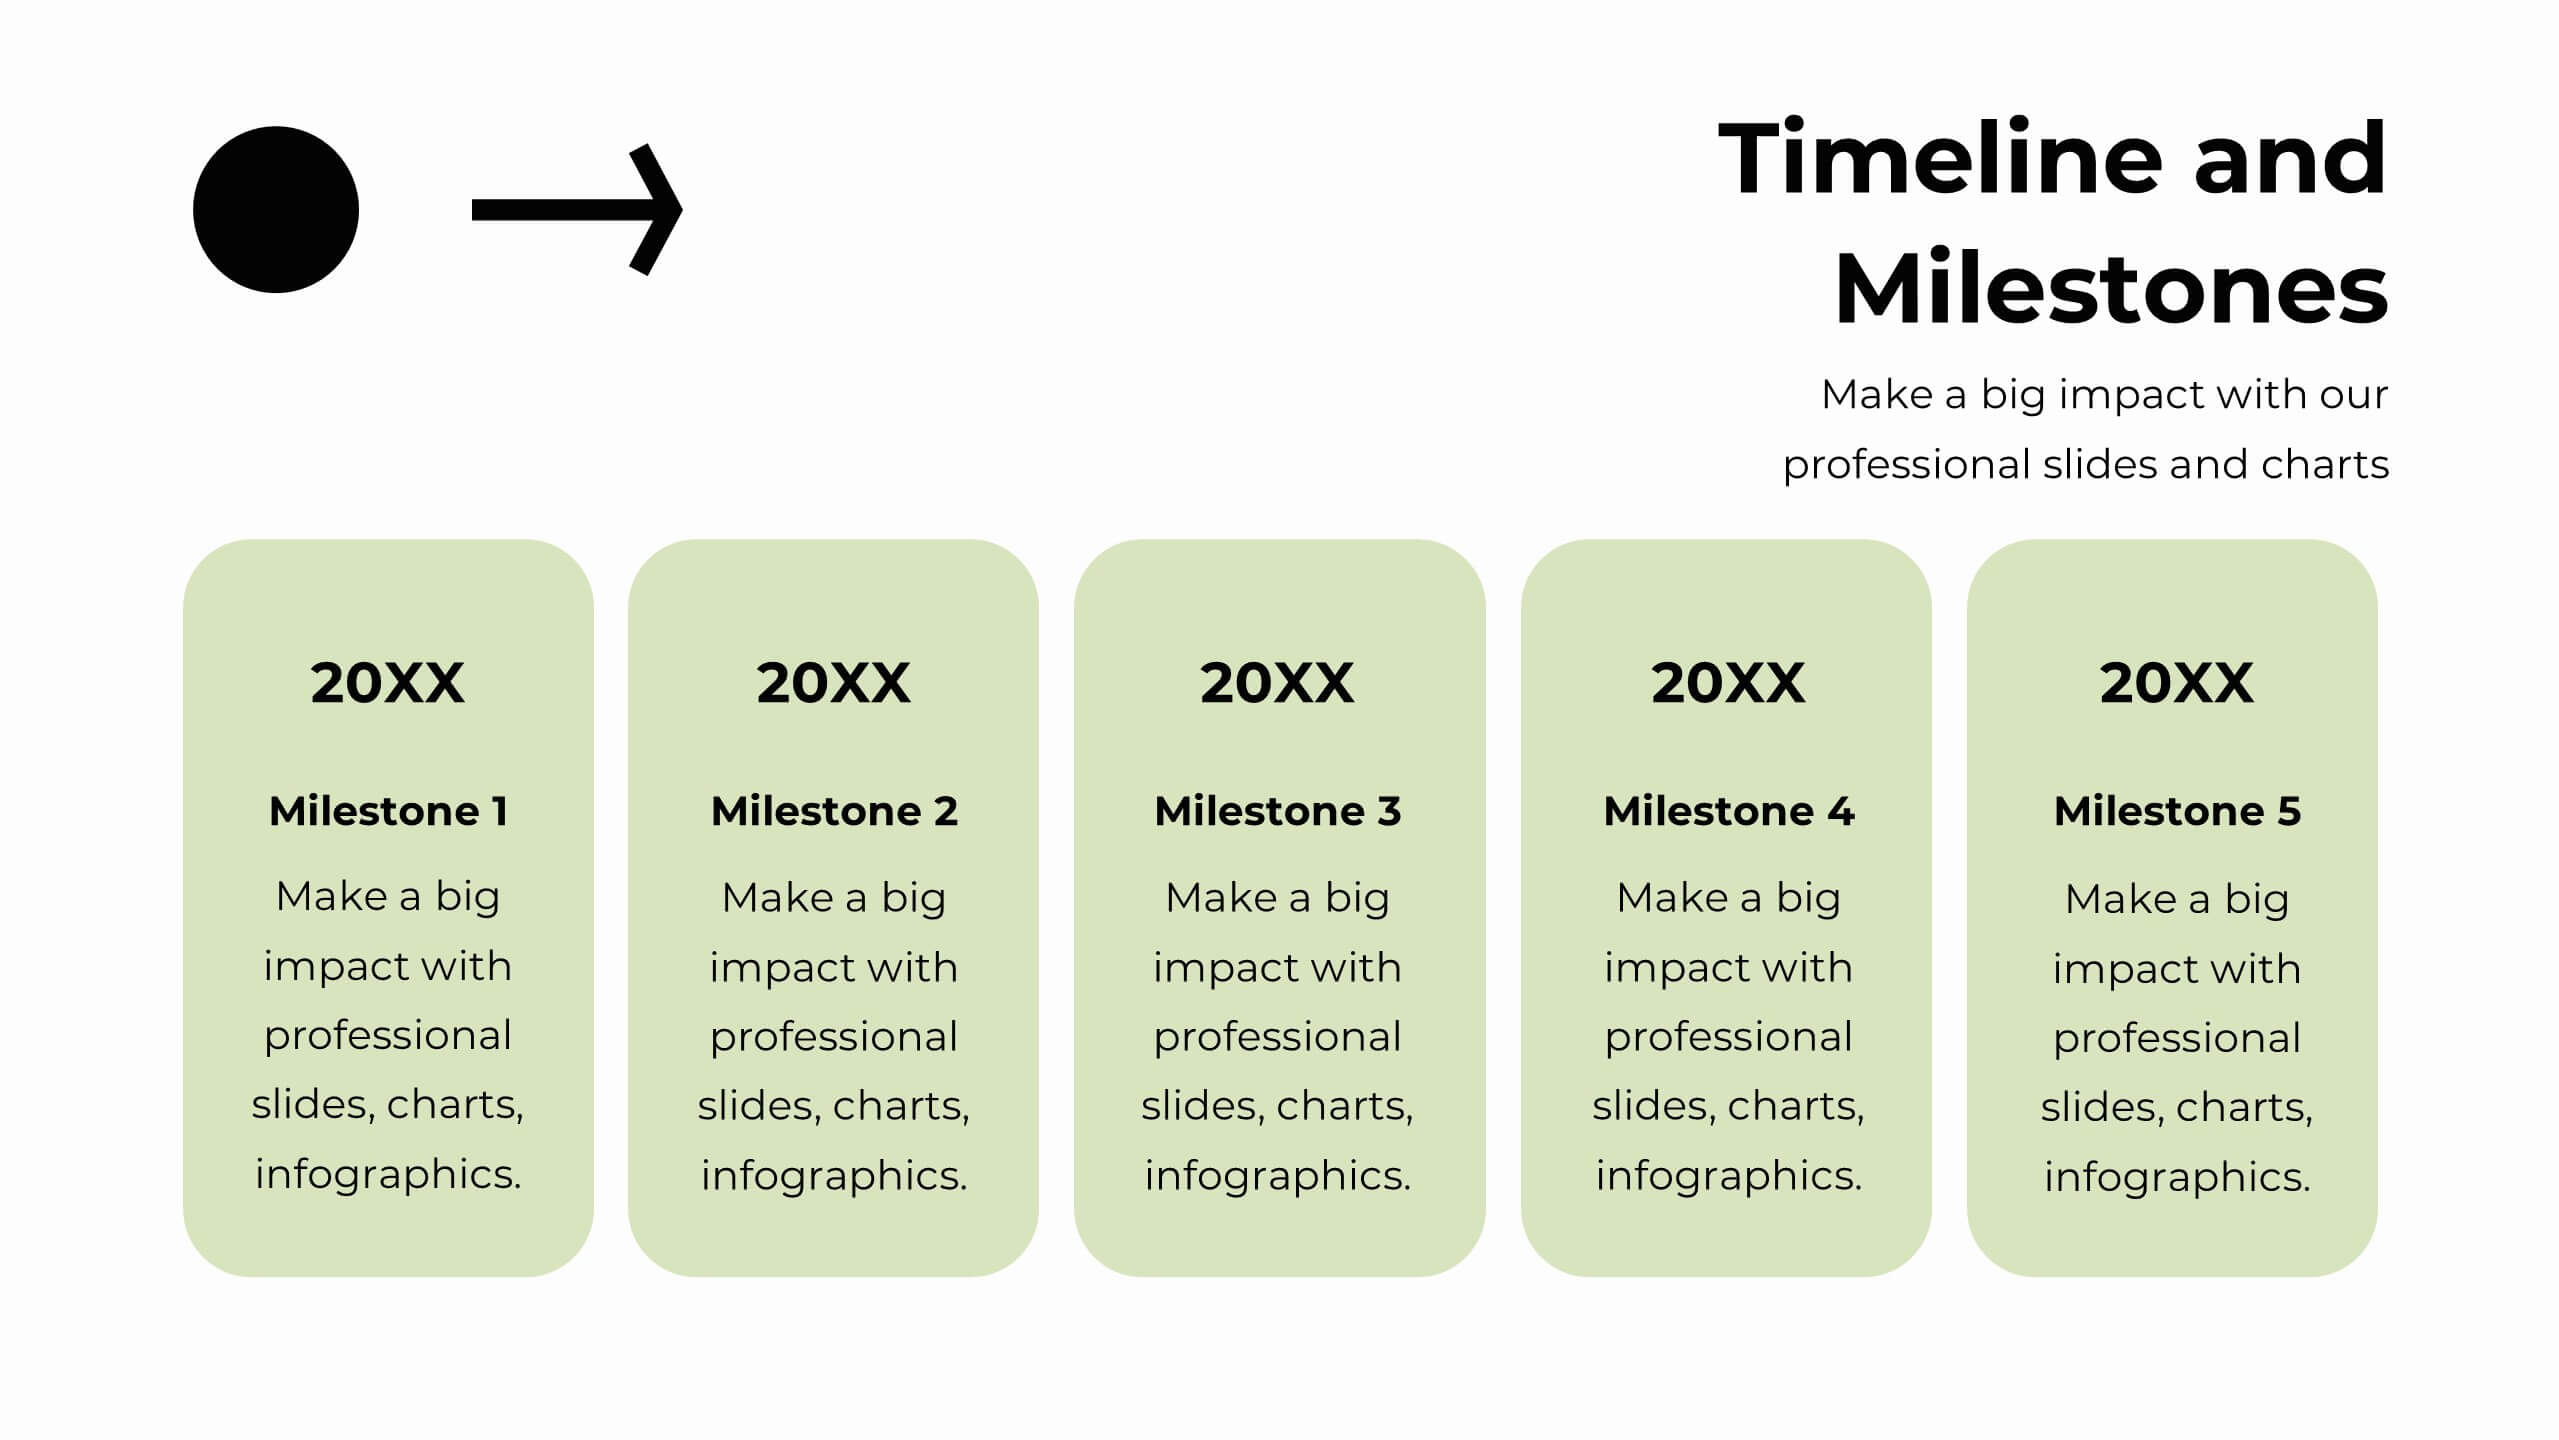
Zirconium Strategic Planning Report Presentation
Plan and present your strategies with precision using this comprehensive strategic planning report template! Designed for clear communication of goals, market trends, SWOT analysis, and growth opportunities, it’s perfect for aligning team objectives and driving success. Fully customizable and compatible with PowerPoint, Keynote, and Google Slides, this template is ideal for strategic initiatives and performance reviews.


4 diapositivas
Stakeholder Analysis Matrix Example Presentation
Make every relationship in your project strategy crystal clear with this smart and colorful matrix design. Perfect for mapping influence, interest, and engagement levels, it helps teams identify priorities and manage communication effectively. Fully editable and compatible with PowerPoint, Keynote, and Google Slides for seamless customization.


8 diapositivas
Environmental Impact Reporting Presentation
Showcase sustainability data with clarity using the Environmental Impact Reporting Presentation. Perfect for tracking plastic usage, waste trends, and eco-initiatives. The infographic-style visuals highlight four distinct data points with bold icons and labeled callouts. Fully editable in PowerPoint, Keynote, and Google Slides—ideal for ESG reports, audits, or environmental awareness campaigns.