


Características


¿Tienes alguna pregunta?
Recomendar


21 diapositivas
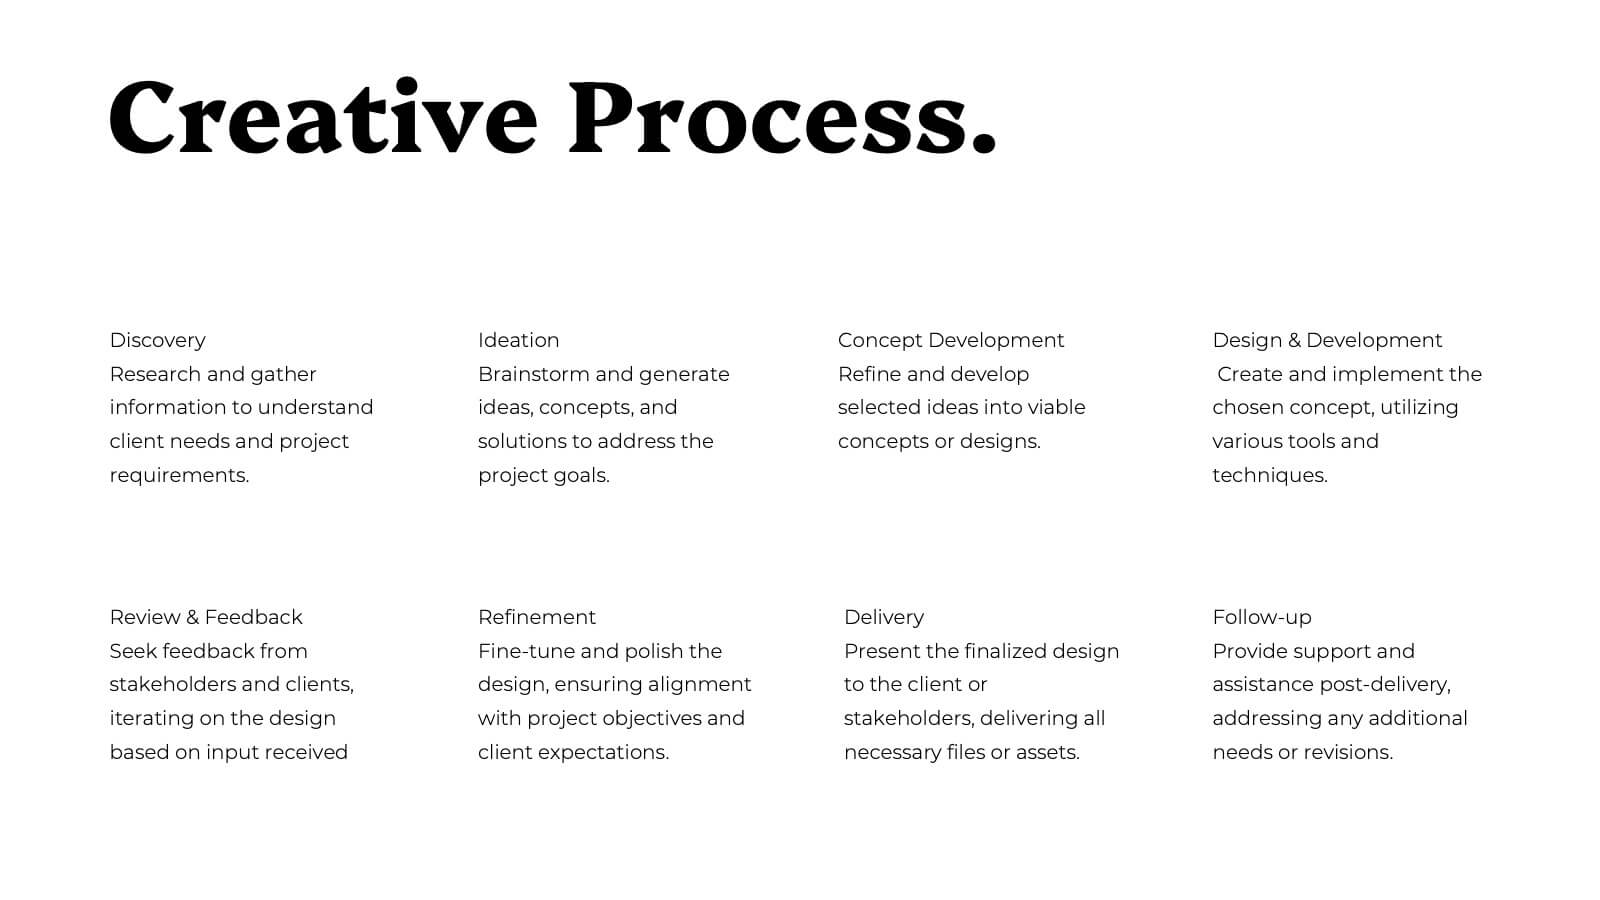
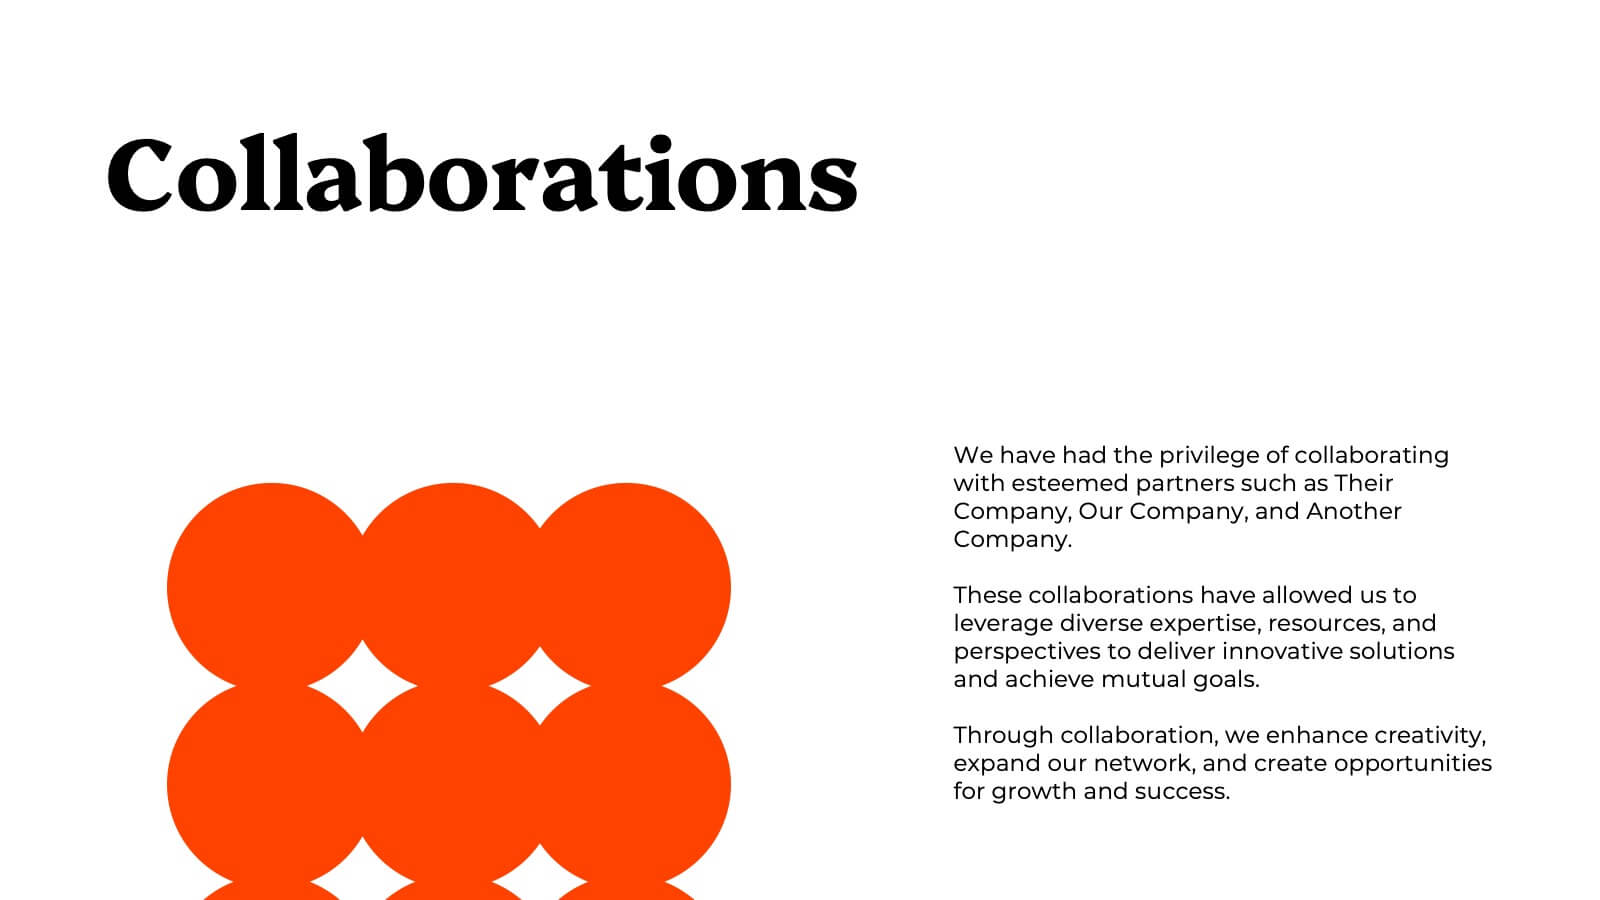
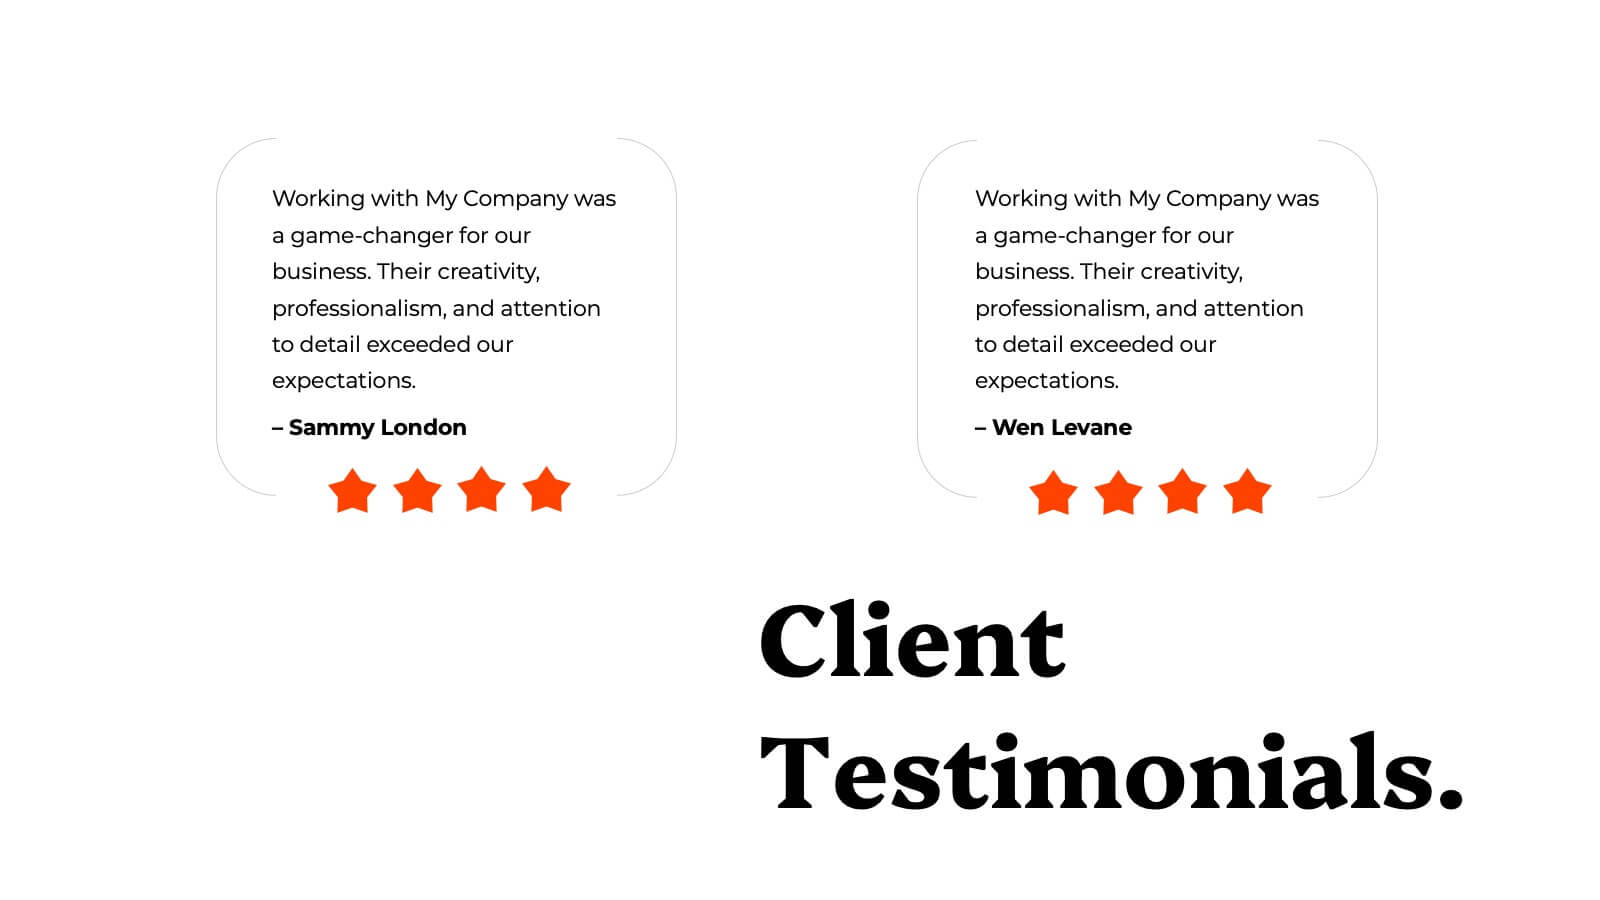
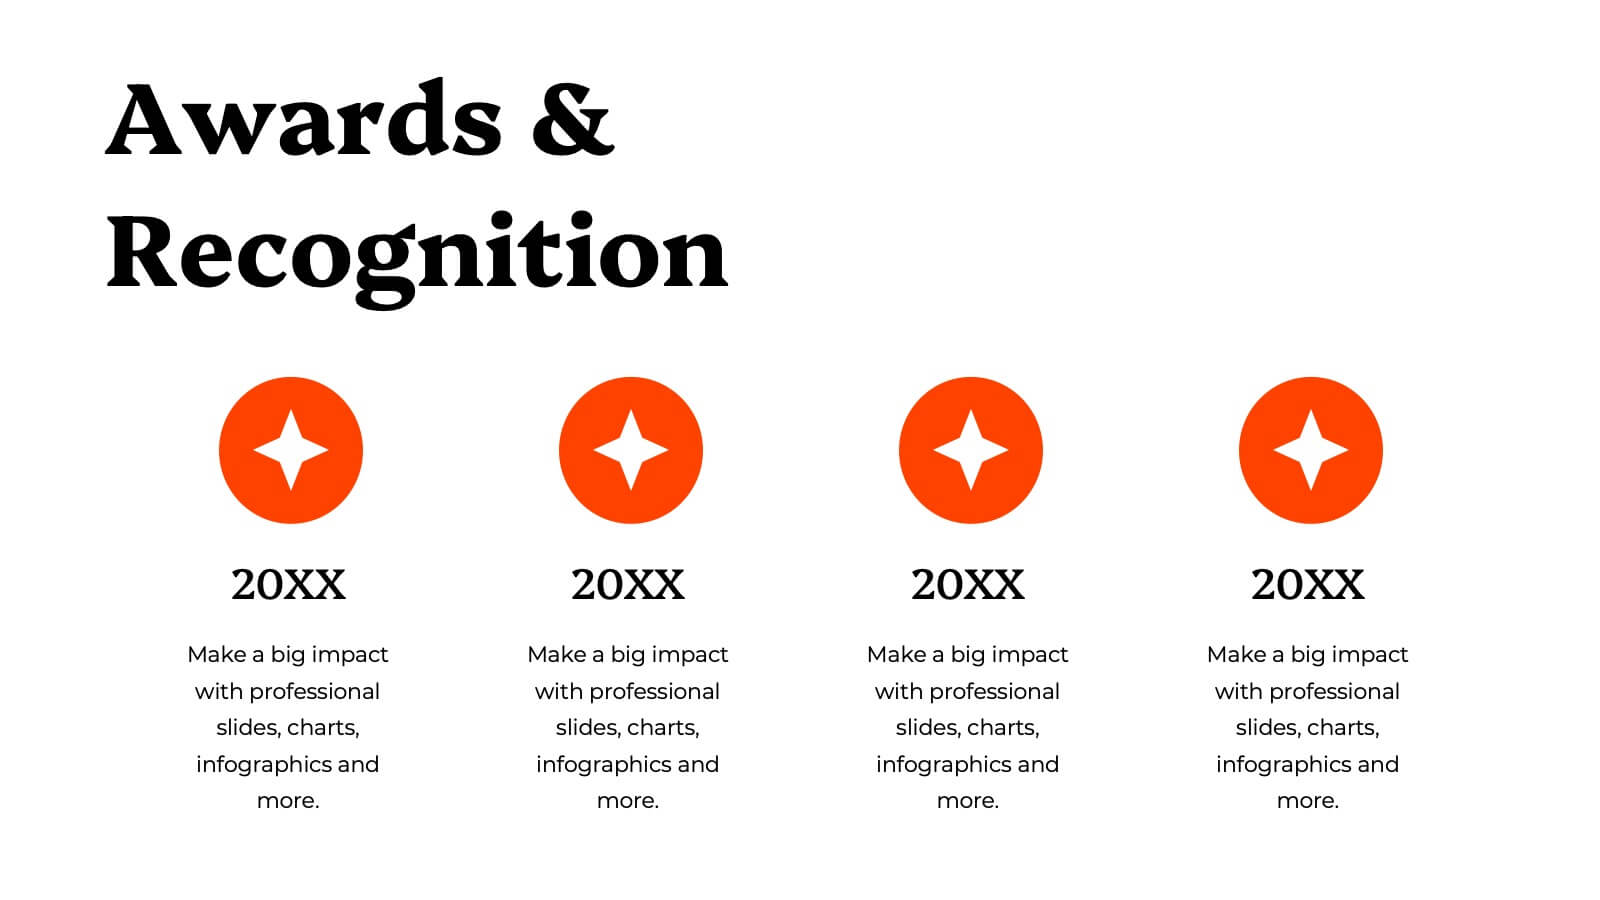
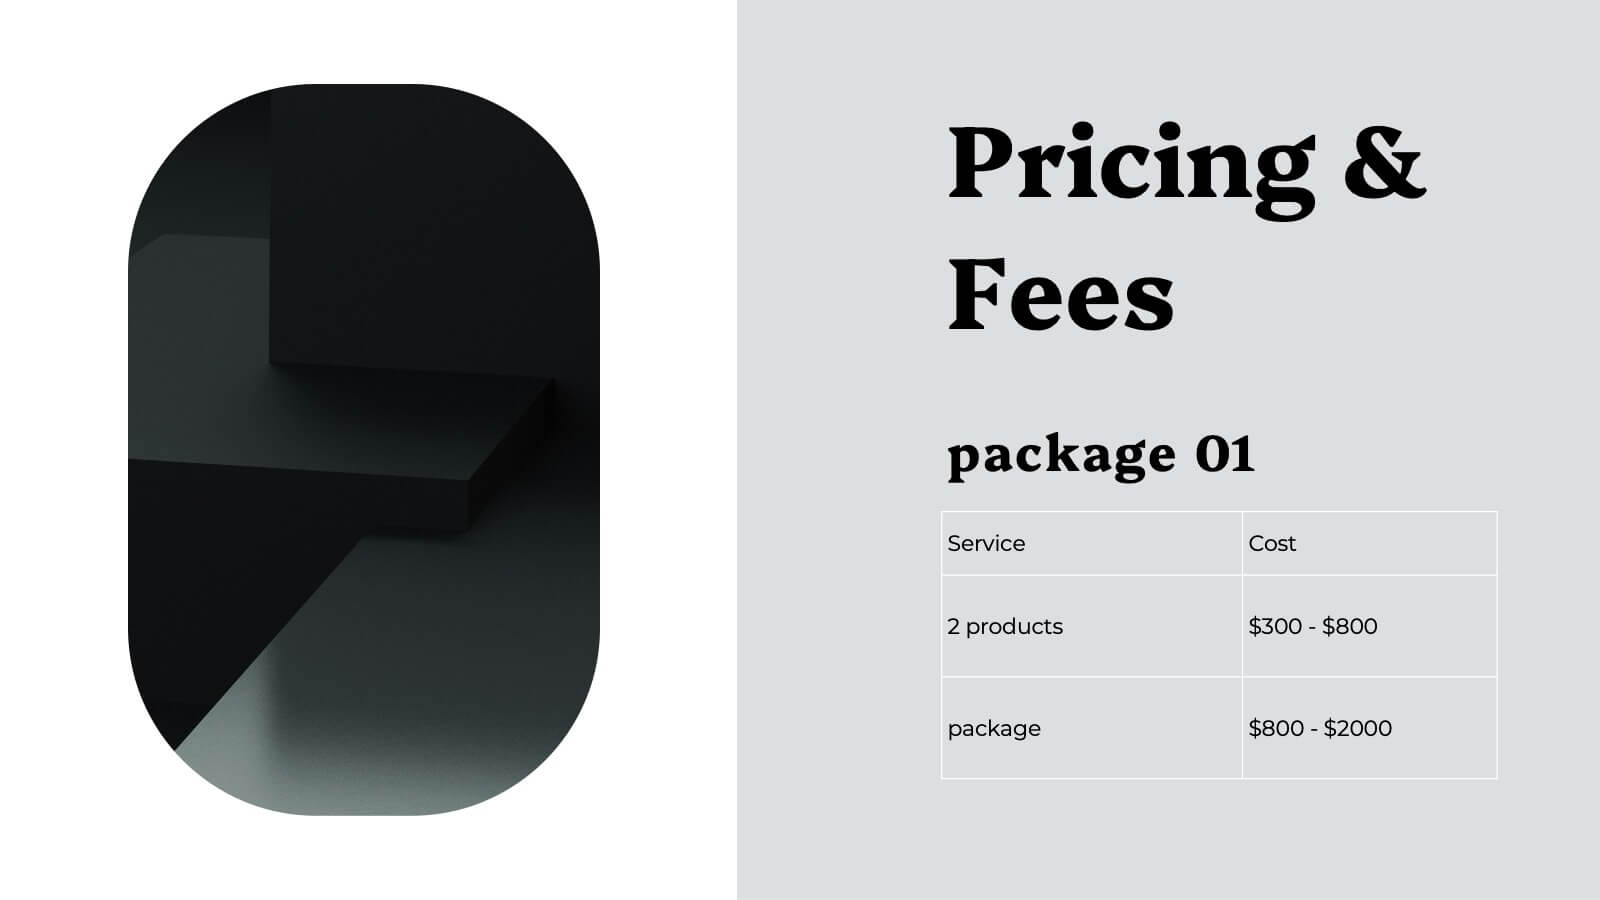
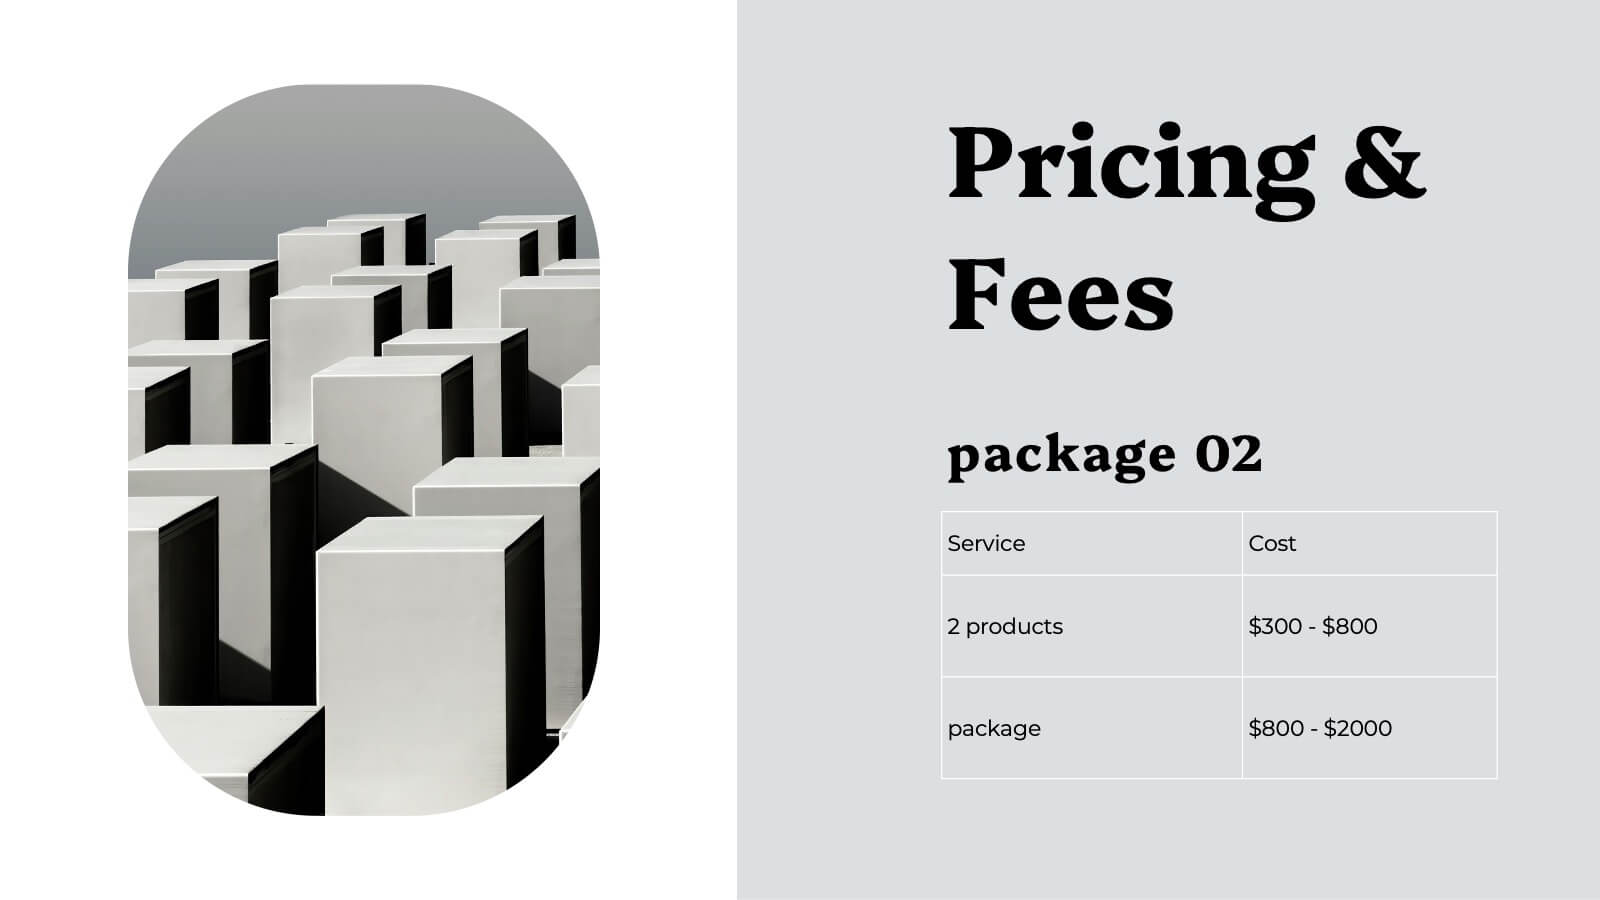
Arcadian Photography Portfolio Template Presentation
Showcase your best work with this sleek and stylish photography portfolio presentation template! It’s perfect for presenting your featured projects, creative process, and client testimonials in a visually stunning way. This template is fully customizable and offers a professional touch to your portfolio, making it ideal for both personal and client presentations. Compatible with PowerPoint, Keynote, and Google Slides.


4 diapositivas
AI Trends and Use Cases Presentation
Step into the future with a clean, modern layout that makes complex technology easy to grasp and exciting to explore. This presentation helps you break down emerging innovations, real-world applications, and industry opportunities using clear visuals and structured sections. Fully customizable and compatible with PowerPoint, Keynote, and Google Slides.


5 diapositivas
Oil Industry Production Infographic
The Oil Industry is an essential component of the global economy, as oil and natural gases are primary sources of energy. This vertical infographic template is a visual representation of data related to the extraction and production of oil and its byproducts. Use this to include statistics and key facts about oil production, including the top oil-producing countries, and the different methods used for extracting and processing oil. This infographic is compatible with PowerPoint, Keynote, and Google Slides, and can be easily edited to match your branding and style to help you effectively communicate your message.

22 diapositivas
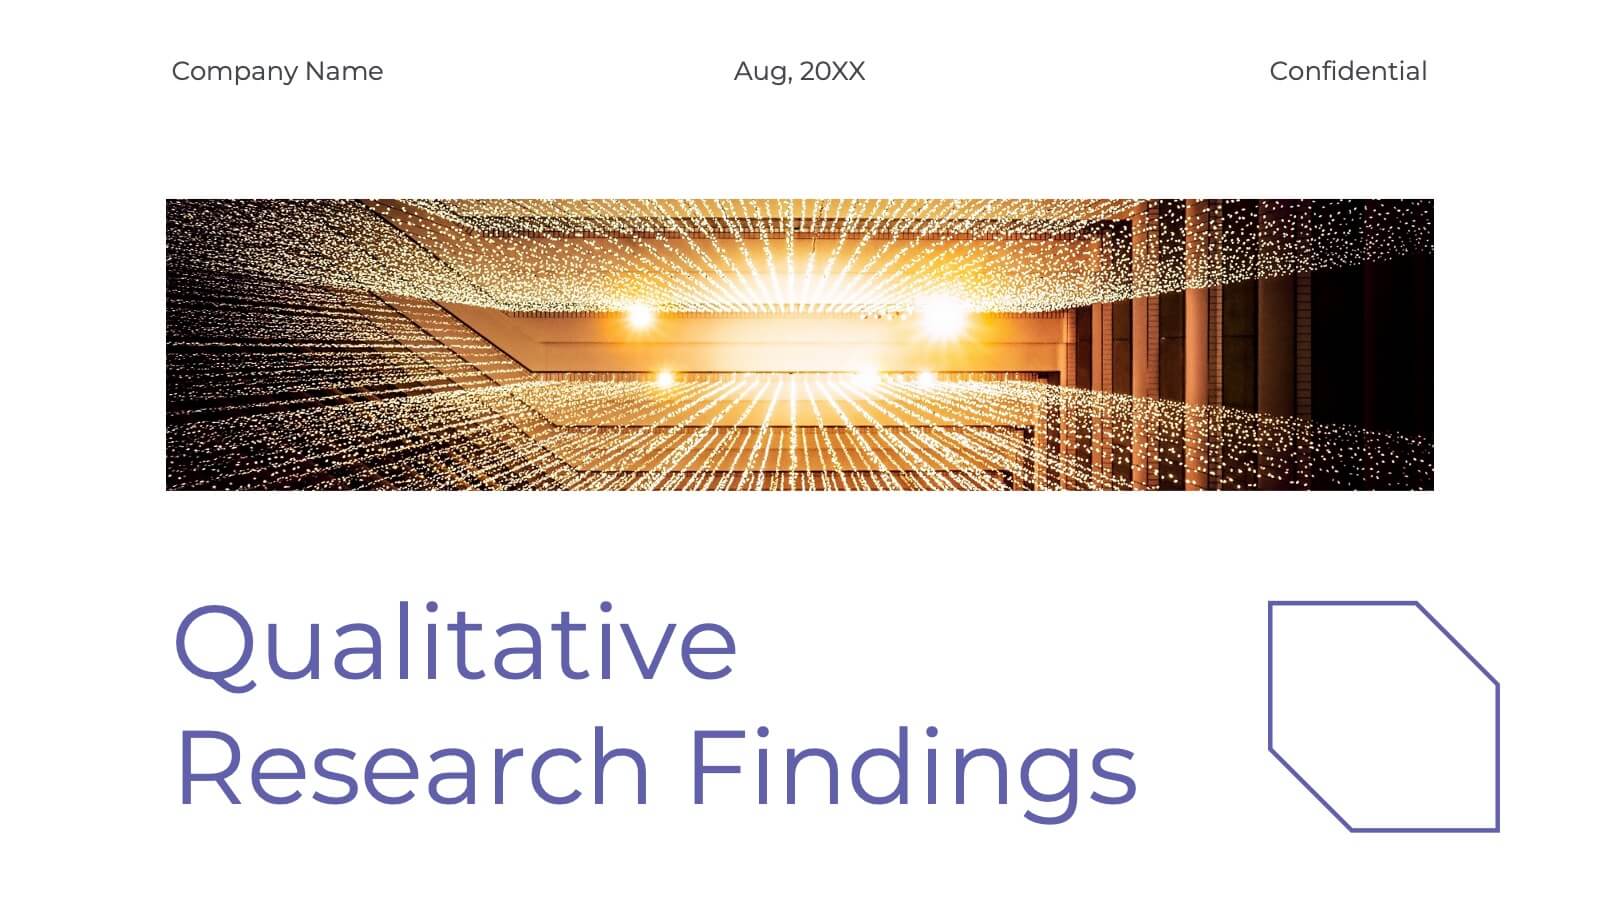
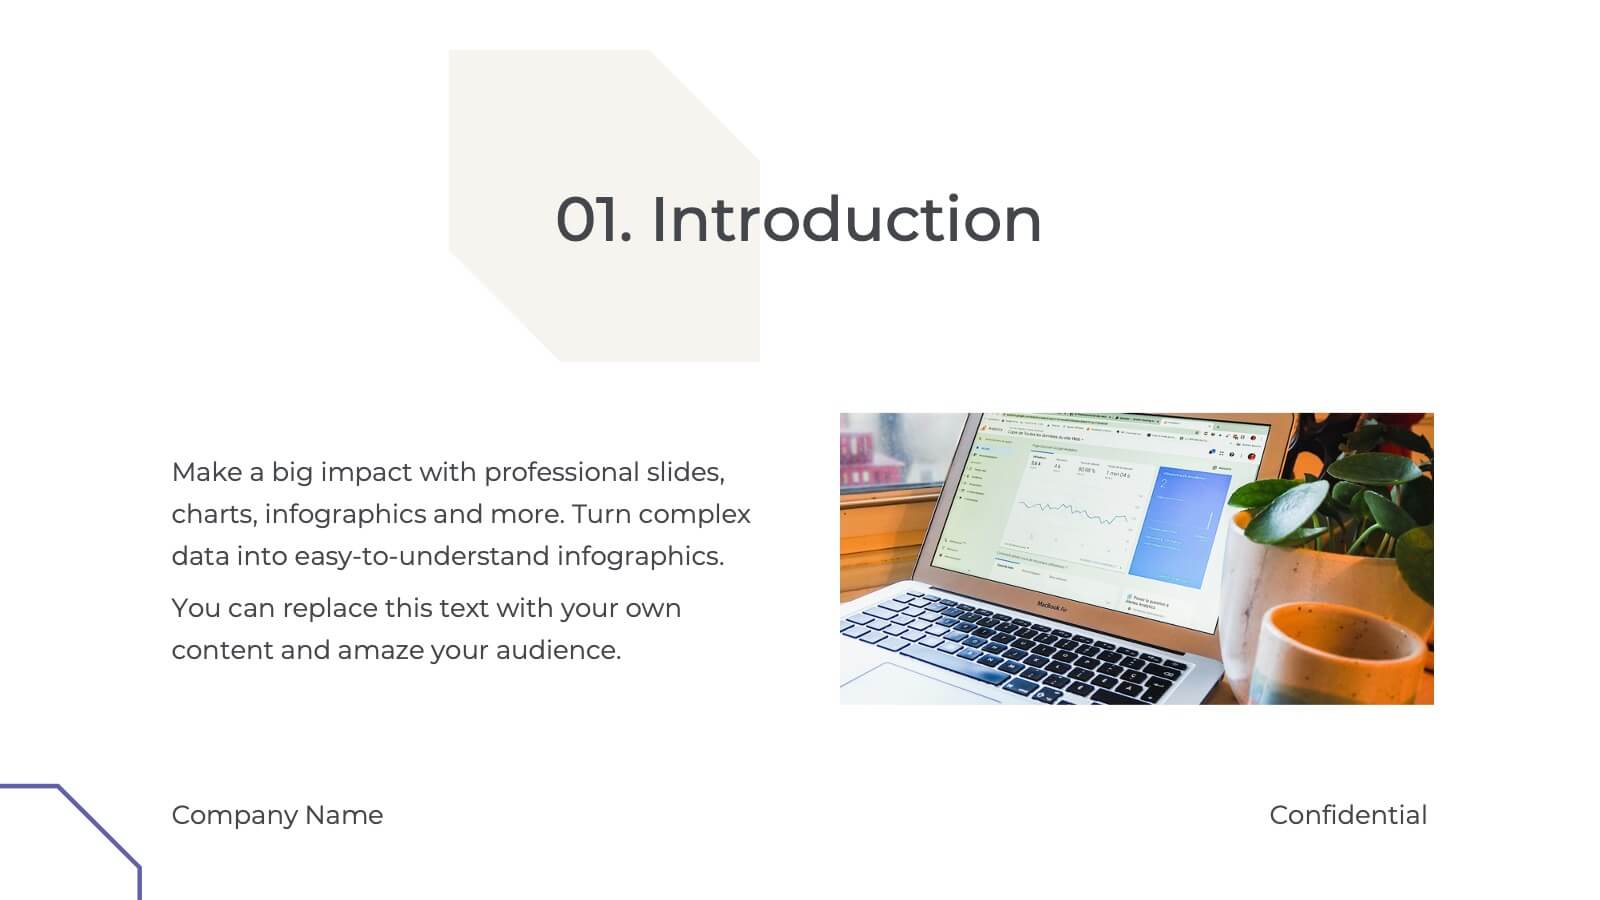
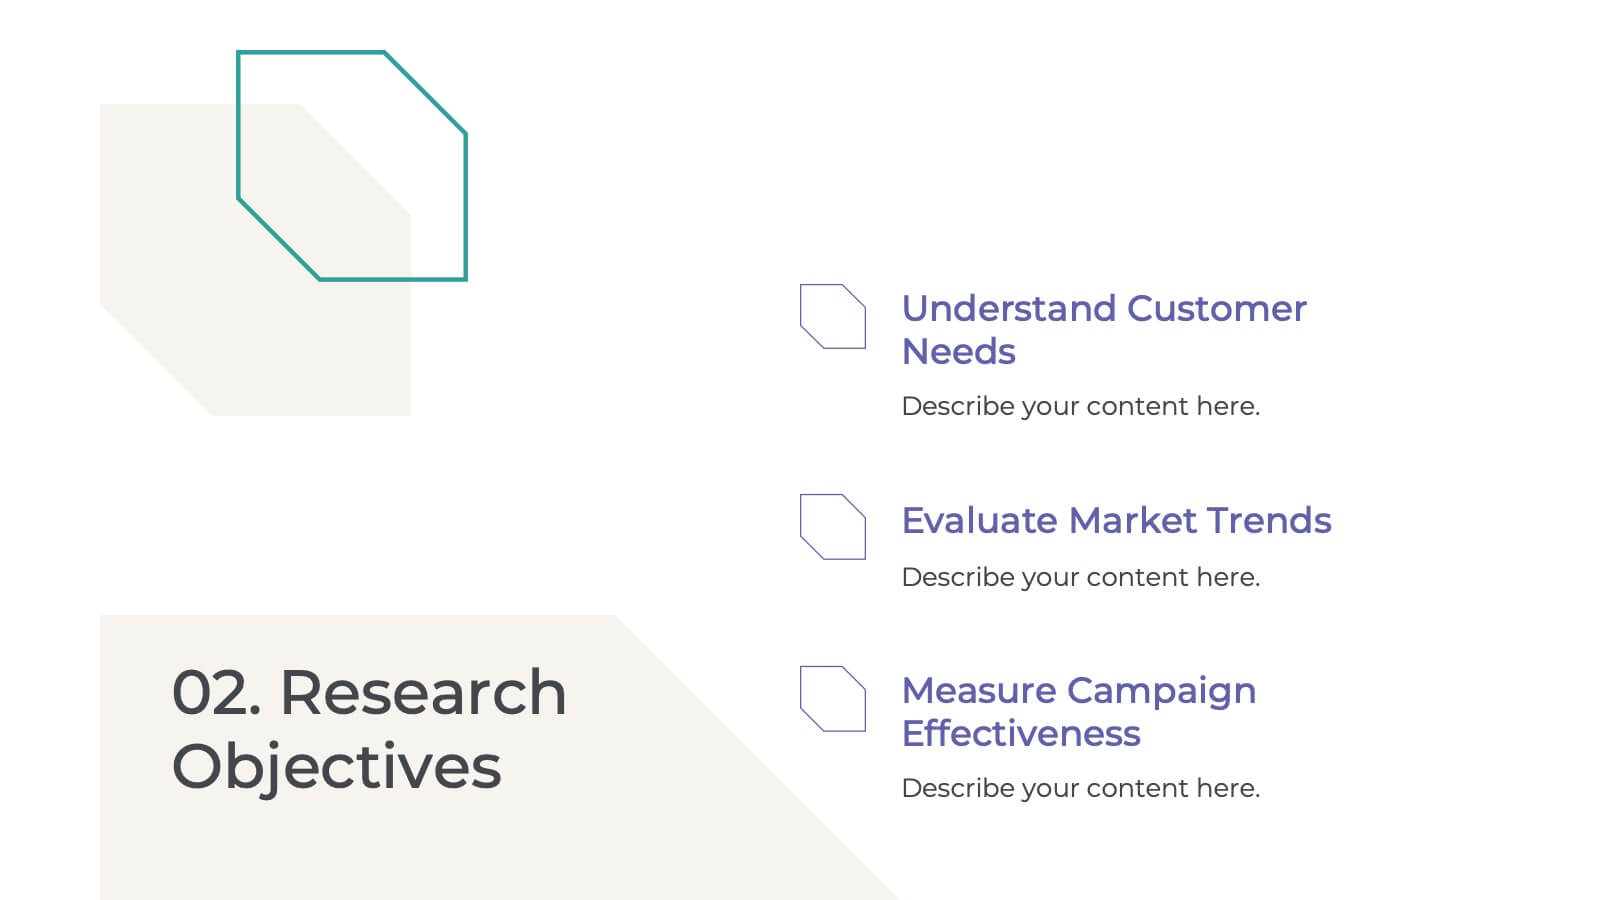
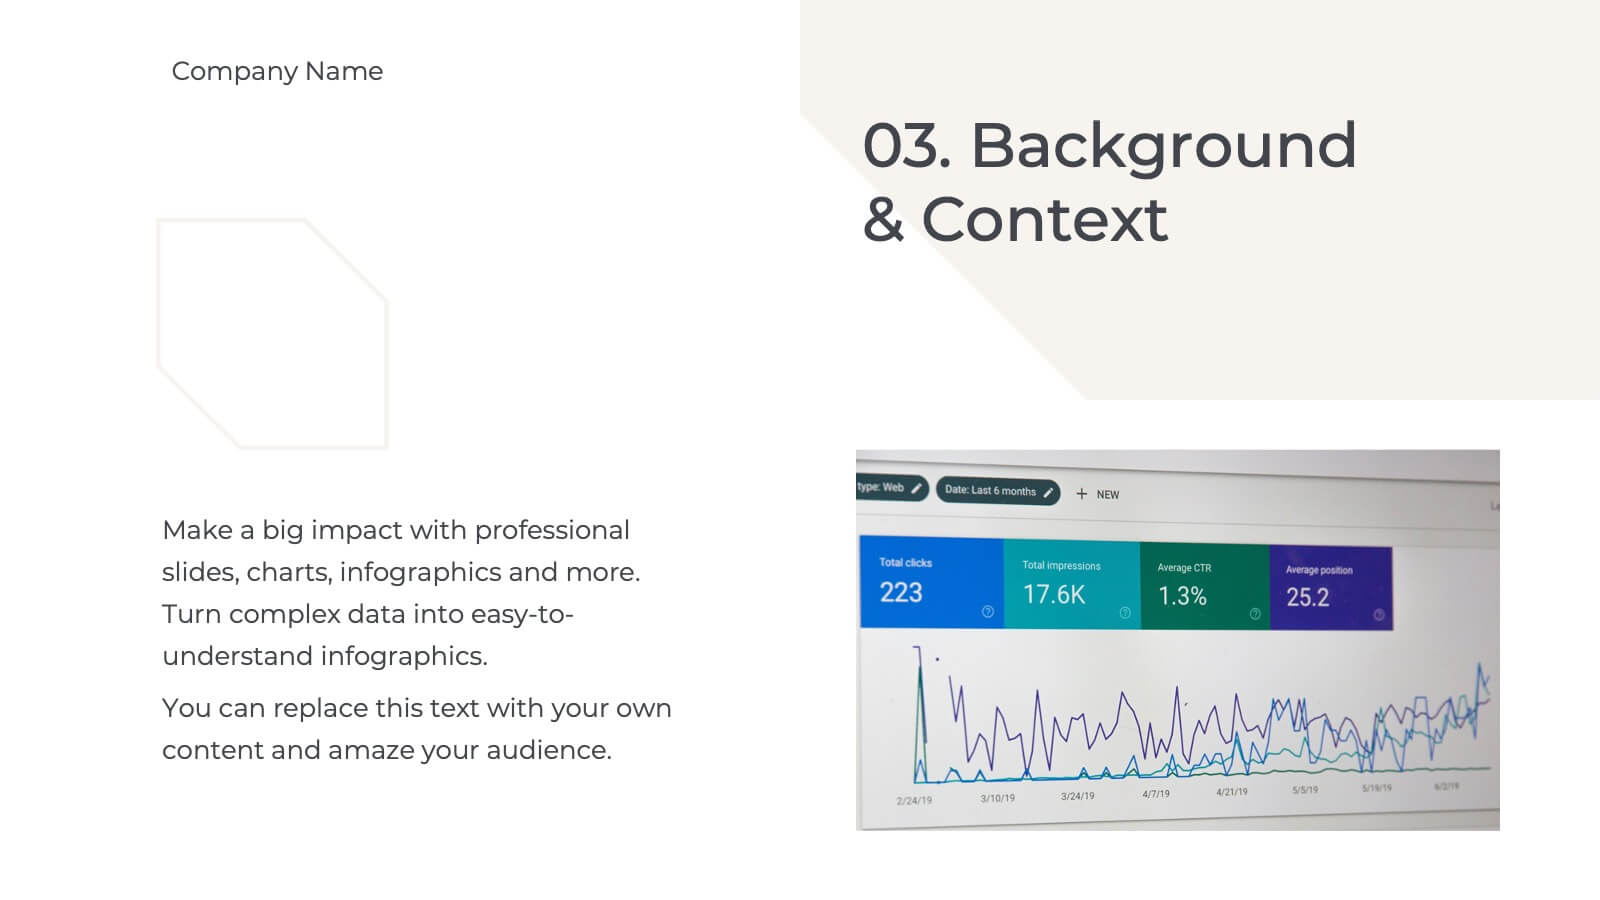
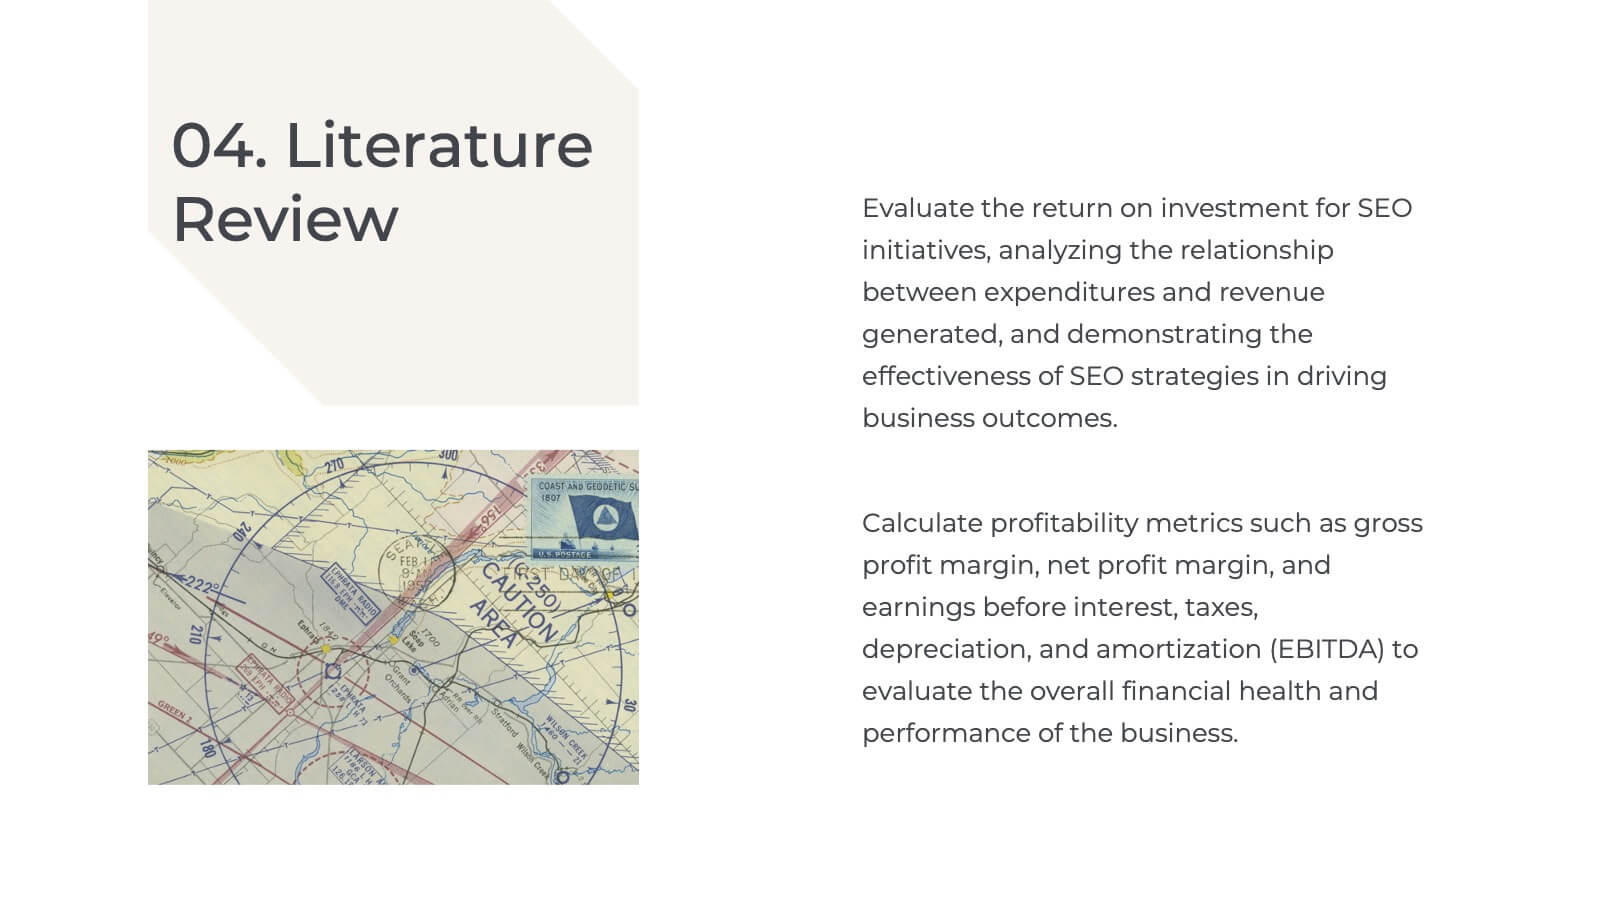
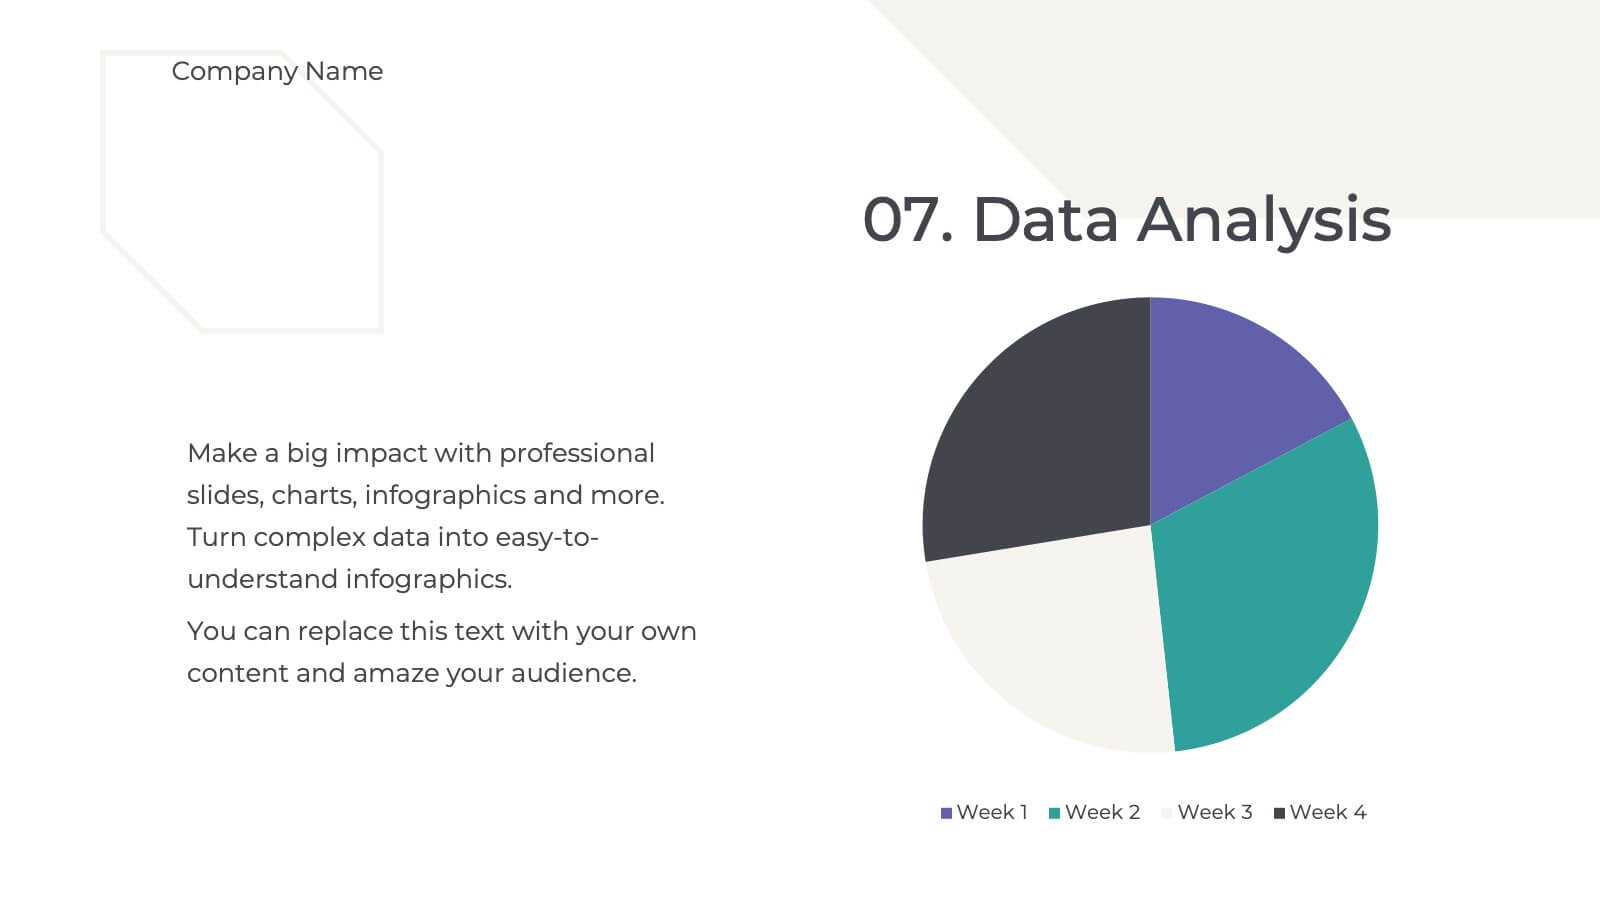
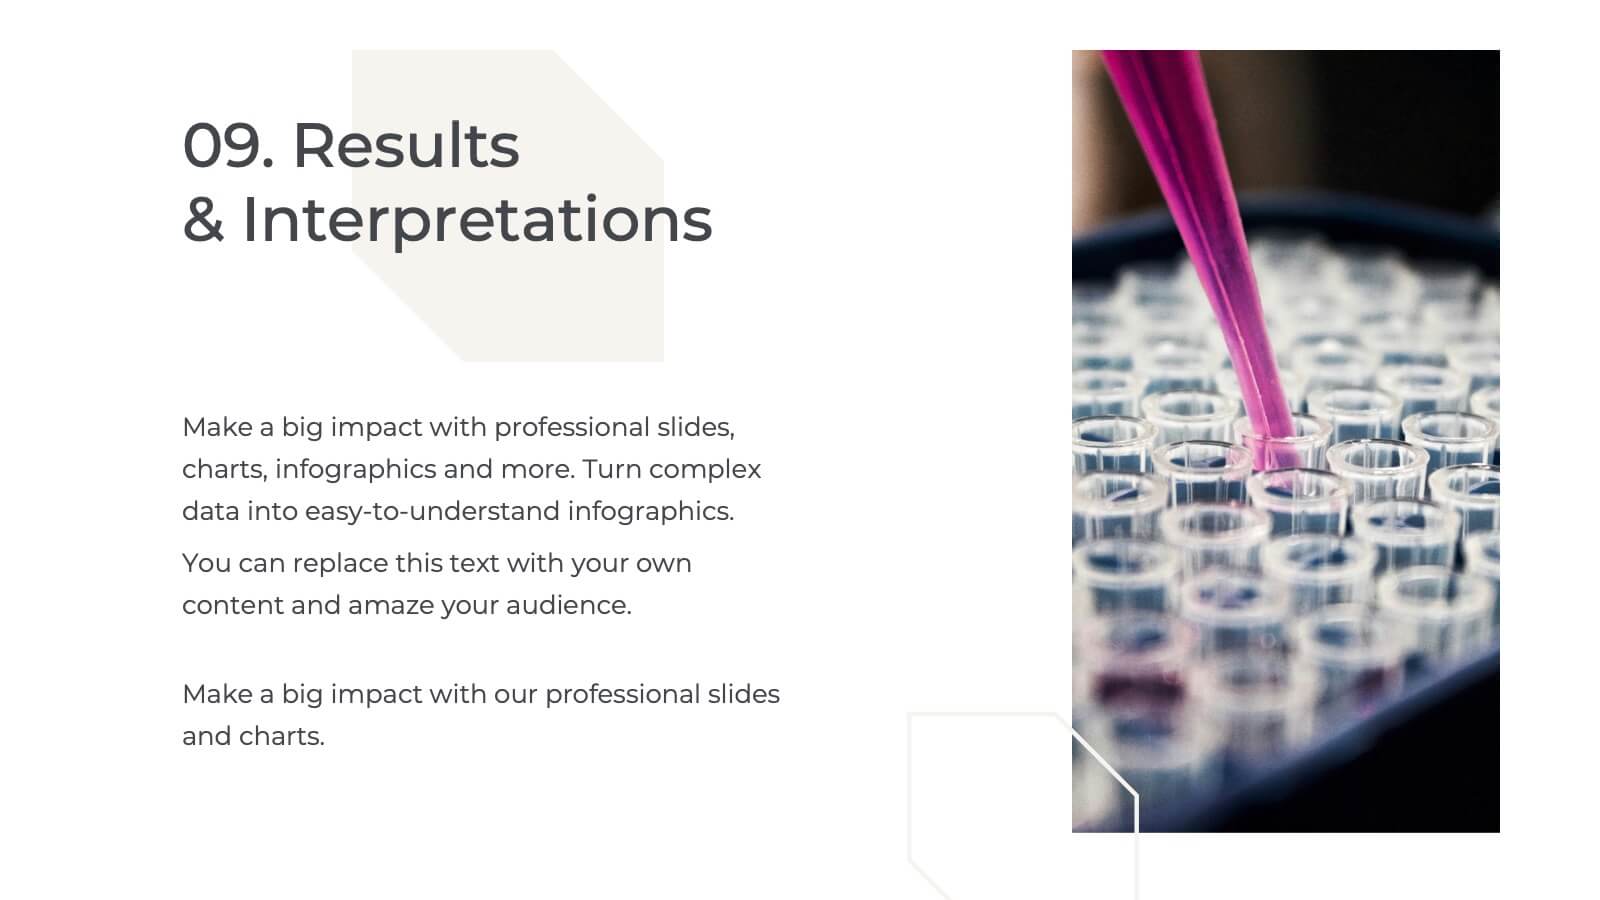
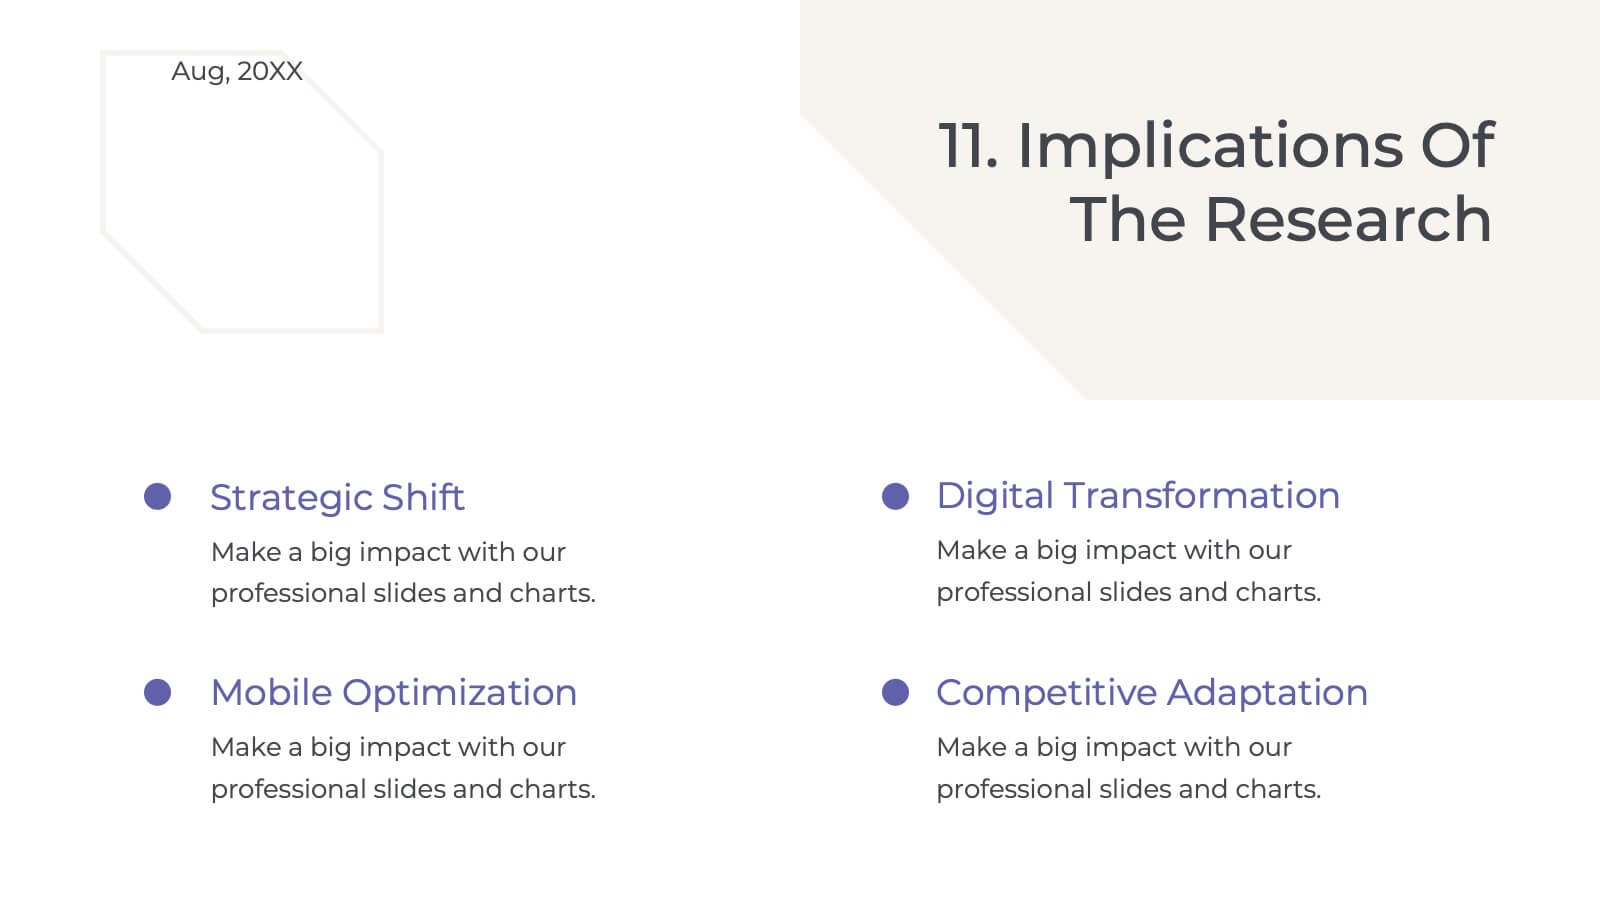
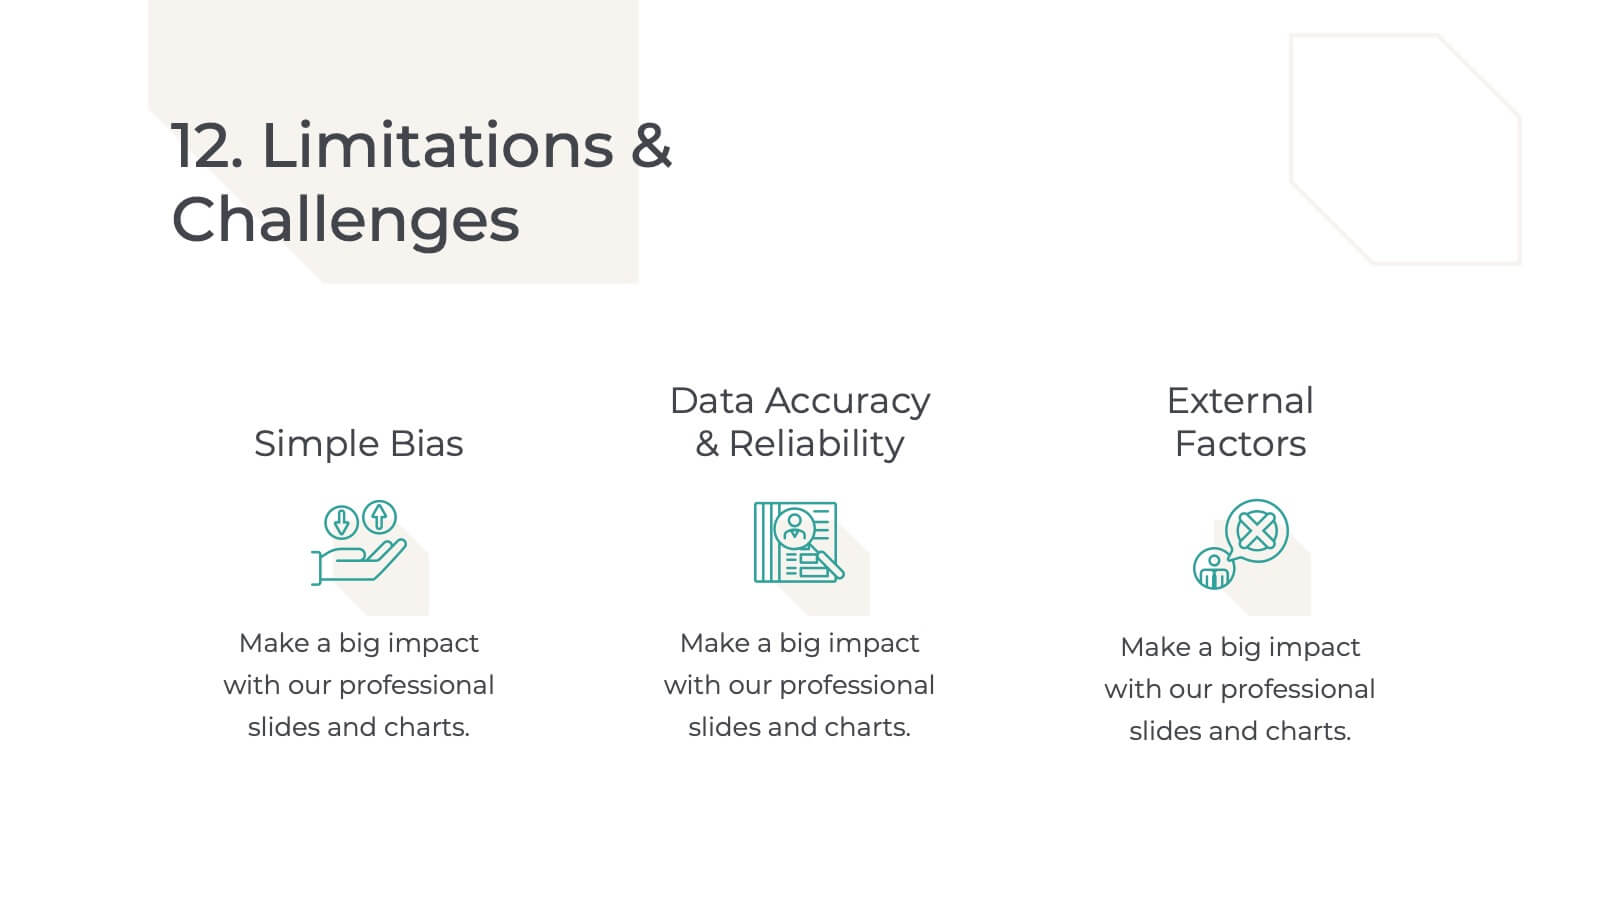
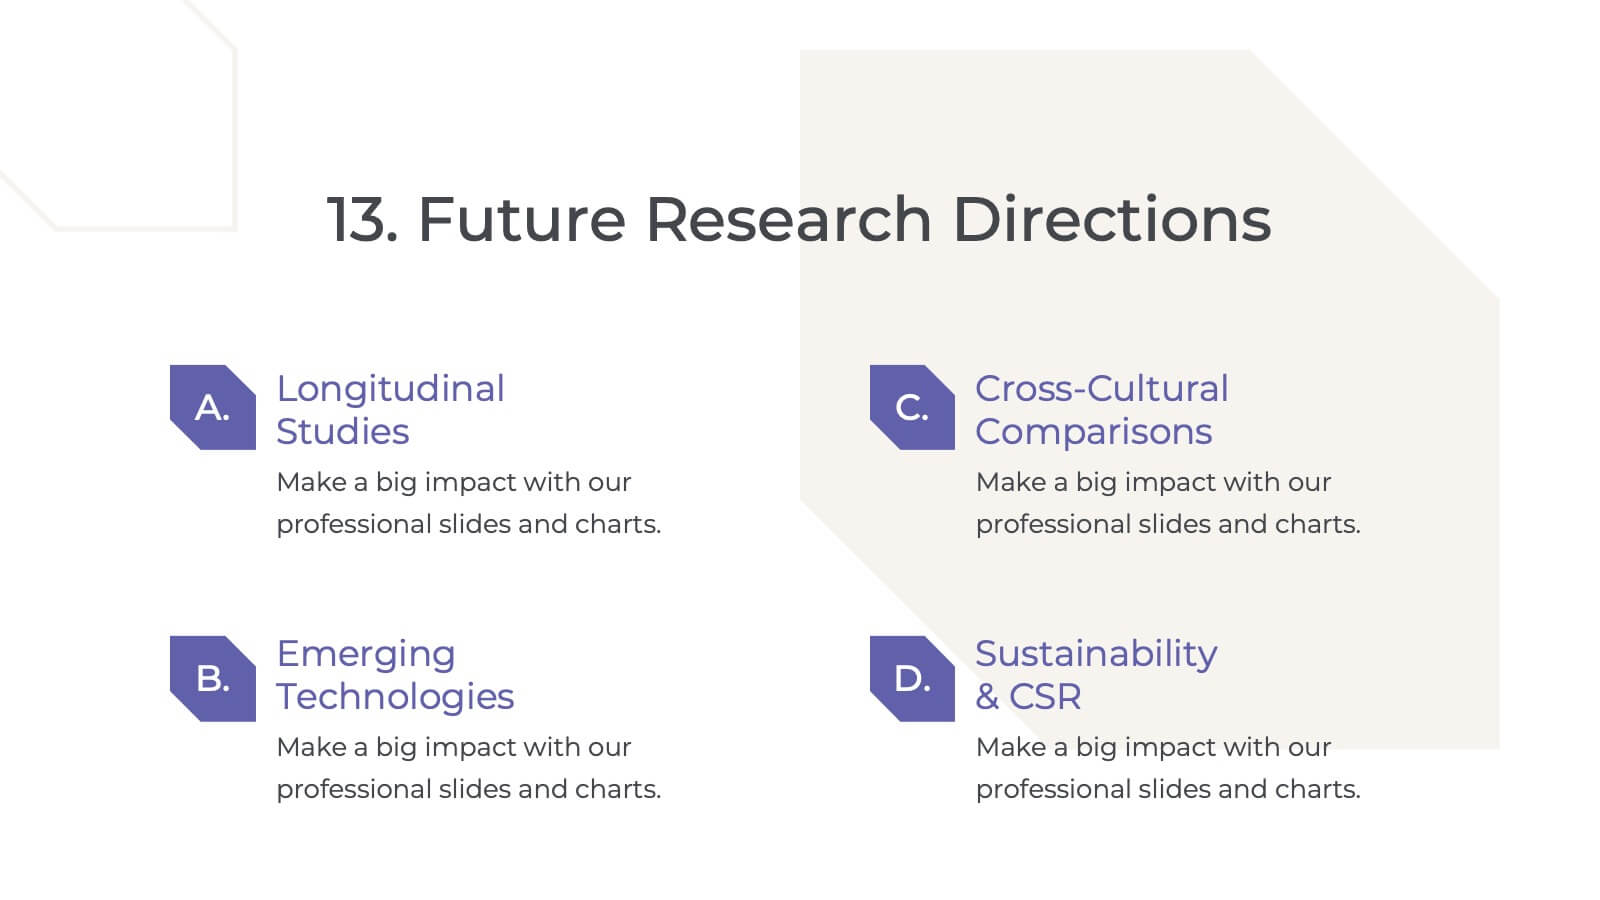
Palladium Qualitative Research Findings Presentation
Present your qualitative research findings effectively with this sleek, professional template. It includes sections for objectives, data analysis, key findings, and recommendations. Ideal for organizing research insights clearly, it's customizable and compatible with PowerPoint, Keynote, and Google Slides, ensuring smooth collaboration and impactful presentations for your audience.


5 diapositivas
Workforce Structure and Unity Overview Presentation
Present your team's hierarchy and alignment clearly with the Workforce Structure and Unity Overview Presentation. This slide layout is ideal for illustrating reporting relationships, department groupings, or organizational tiers in a clean and visual format. Great for onboarding, team updates, or internal planning meetings. Fully editable in PowerPoint, Keynote, Canva, and Google Slides.


6 diapositivas
Hospital Management System Presentation
Bring structure and efficiency to your healthcare operations with this professional presentation. Designed to simplify complex hospital workflows, it helps visualize patient management, service coordination, and system processes with clarity. Ideal for administrators and consultants, it’s fully editable and compatible with PowerPoint, Keynote, and Google Slides for seamless customization.


4 diapositivas
Business Operations Office Theme Presentation
Make your workflow feel effortless with this sleek, illustrated office layout designed to simplify complex business operations. Ideal for presenting processes, responsibilities, or resource planning, the clean visuals and structured format help communicate your message clearly. Fully editable and compatible with PowerPoint, Keynote, and Google Slides for seamless customization.


7 diapositivas
Creative Thinking and Disruption Model
Visualize your strategy for breakthrough ideas with the Creative Thinking and Disruption Model Presentation. Featuring a bold head silhouette layout, this slide highlights six key elements of innovative thinking—perfect for workshops, leadership discussions, or startup pitches. Fully customizable in PowerPoint, Keynote, and Google Slides.


8 diapositivas
Medical Case Study Presentation
Elevate your medical presentations with our "Medical Case Study Presentation" template. This infographic is expertly designed to outline medical case studies or healthcare data, showcasing a central image flanked by related statistics and information. Each segment is linked to a visually distinct icon, representing different health metrics or case points, making it easier to digest complex medical information. This template is perfect for medical professionals, educators, and healthcare analysts, providing a structured way to present findings, research, or patient data effectively. Compatible with PowerPoint, Keynote, and Google Slides, it ensures your medical data is communicated clearly and professionally.


3 diapositivas
Triangle Diagram for Strategic Layers Presentation
Visualize interconnected processes or layered strategies with the Triangle Diagram for Strategic Layers Presentation. This slide features three dynamic triangle shapes arranged in a circular flow, perfect for representing cycles, frameworks, or pillars of a system. Each point includes space for a title, icon, and supporting text. Great for illustrating collaboration, dependencies, or strategic pillars. Compatible with PowerPoint, Keynote, and Google Slides.


6 diapositivas
Mission and Values Overview Presentation
Your company's purpose deserves a visually stunning story! This infographic presentation template helps you clearly outline core values and mission statements with an engaging, structured design. Ideal for business strategy meetings, corporate presentations, and branding discussions, it keeps your content professional and impactful. Fully customizable and compatible with PowerPoint, Keynote, and Google Slides.


7 diapositivas
Cognitive Psychology and Decision Making Presentation
Navigate the intricate relationship between thought processes and decision-making with our 'Cognitive Psychology and Decision Making' presentation template. Ideal for educators, psychologists, and business strategists, this template provides a structured way to explain how cognitive functions influence decisions. Enhance your next seminar or workshop with this visually engaging template, compatible with PowerPoint, Keynote, and Google Slides.


5 diapositivas
Marketing Funnel AIDA Breakdown
Visually map out your marketing strategy with the Marketing Funnel AIDA Breakdown Presentation. This template clearly illustrates the four essential stages—Attention, Interest, Desire, and Action—using a clean funnel design for easy audience understanding. Ideal for sales pitches, marketing plans, and campaign reports. Fully editable in PowerPoint, Keynote, and Google Slides.


6 diapositivas
Construction Company Infographics
Construct a clear and compelling presentation for your Construction Company with our customizable infographic template. This template is fully compatible with popular presentation software like PowerPoint, Keynote, and Google Slides, allowing you to easily tailor it to showcase various aspects of your construction business. The Construction Company infographic template offers a visually engaging platform to highlight your company's services, projects, team, and achievements. Whether you're a construction company owner, project manager, or marketing professional, this template provides a user-friendly canvas to create informative presentations and promotional materials. Elevate your construction company's profile with this SEO-optimized Construction Company infographic template, thoughtfully designed for clarity and ease of use. Customize it to showcase your company's portfolio, expertise, safety measures, and client testimonials, ensuring you make a lasting impression on your audience. Start crafting your personalized infographic today to showcase your construction company effectively.


10 diapositivas
5-Level Circular Diagram Presentation
Visualize complex concepts with this professional 5-Level Circular Diagram template. Perfect for business strategies, project planning, and hierarchical structures, it provides a clear, layered approach. Fully editable and compatible with PowerPoint, Keynote, and Google Slides, this design ensures a polished, impactful presentation with structured, easy-to-understand visuals.


6 diapositivas
Managing Transition in Business Presentation
Make your next strategy session visually unforgettable with this clean, step-by-step layout. Designed to help explain transitional phases in business, this infographic template simplifies complex change processes into digestible segments. Ideal for professionals presenting transformation strategies. Fully editable and compatible with PowerPoint, Keynote, and Google Slides for easy use.


5 diapositivas
SWOT Analysis Framework Presentation
The "SWOT Analysis Framework Presentation" template is strategically designed to help businesses and teams visually map out their Strengths, Weaknesses, Opportunities, and Threats. Each quadrant of the SWOT analysis is distinctly colored to facilitate quick recognition and understanding, enabling teams to efficiently analyze their internal and external environments. This template is versatile, suitable for a variety of industries and settings, from corporate strategic planning sessions to educational business courses. It aids in clearly identifying key factors that could influence future business decisions and strategies, making it an essential tool for any organization aiming to enhance its strategic planning process.