


Características


¿Tienes alguna pregunta?
Recomendar


4 diapositivas
Professional Business Meeting Agenda Presentation
Efficiently structure your next corporate gathering with the "Professional Business Meeting Agenda" presentation template. Its geometrically appealing layout organizes discussion points in a visually captivating manner, encouraging effective communication and engagement. Perfect for strategizing sessions, this template ensures that every item on your agenda is highlighted with clarity. Compatible across PowerPoint, Keynote, and Google Slides, it’s designed to make every meeting more productive.


9 diapositivas
Sales Pitch Proposal Presentation
Win over your prospects with our Sales Pitch Proposal presentation template, crafted to highlight the strengths of your product or service compellingly and convincingly. The template opens with a bold title slide, immediately capturing attention, followed by a well-organized agenda that outlines the flow of your pitch. Dive into the 'Problem' slide to articulate the challenges your target audience faces, followed by the 'Solution - Steps' slide where you can break down how your offering addresses these challenges in phases. Showcase the 'Key Features' of your product, highlighting the unique benefits that set you apart from the competition. The 'Target Audience' slide allows you to visually represent the demographics of your ideal customer, making your proposal more relatable. The 'Pricing' slide is neatly designed for a clear display of your pricing tiers, ensuring transparency. Conclude with a 'Thank You' slide that leaves a lasting impression and a 'Credits' slide for due diligence. This template is adaptable for PowerPoint, Keynote, and Google Slides, ensuring a seamless presentation experience.
22 diapositivas
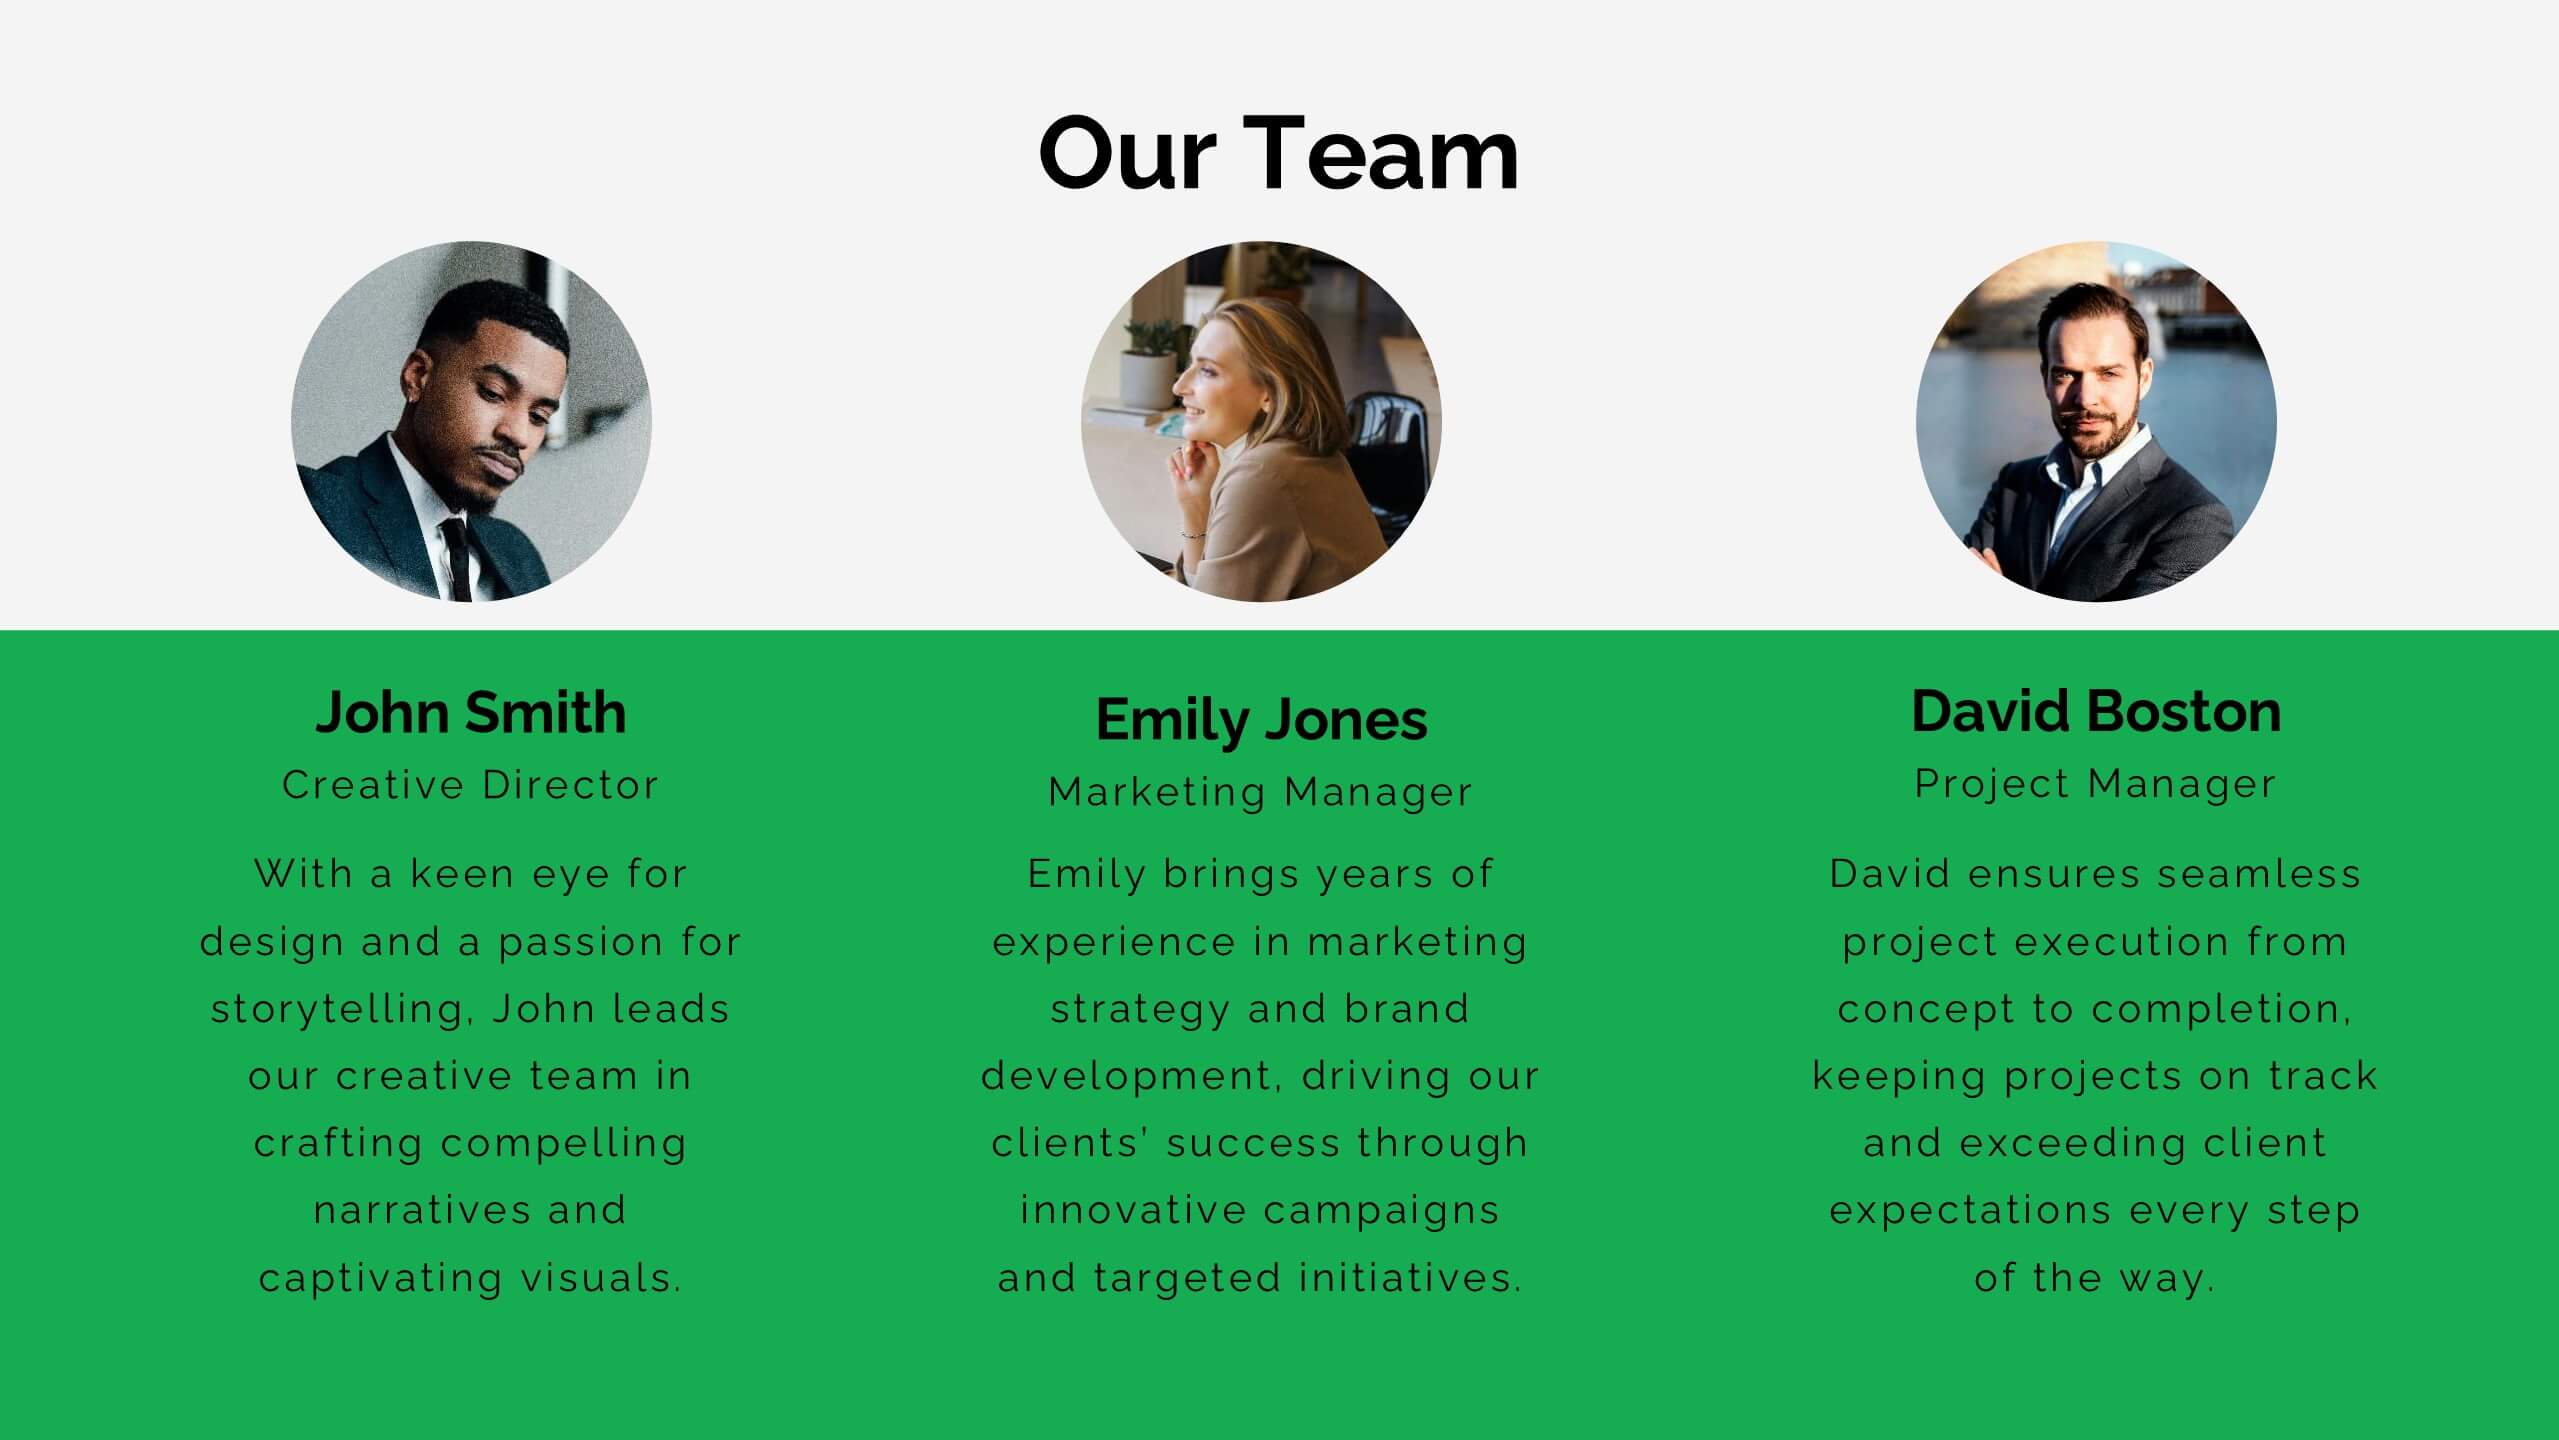
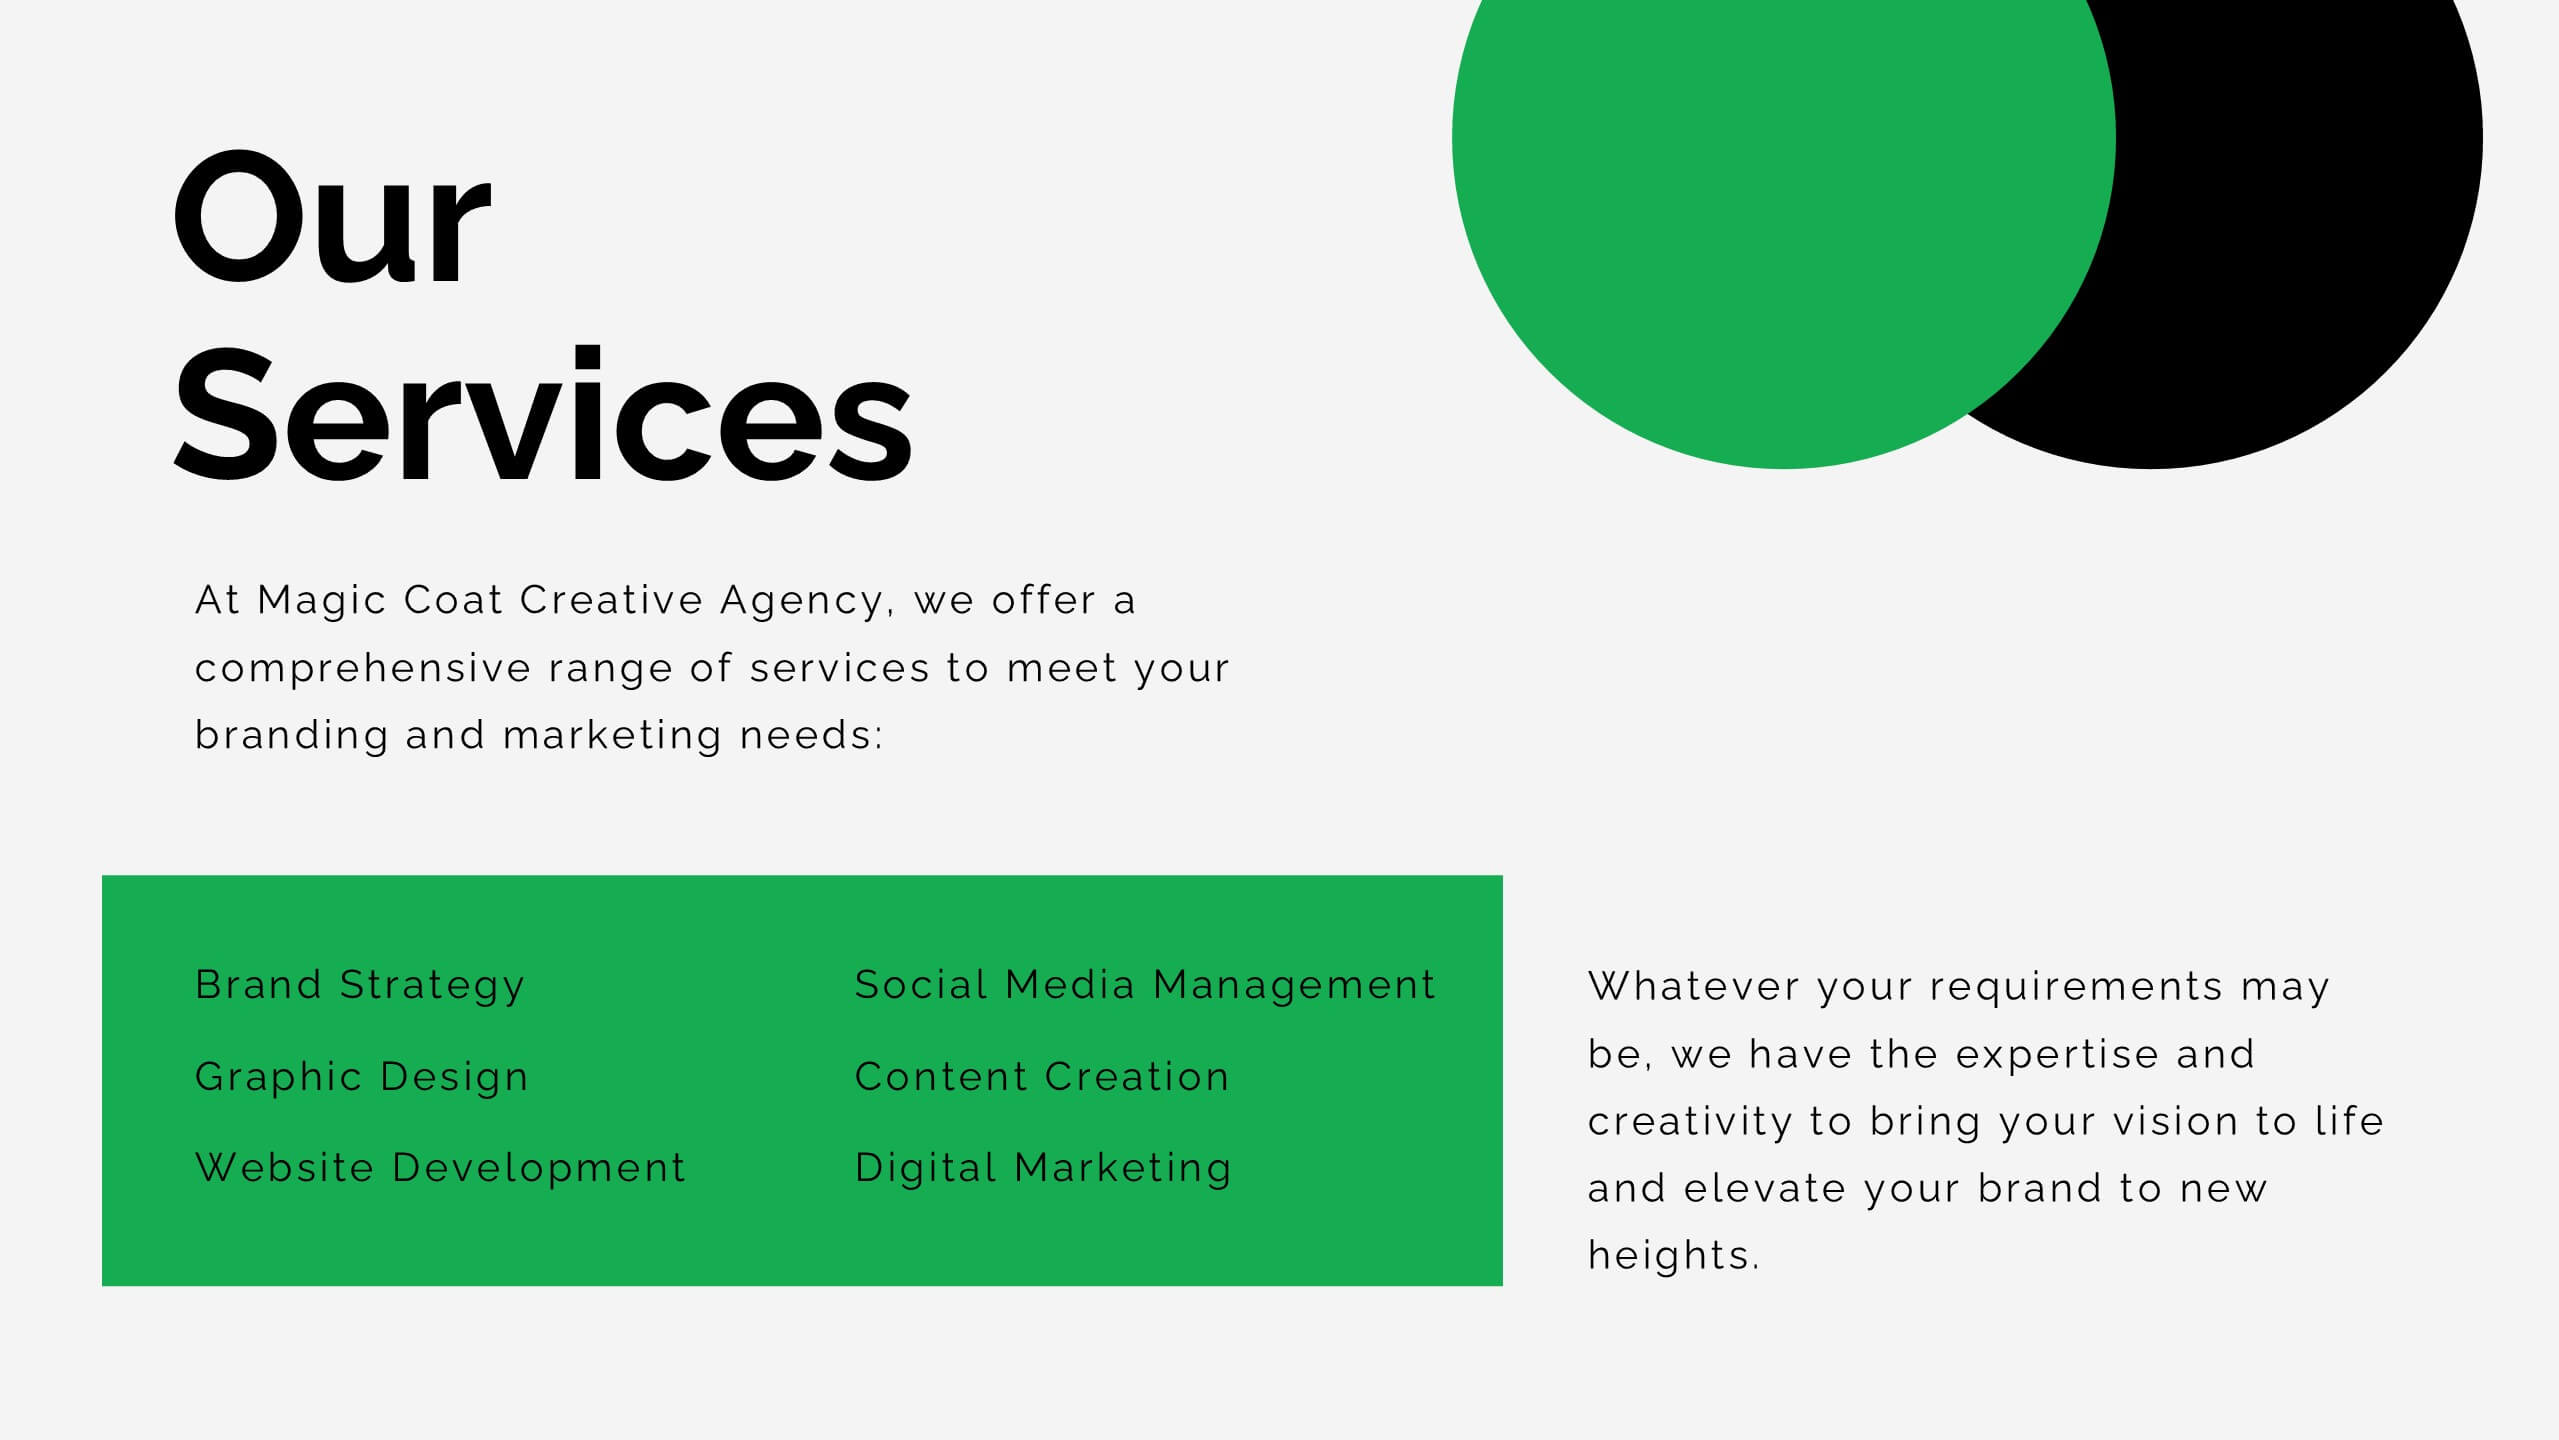
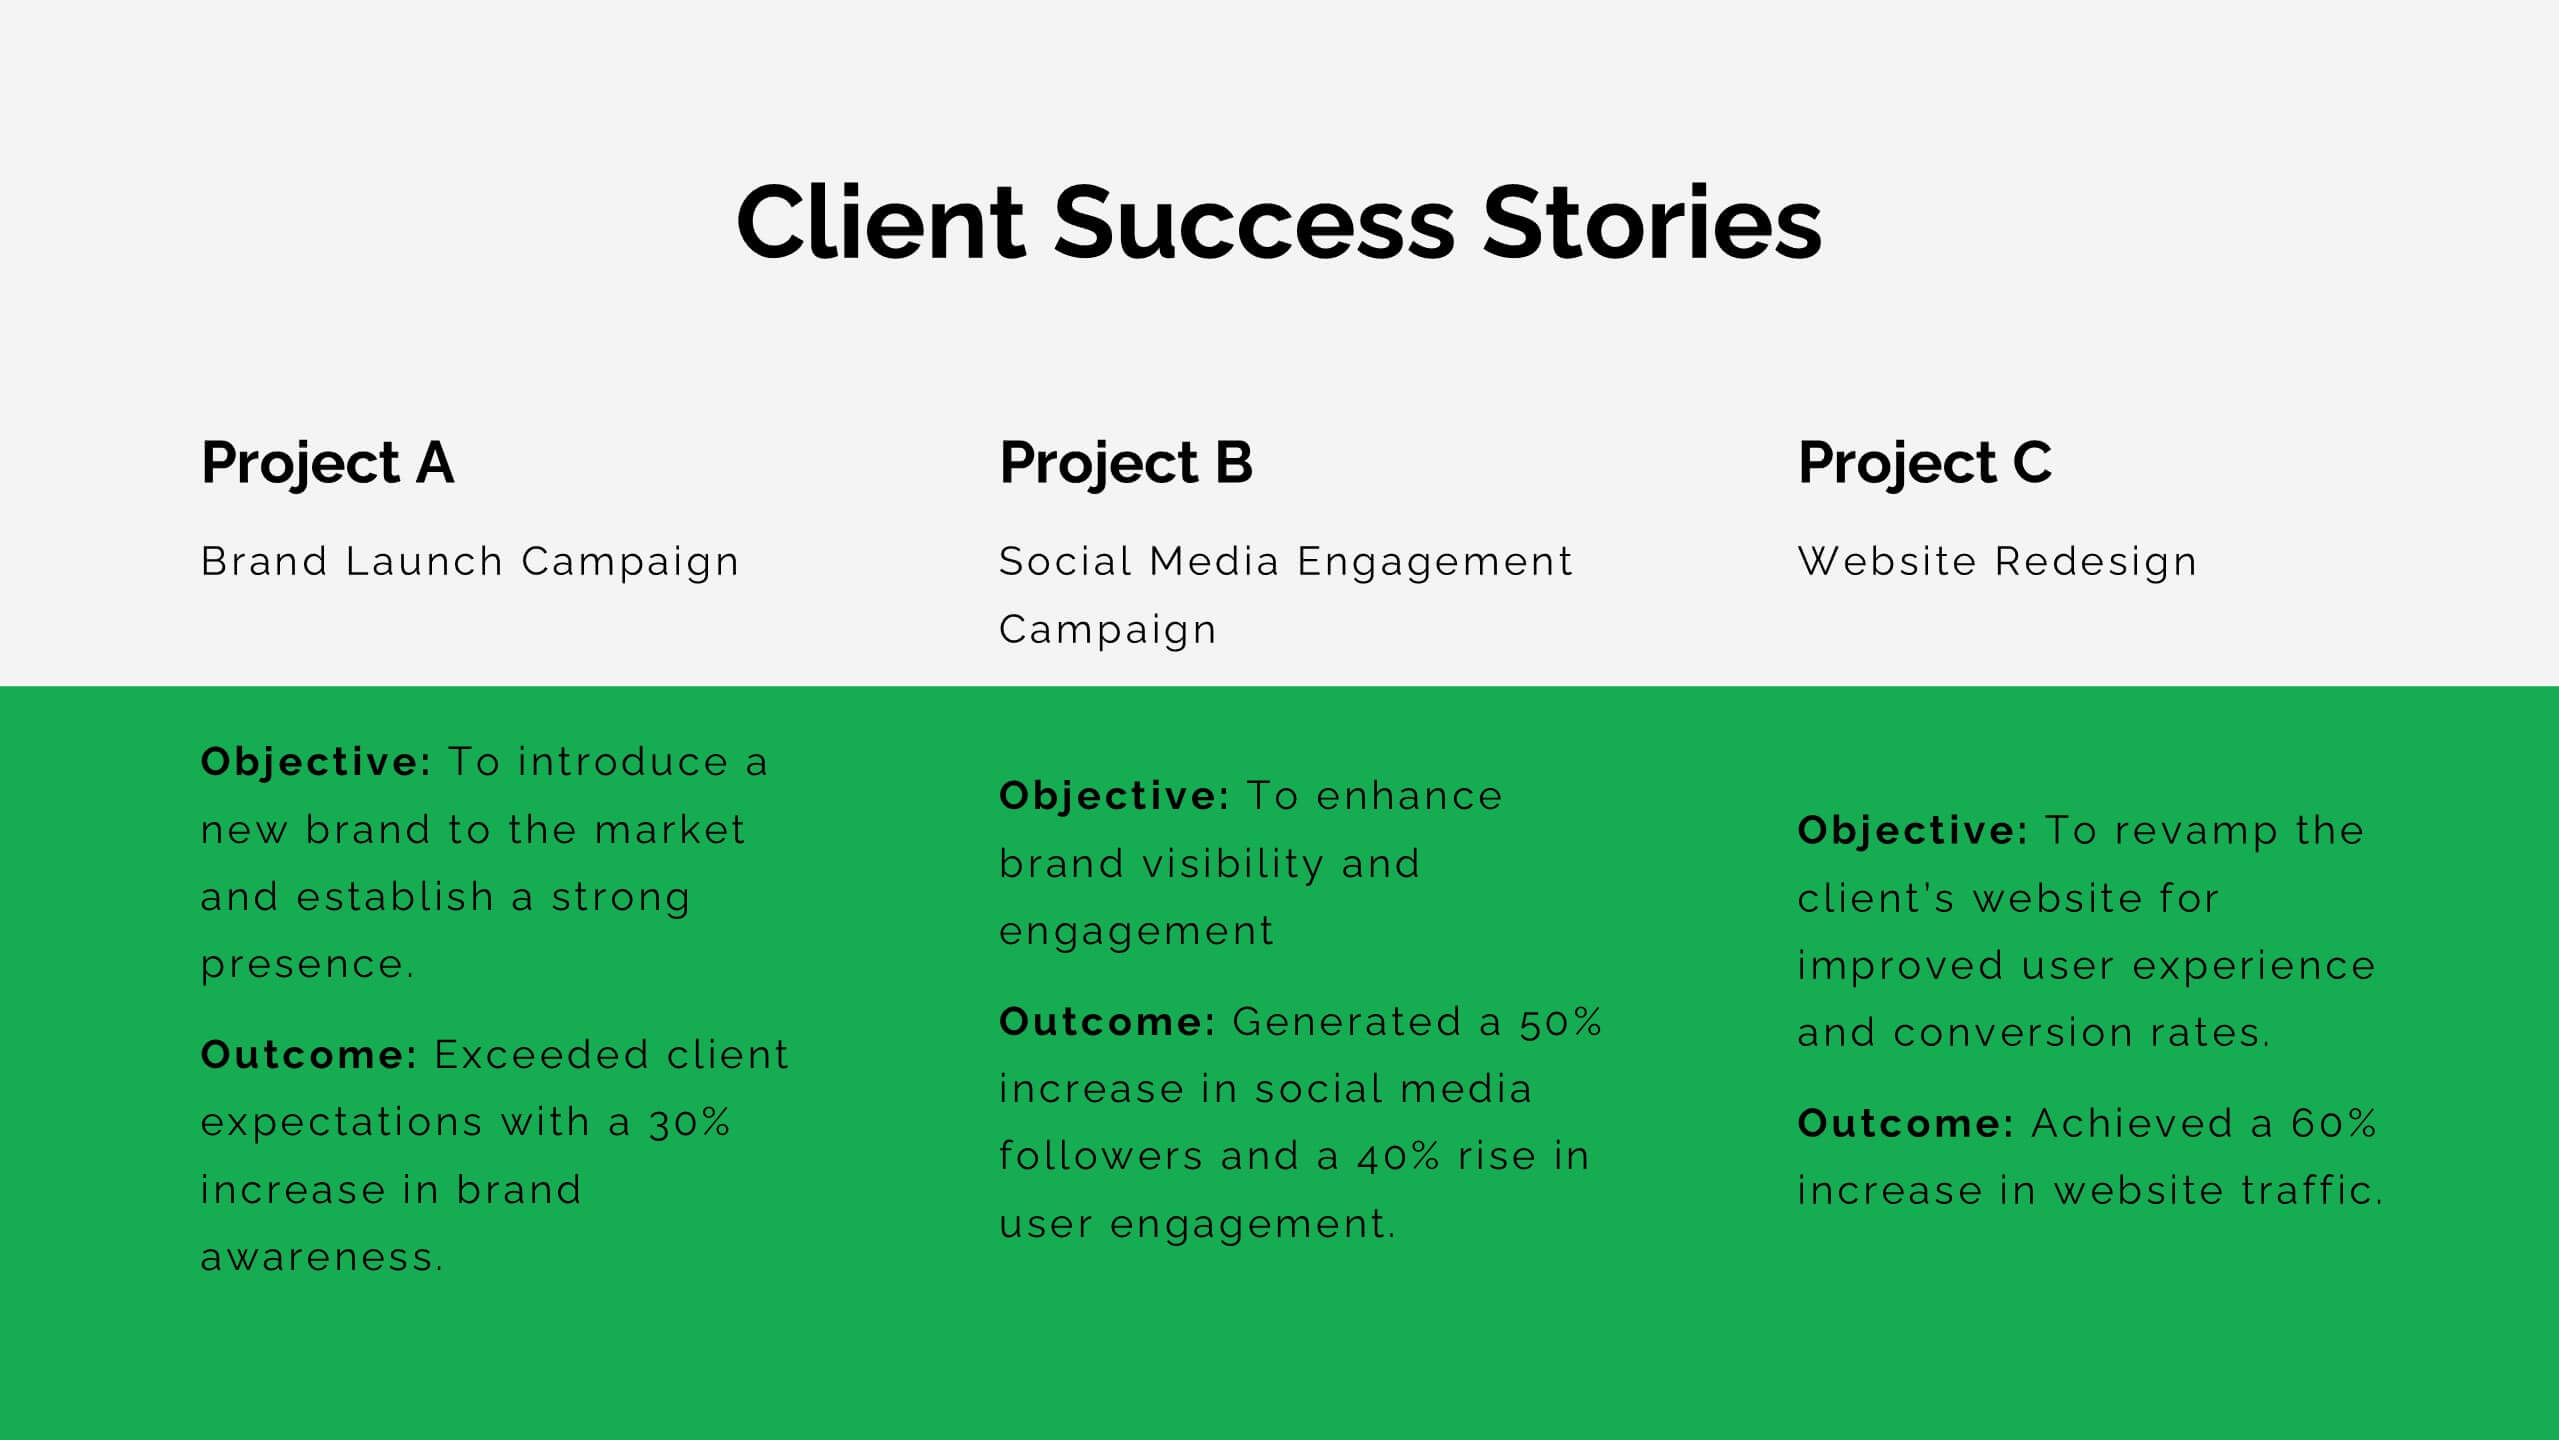
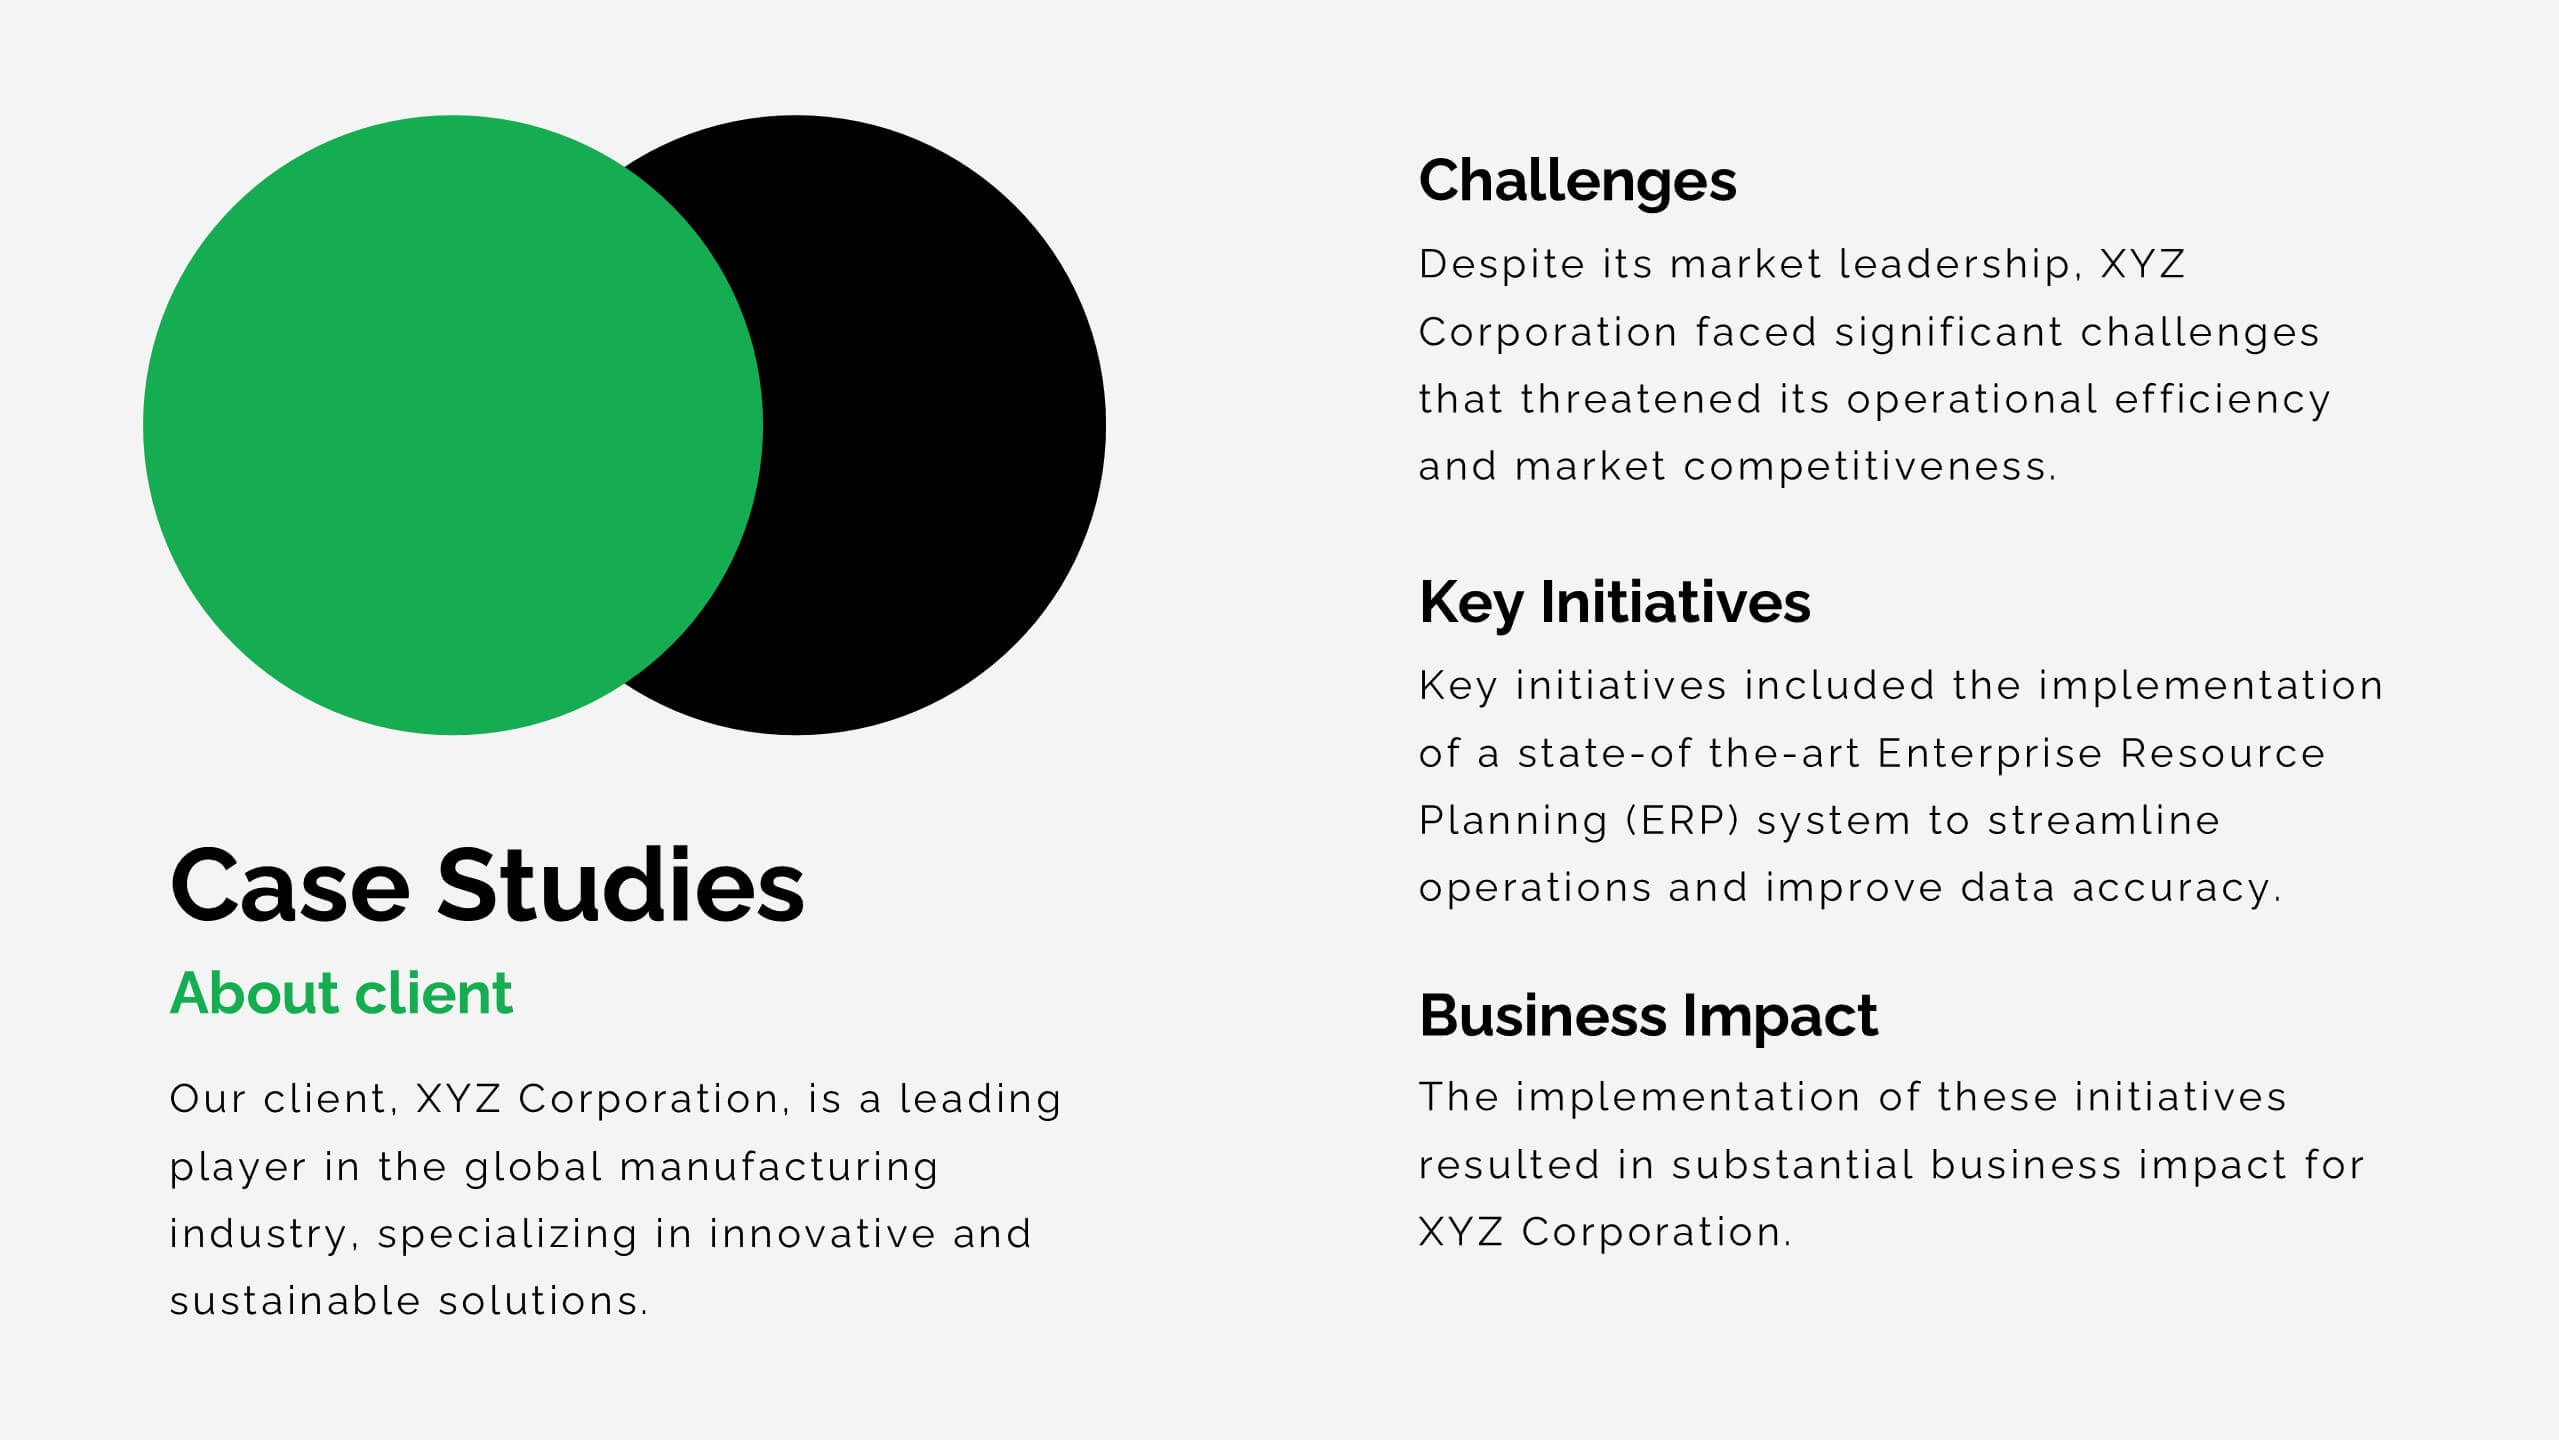
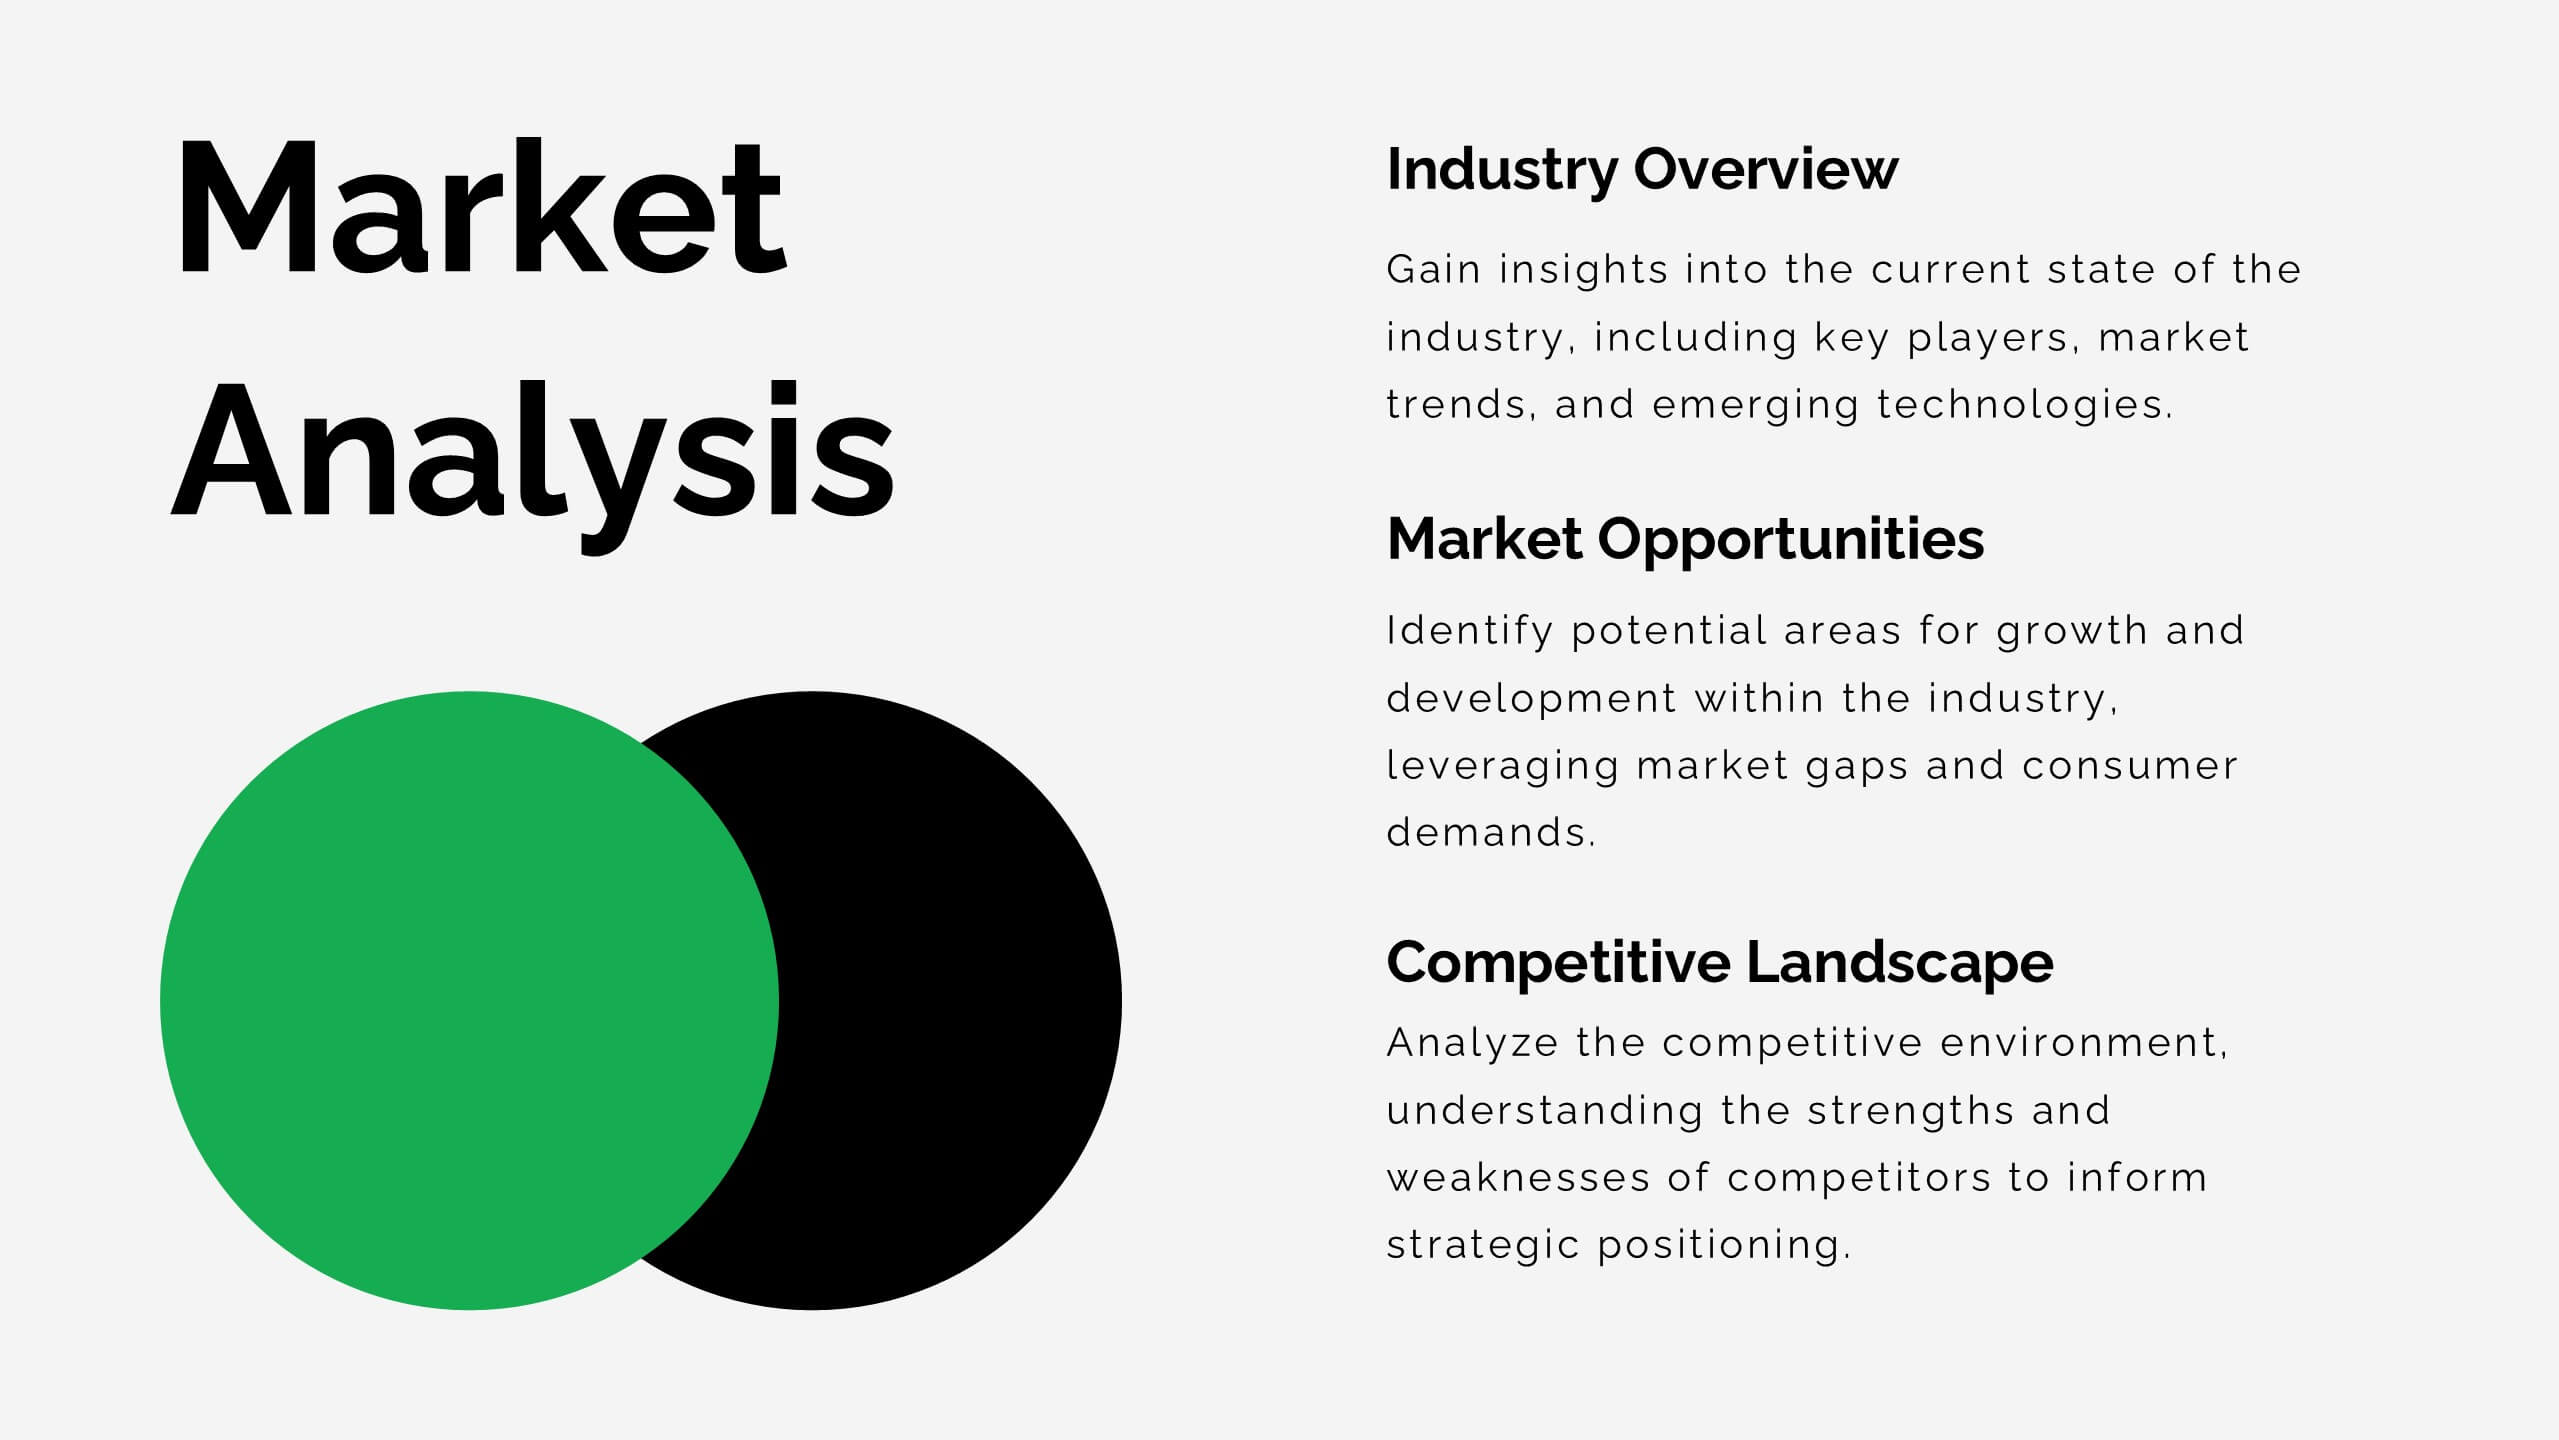
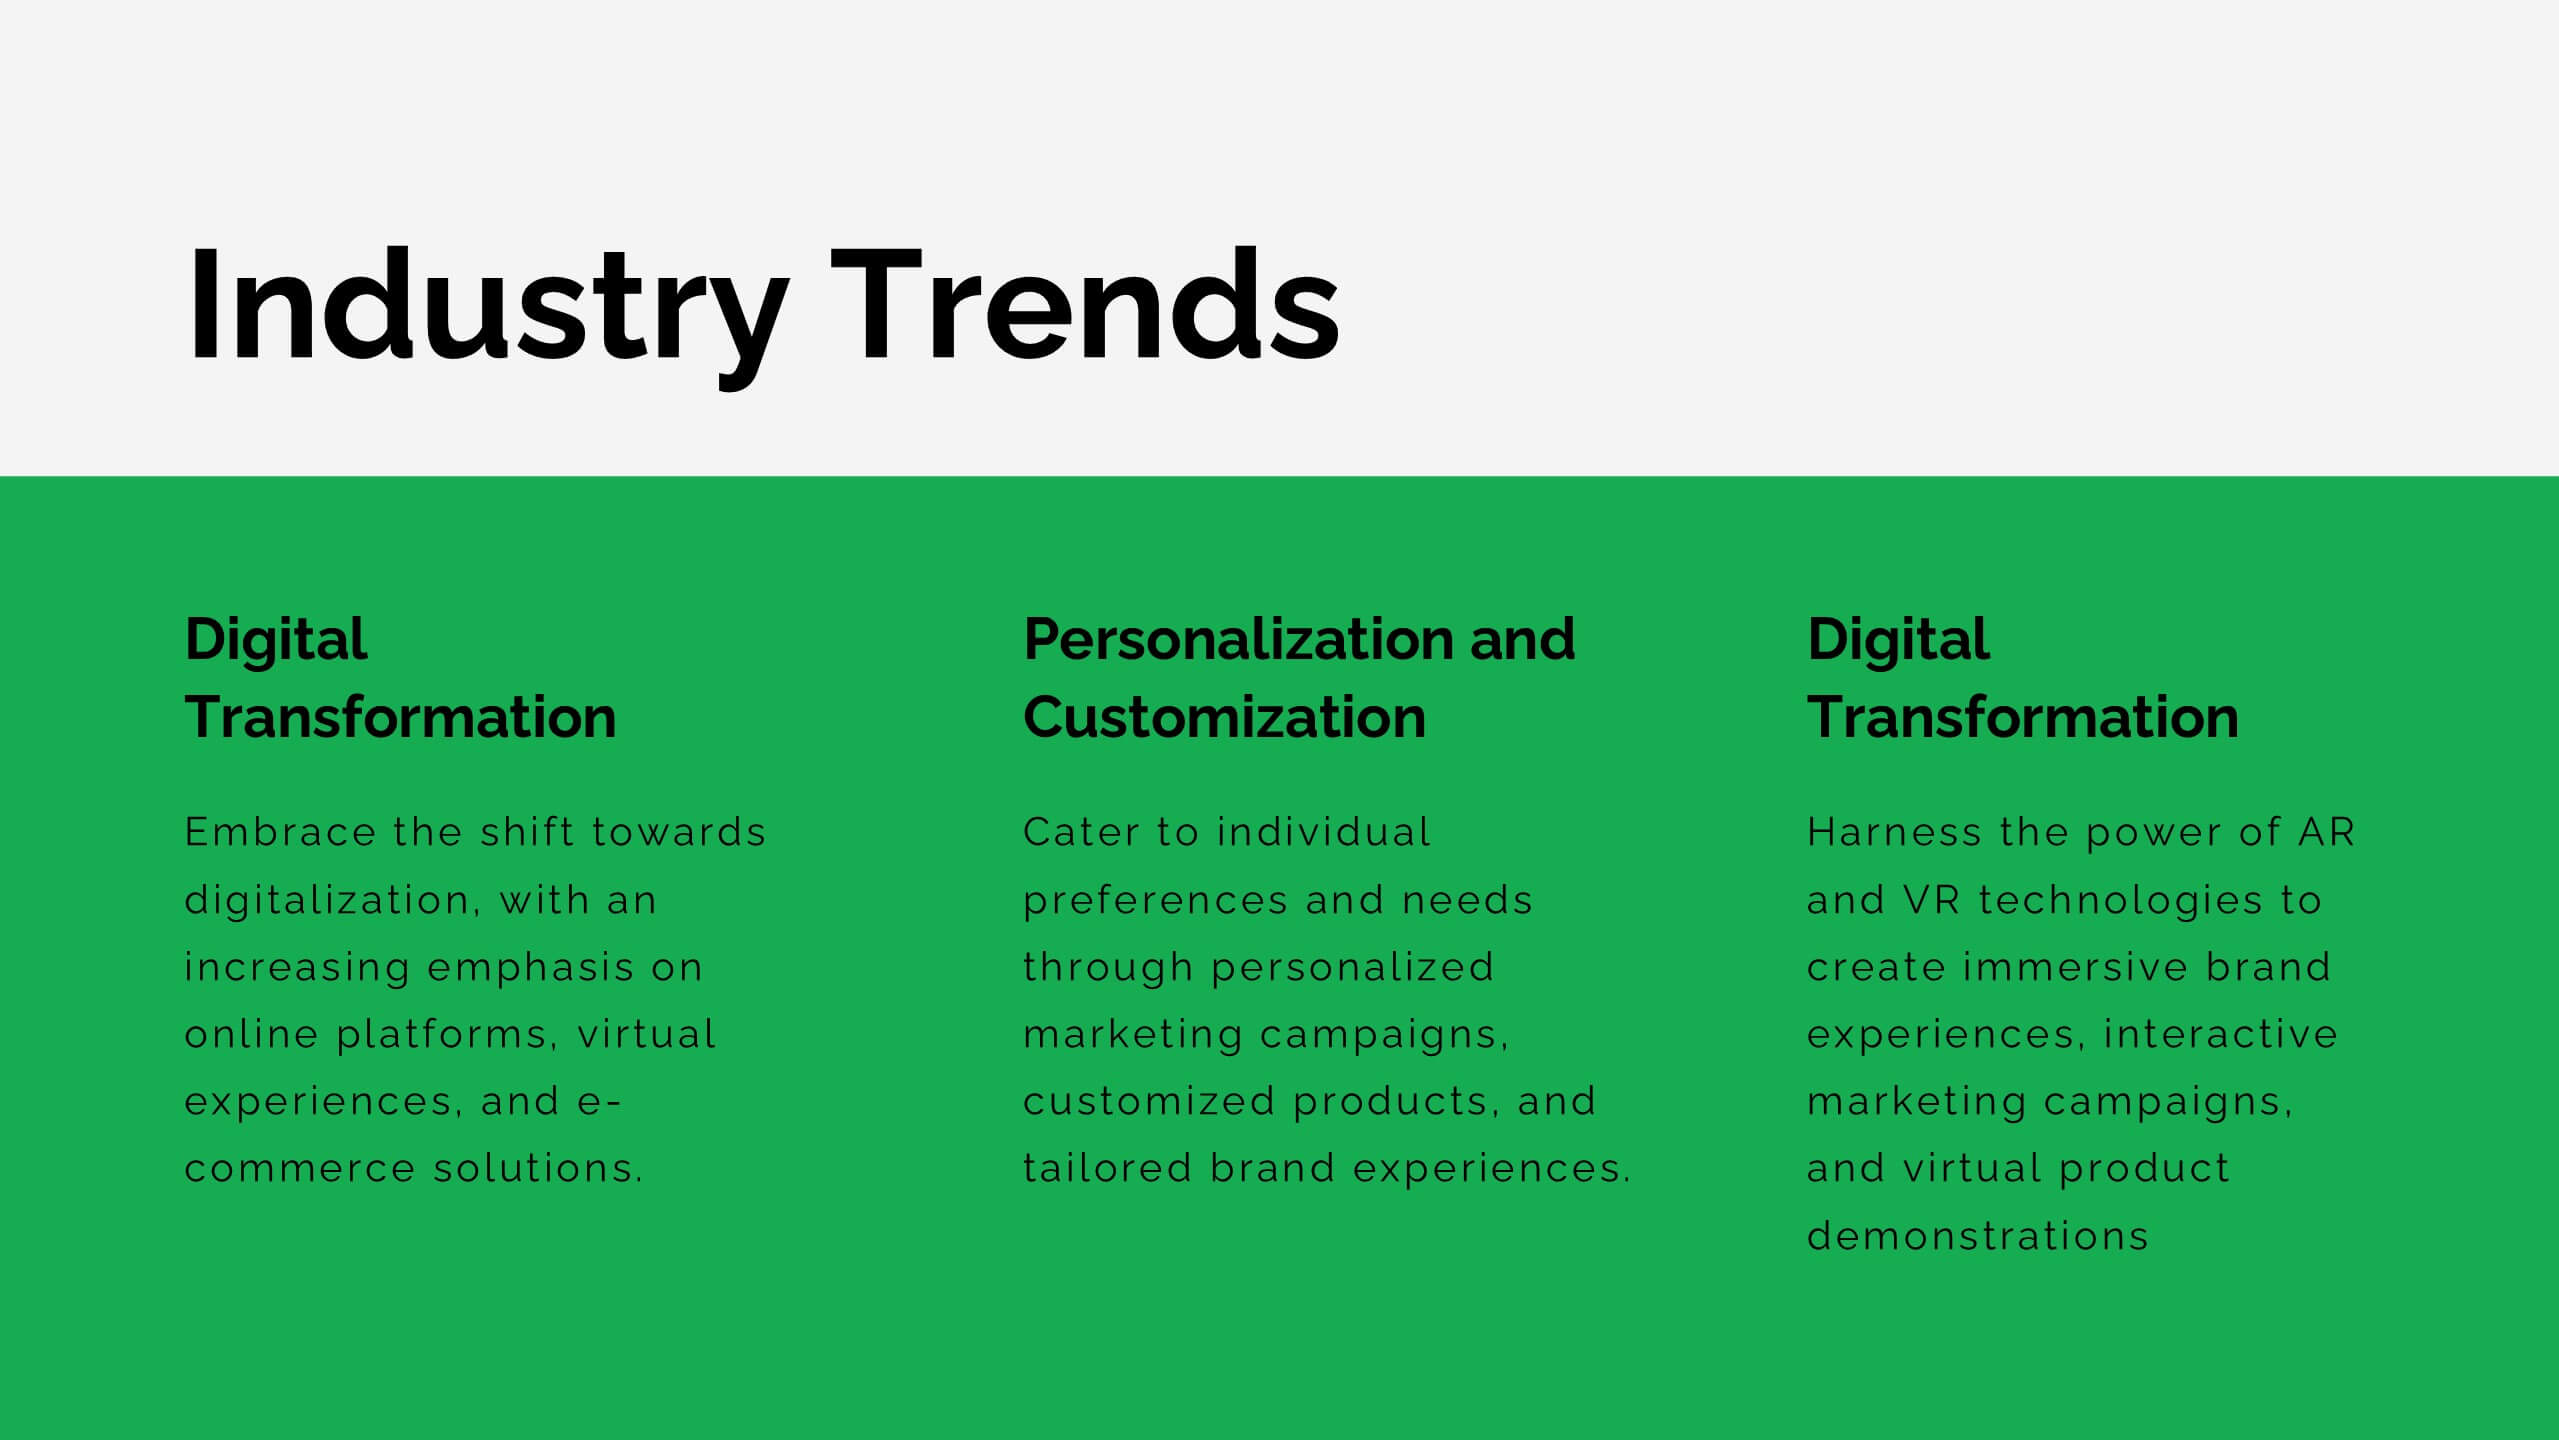
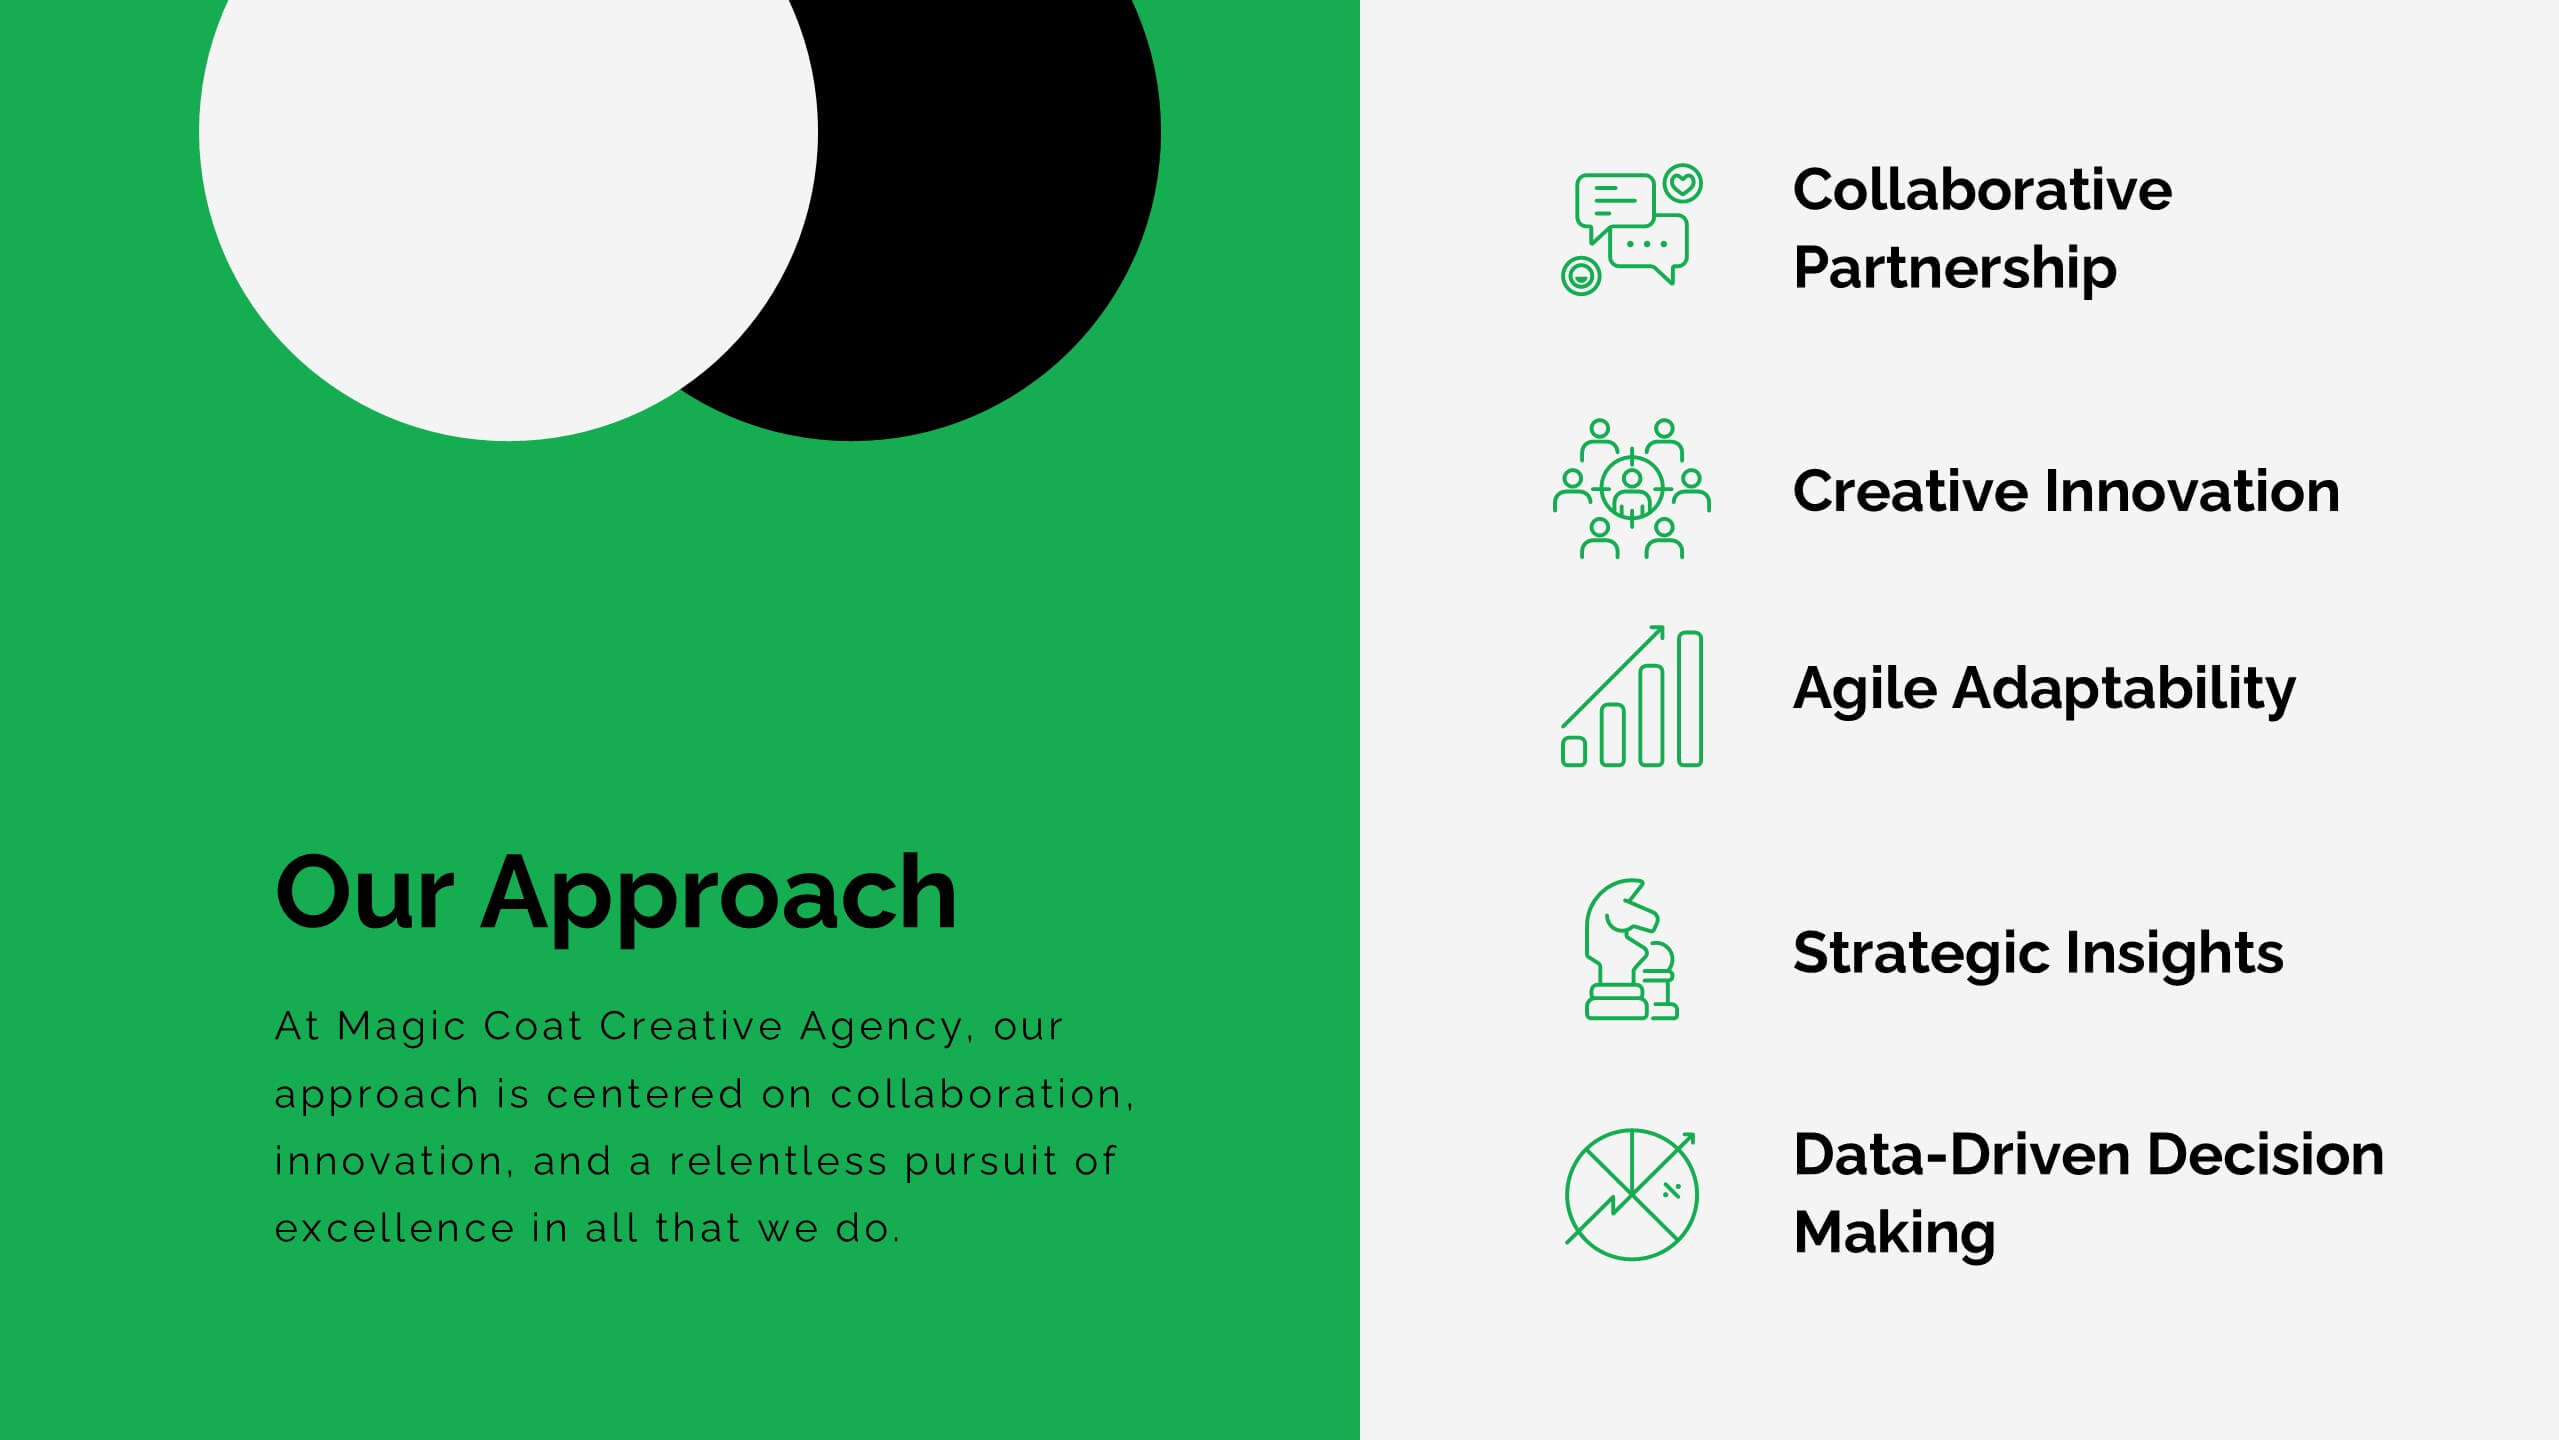
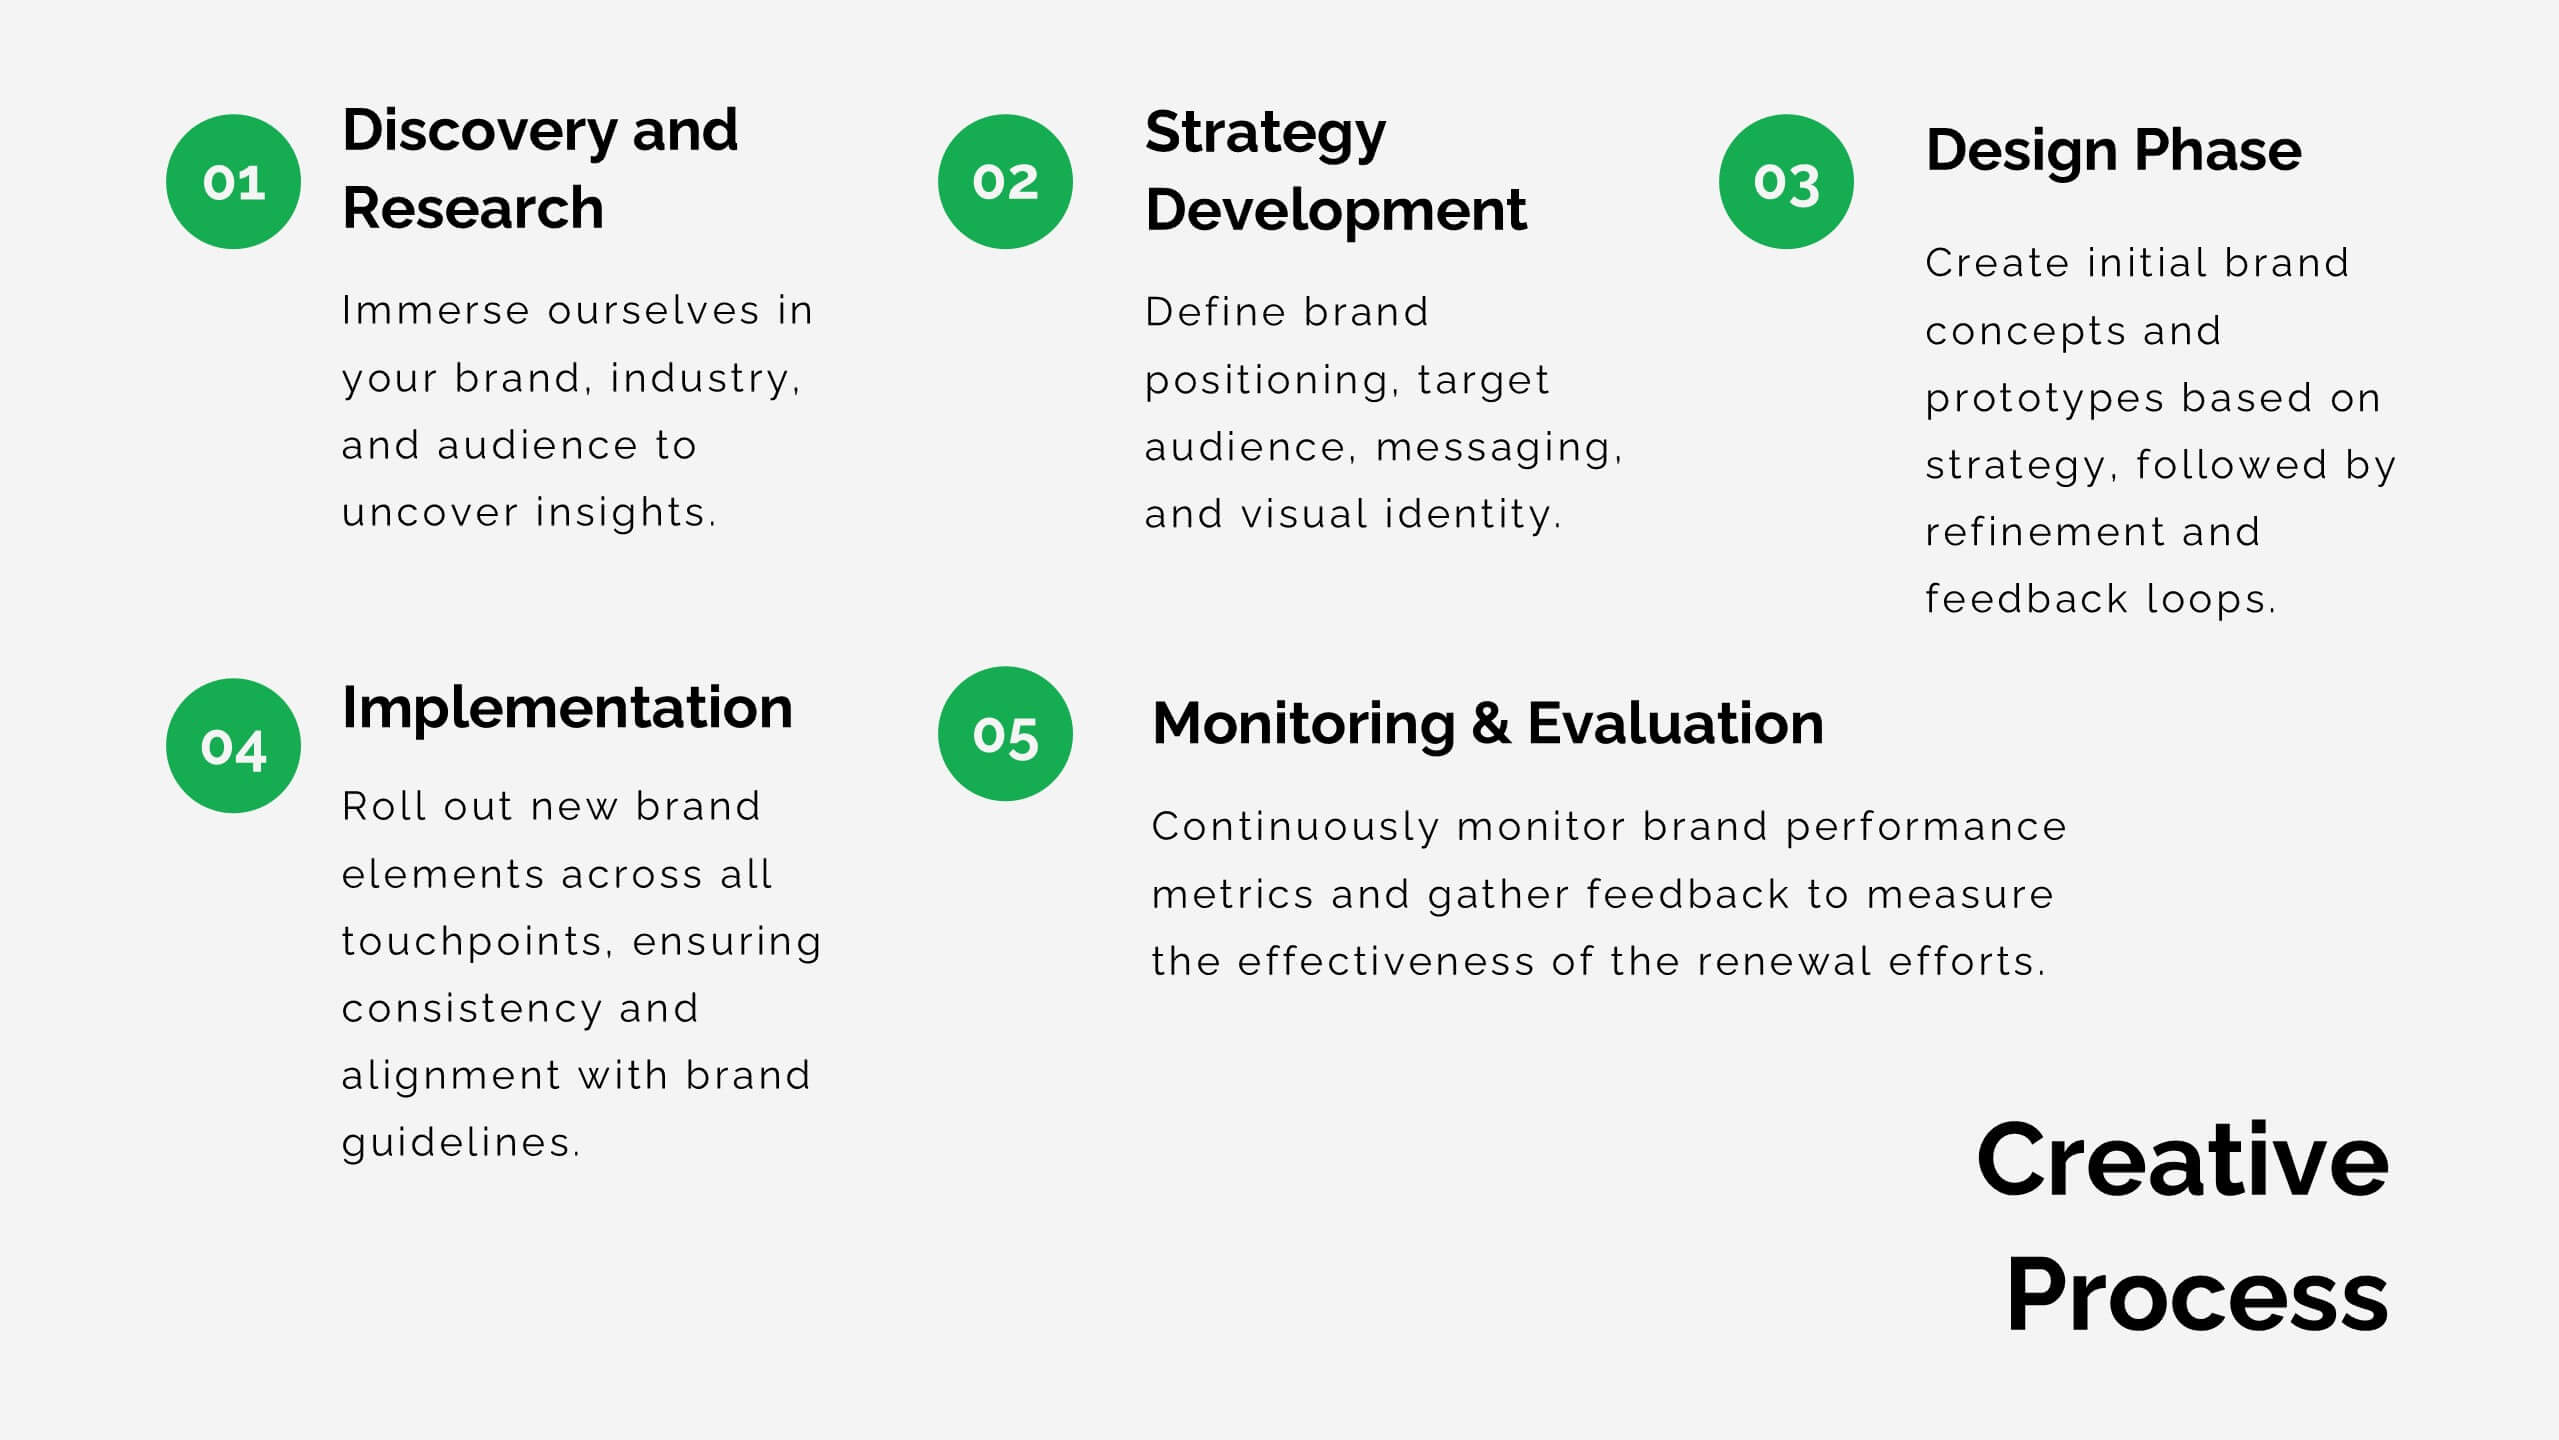
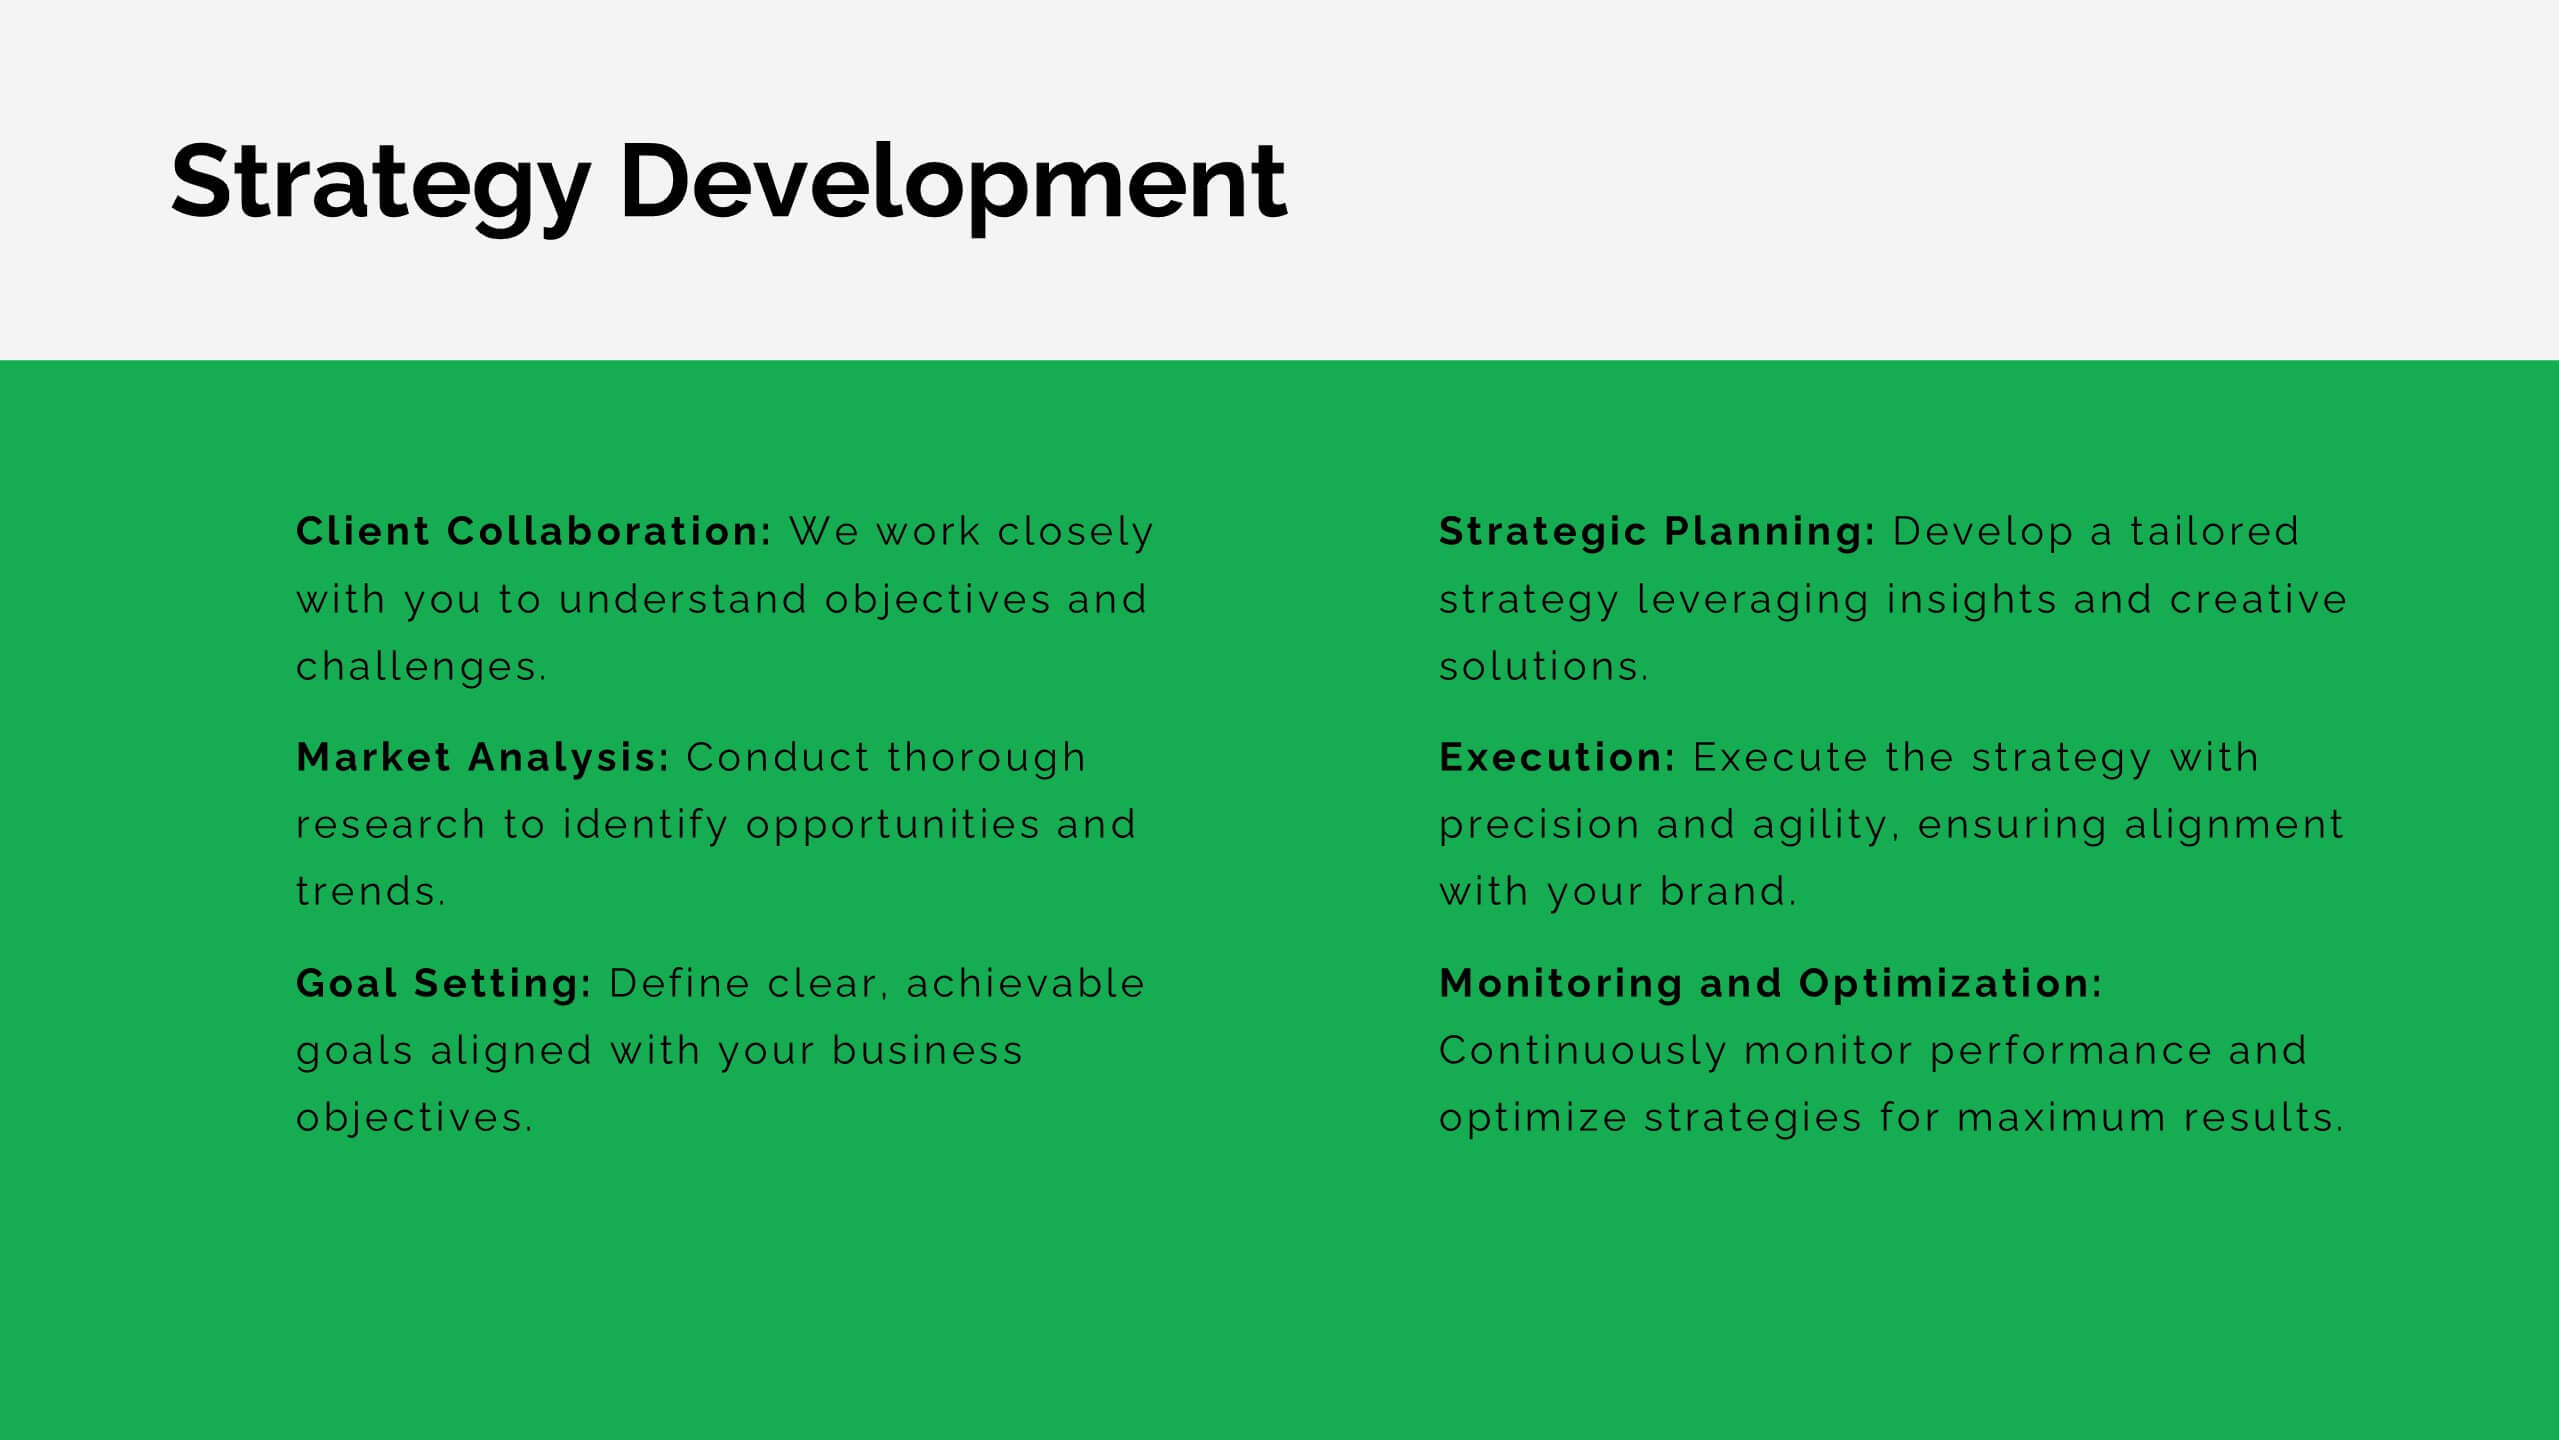
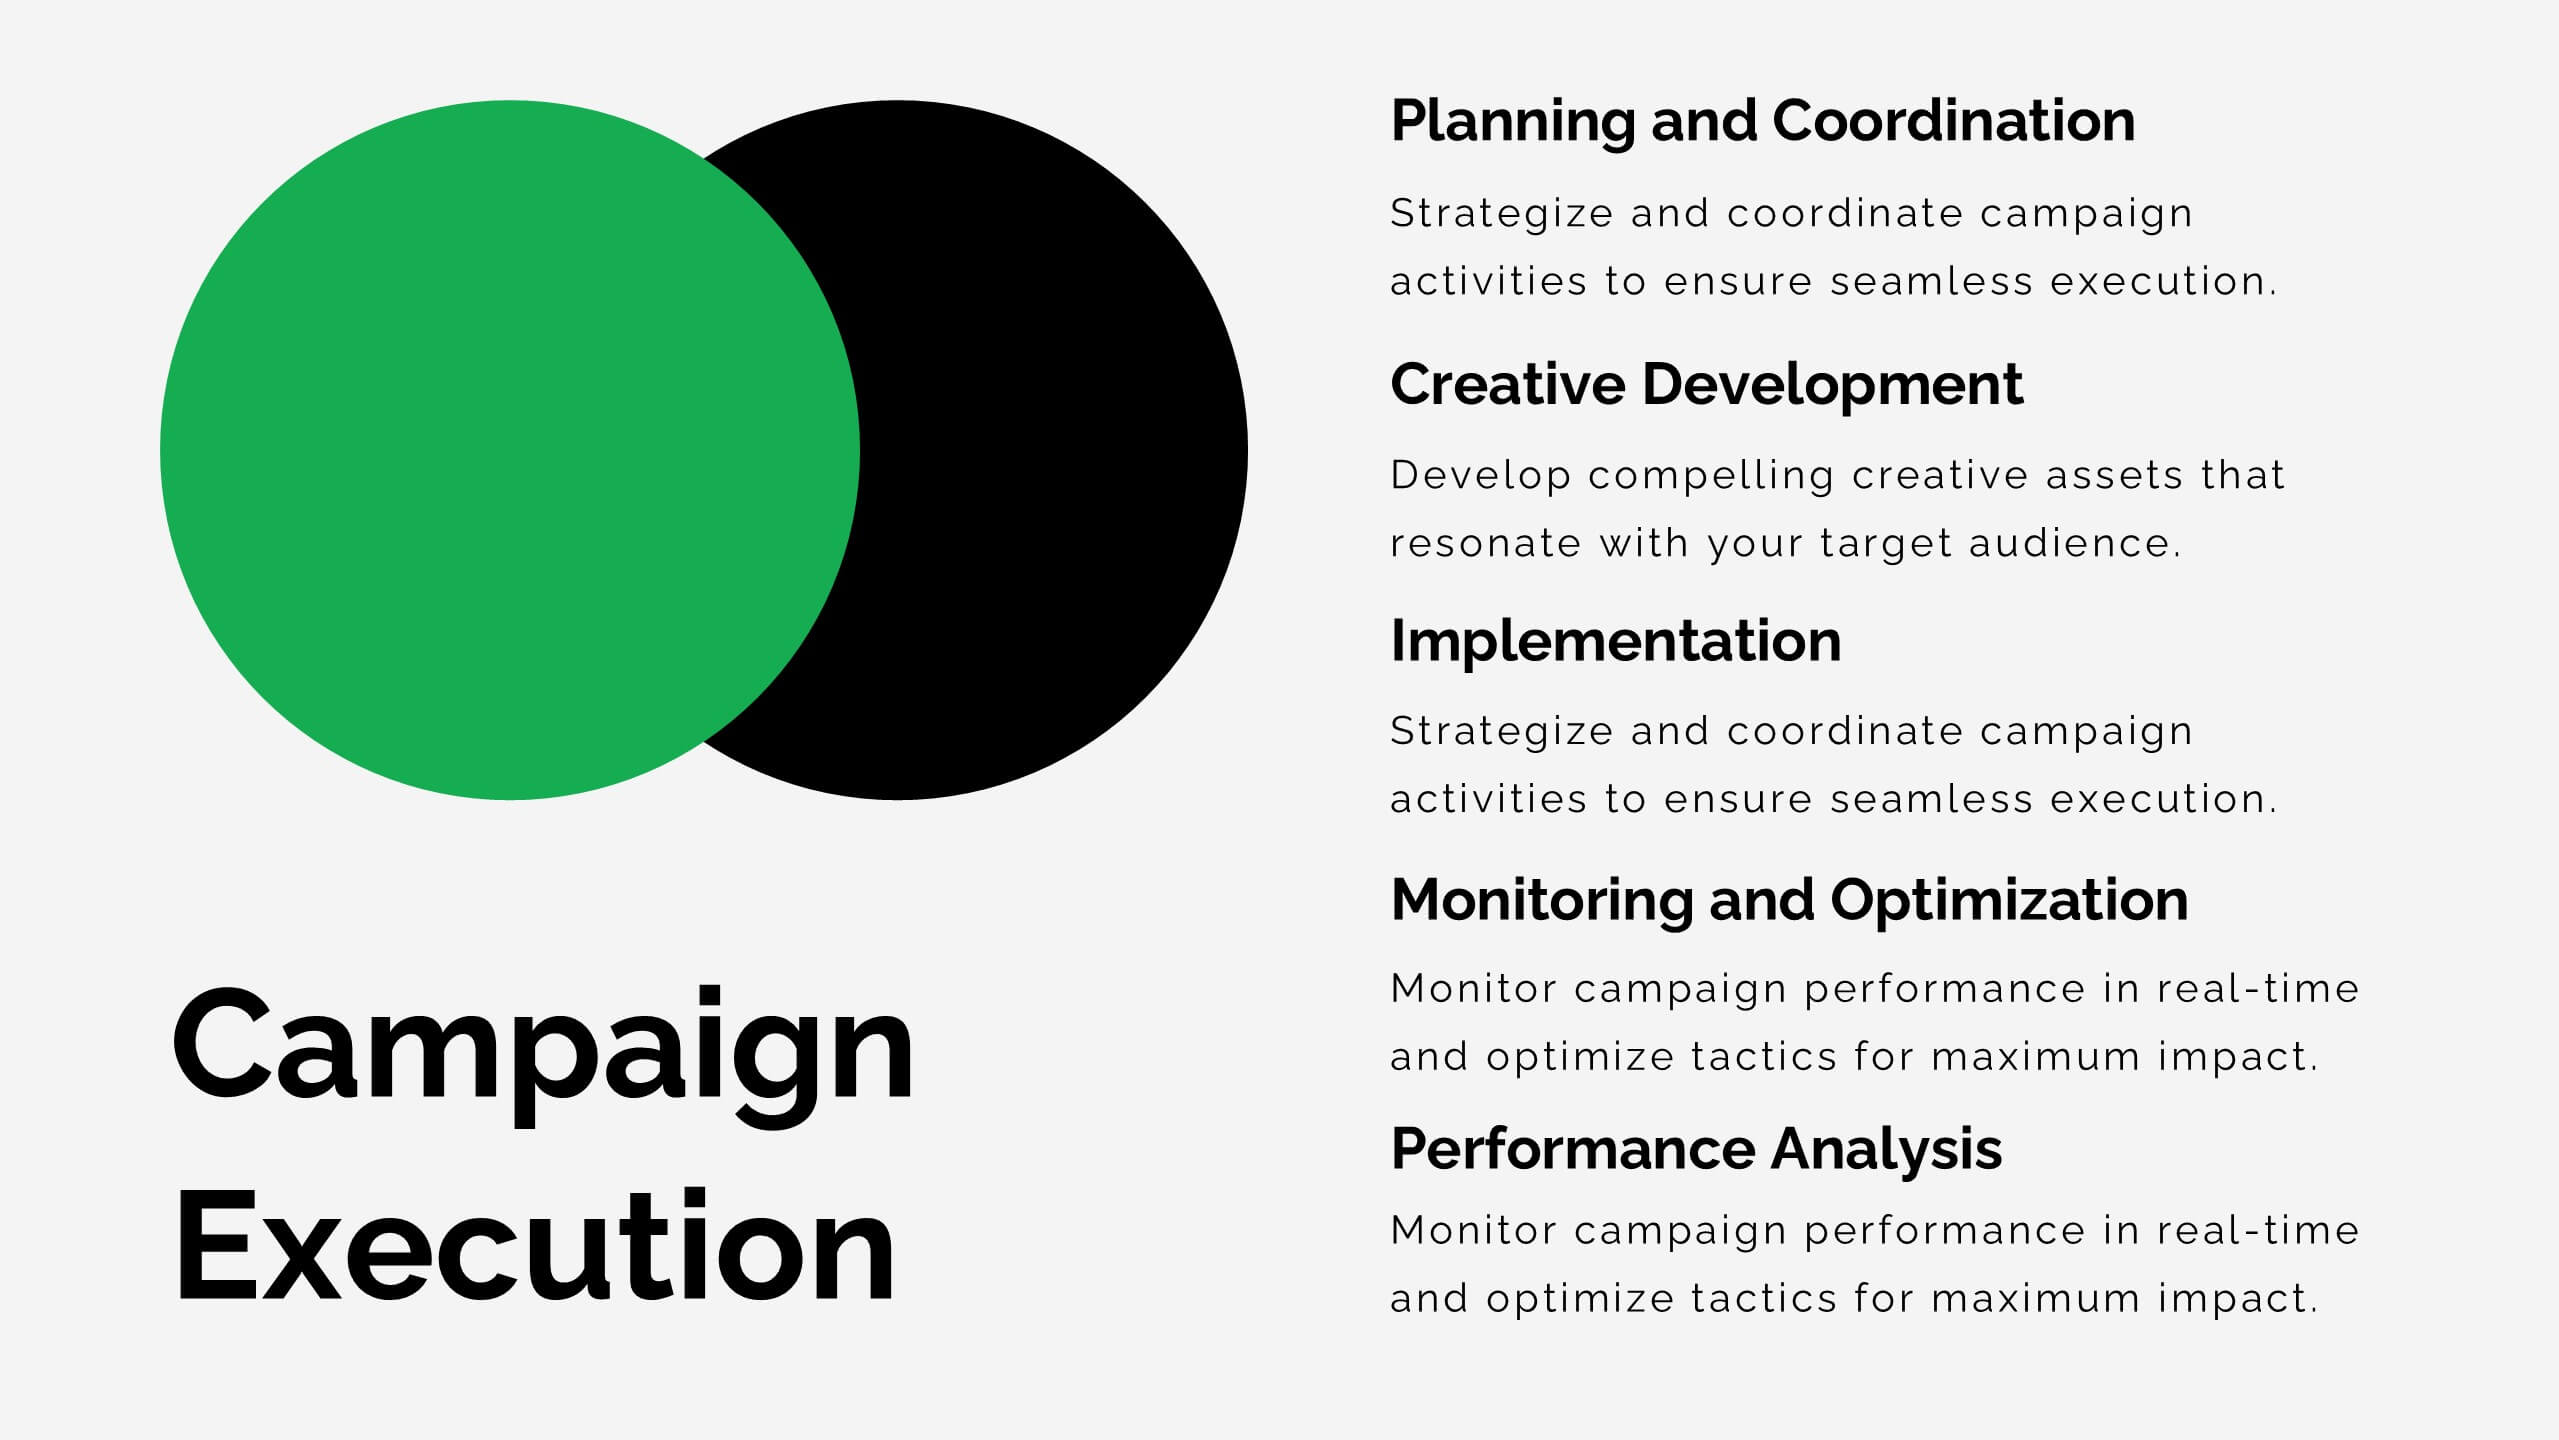
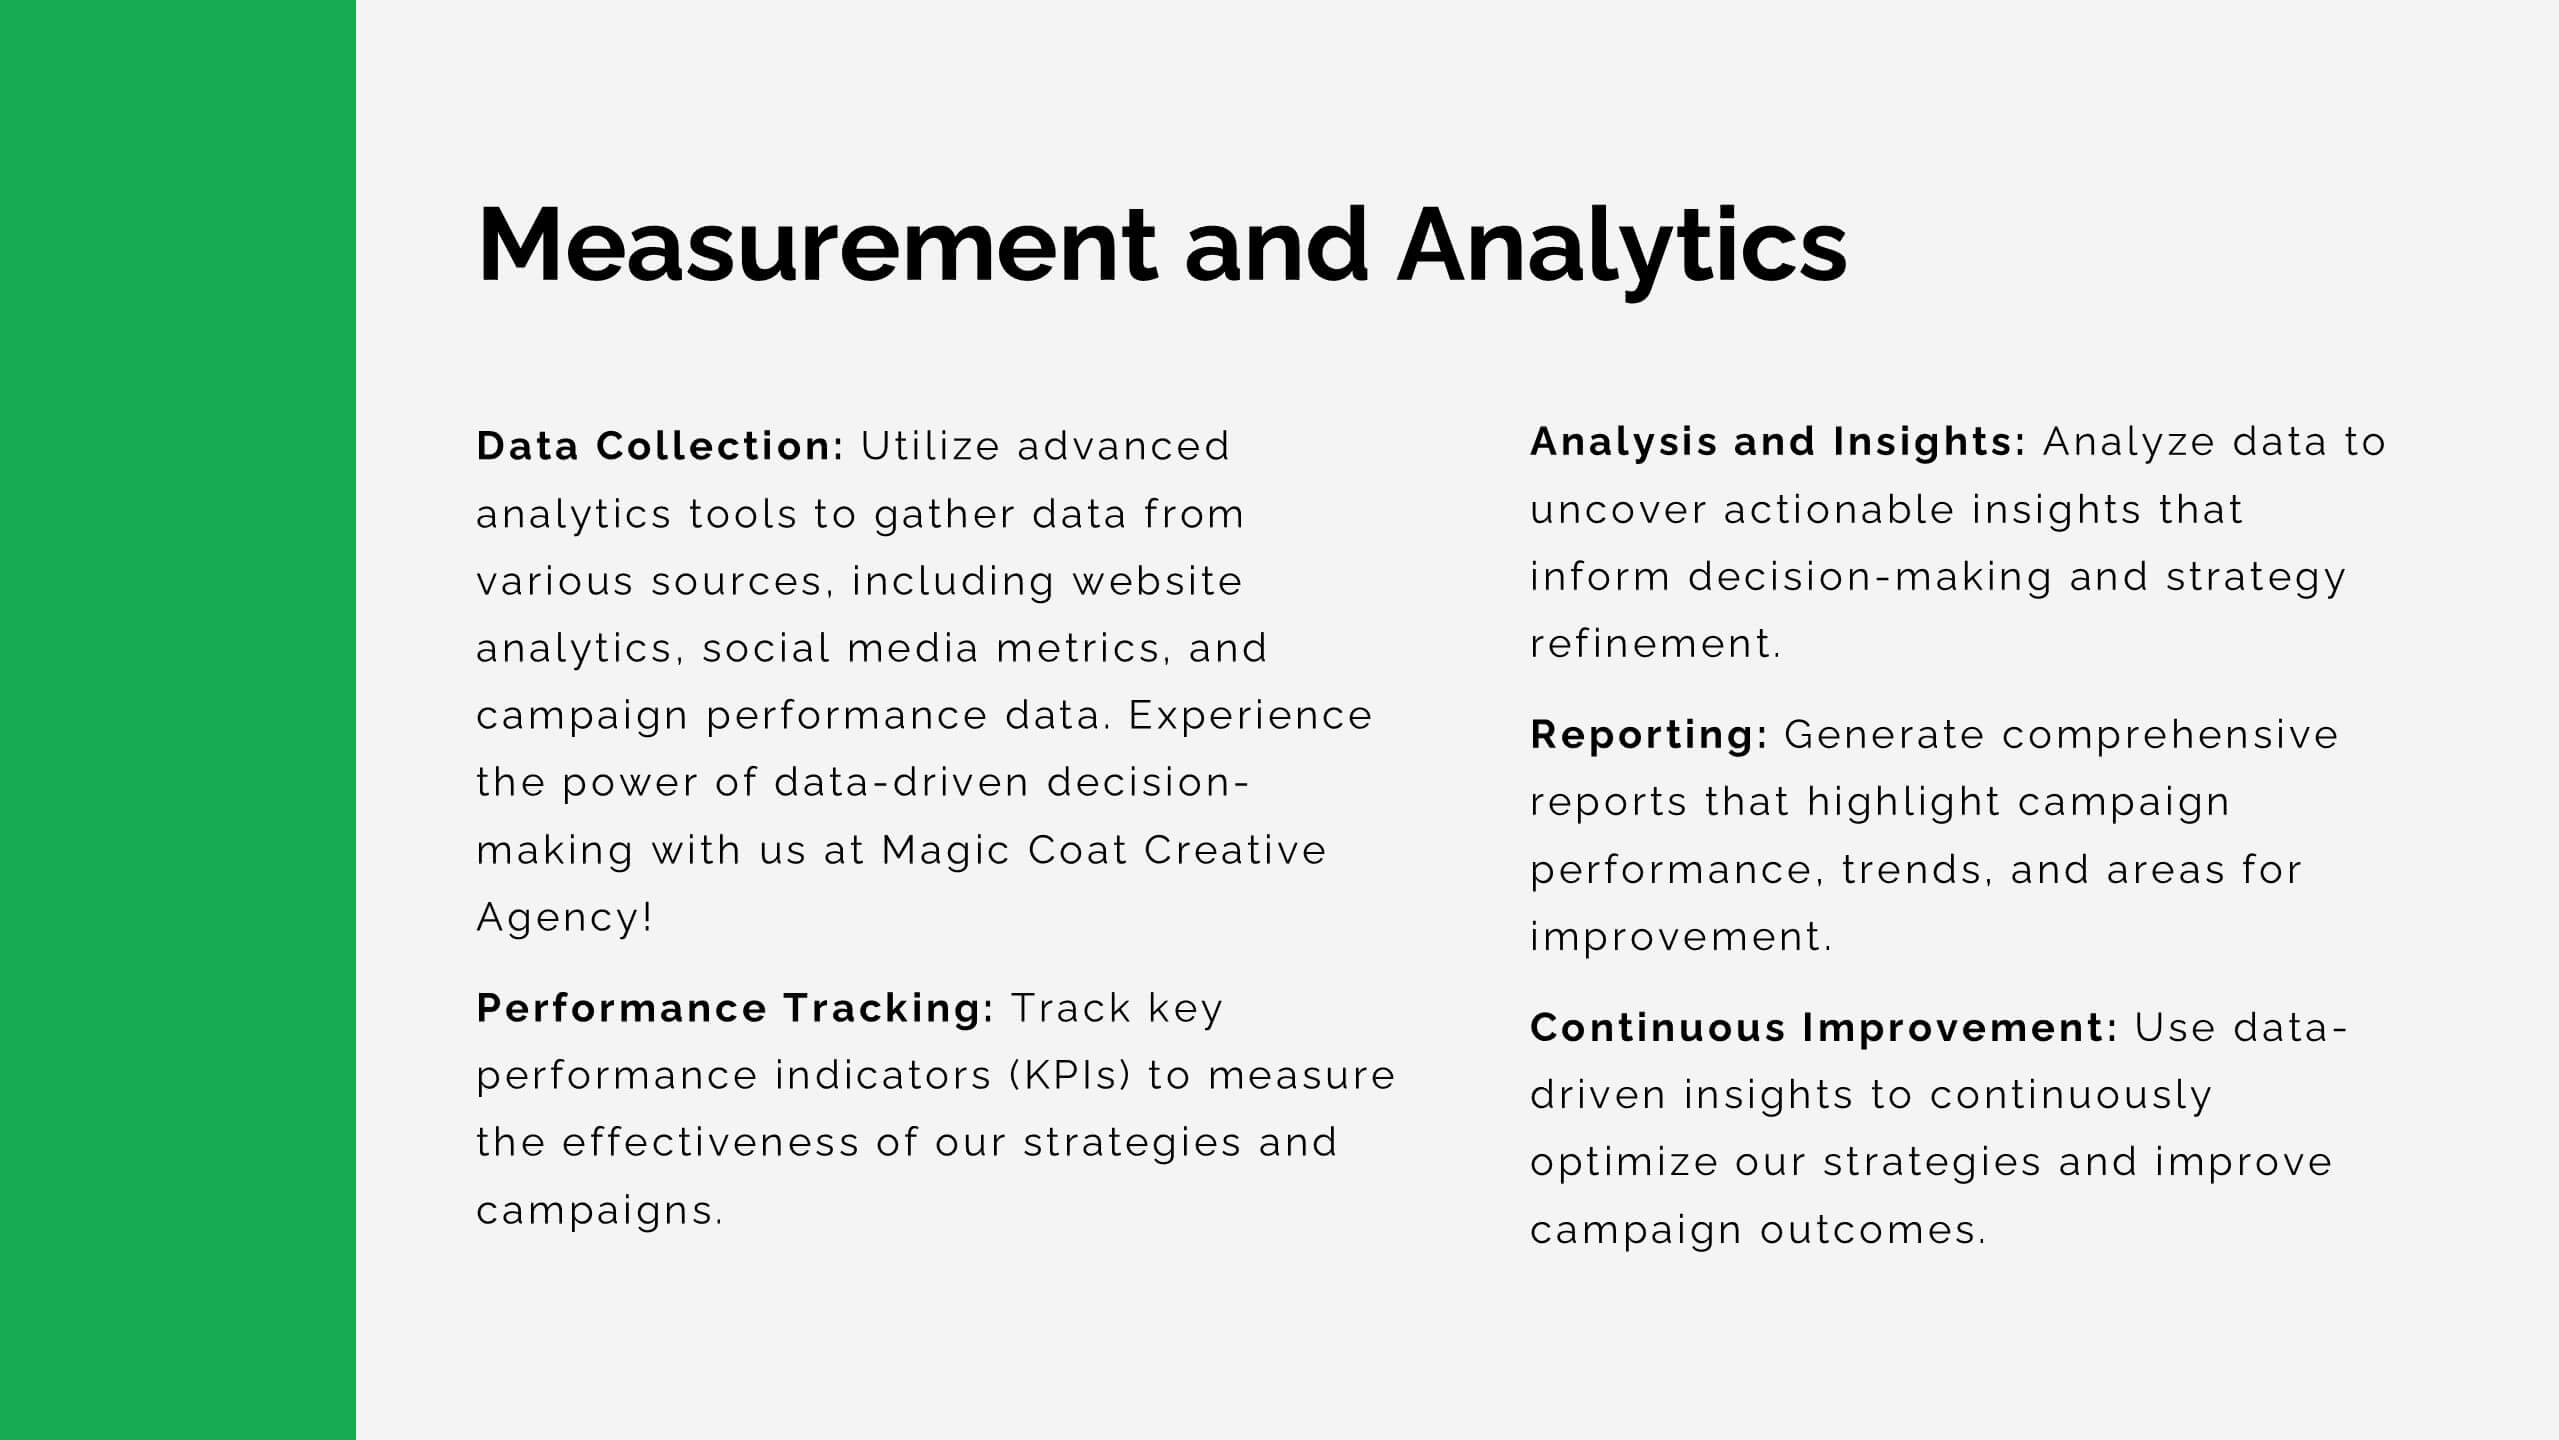
Lithium Advertising Agency Proposal Presentation
Elevate your advertising agency’s proposals with this sleek and modern template! It covers key areas like market analysis, case studies, client success stories, and campaign execution. Fully customizable, this template is perfect for presenting your agency’s services and strategies. Compatible with PowerPoint, Keynote, and Google Slides, it’s designed for impactful client presentations.


4 diapositivas
Product List Table for Quick Overview
Showcase product highlights at a glance with the Product List Table for Quick Overview Presentation. This sleek, column-based layout allows you to compare up to three product categories or service features side by side. Each section includes an icon, title, and space for three concise text rows—ideal for summarizing specifications, benefits, or pricing tiers. Fully editable in PowerPoint, Keynote, and Google Slides.


4 diapositivas
Green Initiatives & Climate Strategy Presentation
Highlight your sustainability roadmap with the Green Initiatives & Climate Strategy Presentation. Designed with a quadrant tree layout, this slide communicates four key environmental focus areas. Ideal for eco-friendly proposals, CSR updates, or climate reports. Fully customizable in PowerPoint, Keynote, and Google Slides—perfect for green strategies, goals, or impact summaries.


10 diapositivas
Organizational Hierarchy Infographic Presentation
Clearly define your Organizational Hierarchy with this structured infographic template. Designed for business presentations, HR teams, and corporate strategy, this visual layout simplifies reporting structures, leadership roles, and team organization. Fully customizable and easy to edit in PowerPoint, Keynote, and Google Slides, making it perfect for internal communications and management reports.


4 diapositivas
Athletic Event Planning and Scoring Presentation
Plan, organize, and present sports events with the Athletic Event Planning and Scoring template. Featuring a pyramid layout with sports icons, clear section labels, and bold color accents, it’s perfect for scheduling, rules, and scoring breakdowns. Fully editable in Canva, PowerPoint, and Google Slides to match your event’s theme and branding.


7 diapositivas
Business Law Infographic
Demystify the intricate world of business law with our Business Law Infographic. Set against a crisp white backdrop, accented with authoritative purple, trustworthy blue, and attention-grabbing yellow, our template encapsulates the gravity and nuance of legalities in the corporate sphere. Furnished with clear-cut infographics, symbolic icons, and pertinent image placeholders, it decodes legal jargon into an easily comprehensible visual format. Precisely crafted for Powerpoint, Keynote, or Google Slides. An indispensable guide for business owners, legal consultants, corporate trainers, or any entity navigating the maze of business legislation.


4 diapositivas
Healthcare Access and Preventive Care Presentation
Bring your health strategy to life with this engaging heart-themed infographic slide. Perfect for illustrating patient access points, wellness checkpoints, or preventive initiatives, each segment is cleanly organized with icons and text. Ideal for medical presentations, this template works seamlessly in PowerPoint, Keynote, and Google Slides for total flexibility.


5 diapositivas
Insurance Specialities Infographics
Insurance Specialties refer to specific areas of the insurance industry that require specialized knowledge, expertise, and training. These Infographic templates are visually appealing and informative presentation tools that can be used by insurance companies, brokers, or agents to showcase their unique services and specialties. This template includes a range of customizable graphics, charts, and icons that can be edited to match your brand. With this template, you can clearly and effectively communicate the various types of insurance you offer, such as life, health, property, or liability insurance.


7 diapositivas
Enterprise Security Infographic
In today's digital age, enterprise security has become the bedrock of business operations, ensuring data integrity and protection from threats. Our enterprise security infographic encapsulates key aspects of this vital domain, harmoniously blending white, blue, and hints of yellow. It's an essential visual tool for IT professionals, cybersecurity experts, and corporate strategists, illustrating the multifaceted nature of modern security protocols. Tailored to seamlessly integrate with PowerPoint, Keynote, and Google Slides, this infographic is your go-to resource for conveying complex security concepts in a digestible format.


6 diapositivas
Optimizing Business Through Value Chain Presentation
Improve operational efficiency and gain competitive advantage with the Optimizing Business Through Value Chain Presentation. This template breaks down each segment of your business activities—from inbound logistics to service delivery—using a modern chain-style visual layout. Perfect for strategy meetings, operational planning, or business model analysis. Fully editable in PowerPoint, Keynote, Canva, and Google Slides.


5 diapositivas
Social Media Strategies Presentation
Bring your online vision to life with a clean, modern layout that makes planning campaigns feel effortless. This presentation helps you map out goals, content pillars, audience insights, and platform tactics with clarity and impact. Fully editable and compatible with PowerPoint, Keynote, and Google Slides.


20 diapositivas
Pegasus Sales Forecast Presentation
This bold sales forecast template combines powerful visuals with a sleek design to highlight key performance metrics, competitive analysis, and pricing strategy. With sections for service overview, testimonials, promotions, and next steps, it’s ideal for impactful presentations. Compatible with PowerPoint, Keynote, and Google Slides, delivering your message has never been easier.


10 diapositivas
Quality Control with Six Sigma Framework Presentation
Enhance quality management with this Six Sigma Framework template. Highlight each phase—Define, Measure, Analyze, Improve, Control—in a clean, modern layout for effective presentations. Ideal for quality assurance teams, process analysts, and Six Sigma professionals. Fully editable in PowerPoint, Keynote, and Google Slides to match your brand and insights.


5 diapositivas
Behavioral Psychology Insights Presentation
Dive deep into the human mind with our 'Behavioral Psychology Insights' presentation template. Perfect for educators and professionals, this template offers a structured way to present complex psychological concepts visually. Ideal for delivering engaging presentations on human behavior, it is compatible with PowerPoint, Keynote, and Google Slides.


4 diapositivas
Infrastructure and Construction Industry Presentation
Showcase key developments in the Infrastructure and Construction Industry with this visually structured template. Ideal for project managers, urban planners, and engineers, it highlights construction phases, investment data, and industry insights. Fully customizable and compatible with PowerPoint, Keynote, and Google Slides for seamless integration into your professional presentations.