


Características


¿Tienes alguna pregunta?
Recomendar


5 diapositivas
Building Timeline Presentation
Bring structure and progress to your ideas with this visually engaging presentation design. Ideal for showcasing project milestones, construction phases, or business growth timelines, it helps you communicate progress clearly and professionally. Fully customizable and compatible with PowerPoint, Keynote, and Google Slides for seamless presentation editing and delivery.


21 diapositivas
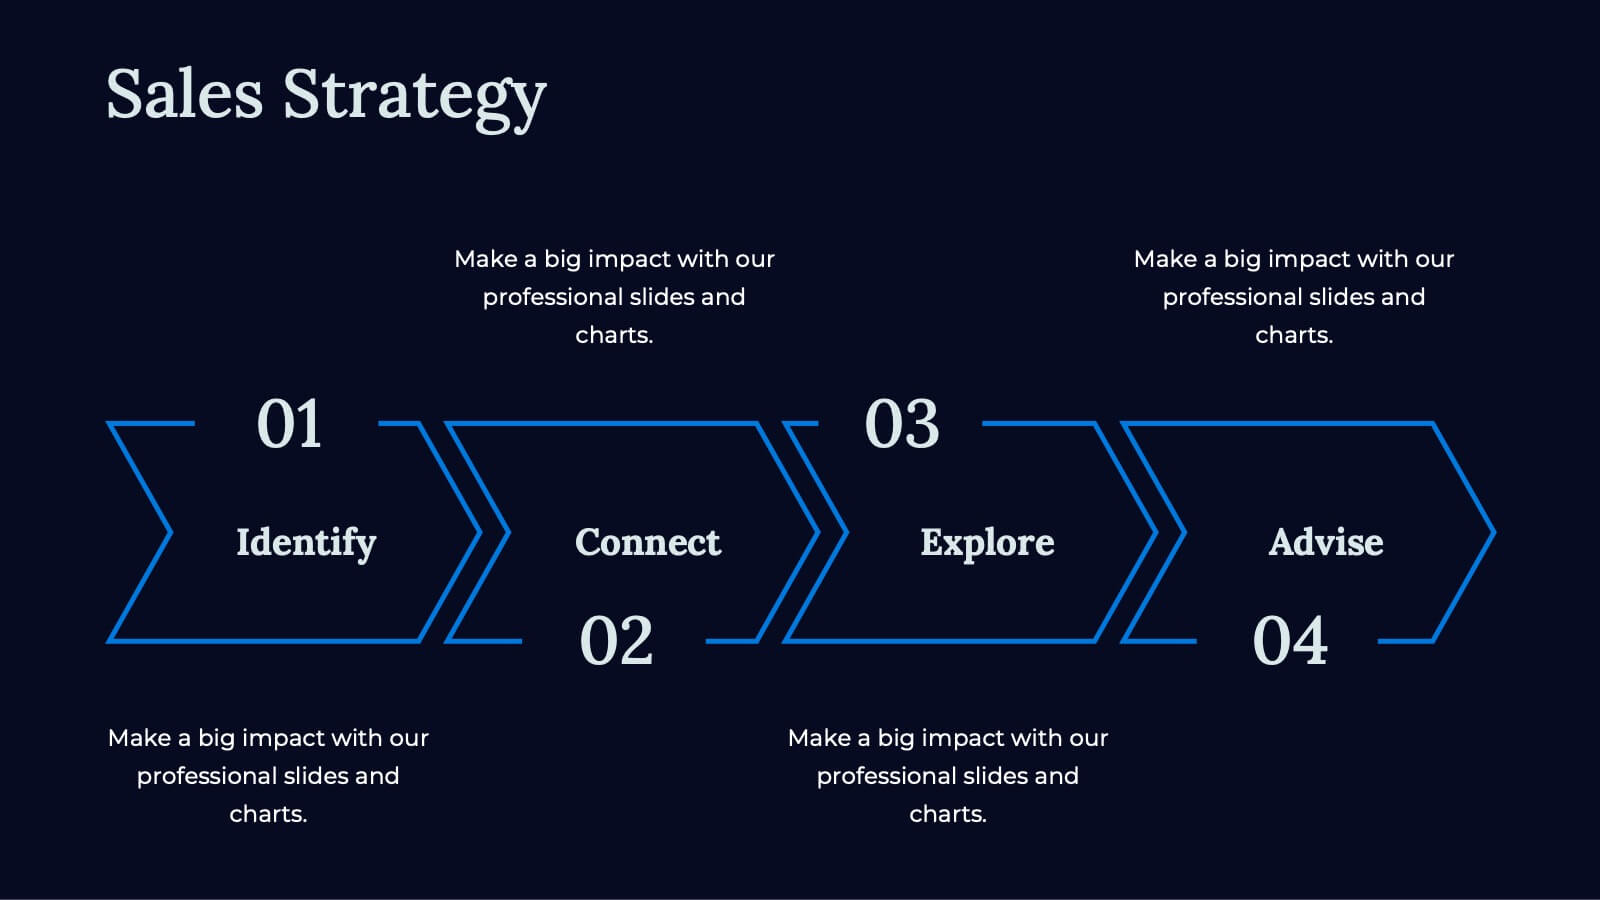
Cupid Sales Proposal Presentation
Elevate your next proposal with this sleek and professional presentation template! Ideal for outlining project goals, scope of work, and timelines, this template ensures that every detail is presented with clarity and impact. It includes sections for budget breakdowns, team expertise, and risk management strategies. Compatible with PowerPoint, Keynote, and Google Slides, it’s designed for flexibility and success.


6 diapositivas
Legal Policy Overview Presentation
Make your legal and compliance reports look polished and professional with this clean, organized layout. Designed to simplify complex information, it’s ideal for presenting policies, frameworks, and regulations with clarity. Easily customize the content and visuals—fully compatible with PowerPoint, Keynote, and Google Slides for effortless editing and use.


26 diapositivas
Crypto Currency Dark Presentation
Navigate the dynamic world of digital finance with our Crypto Currency presentation template, compatible with PowerPoint, Keynote, and Google Slides. This template is an invaluable tool for financial analysts, crypto enthusiasts, and educators in the realm of digital currencies. The design boasts a bold and modern aesthetic, with cryptocurrency motifs that capture the essence of this revolutionary market. With this template, you can present complex financial data and crypto concepts with clarity. Its range of slides includes comparative analyses, timeline infographics, and process diagrams, enabling a thorough exploration of the cryptocurrency landscape. The vibrant colors and creative graphics make it easy to highlight market trends, investment opportunities, and the technology behind cryptocurrencies. By using our Crypto Currency template, you'll engage and educate your audience on the nuances of blockchain and digital assets. Download it today to deliver a presentation that's as innovative and forward-thinking as the topic itself.


10 diapositivas
Step-by-Step Customer Lifecycle
Clearly outline each phase of your customer journey with the Step-by-Step Customer Lifecycle Presentation. This slide template features a circular flow layout with five distinct stages, making it ideal for showcasing onboarding, engagement, retention, and loyalty strategies. Customize the icons, titles, and descriptions to match your brand message. Fully editable in PowerPoint, Keynote, and Google Slides.


26 diapositivas
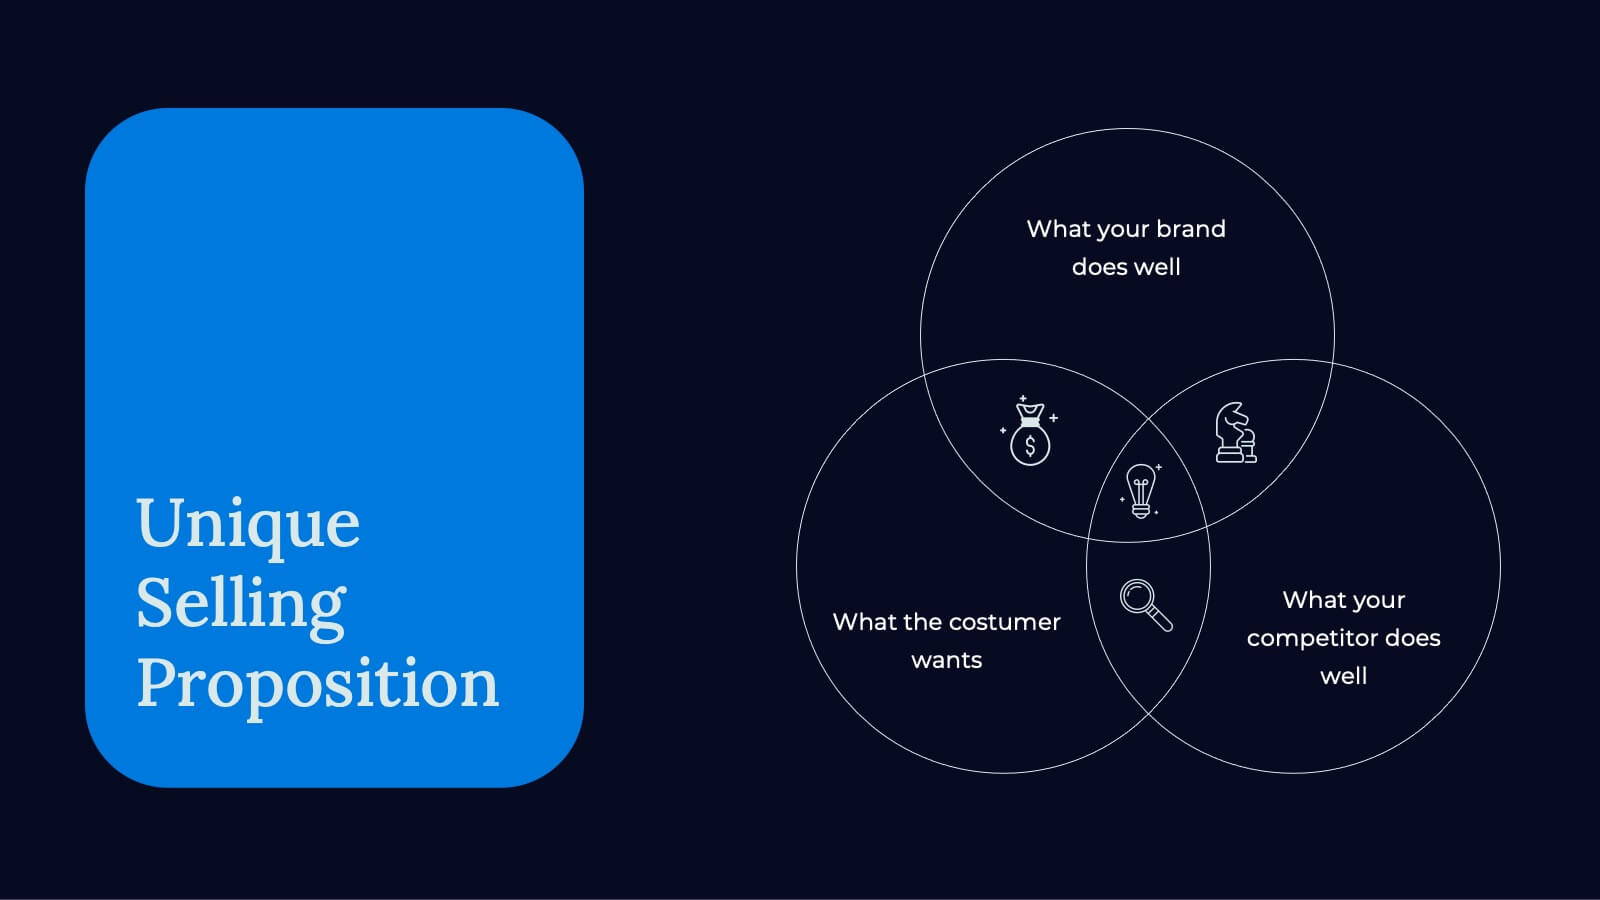
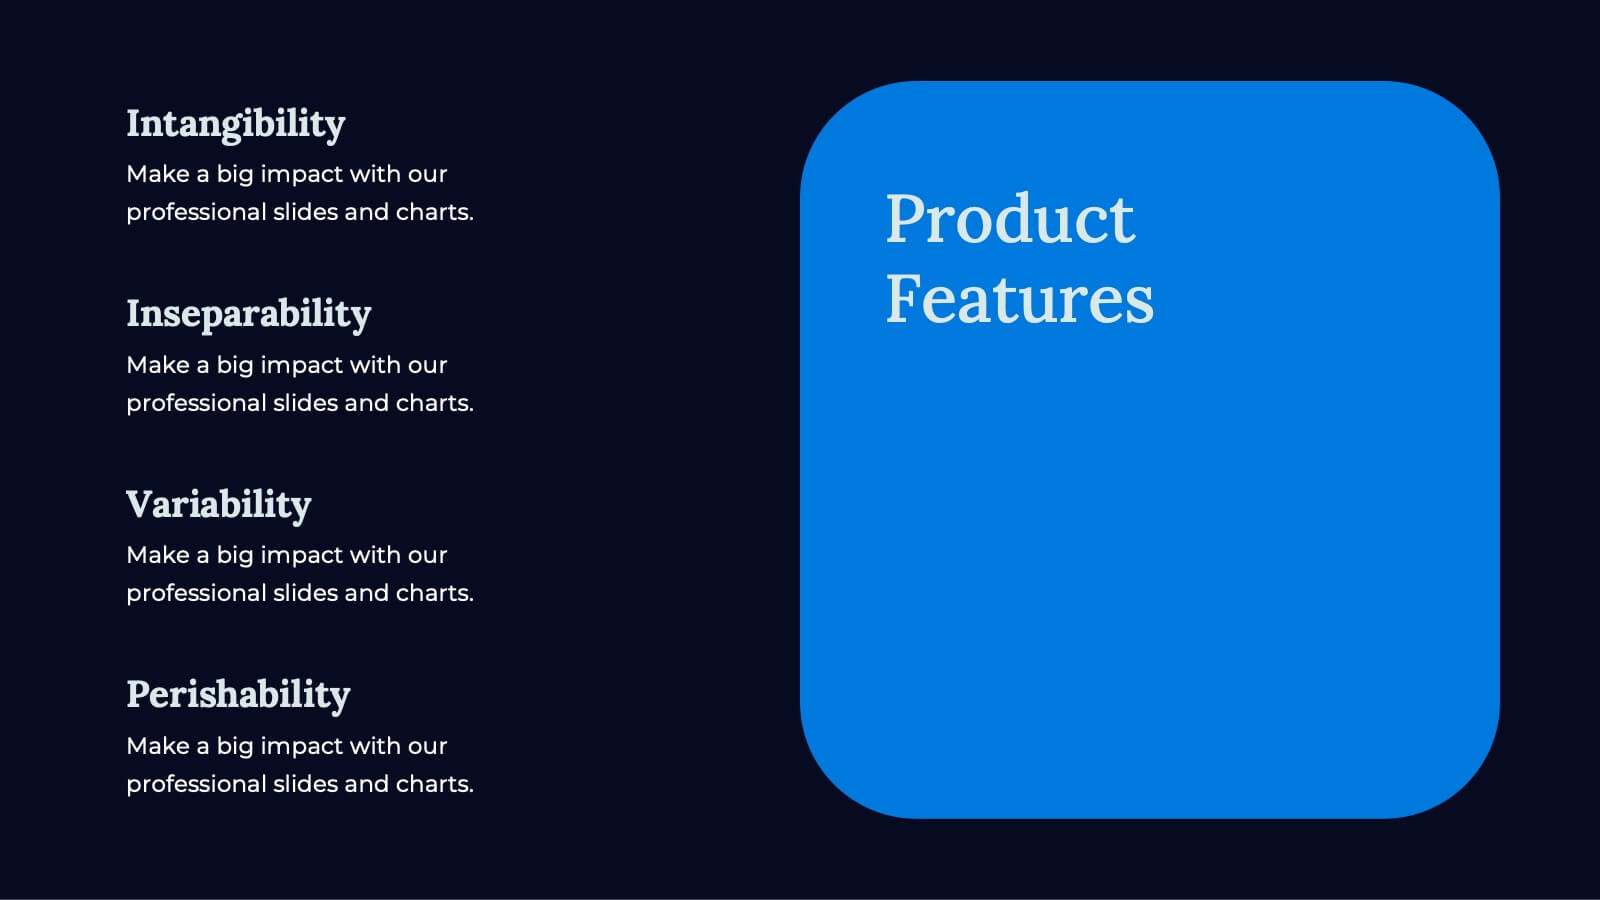
Olympus Brand Guidelines Proposal Presentation
The Olympus Brand Identity Presentation is a sleek and modern template designed to help you showcase your brand's unique identity and strategy. This template kicks off with a clean and engaging slide that sets the stage for the entire presentation. It guides you through various aspects of brand identity, including brand components, target audience, and unique selling proposition (USP). The template also dives into brand positioning, strategy, and guidelines, ensuring that your brand's message is consistent and compelling. Additionally, it covers brand experience, recognition, and recall, offering a comprehensive view of your brand's impact. With dedicated sections for performance metrics, brand success stories, and future development, this template provides a complete toolkit for effectively communicating your brand's strengths and vision. Fully compatible with PowerPoint, Keynote, and Google Slides, the Olympus template is perfect for any brand-focused presentation.


4 diapositivas
Climate Change Impact Stages Presentation
The "Climate Change Impact Stages" presentation template is designed to effectively communicate the various aspects of climate change impacts on an organizational or global scale. It utilizes a straightforward tag design with letters A through D, where each tag can detail a specific area of impact or response strategy related to climate change. This visually appealing layout helps categorize information neatly, making it easier for the audience to follow along and understand the segmented data or proposals. Ideal for environmental seminars, corporate sustainability reports, or educational purposes, this template serves as a functional tool to highlight crucial information regarding climate change challenges and solutions.


20 diapositivas
Kirin Artist Portfolio Template Presentation
Showcase your creative work with style and flair using this sleek portfolio presentation! It covers key sections like featured projects, creative process, collaborations, and client testimonials, ensuring your expertise is communicated effectively. Ideal for freelancers, designers, or agencies, this template is fully compatible with PowerPoint, Keynote, and Google Slides.


5 diapositivas
Iceberg Model Infographics
Introducing our Iceberg Model Infographic, this is a visual representation of the Iceberg Model which is a metaphor for understanding a problem or issue. It is based on the idea that just like an iceberg, only a small portion of the problem or issue is visible on the surface, while the majority of it lies beneath. In this vertical infographic use the top visible part of the iceberg to represent the things that are easily observed, and the larger hidden part of the iceberg can be the underlying causes or factors that are not easily visible. This is designed to help people understand the complexity of a problem and encourage them to look beyond the surface level.


8 diapositivas
Cognitive Psychology and Decision Making
Unlock the logic behind human choices with this eye-catching presentation template that puts cognitive puzzles into perspective—literally. Dive into how thought patterns, mental shortcuts, and biases influence decision making, all illustrated through clean visuals and digestible layouts. Easily customizable for PowerPoint, Keynote, and Google Slides.


21 diapositivas
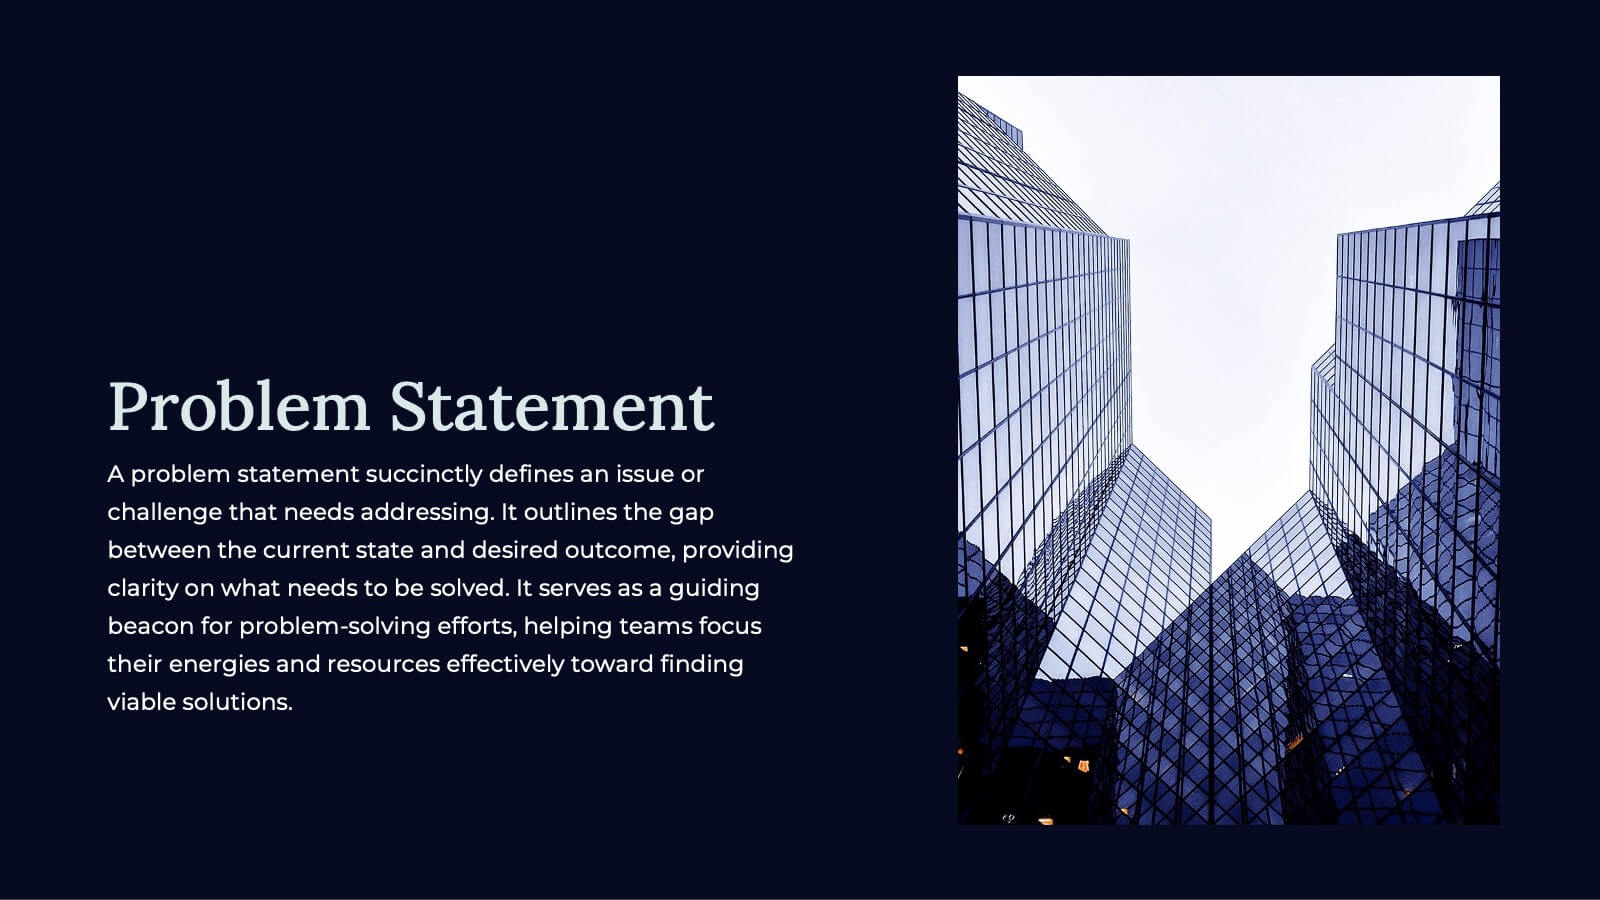
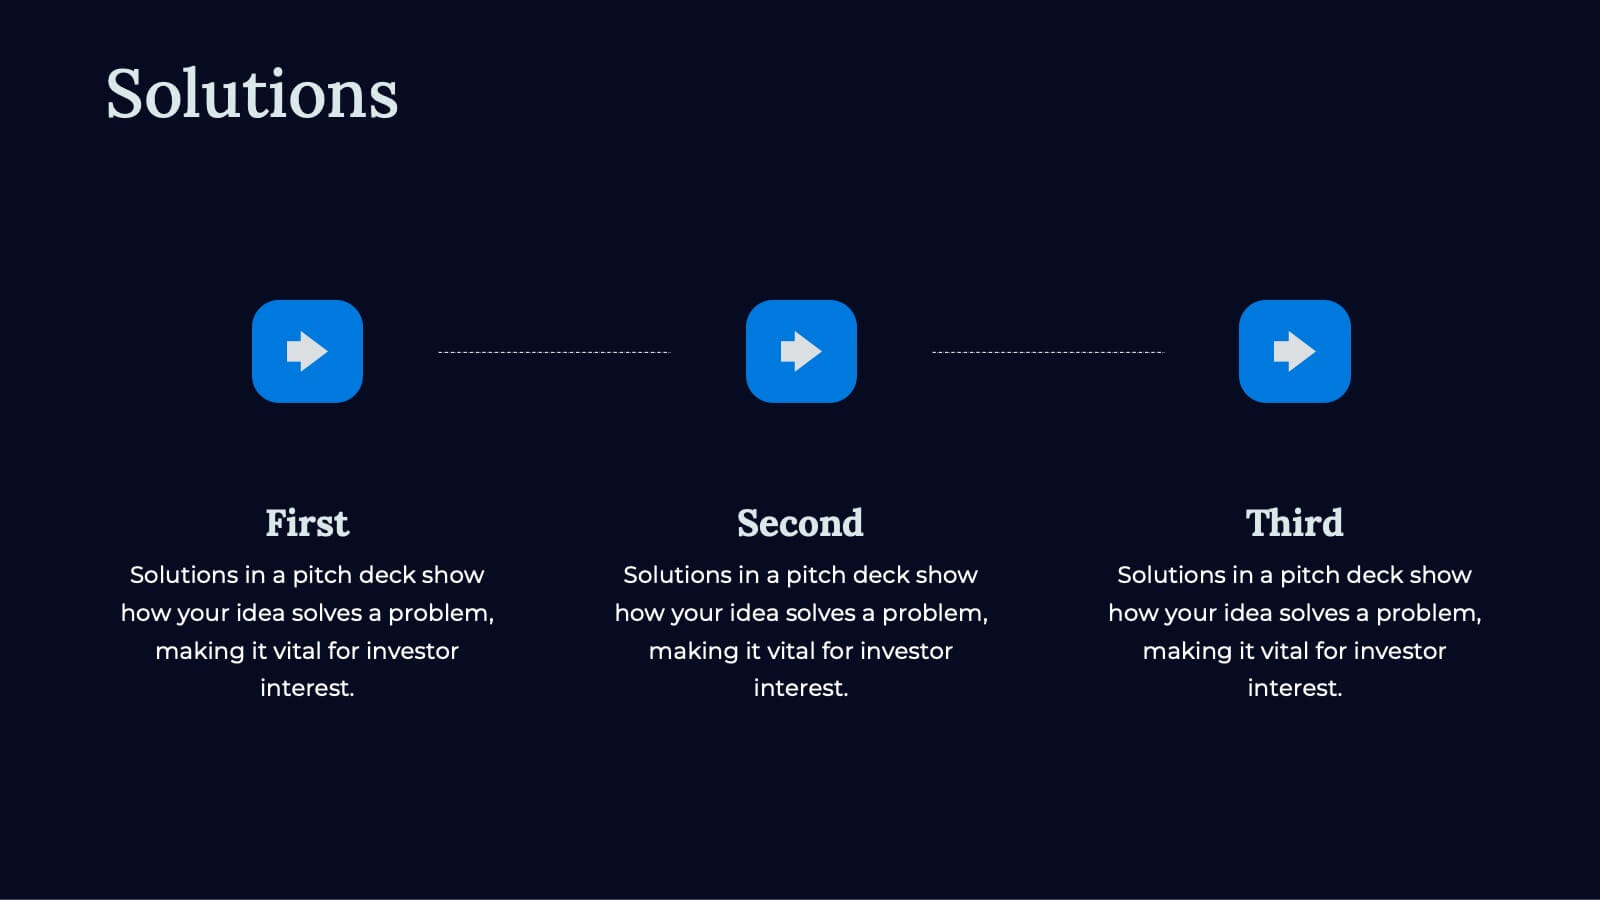
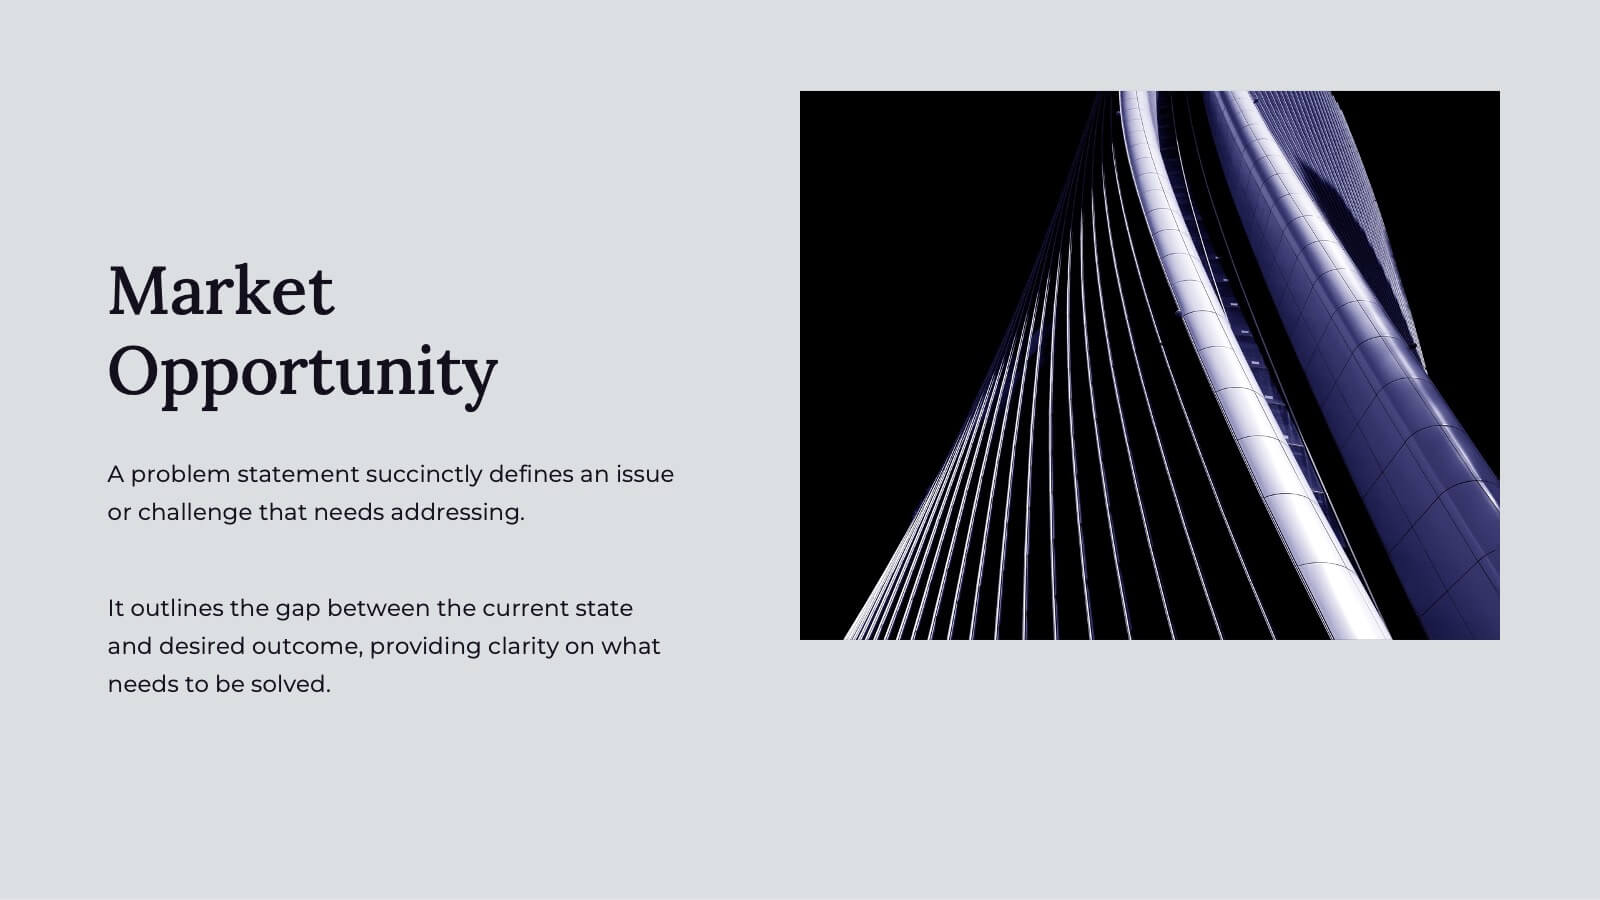
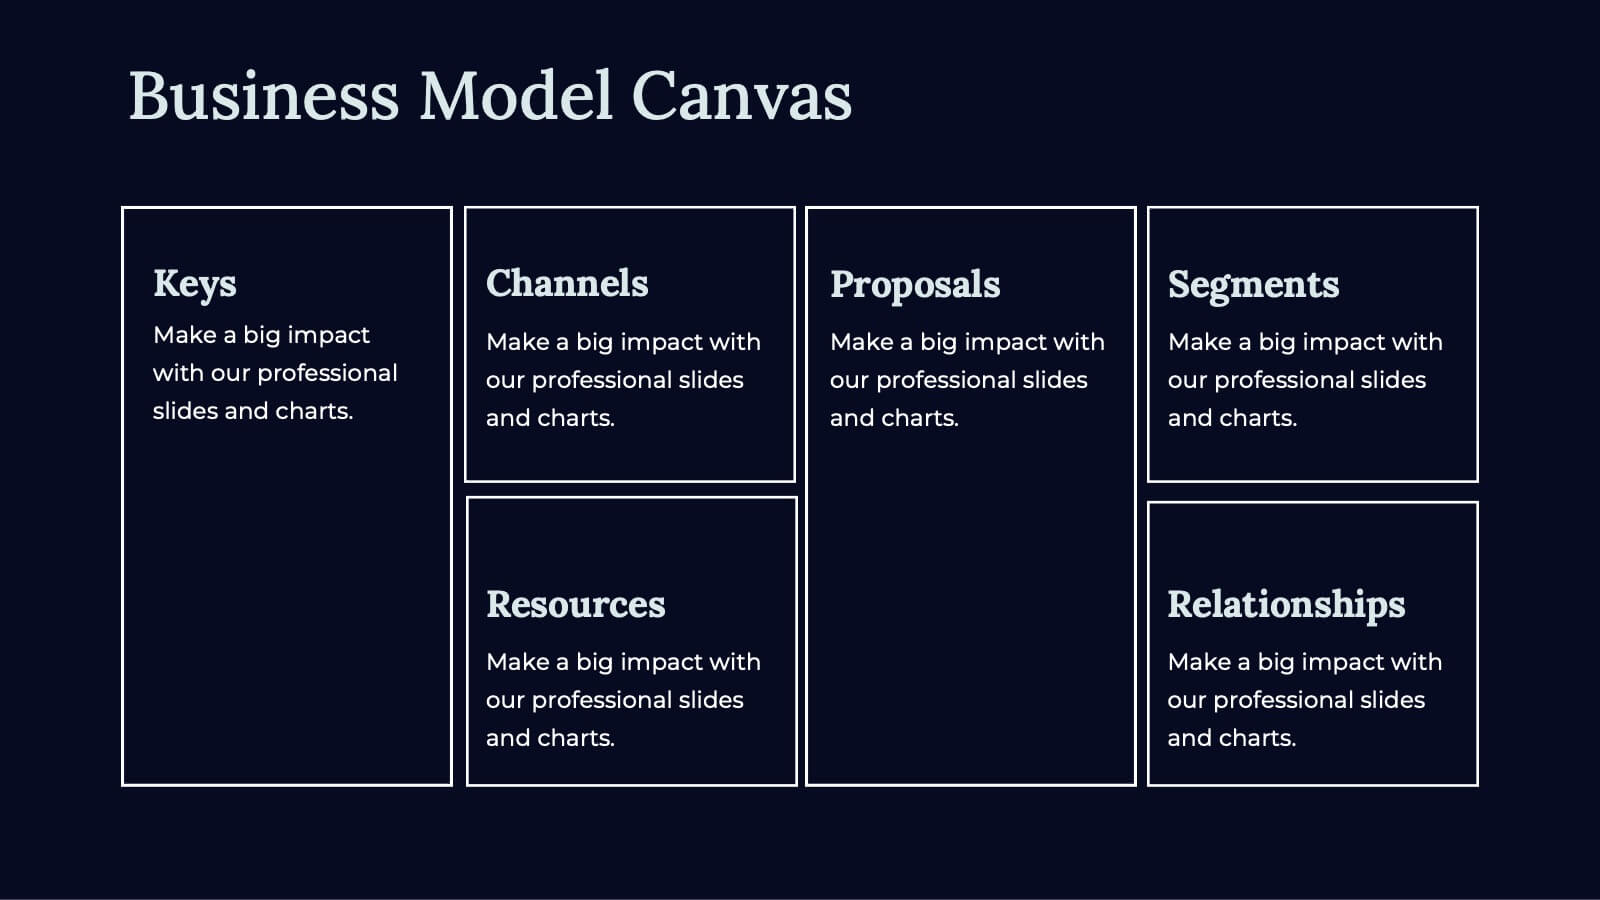
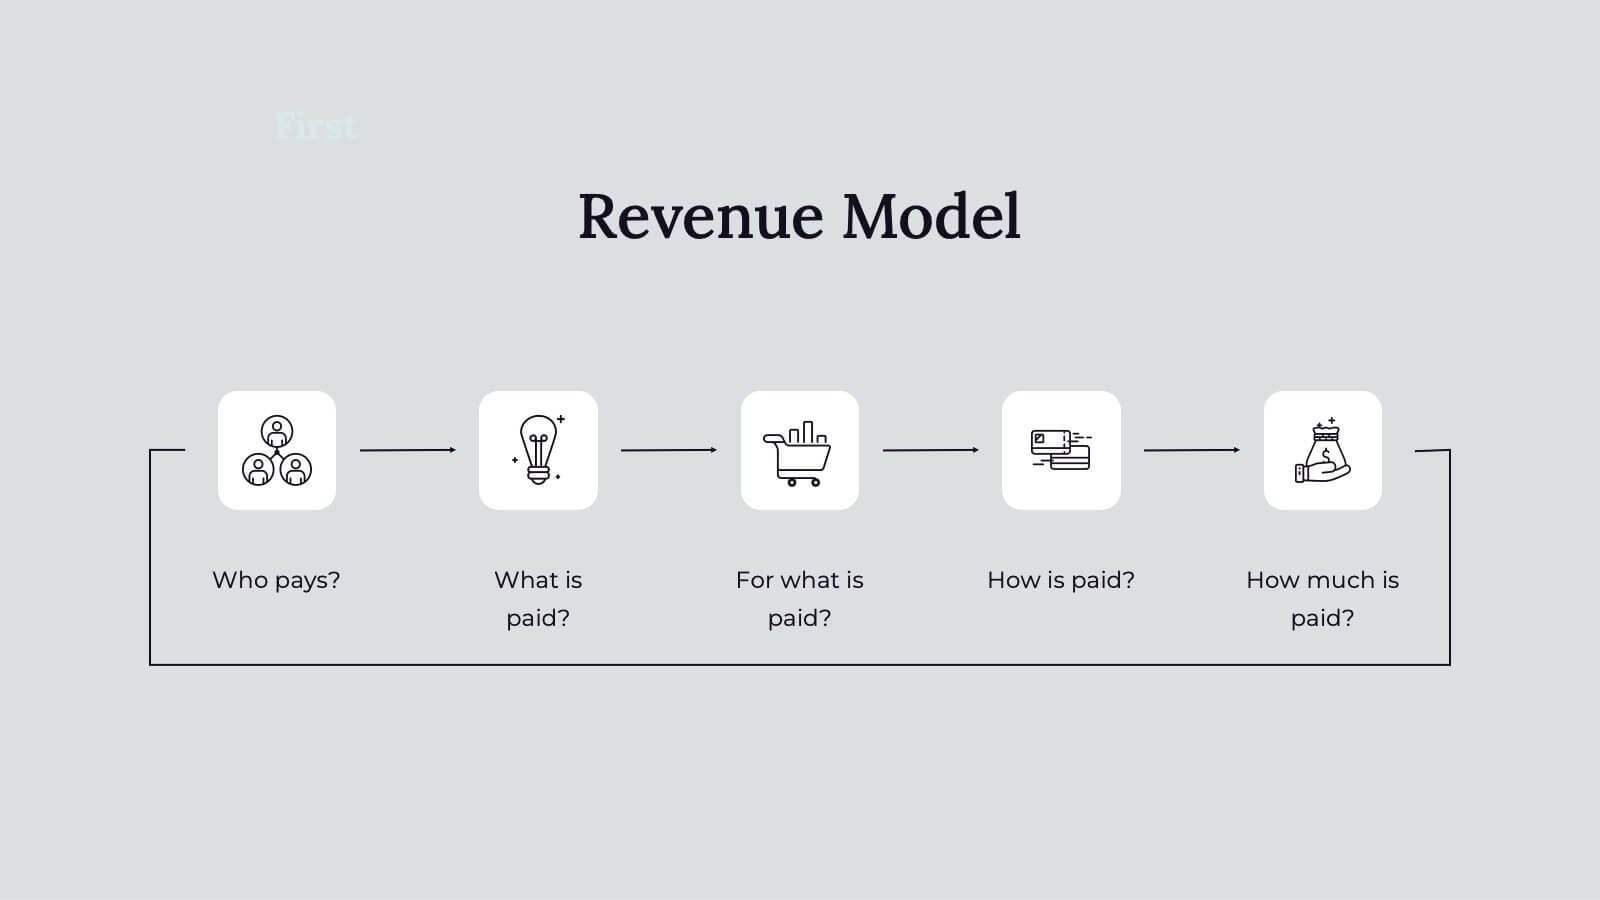
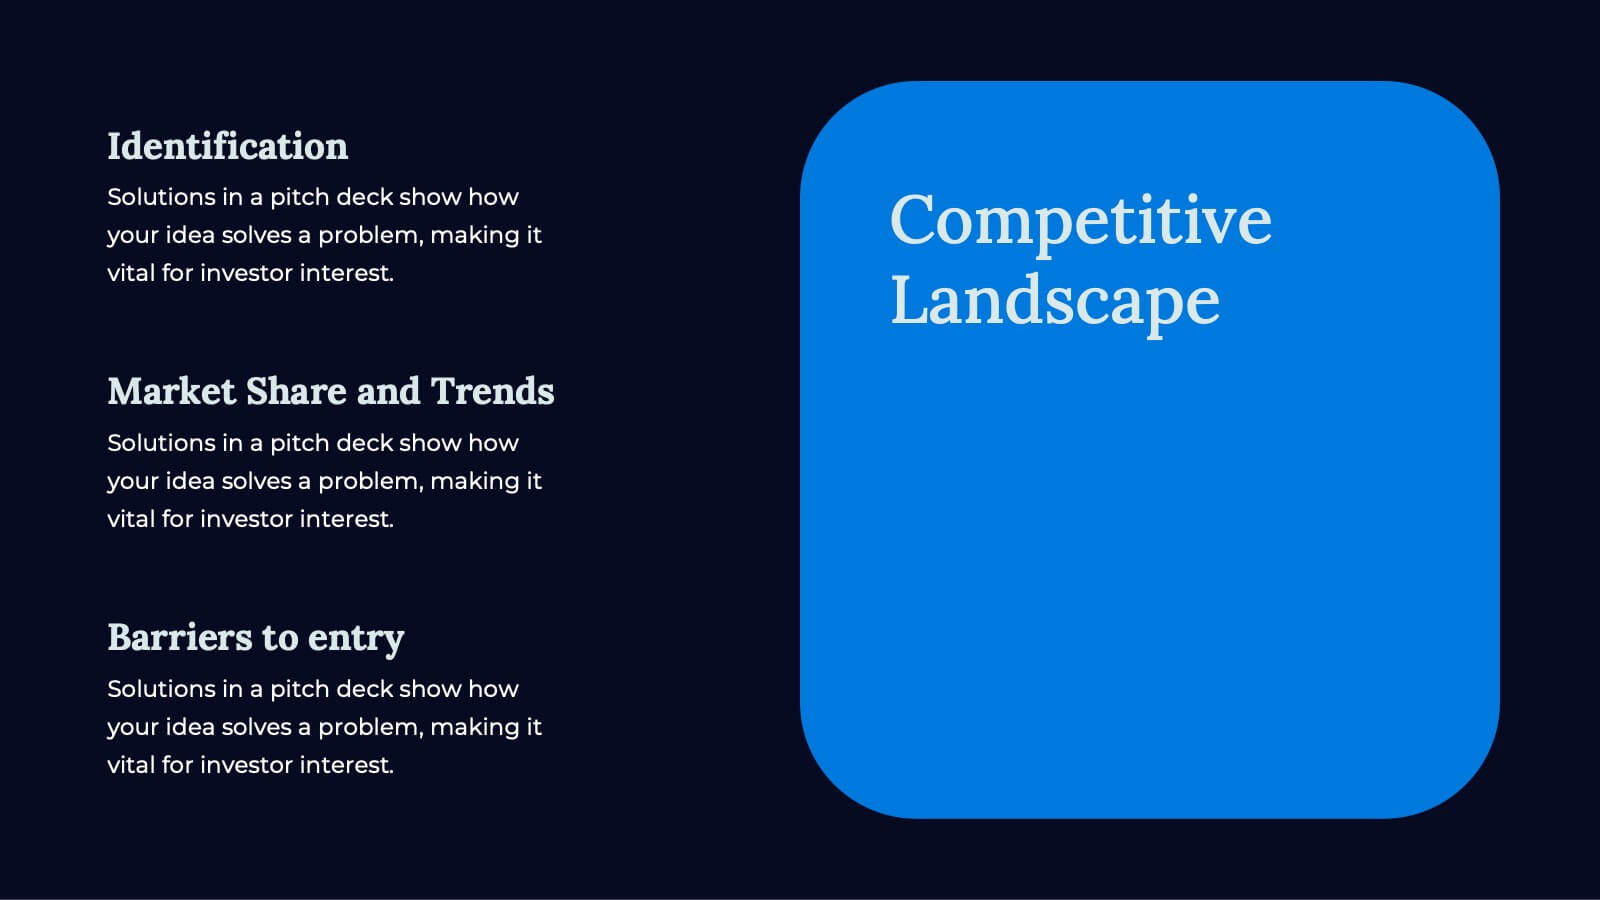
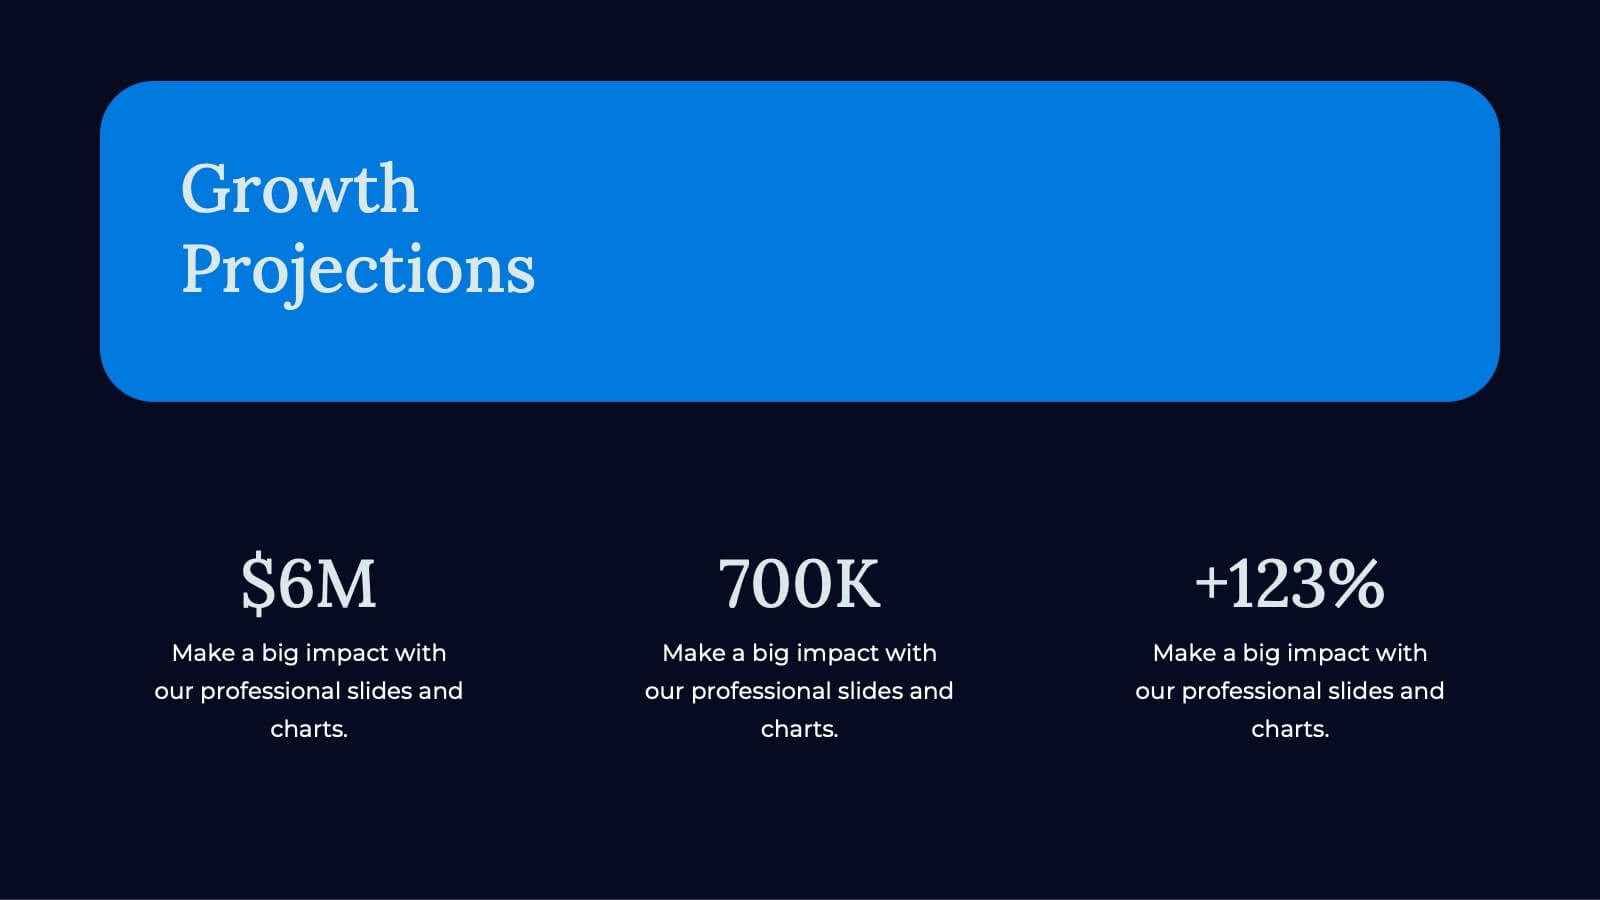
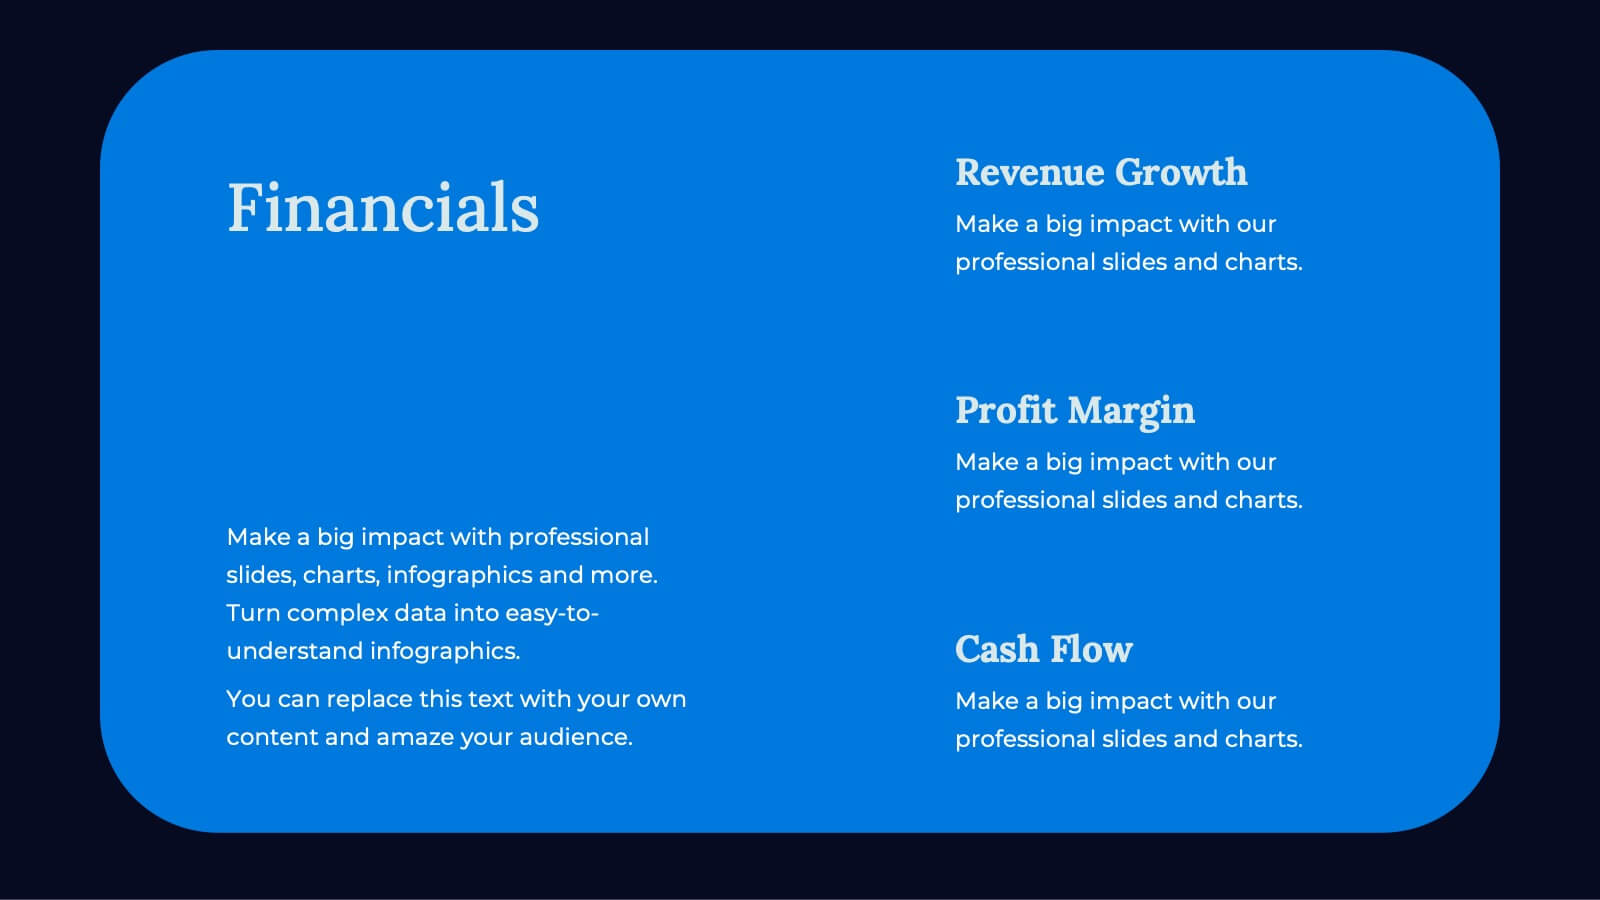
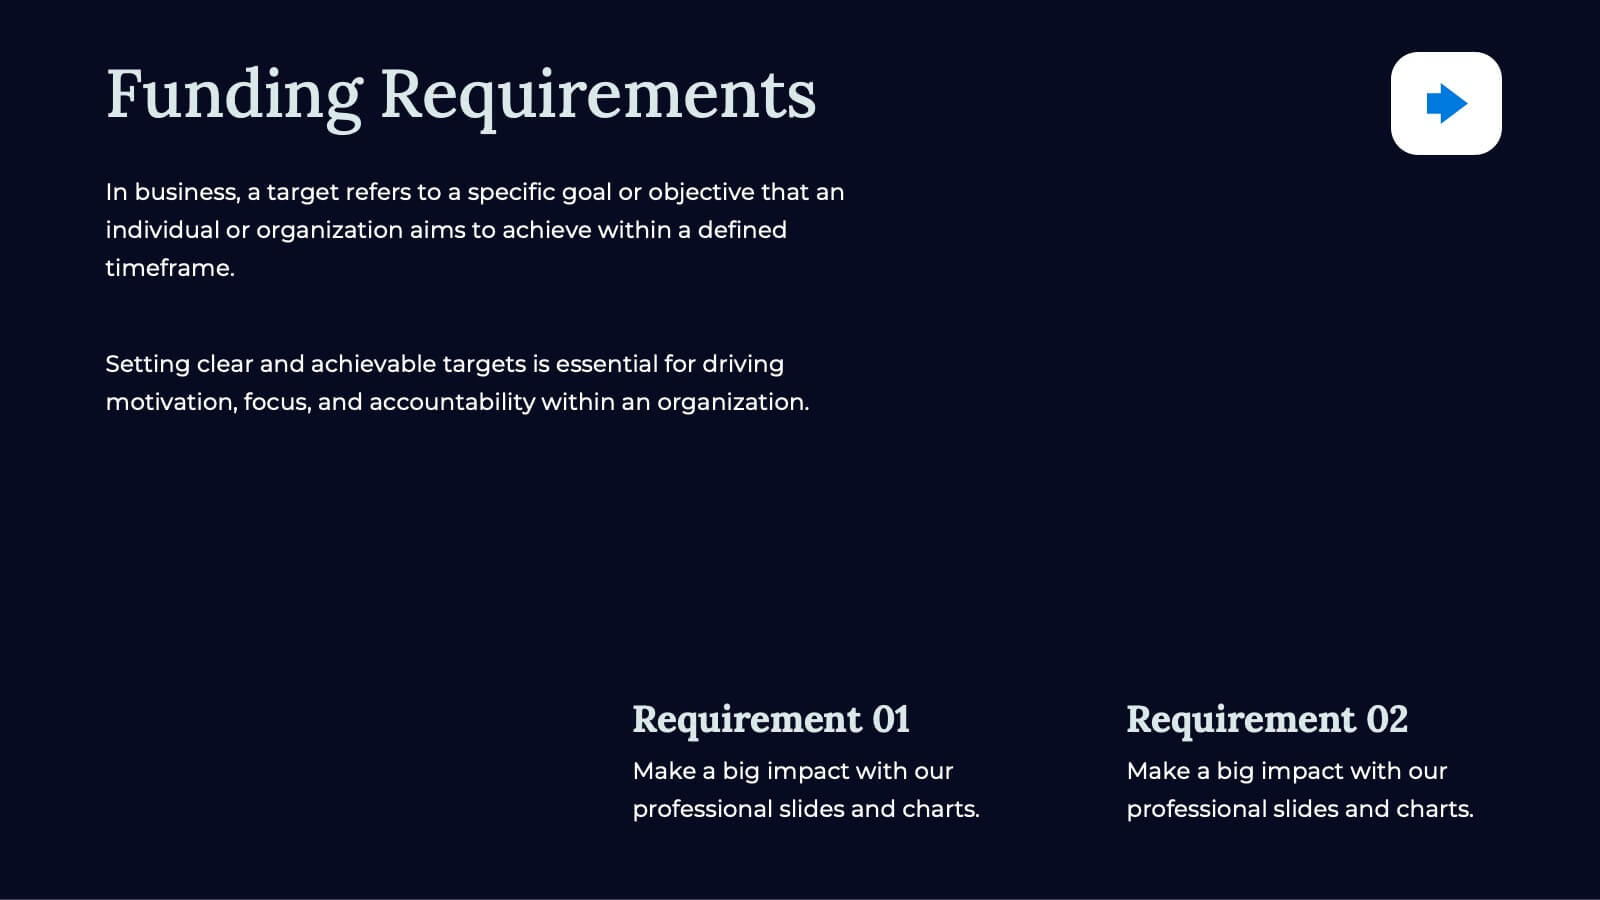
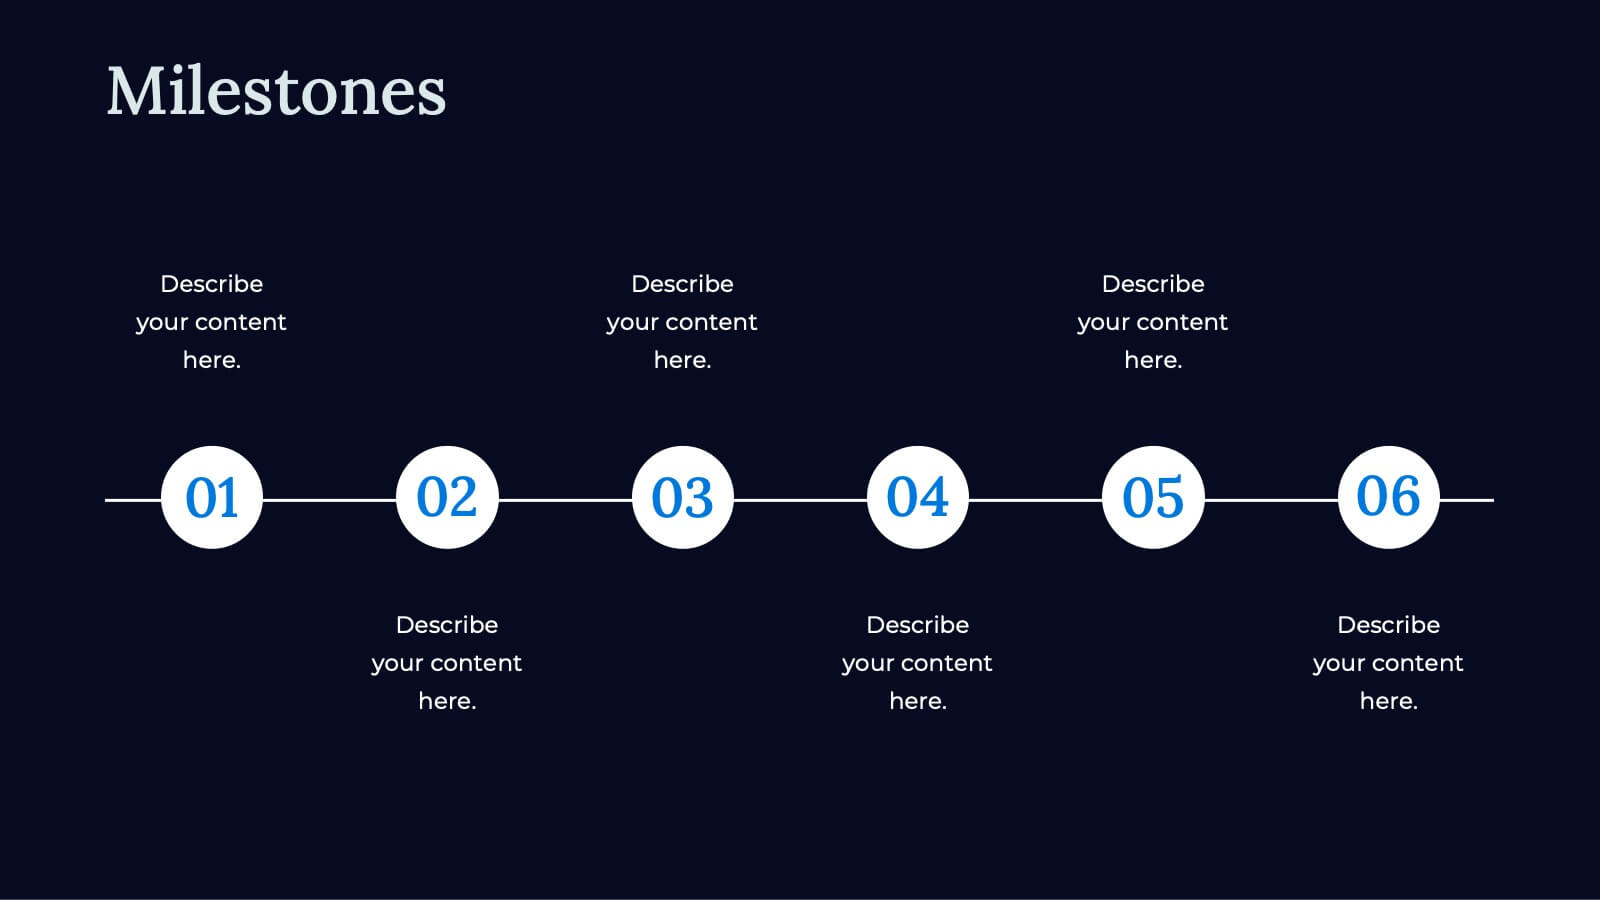
Apex Business Idea Pitch Deck Presentation
Craft powerful business pitch decks with this sleek template. Present your company overview, problem statement, solutions, and market opportunity. Showcase your business model, revenue model, competitive landscape, and unique selling proposition. Perfect for highlighting financials, growth projections, and funding requirements. Compatible with PowerPoint, Keynote, and Google Slides. Impress investors and stakeholders with clear, concise, and visually appealing presentations.


7 diapositivas
Job Objective Infographic Presentation
A Job Objective is an introduction that summarizes an individual's career goals and objectives. This Template is designed to create a visual experience with a focus of solving your objectives, showcasing your expertise and individuality. Use this infographic to help you visually communicate your knowledge and skills with a powerful presentation. Highlight your experience, skills and key achievements. You can edit the graphics, photos, data and text in this template so that it fits your needs perfectly. All you have to do is just download this template in PowerPoint, Keynote, or Google Slides.


7 diapositivas
Introduction Infographic
Kick off your presentations with flair using our versatile introduction slide templates. Designed to create a strong first impression, these templates cater to a variety of introduction needs, from company and project overviews to product launches and personal introductions. Each template in this collection features a unique design, tailored to set the right tone for your presentation. Whether it’s the sleek, professional look for corporate introductions or vibrant, engaging designs for creative projects, these slides ensure your presentation starts on a high note. Elements like bold text placements, dynamic imagery, and clear, impactful graphics help to immediately capture and retain the audience's attention. Fully customizable to align with your branding or personal style, these templates allow you to modify colors, fonts, and layout to fit your specific content needs. They are an excellent choice for anyone looking to introduce themselves, their team, or their business in a concise and memorable way.


7 diapositivas
Veterinary Clinic Infographic Presentation
Veterinarians play a vital role in the health and wellbeing of animals, serving as their trusted doctors. Our comprehensive veterinary clinic infographic template features a diverse array of appealing illustrations that are completely customizable to meet your specific needs. Whether you are a student or a seasoned vet, we've got the perfect infographics for you to showcase all your crucial details in style! Our amazing template is the ultimate solution to help you present your services with crystal-clear clarity. You can create a visually appealing representation of all the awesome offerings at your clinic, including virtual appointments for your furry pals. So, what are you waiting for? Let's make your information shine like never before!


7 diapositivas
Human Resources Process Infographic
Dive deep into the intricate world of HR with our human resources process infographic. Designed for clarity and ease of understanding, this infographic provides a streamlined look into the diverse steps and stages involved in efficient management. With a clean white canvas complemented by various shades of blue and a spectrum of colors for differentiation, this infographic promises an insightful journey. This is a tool for professionals aiming to present complex processes in a digestible format. Given its universal design, it's perfect for integration into PowerPoint, Keynote, or Google Slides presentations, ensuring that your content not only educates but also engages.


7 diapositivas
Fishbone Stitch Infographic
Thread together insights with our fishbone stitch infographic. Set on a crisp white canvas, accented with the depth of purple, the intensity of red, and the freshness of green, this template elegantly showcases the intricate details of the fishbone stitch technique. Accentuated with intuitive infographics, emblematic icons, and specific image placeholders, it provides a detailed walk-through of this unique stitching method. Perfectly tailored for Powerpoint, Keynote, or Google Slides. A must-have for fashion designers, textile students, craft enthusiasts, or anyone with a passion for intricate stitchwork.


2 diapositivas
App Interface Device Preview Presentation
Display your mobile app design with this sleek interface preview layout. Centered around a realistic smartphone mockup, this template includes four surrounding sections for text or key features. Ideal for pitch decks or product demos, it's fully editable in PowerPoint, Keynote, or Google Slides to match your brand.