


Características


¿Tienes alguna pregunta?
Recomendar


8 diapositivas
Geographic Data for Europe Slide Presentation
Visualize key regional data clearly with the Geographic Data for Europe Slide Presentation. This editable map layout highlights specific European countries alongside icon-based text boxes, perfect for presenting statistics, demographics, or business metrics. Use color-coded markers to tell a geographic story with visual clarity. Compatible with PowerPoint, Keynote, Google Slides, and Canva.


7 diapositivas
Progress Energy Infographic
Progress generally refers to forward movement or advancement towards a goal, or improvement. This is a dynamic infographic designed to visually represent your journey towards success and growth. This template serves as a visual roadmap, allowing you to showcase milestones, achievements, and key steps toward your objectives in a clear and captivating manner. Compatible with Powerpoint, Keynote, and Google Slides. This easily illustrates the impact of your progress. This infographic is designed to showcase your achievements, marking key milestones that demonstrate your progress and the impact they've had on your journey.


6 diapositivas
Employee Change Management Strategy Presentation
Communicate change with clarity using this structured, gear-themed presentation slide. Designed to visualize six strategic stages of employee transition, it's ideal for HR professionals, team leaders, and consultants managing organizational change. Each step is represented with a numbered circle and aligned text for easy guidance. Fully customizable in PowerPoint, Keynote, and Google Slides.


10 diapositivas
Medical Anatomy Overview Presentation
Bring your audience into the world of medical insight with a slide that makes anatomy feel clear, modern, and easy to follow. This presentation highlights key organs and body systems in a clean visual layout, helping you explain health data with confidence. Fully compatible with PowerPoint, Keynote, and Google Slides.
8 diapositivas
Performance Tracking Using OKRs Presentation
Track success effectively with the Performance Tracking Using OKRs presentation. This sleek infinity loop design showcases key metrics across People, Products, and Processes, making it ideal for business performance reviews, goal alignment, and strategic planning. Fully editable and compatible with PowerPoint, Keynote, and Google Slides for seamless customization.


4 diapositivas
Investor-Ready Pitch for New Ventures Presentation
Make a lasting impression with the Investor-Ready Pitch for New Ventures Presentation. Designed to balance visuals with key stats, this template helps startups clearly communicate value to potential investors. Highlight milestones, team credibility, and market opportunity using bold typography and high-impact imagery. Fully editable in PowerPoint, Keynote, Google Slides, and Canva.


20 diapositivas
Air Slash Artist Portfolio Template Presentation
The Air Slash Artist Portfolio template is your perfect canvas for showcasing creativity and professionalism! Designed with a minimalist yet dynamic aesthetic, this template helps you present your projects and artistic journey with flair. Start with a compelling introduction and an "About Me" section that tells your story, followed by a detailed portfolio overview. Highlight your best work with project showcases, and explain your unique style and creative process. The template also features dedicated sections for collaborations, client testimonials, awards, and recognitions, ensuring you capture every aspect of your creative achievements. With slides for services offered, pricing, and contact information, you can connect with potential clients effortlessly. Whether you're a freelance artist, designer, or creative professional, this template is fully customizable and compatible with PowerPoint, Keynote, and Google Slides, making it a versatile choice for all your presentation needs.


22 diapositivas
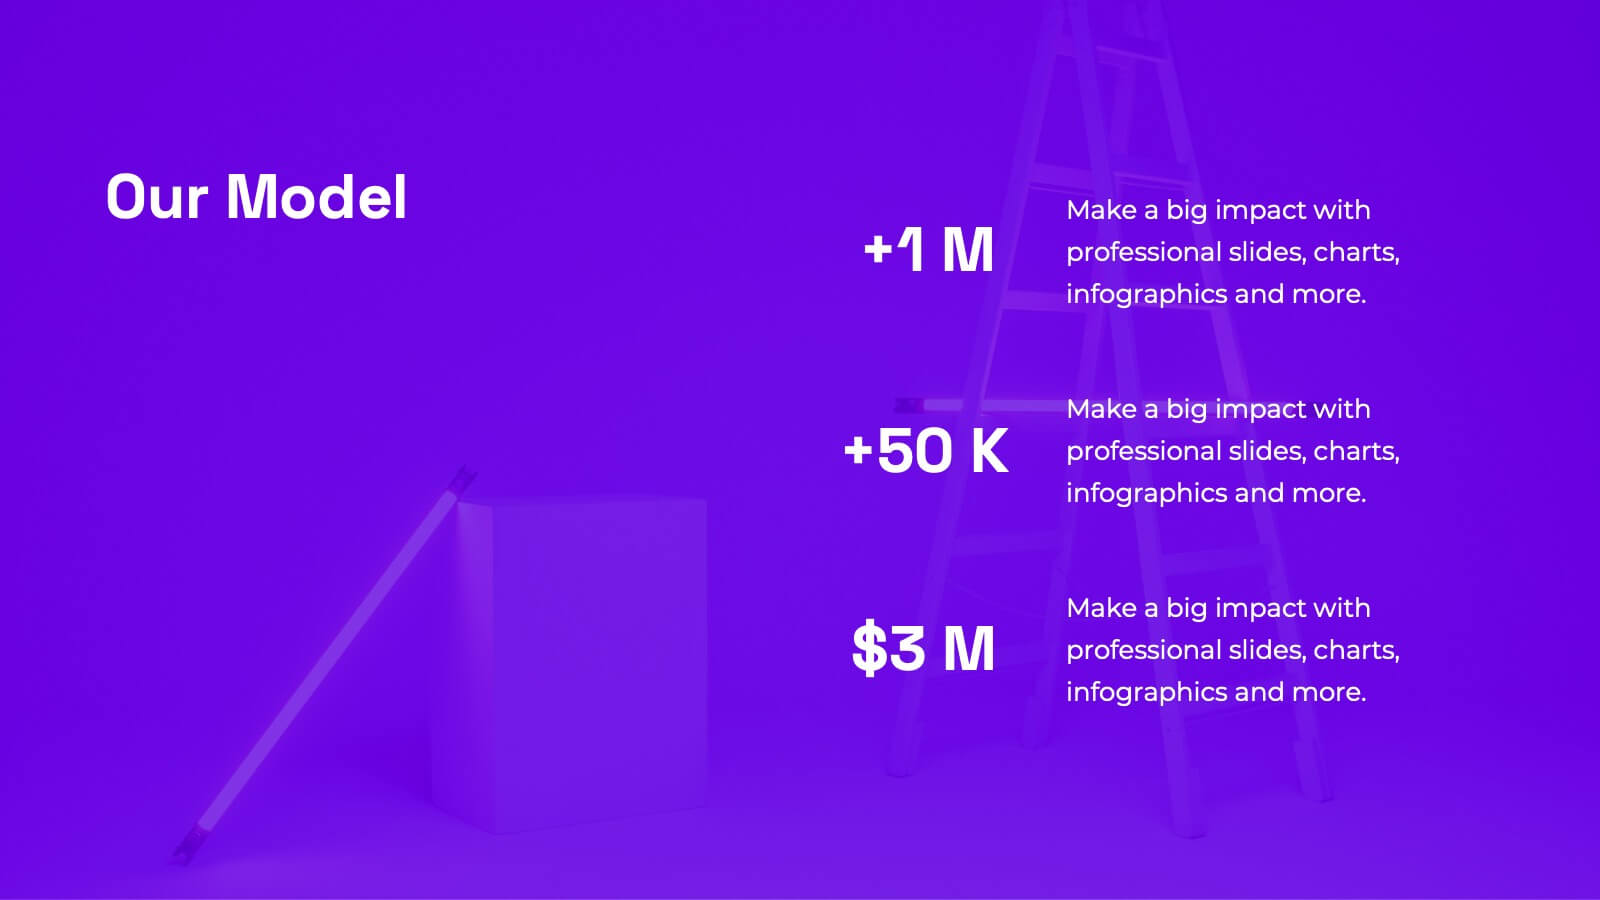
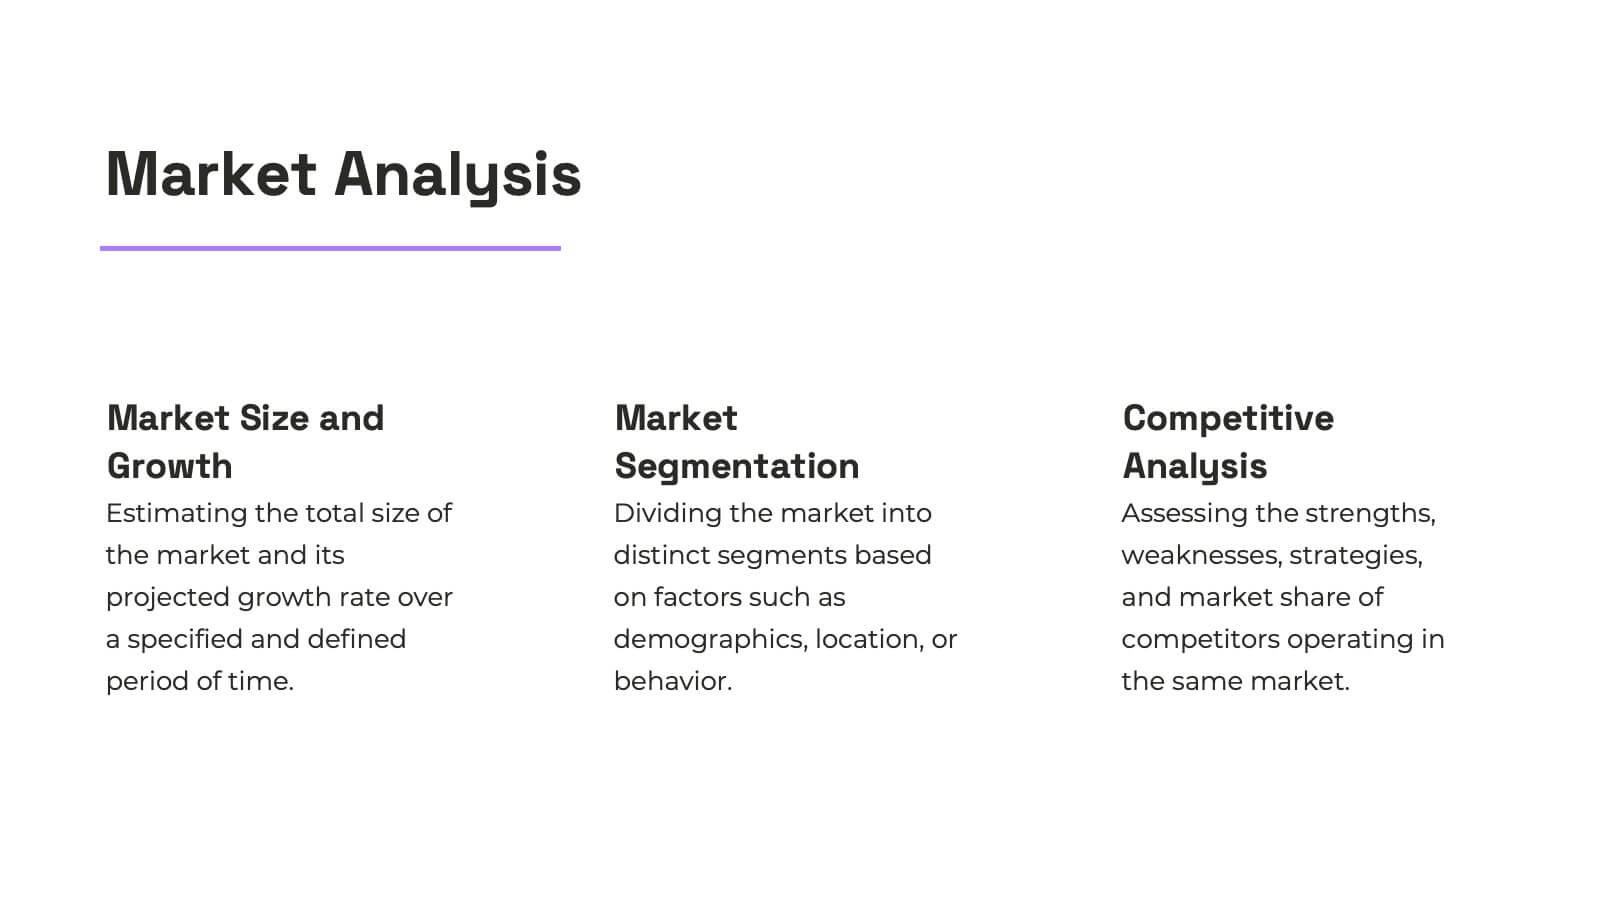
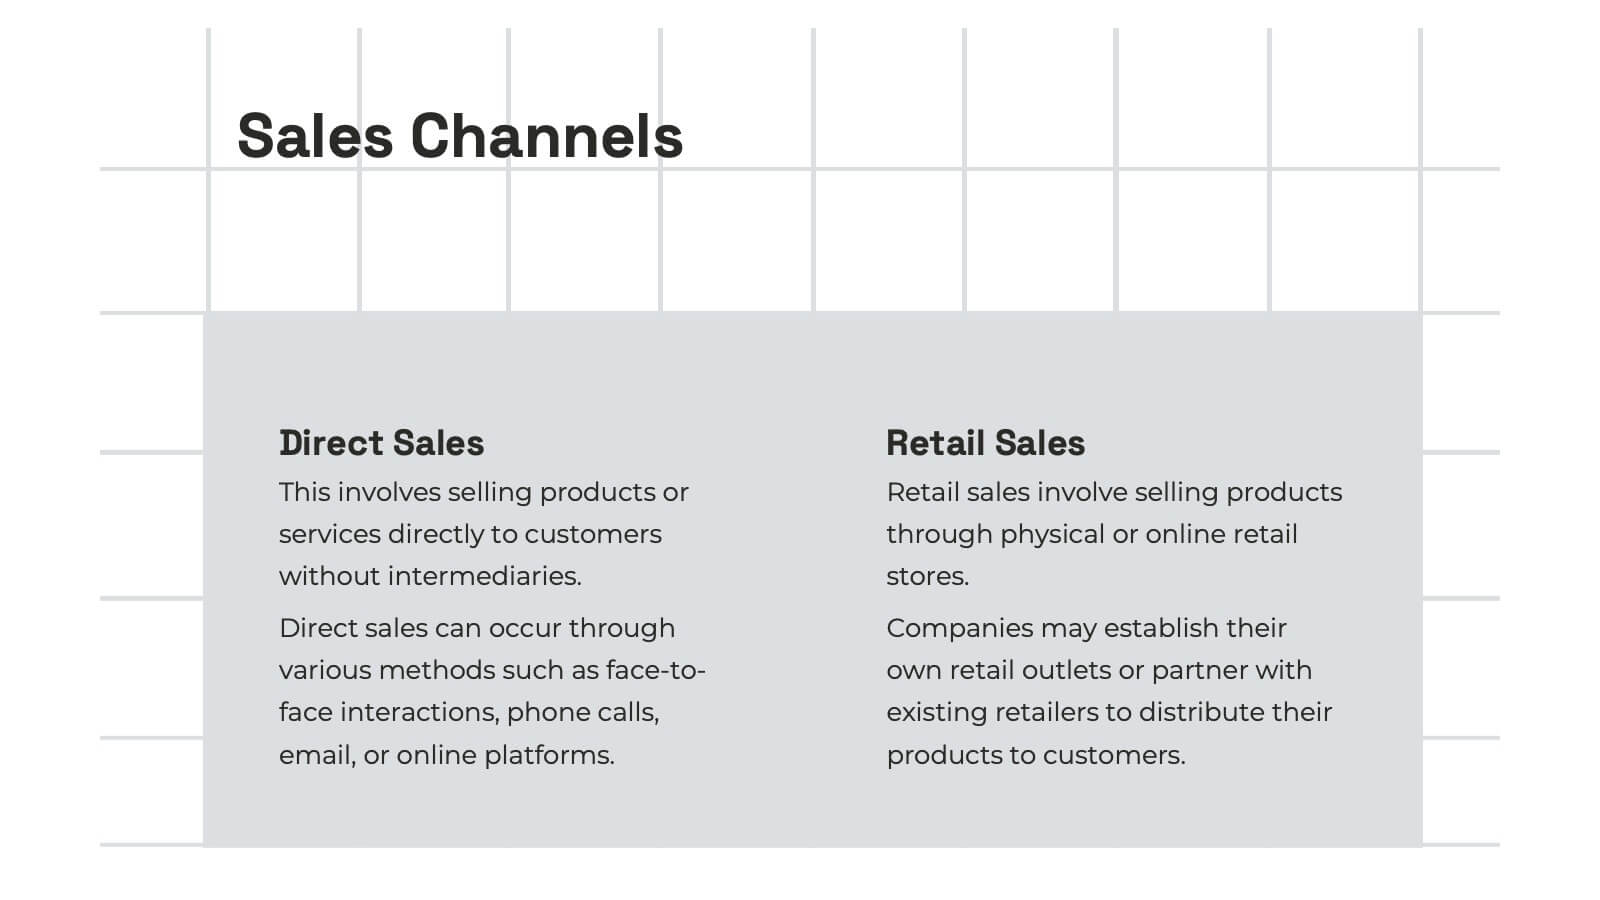
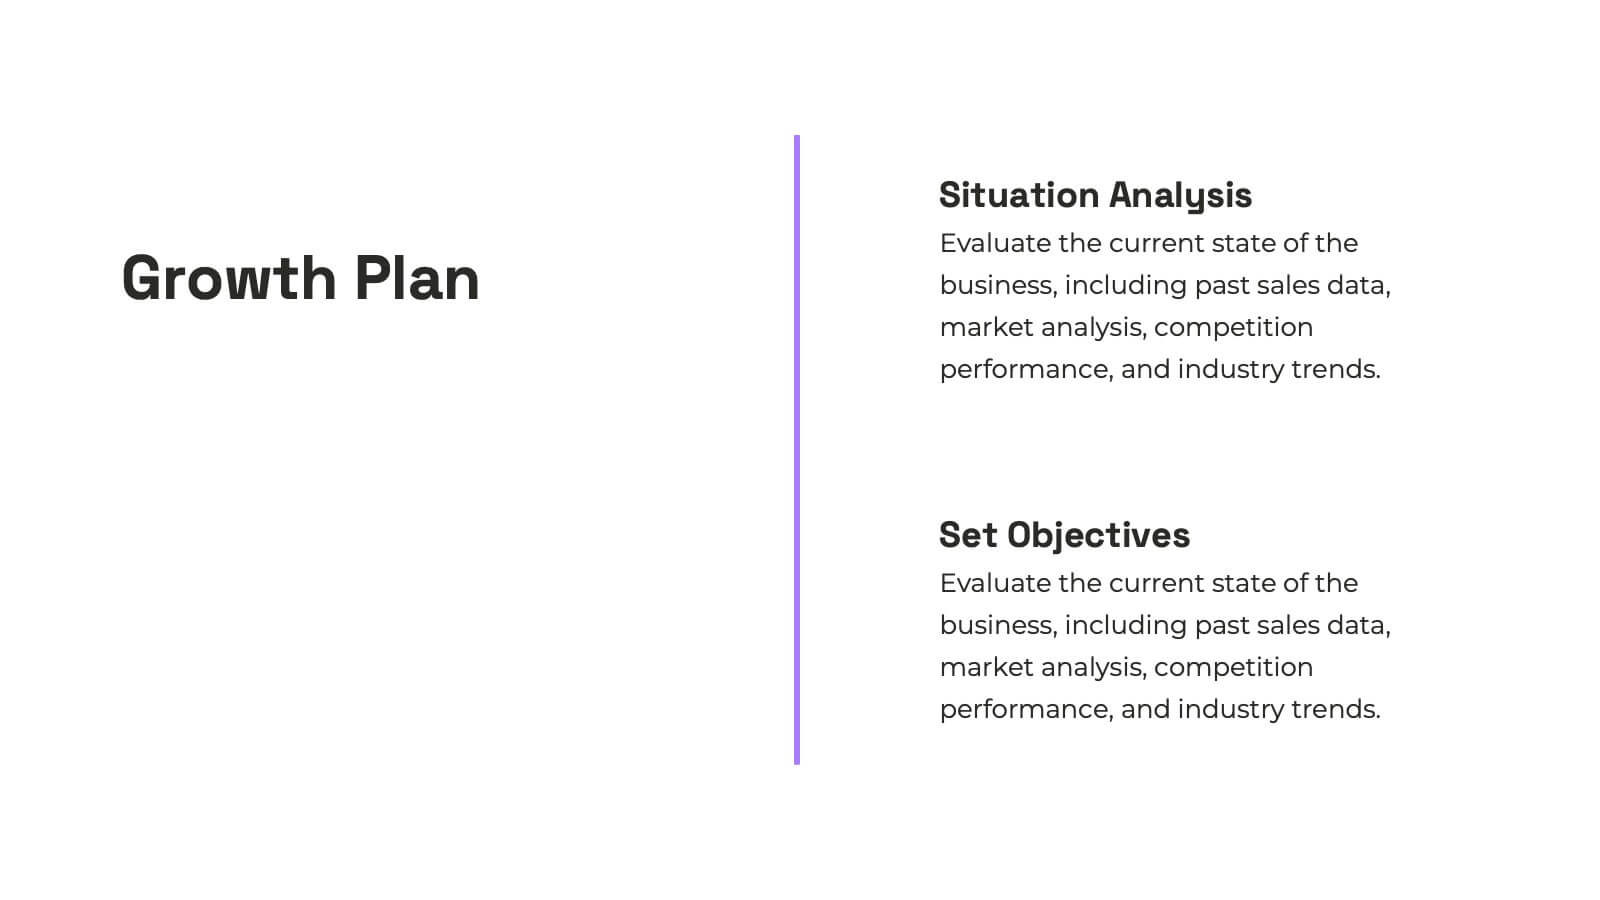
Nexus Startup Growth Plan Presentation
Jumpstart your business journey with this dynamic presentation template! Ideal for outlining your startup growth plan, it covers mission, vision, market analysis, and financial projections with sleek, professional slides. Capture investor interest and articulate your strategy effortlessly. Compatible with PowerPoint, Keynote, and Google Slides, ensuring seamless presentation across all platforms.


7 diapositivas
Aviation Infographic Presentation Template
Featuring our light, vibrant and eye-catching aviation infographic template compatible with PowerPoint. The theme is designed to show you the key facts and figures about your topic, so you can easily produce a stunning presentation. This infographic is a visual representation of information related to aviation, presented in a clear and visually appealing way. With this template cover topics such as aviation history or the economic impact of the aviation industry. The information in the template can be in the form of statistics, data visualizations, timelines, maps, or other graphical elements.


26 diapositivas
Haeleigh Presentation Template
The Haeleigh Powerpoint Template is a 26 modern slide template that is perfect for any presentation. With a clean classy aesthetic and easy to read text, this template is ideal for reading content and looking professional. The use of nude colors helps keep the look clean and easy to read. The theme comes packed with features to target your audience and help you get your message across. The charts, graphics, timelines included are easy to edit. This template is also perfect for businesses seeking to make an impression on their audience. Haeleigh is mobile friendly and easy to navigate.


6 diapositivas
Clear Roadmap and Action Strategy Presentation
Present your strategic roadmap with clarity using this arrow-step diagram. Ideal for visualizing processes, workflows, or goal-driven action plans. The curved sequence highlights five progressive steps with icons and color coding. Fully customizable in PowerPoint, Keynote, or Google Slides—perfect for business strategy meetings, project planning, or milestone tracking.


4 diapositivas
Business Strategy Alternatives Presentation
Present and compare strategic choices effectively with the Business Strategy Alternatives Presentation template. Designed to highlight key decision points, competitive advantages, and alternative approaches, this slide is ideal for business strategy discussions, market positioning, and executive planning. Fully customizable for PowerPoint, Keynote, and Google Slides to fit your presentation needs.


10 diapositivas
Business Model Hexagon Infographic
Break down your strategy into clear, modular components with the Business Model Hexagon Infographic Presentation. This visually engaging layout features five interlinked hexagons, each labeled and icon-marked for easy segmentation of your business pillars—such as value propositions, customer channels, key partners, and revenue streams. The vertical stack ensures a logical flow while keeping your message structured and professional. Fully editable in PowerPoint, Keynote, and Google Slides, allowing you to tailor icons, text, and colors to match your business theme.


6 diapositivas
Strategy Wheel Stocks Infographic
A strategy wheel, also known as a strategic wheel or strategy clock, is a visual tool used in strategic management and marketing to analyze and compare different business strategies based on their market positioning and competitive advantage. This Infographic template visually presents different investment strategies in the stock market, helping investors understand and choose the best approach based on their goals and risk tolerance. Use this template to present various strategic options on a circular diagram, allowing for easy comparison and analysis. In each strategy segment provide a brief description of the key features, goals, and risk level.


8 diapositivas
Risk Analysis Bowtie Diagram
Clarify your risk management strategy with the Risk Analysis Bowtie Diagram Presentation. This visual framework helps you analyze causes and consequences of a hazardous event using the bowtie model. The left side details potential causes and preventive controls, while the right outlines possible consequences and mitigating defenses. With bold "Before" and "After" labels, this slide makes complex risk pathways easy to understand. Fully editable in PowerPoint, Keynote, and Google Slides, with multiple highlighting variations to focus on either threats or outcomes.


7 diapositivas
Transportation & Logistics Management Infographic
Transportation and logistics refer to the management, planning, and coordination of the movement of goods, people, and information from one place to another. This professionally crafted template is designed to guide and inspire professionals in the fast-paced domain of transportation and logistics management. Explore key concepts, strategies, and best practices that drive operational excellence and ensure seamless supply chain movements. This is compatible with Powerpoint, Keynote, and Google Slides. This infographic is your compass through the world of transportation and logistics.


5 diapositivas
Workforce Structure and Unity Overview Presentation
Present your team's hierarchy and alignment clearly with the Workforce Structure and Unity Overview Presentation. This slide layout is ideal for illustrating reporting relationships, department groupings, or organizational tiers in a clean and visual format. Great for onboarding, team updates, or internal planning meetings. Fully editable in PowerPoint, Keynote, Canva, and Google Slides.