


Características


¿Tienes alguna pregunta?
Recomendar


6 diapositivas
Agenda Network Infographic
Elevate your networking events with our sophisticated collection of agenda slide templates. These slides are crafted to structure and present the flow of activities at networking events, making them essential for coordinators who aim to foster professional connections among attendees. Each template is designed with clarity and style, featuring clean lines and modern graphics to outline key segments of your event, such as welcome remarks, networking sessions, panel discussions, and closing statements. The thoughtful layout includes designated spaces for time slots, session titles, and speaker details, ensuring that participants can easily follow the event's progression and plan their participation accordingly. These slides are fully customizable, allowing you to match the visual design with your event’s theme or corporate branding. The adaptable format makes it simple to insert or remove sections based on the specific needs of your event. Ideal for business conferences, industry meet-ups, or any professional gathering, these agenda slides help you manage and execute a seamless networking experience.


5 diapositivas
Sprint Planning and Agile Cycle Overview Presentation
Break down agile sprints with this clean, circular cycle layout. Ideal for scrum teams and product managers to illustrate sprint planning, task flow, and iterative progress. Includes five key stages with icon support. Fully customizable in PowerPoint, Keynote, and Google Slides for agile ceremonies, planning sessions, or team training.


7 diapositivas
Survey Results Infographic Presentation Template
Your survey results are the most important part of the research process. Now you can present your findings to colleagues and clients in a professional and impactful way with this survey results template. This infographic design allows you to organize your results with ease. Designed to help you easily transform your survey results into an eye-catching, professional presentation. It includes everything a successful presentation needs with standard shapes and text boxes that are easy to customize. This is a great starter template for anyone looking to create an impressive report in minutes.


6 diapositivas
Progressive Work From Home Infographics
The "Progressive Work From Home" infographic template is an essential tool for today's evolving workplace. Compatible with PowerPoint, Keynote, and Google Slides, this template is designed for managers, team leaders, and organizations embracing the remote work model. This innovative template features essential elements of remote working, including tools for virtual collaboration, productivity metrics, and strategies for maintaining team cohesion. It's crafted to help you effectively communicate the benefits and best practices of remote work, making it invaluable for presentations aimed at optimizing work-from-home policies and procedures. The design is sleek and modern, with a color scheme that is both professional and uplifting. It embodies the flexibility and efficiency of remote work, making your presentation not just informative but also inspiring. Whether you're discussing remote work strategies with your team, presenting to management, or conducting a workshop, this template will ensure your message is clear, concise, and impactful.


7 diapositivas
Root Cause Protocol Infographic Presentation
A Root Cause Infographic is a visual tool that is used to analyze and identify the underlying causes of a problem or issue. This template is perfect to use for quality control, project management, or problem-solving processes to help organizations identify the root cause of an issue and develop effective solutions. This infographic includes a series of interconnected elements or components, with the central element representing the problem or issue being analyzed. This template includes text, icons, and other graphic elements to help illustrate the relationships between different components.
21 diapositivas
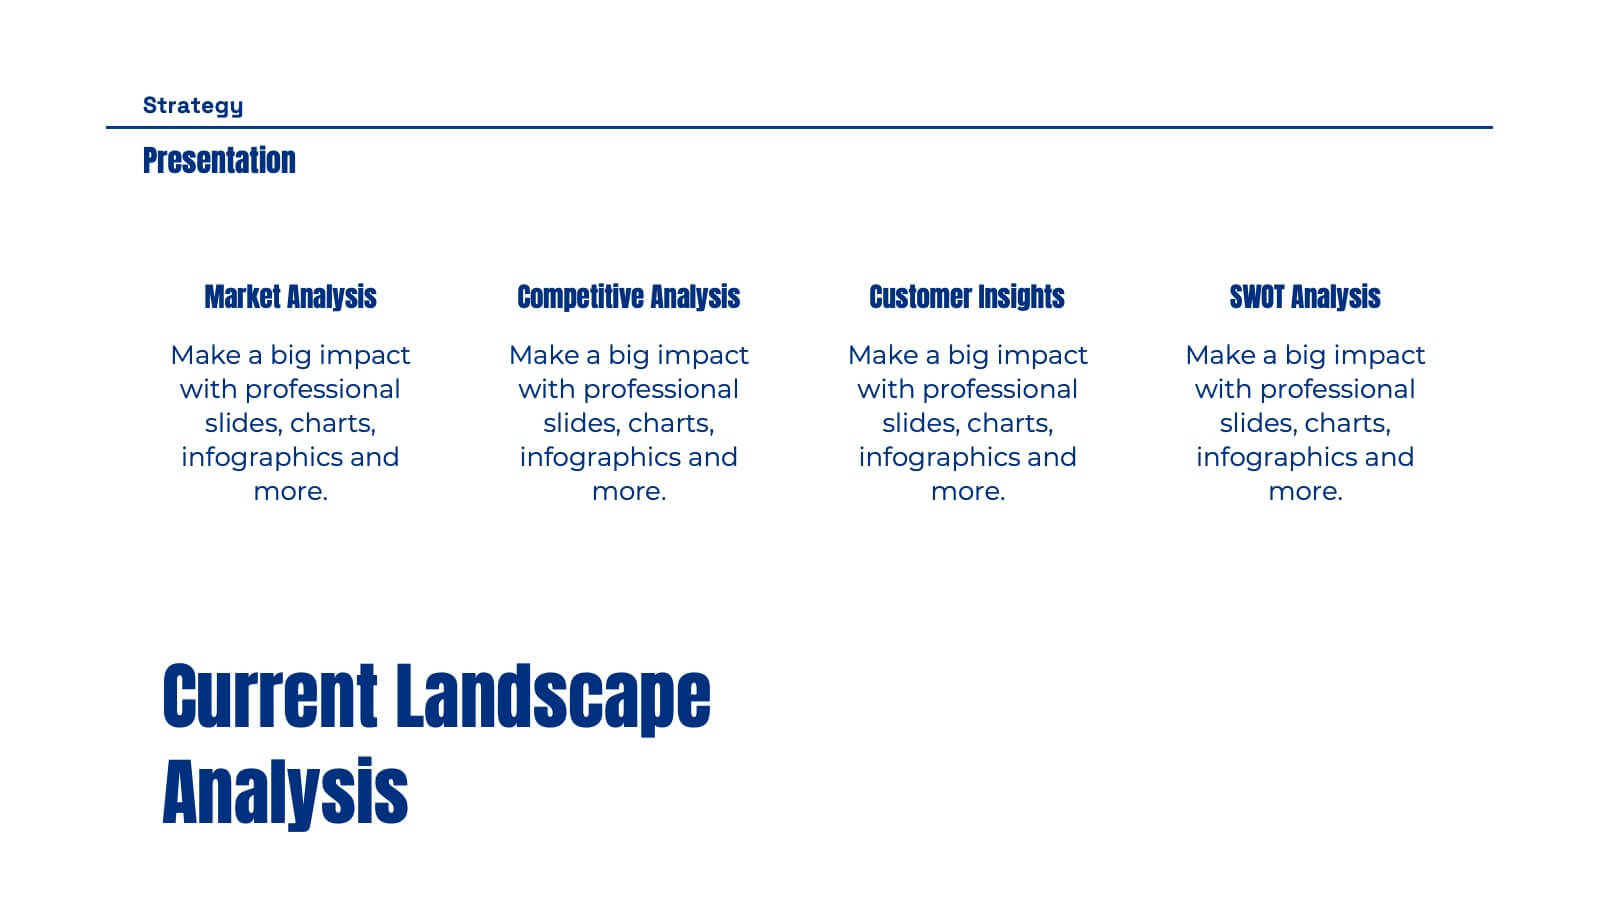
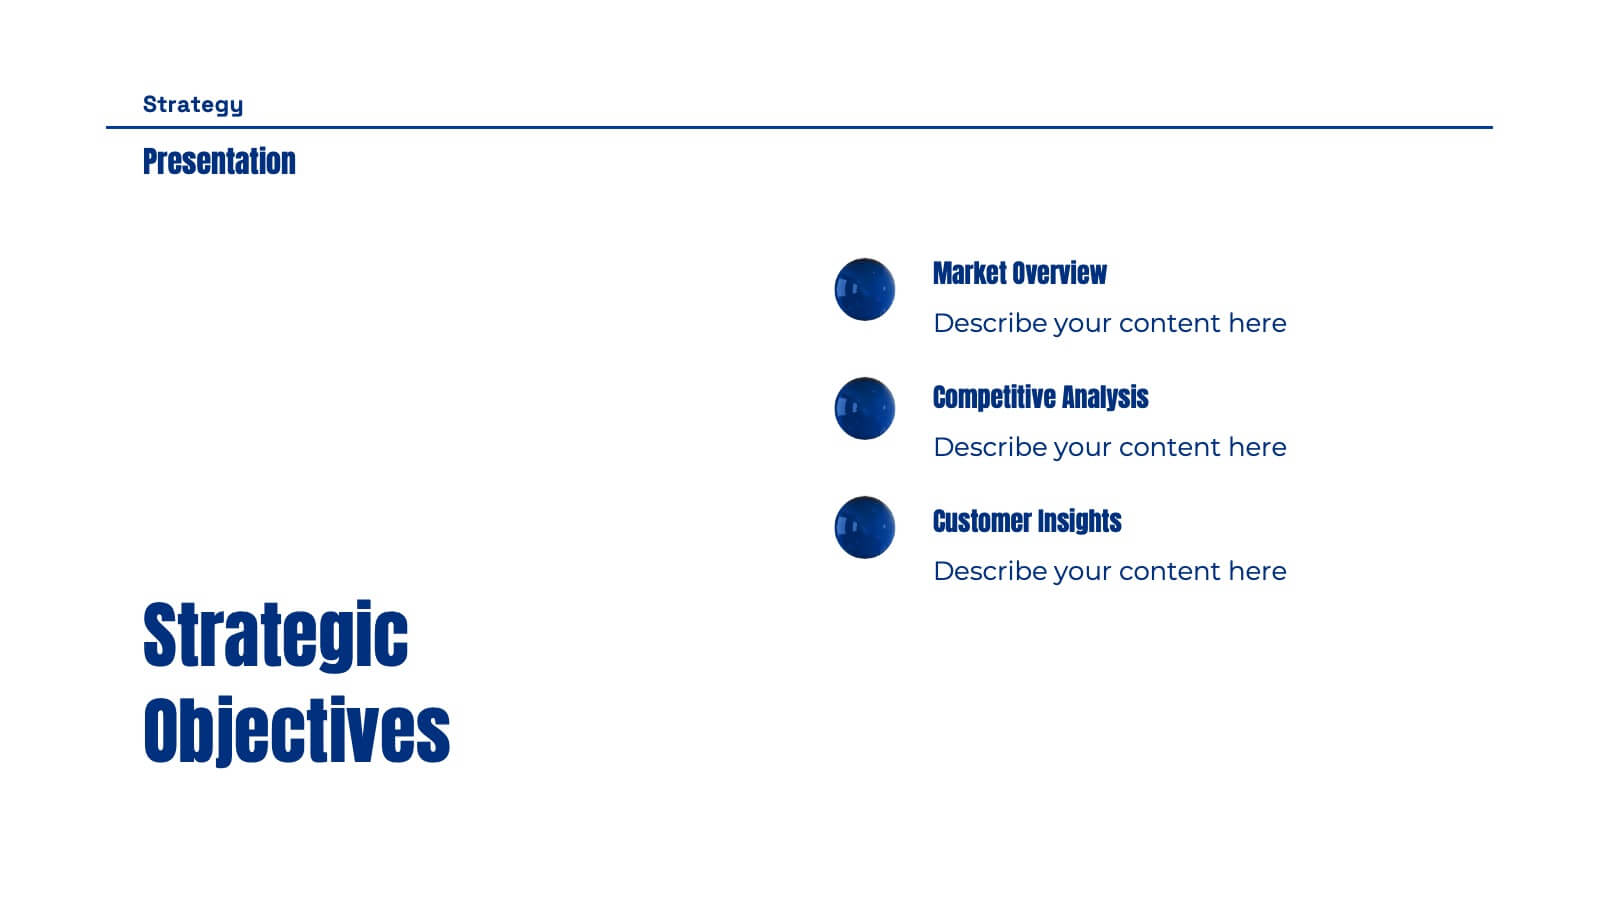
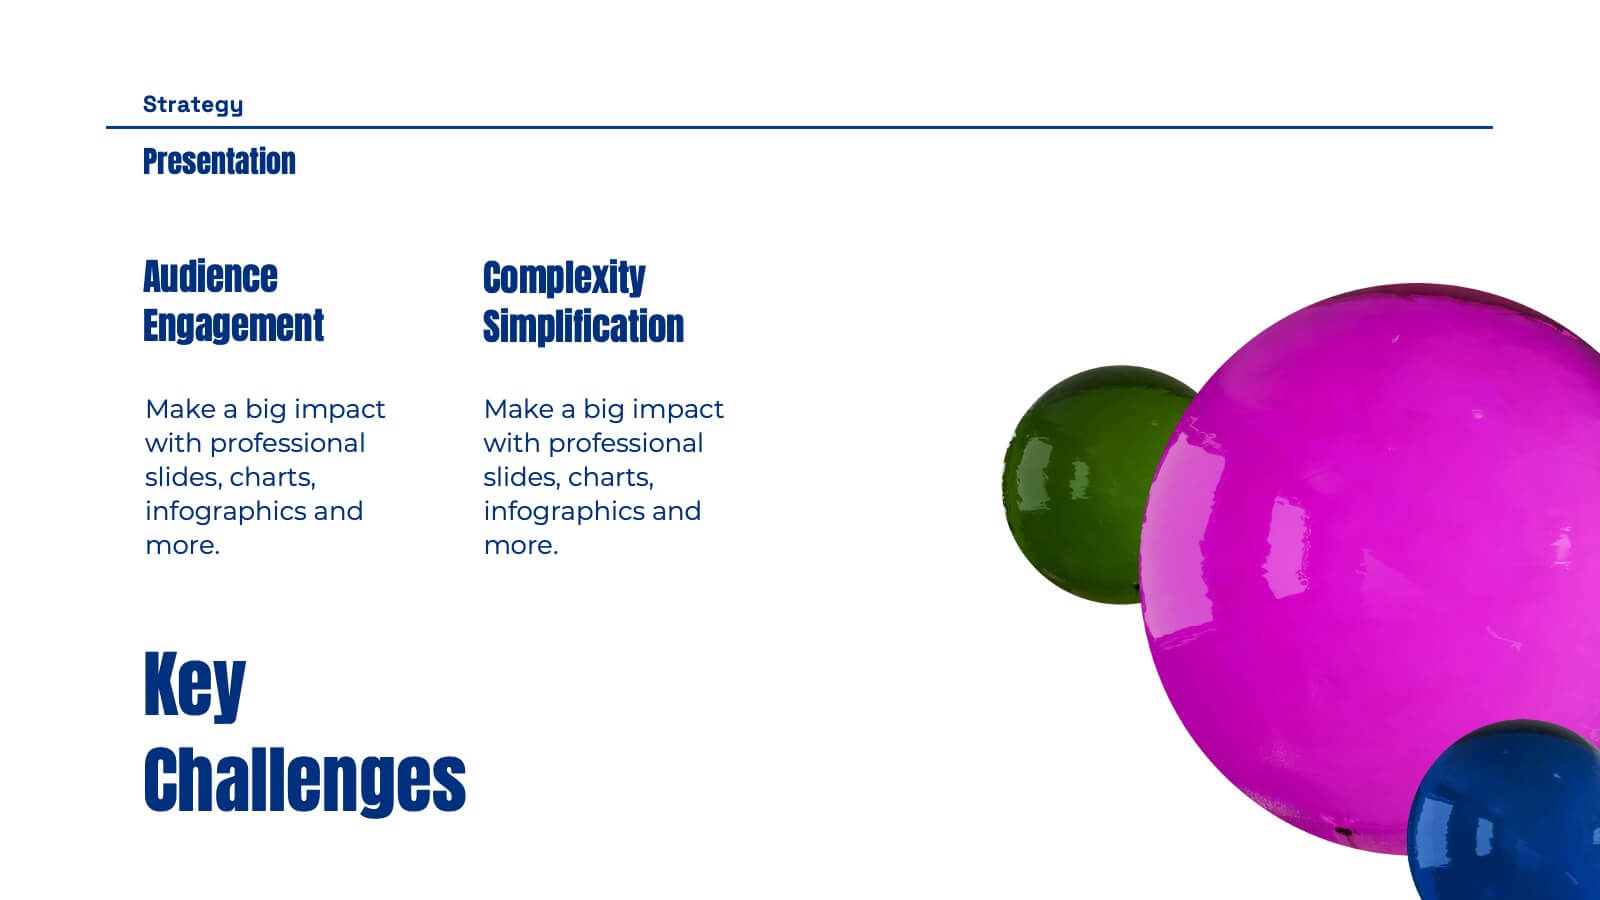
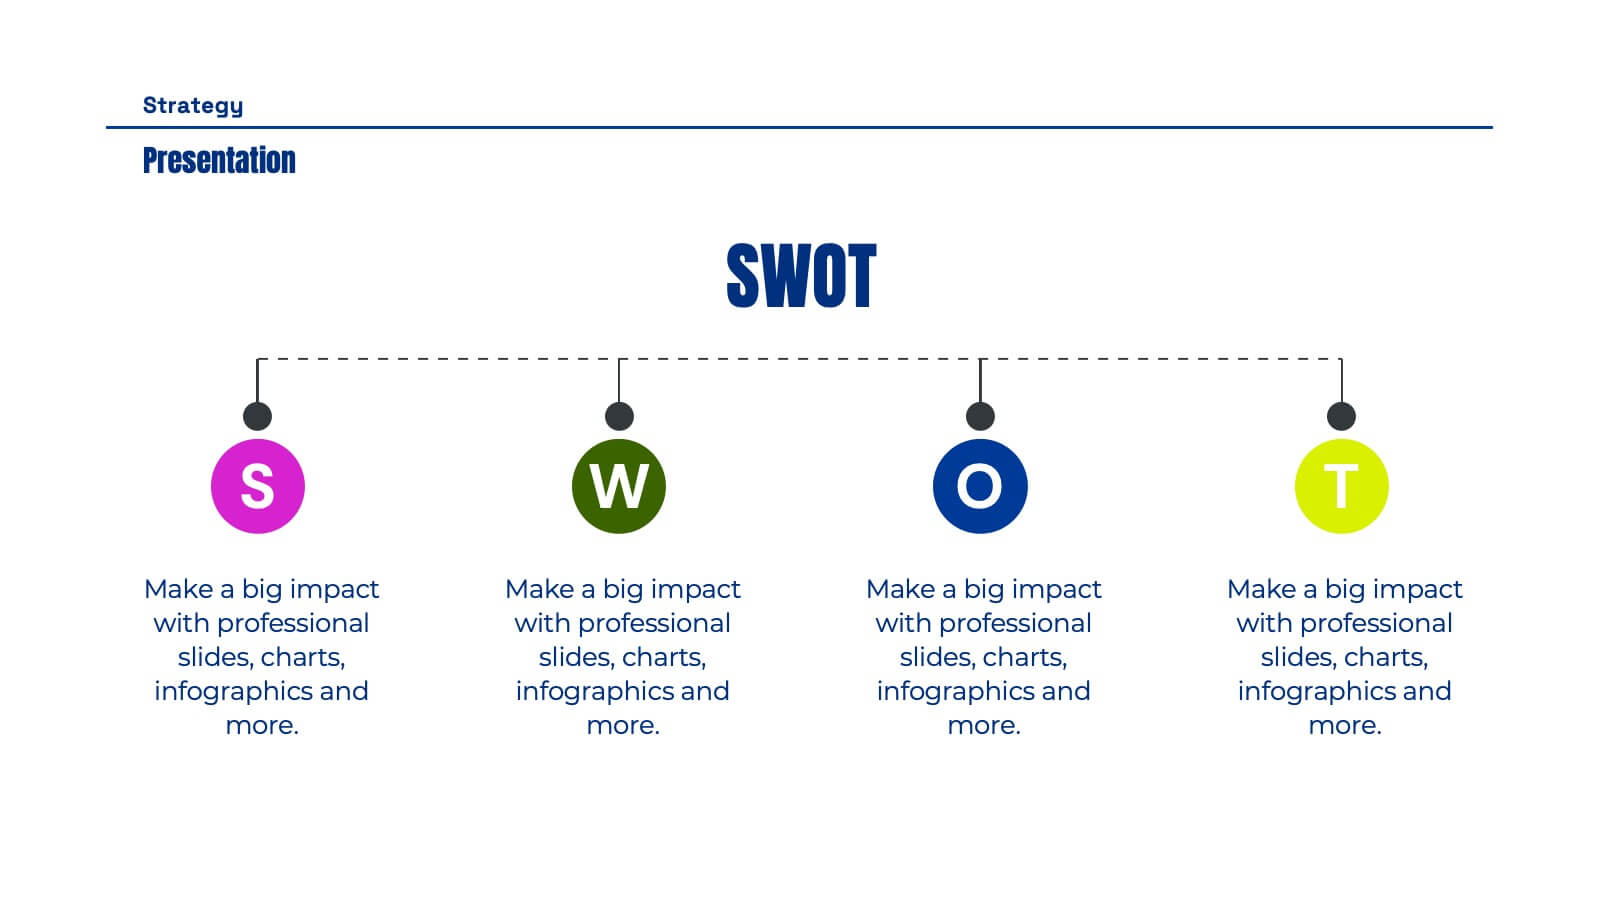
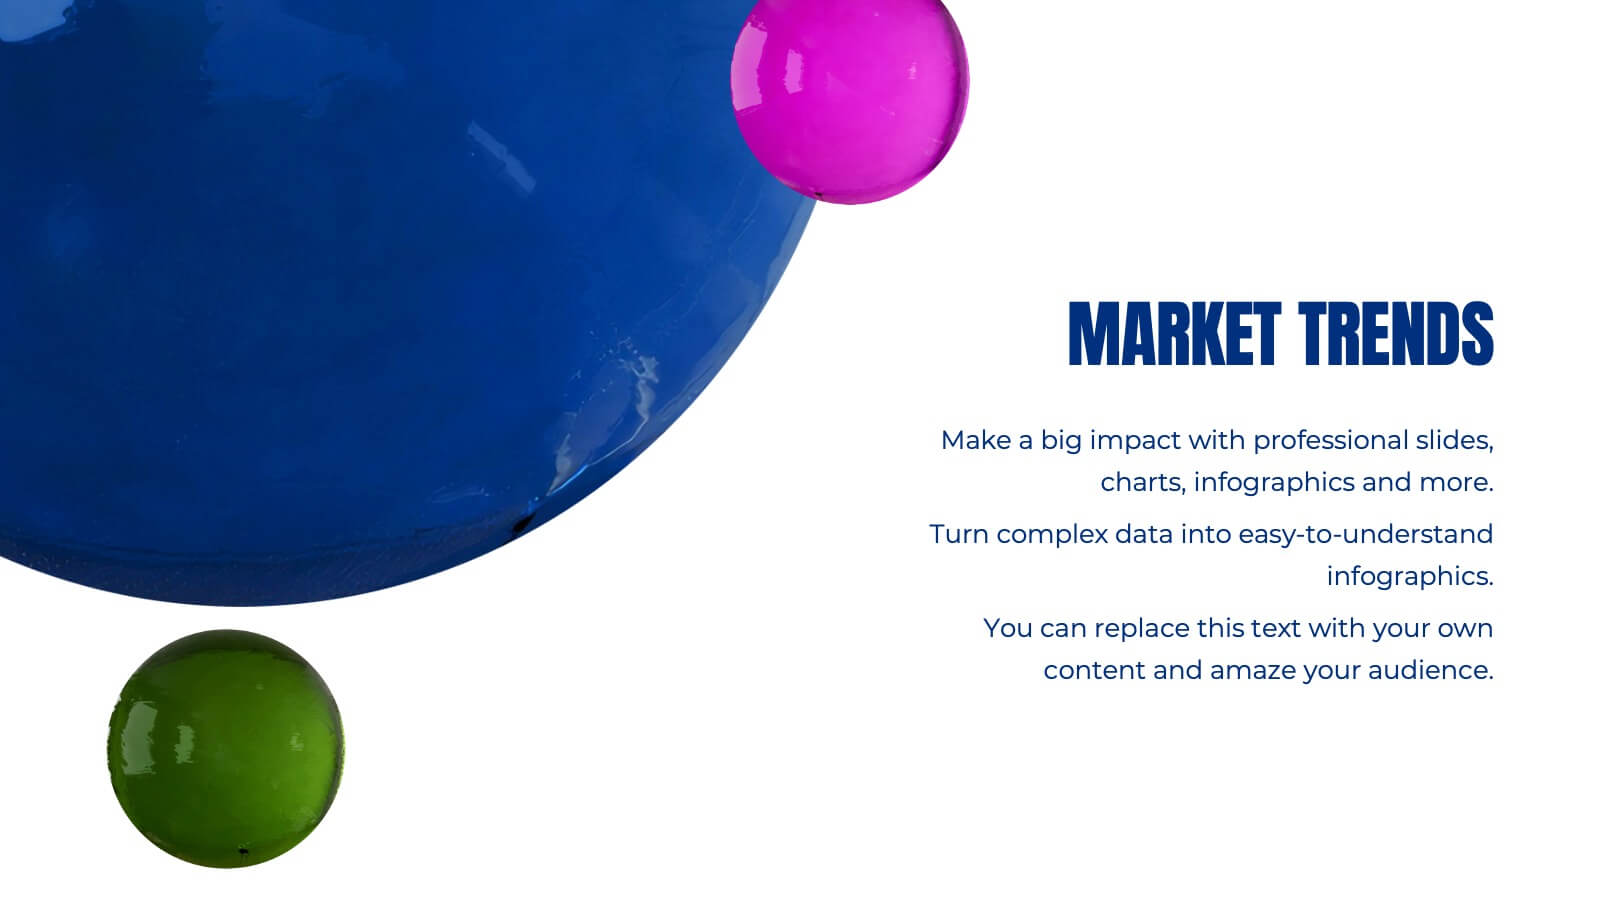
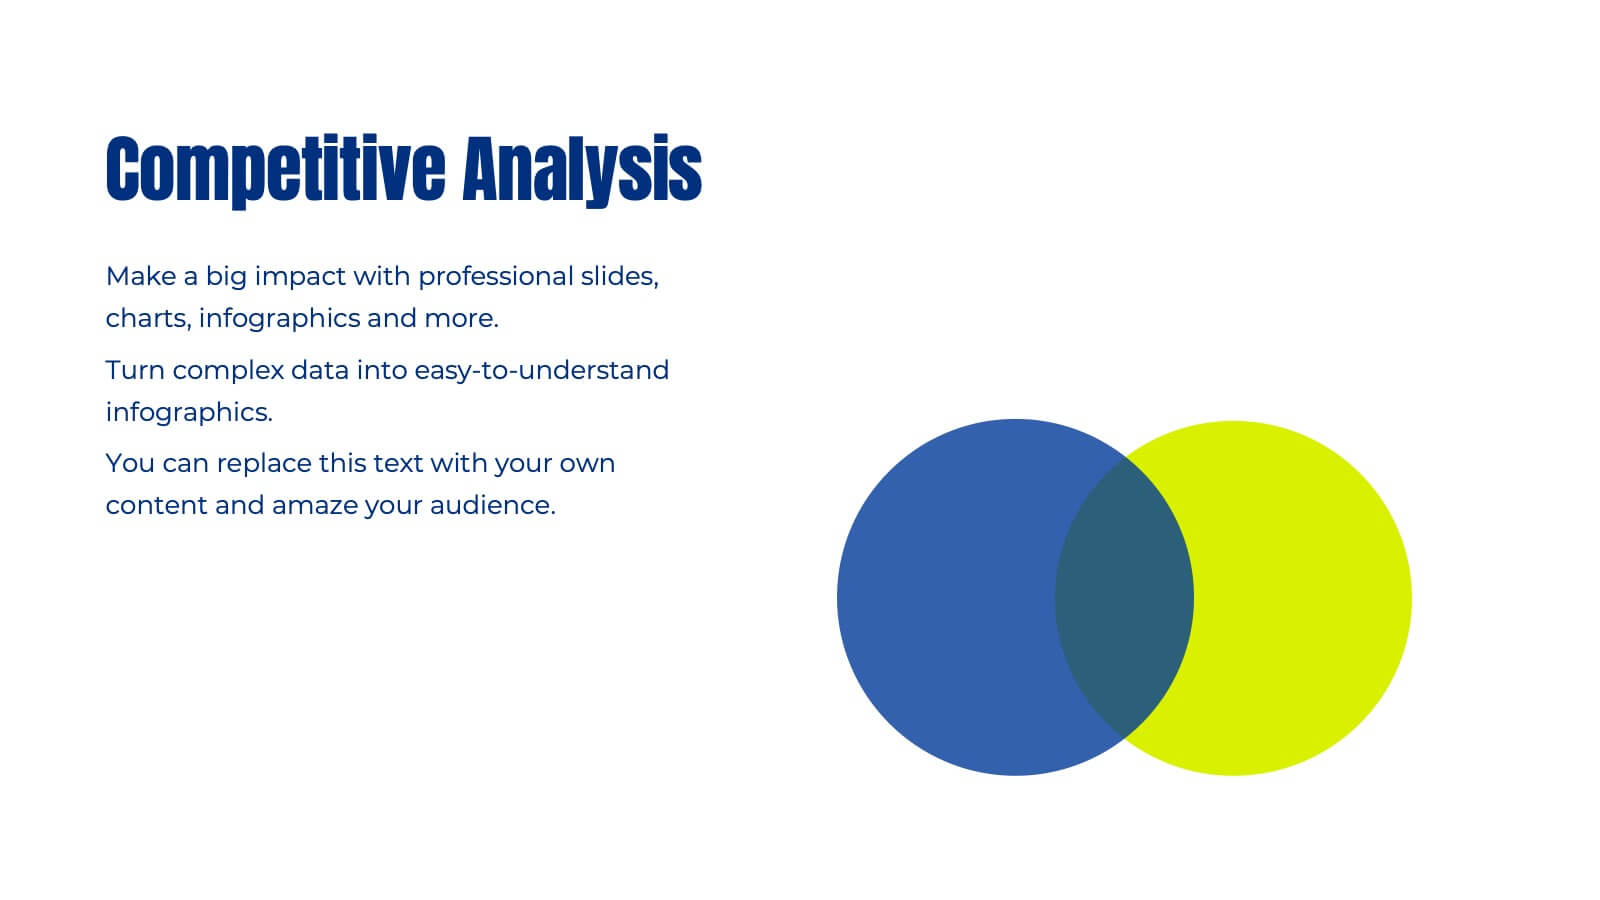
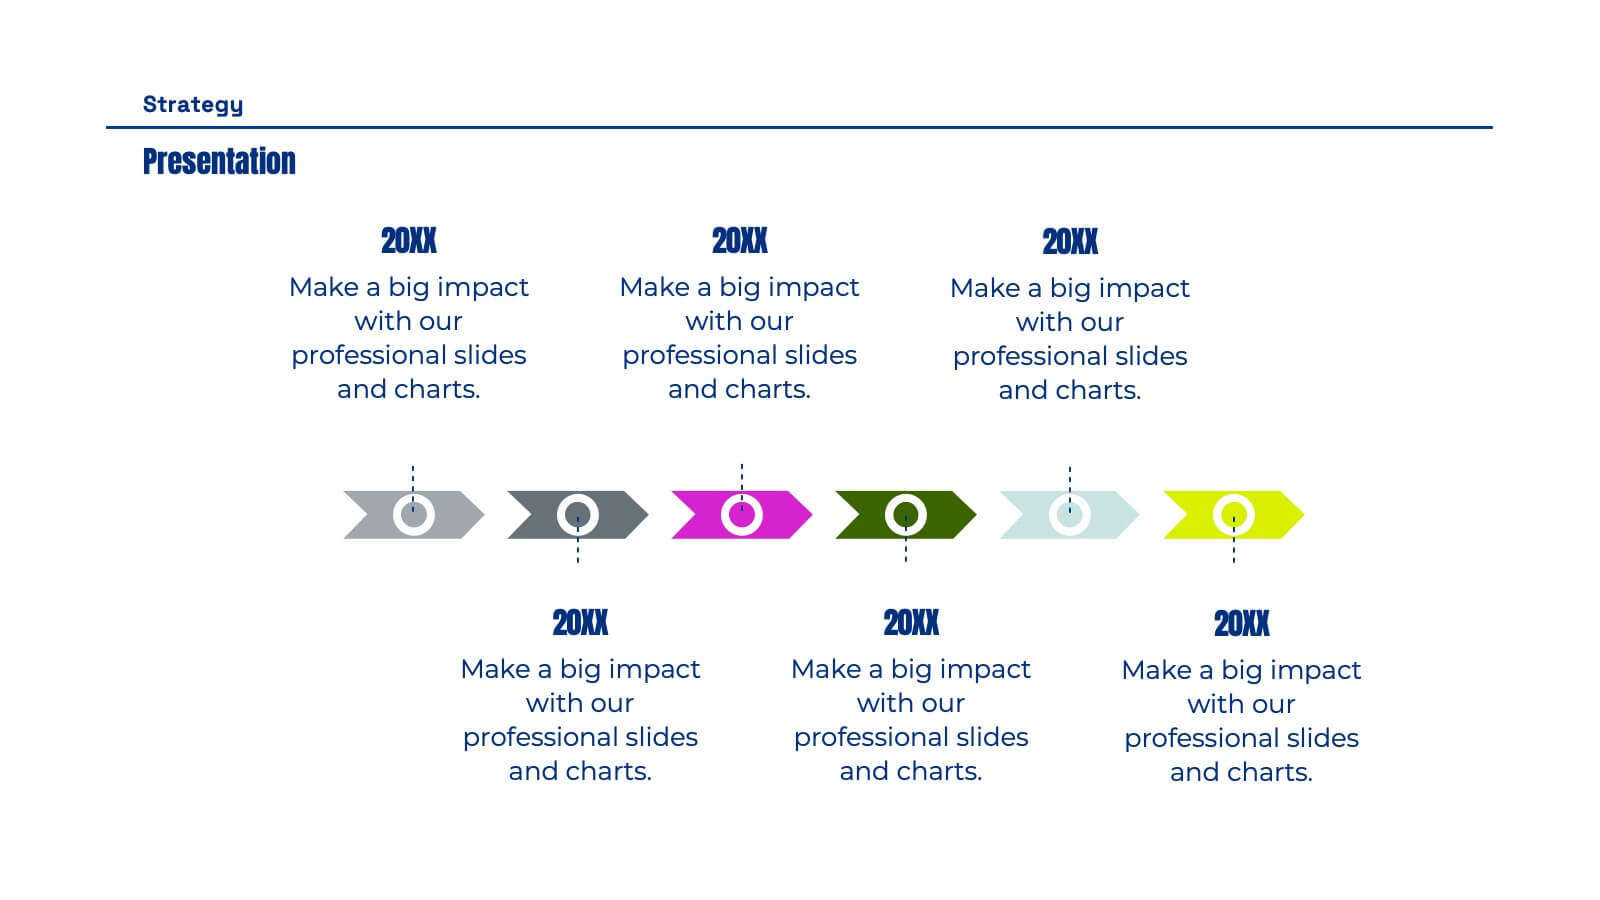
Ops Business Strategy Presentation
Set your strategy in motion with this dynamic, visually striking presentation template! Perfect for conveying key business insights like competitive analysis, market trends, and strategic objectives, it helps organize your plan for success. Each slide focuses on clarity and effectiveness, making it ideal for impactful presentations. Compatible with PowerPoint, Keynote, and Google Slides for effortless use across platforms.


6 diapositivas
Business Security Compliance Presentation
Visualize your security framework with this clear and modern infographic layout. This slide is ideal for presenting compliance steps, risk assessments, or regulatory requirements, featuring a shield-centered hub with 5 editable sections. Customize easily in PowerPoint, Keynote, or Google Slides.


6 diapositivas
Organizational Mind Mapping Slide Presentation
Bright ideas deserve a space to grow, and this presentation turns complex thoughts into a clean, organized visual map. It helps teams outline processes, connect concepts, and structure information with clarity and flow. Perfect for planning or strategy sessions. Fully compatible with PowerPoint, Keynote, and Google Slides.


6 diapositivas
Product Introduction Infographic
Showcase your new products with our series of slide templates designed for impactful product introductions. Each template is crafted to highlight the unique features and benefits of your products, making them ideal for launch presentations, marketing meetings, and stakeholder briefings. Featuring a clean and modern design, these slides are structured to guide the audience through a compelling narrative about your product, from its conception to its market entry. The use of vivid imagery, alongside detailed text descriptions, ensures that each aspect of the product is clearly communicated and visually engaging. Customizable to suit your specific needs, these templates can be adapted to feature your product’s specifications, advantages, and potential impact. They serve as a crucial tool for organizations looking to generate excitement and support for new offerings, providing a professional and persuasive presentation format.


5 diapositivas
Energy Sources in The United States Infographics
Energy Sources in The United States Infographics is a bold, colorful, and modern presentation


4 diapositivas
Corporate Hierarchy Levels Diagram Presentation
Visualize organizational structures clearly with this Corporate Hierarchy Levels Diagram Presentation. Designed for showcasing leadership flow, team divisions, or reporting relationships, each slide features a simple tiered layout with editable icons and placeholders. Great for business planning, team introductions, or org chart overviews. Fully customizable in PowerPoint, Keynote, Canva, and Google Slides.


7 diapositivas
Organized Table of Content Slide Presentation
Present your topics with clarity using this Organized Table of Content Slide template. Designed for structured overviews, it features clean, modern layouts with customizable section markers and icons. Ideal for reports, proposals, and presentations. Fully editable in Canva, PowerPoint, and Google Slides to fit your brand’s style and color palette.


6 diapositivas
Harvey Ball Chart Business Analysis Presentation
Visualize comparisons with clarity using this Harvey Ball Chart Business Analysis slide. Perfect for showcasing performance, risk assessments, satisfaction ratings, or benchmarking, this layout includes 6 labeled items with corresponding Harvey Ball visuals. Easily customizable in PowerPoint, Keynote, or Google Slides, it’s ideal for executive reporting and strategic analysis.


7 diapositivas
PESTEL Framework for External Analysis Presentation
Evaluate external factors with ease using the PESTEL Framework for External Analysis Presentation. This structured layout helps you assess Political, Economic, Social, Technological, Environmental, and Legal influences on your business. Perfect for market research, risk assessment, and strategic planning. Fully customizable in PowerPoint, Canva, and Google Slides.


6 diapositivas
E-learning Tools for Modern Classrooms Presentation
Present digital learning strategies with this engaging, education-themed template. Ideal for teachers, trainers, or tech coordinators introducing e-learning tools. Includes labeled sections for highlighting key features and software benefits. Fully customizable and compatible with PowerPoint, Keynote, and Google Slides—perfect for virtual classrooms, workshops, or academic tech presentations.


10 diapositivas
Financial Investment Strategy Presentation
Bring your financial ideas together with a clean, puzzle-style layout that instantly makes complex strategies feel organized and actionable. This presentation helps you explain key components, compare performance drivers, and present investment plans with clarity and confidence. Easy to edit and fully compatible with PowerPoint, Keynote, and Google Slides.


6 diapositivas
Orientation Plan for New Employees Presentation
Welcome your new team members with confidence using a visually clear, step-based layout that streamlines the introduction process. This presentation helps HR leaders outline company values, roles, and expectations with ease and professionalism. Fully compatible with PowerPoint, Keynote, and Google Slides for effortless editing and presentation across any platform.