


Características


¿Tienes alguna pregunta?
Recomendar


7 diapositivas
College Statistics Infographic Presentation
A College Statistics Infographic is a visual representation of key data and statistics related to a college. This template can provide a quick and easy-to-understand overview of various aspects of the institution, such as enrollment figures, graduation rates, student demographics, and academic performance metrics. Featured are icons, illustrations, diagrams, and other design elements to enhance the visual appeal of this infographic and make it more engaging for your viewers. This template can be a useful tool for students, teachers, and others interested in learning more about a college.


26 diapositivas
Simplified Home Decor Presentation
Bring a breath of fresh air to interior design with this elegant presentation template, perfect for unveiling the beauty of simplified home decor. The template's clean lines and soft color palette evoke the minimalist charm and serene ambiance of modern living spaces. Each slide offers a harmonious blend of imagery and text, showcasing tranquil interiors that speak volumes about the less-is-more philosophy. From showcasing key principles of minimalist design to offering tips on decluttering and organizing, this template guides viewers through the transformative process of creating a peaceful home environment. Infographics lend themselves to discussing color schemes, space functionality, and the impact of natural light, making this a comprehensive tool for interior designers, home organizers, or decor enthusiasts. Fully compatible with PowerPoint, Keynote, and Google Slides, this template is a canvas for creativity, ready to inspire and engage audiences in the art of living simply and stylishly.


6 diapositivas
12-Month Calendar Overview Presentation
Kick off your planning with a clean, colorful layout that makes every month easy to visualize at a glance. This presentation helps you map timelines, milestones, and deadlines in a structured format ideal for yearly planning. Fully editable and compatible with PowerPoint, Keynote, and Google Slides.


7 diapositivas
Supply Chain Stock Infographic Presentation
A Supply Chain Infographic is a visual representation of information related to the flow of goods and services from suppliers to customers. This template is perfect for businesses and organizations involved in supply chain management, logistics, and procurement who want to communicate complex information in a clear way. This infographic can help engage stakeholders, promote understanding of supply chain-related issues, and drive positive change in the industry. Compatible with Powerpoint, Keynote, and Google Slides this template can be easily edited with different colors, fonts, and text.


4 diapositivas
Future-Focused Business Vision Planning Presentation
Plan ahead with clarity using the Future-Focused Business Vision Planning infographic. This 4-step layout helps you outline long-term goals, strategic milestones, and action points in a visually structured format. Perfect for business roadmaps, planning decks, and executive briefings. Fully editable in Canva, PowerPoint, and Google Slides.


6 diapositivas
Strategic Planning with OKRs
Align your business strategy with measurable outcomes using this OKR-based planning slide. Highlight objectives, key activities, and results alongside a clear problem-solution structure. Perfect for strategy sessions and team planning meetings. Fully editable in PowerPoint, Keynote, and Google Slides.


7 diapositivas
Team Work Strategy Infographic
Harness the collective strength of your team with our team work strategy infographic. Set against a pristine white backdrop, this design is accentuated with vivid strokes of purple, blue, yellow, and orange, symbolizing the diverse skills and unity in a team. Crafted for seamless compatibility with Powerpoint, Keynote, and Google Slides, the template features versatile graphics, detailed icons, and adaptable image placeholders. Envisage the synergy, collaboration, and the strategic prowess of a unified team, all laid out in a visually appealing format.


5 diapositivas
Agriculture in The United States Infographics
Agriculture has been a crucial sector in the United States since its founding, with a rich history of innovation and productivity. These Infographics are visual representation of the agricultural industry in the US, covering statistics, trends, and insights about the sector. Use these to include information about the top crops grown in the country as well as the states with the highest agricultural output. The design incorporates nature-inspired icons and a customizable color palette that reflects the natural elements associated with agriculture such as green and brown hues. The vertical layout also allows for easy scrolling and viewing on digital platforms.


6 diapositivas
Step-by-Step Process Guide Presentation
Clearly outline your workflow with this step-by-step process guide template, featuring six bold arrow graphics for sequential planning. Perfect for illustrating procedures, timelines, or strategies, this modern design ensures clarity and flow. Fully editable in Canva, PowerPoint, or Google Slides, making it ideal for business, project management, or training presentations.


8 diapositivas
Puzzle Piece Strategy Connection Presentation
Align your ideas with clarity using the Puzzle Piece Strategy Connection Presentation. This vertical puzzle layout visually connects four key steps, making it perfect for illustrating strategy alignment, workflow processes, or integrated systems. Easily editable in PowerPoint, Canva, or Google Slides—ideal for team briefings or strategic roadmaps.
22 diapositivas
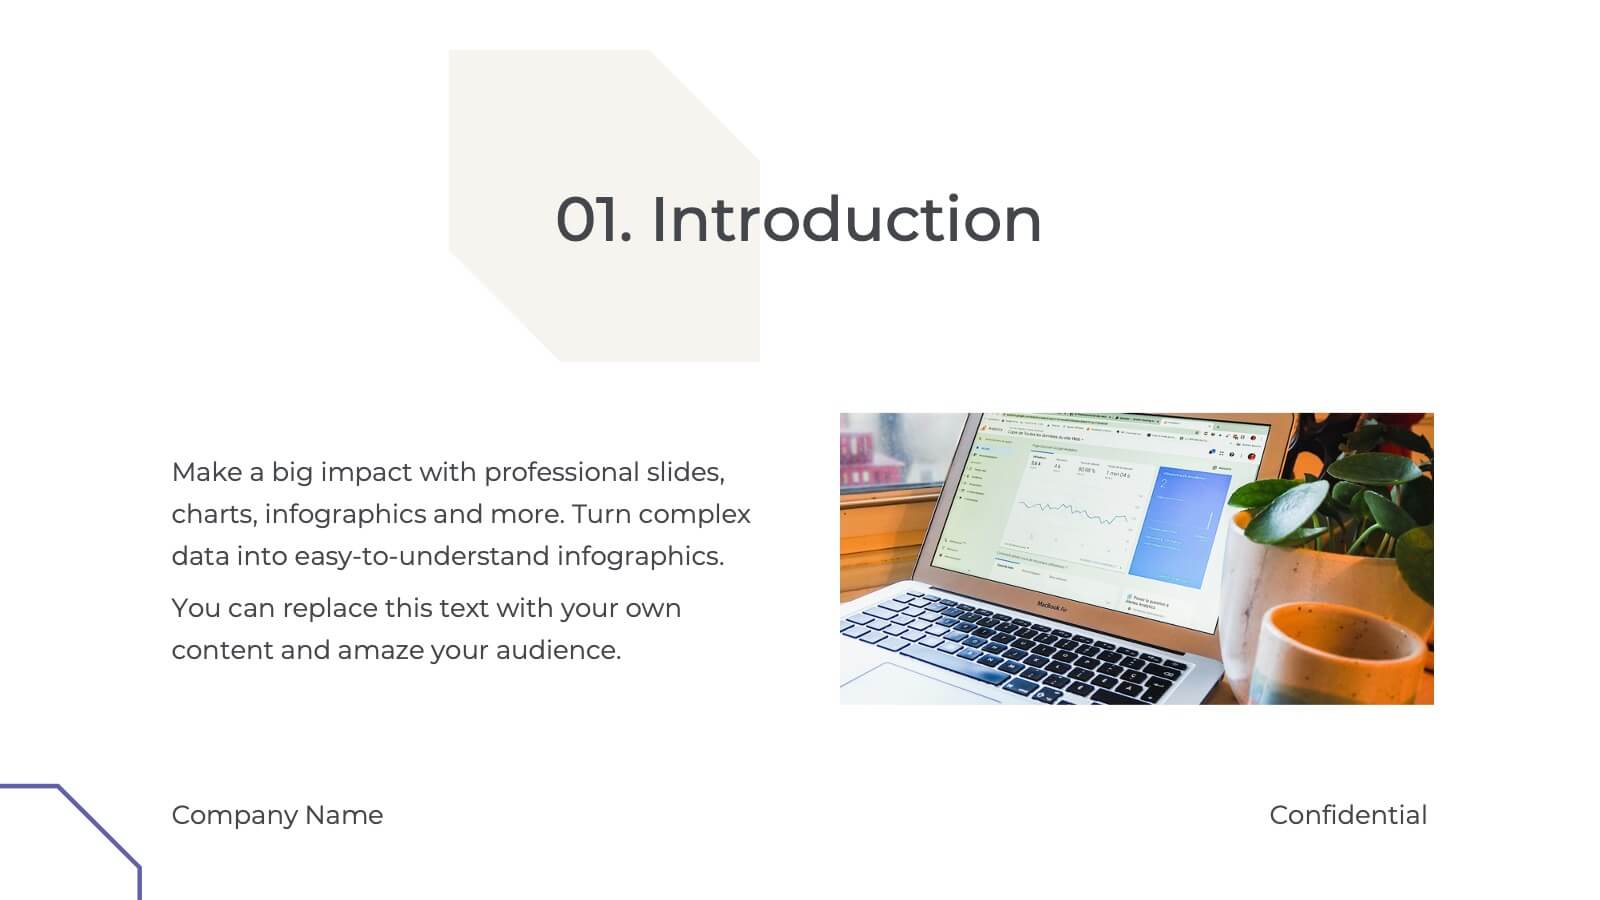
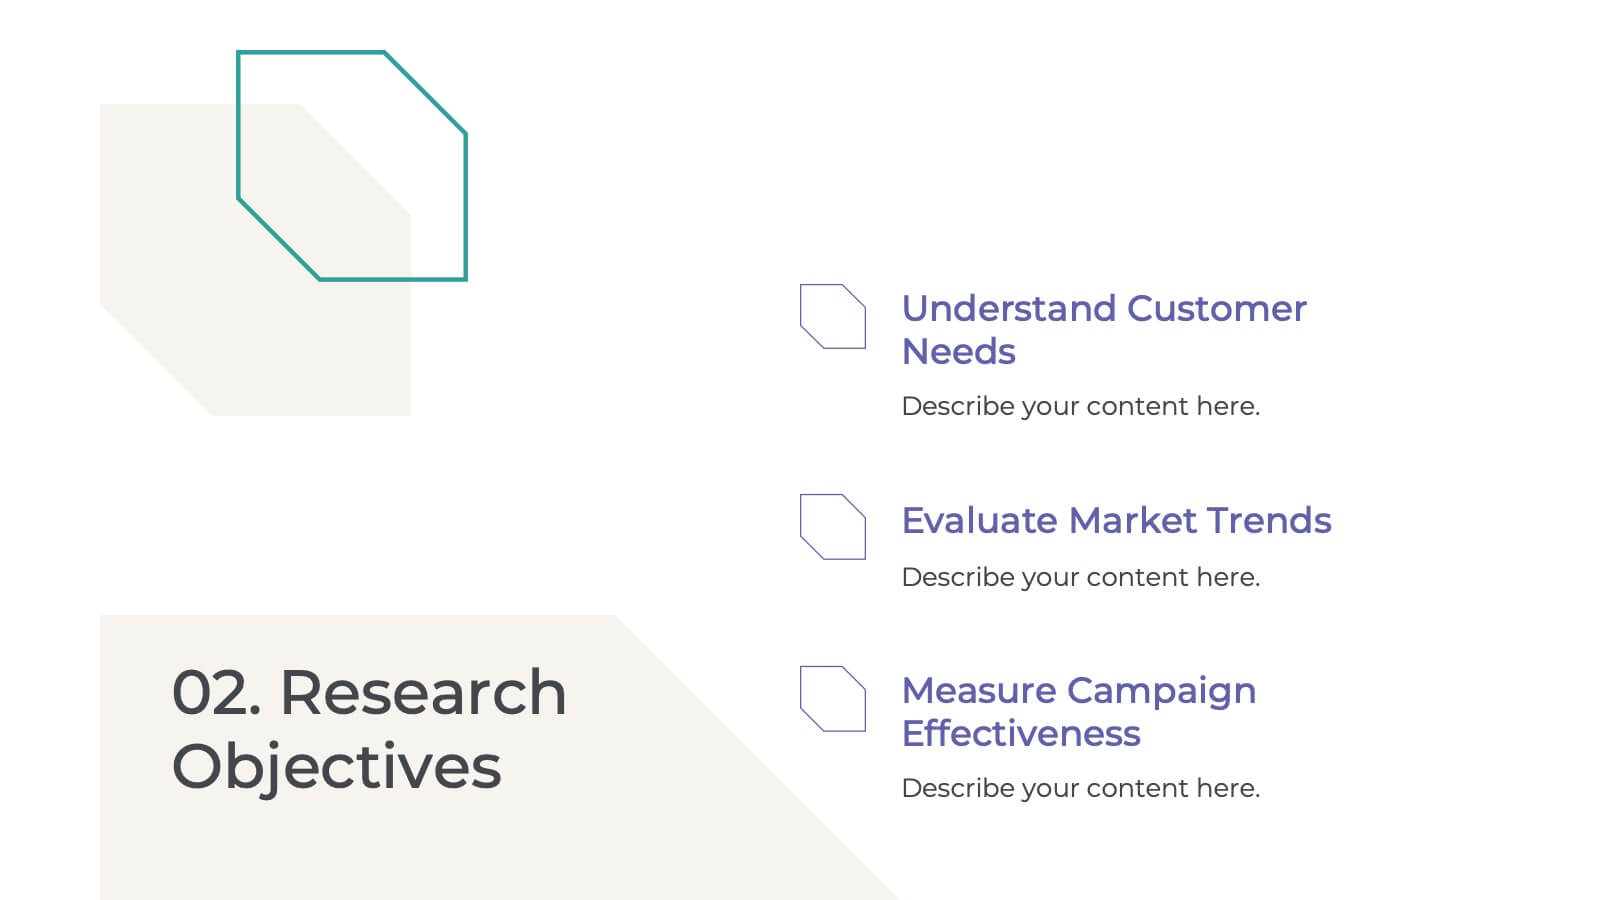
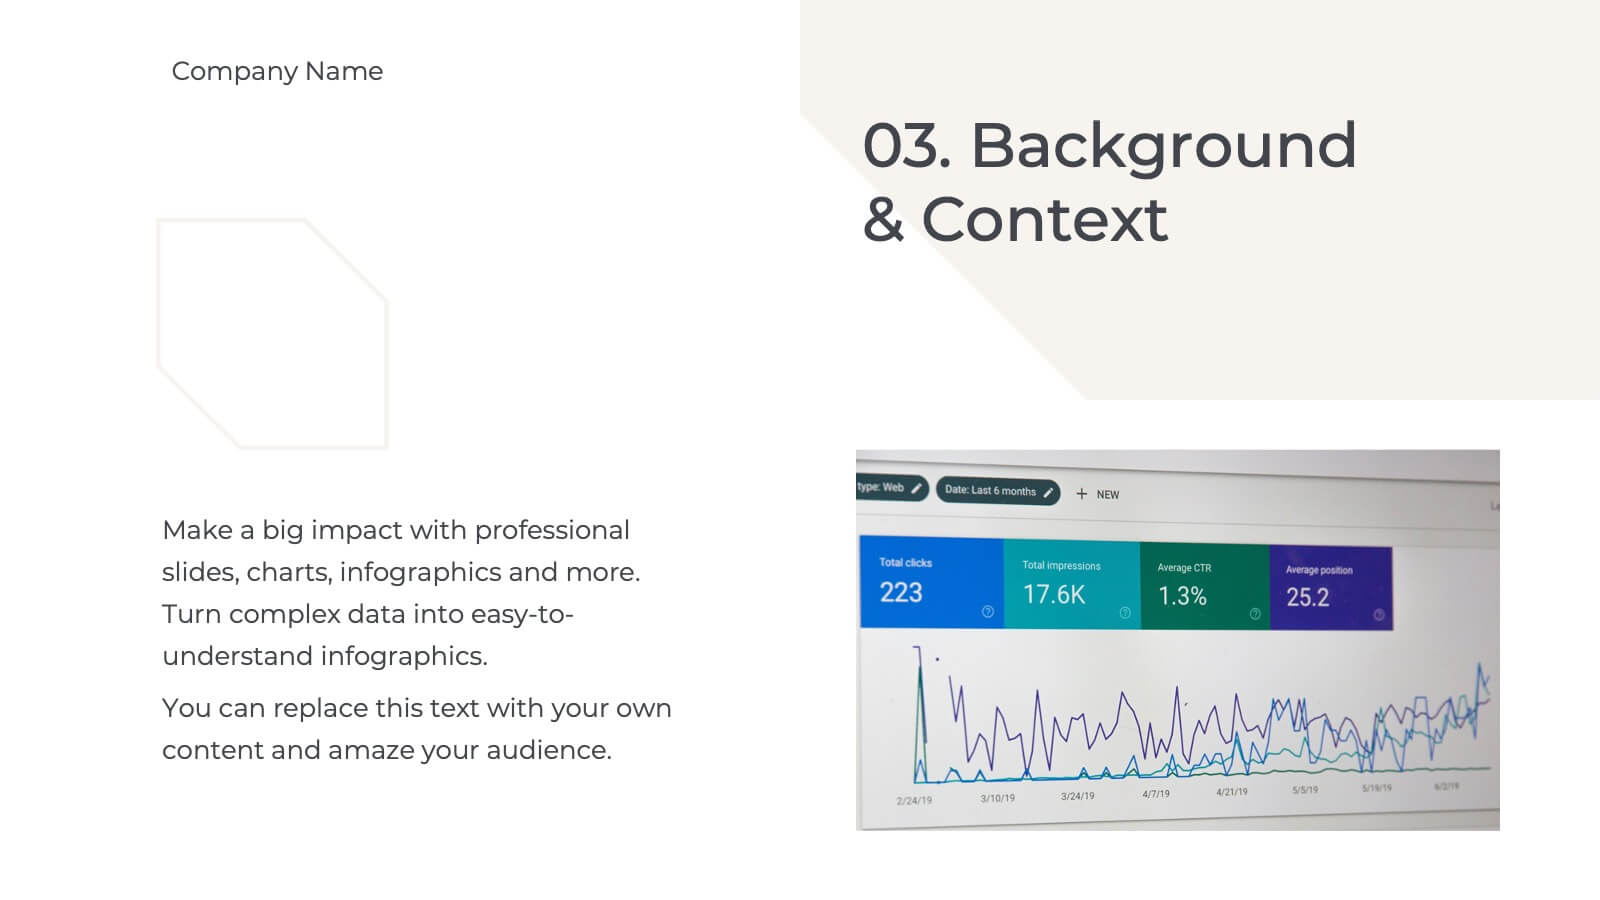
Palladium Qualitative Research Findings Presentation
Present your qualitative research findings effectively with this sleek, professional template. It includes sections for objectives, data analysis, key findings, and recommendations. Ideal for organizing research insights clearly, it's customizable and compatible with PowerPoint, Keynote, and Google Slides, ensuring smooth collaboration and impactful presentations for your audience.


10 diapositivas
Business Model Hexagon Infographic
Break down your strategy into clear, modular components with the Business Model Hexagon Infographic Presentation. This visually engaging layout features five interlinked hexagons, each labeled and icon-marked for easy segmentation of your business pillars—such as value propositions, customer channels, key partners, and revenue streams. The vertical stack ensures a logical flow while keeping your message structured and professional. Fully editable in PowerPoint, Keynote, and Google Slides, allowing you to tailor icons, text, and colors to match your business theme.


6 diapositivas
Tourism and Hospitality Industry Trends Presentation
Visually map out emerging trends with this engaging circular infographic layout. This slide features six labeled segments connected to a central tourism icon, ideal for highlighting key industry insights, traveler behavior shifts, or hospitality service updates. Sleek and professional, it's perfect for travel agencies, hotel chains, or tourism reports. Fully customizable in PowerPoint, Keynote, and Google Slides.


19 diapositivas
Philosium Design Strategy Proposal Presentation
Bring your creative vision to life with this sleek and structured design strategy proposal presentation. Covering key elements like concept development, wireframes, typography, and user research, this template helps you communicate a compelling design approach. Fully customizable and compatible with PowerPoint, Keynote, and Google Slides for a seamless and professional presentation experience.


7 diapositivas
Mind Map Process Infographic
A Mind Map Process Infographic is a visual representation that illustrates a process or a series of steps using the structure and principles of a mind map. This template diagram is a dynamic visual guide to help individuals and teams harness the true potential of mind mapping. This is used to visually organize information in a hierarchical and interconnected manner, often starting with a central concept or theme and branching out into related ideas or subtopics. Mind maps are the ultimate tool for brainstorming, planning, and innovating, and this template is your gateway to unlocking their full potential.


6 diapositivas
5-Step SEO Marketing Funnel Presentation
Ignite your marketing story with a bold, flowing visual that makes every step feel purposeful and easy to follow. This presentation breaks down each stage of the SEO funnel, helping you explain strategy, performance, and conversion paths with clarity. Fully compatible with PowerPoint, Keynote, and Google Slides.


6 diapositivas
IT System Design and Architecture Strategy
Present your IT blueprint with the IT System Design and Architecture Strategy Presentation. This modern pentagon layout helps map out five essential components of your system strategy clearly and efficiently. Fully editable in PowerPoint, Keynote, and Google Slides—perfect for IT leaders, consultants, and infrastructure teams.