


Características


¿Tienes alguna pregunta?
Recomendar


5 diapositivas
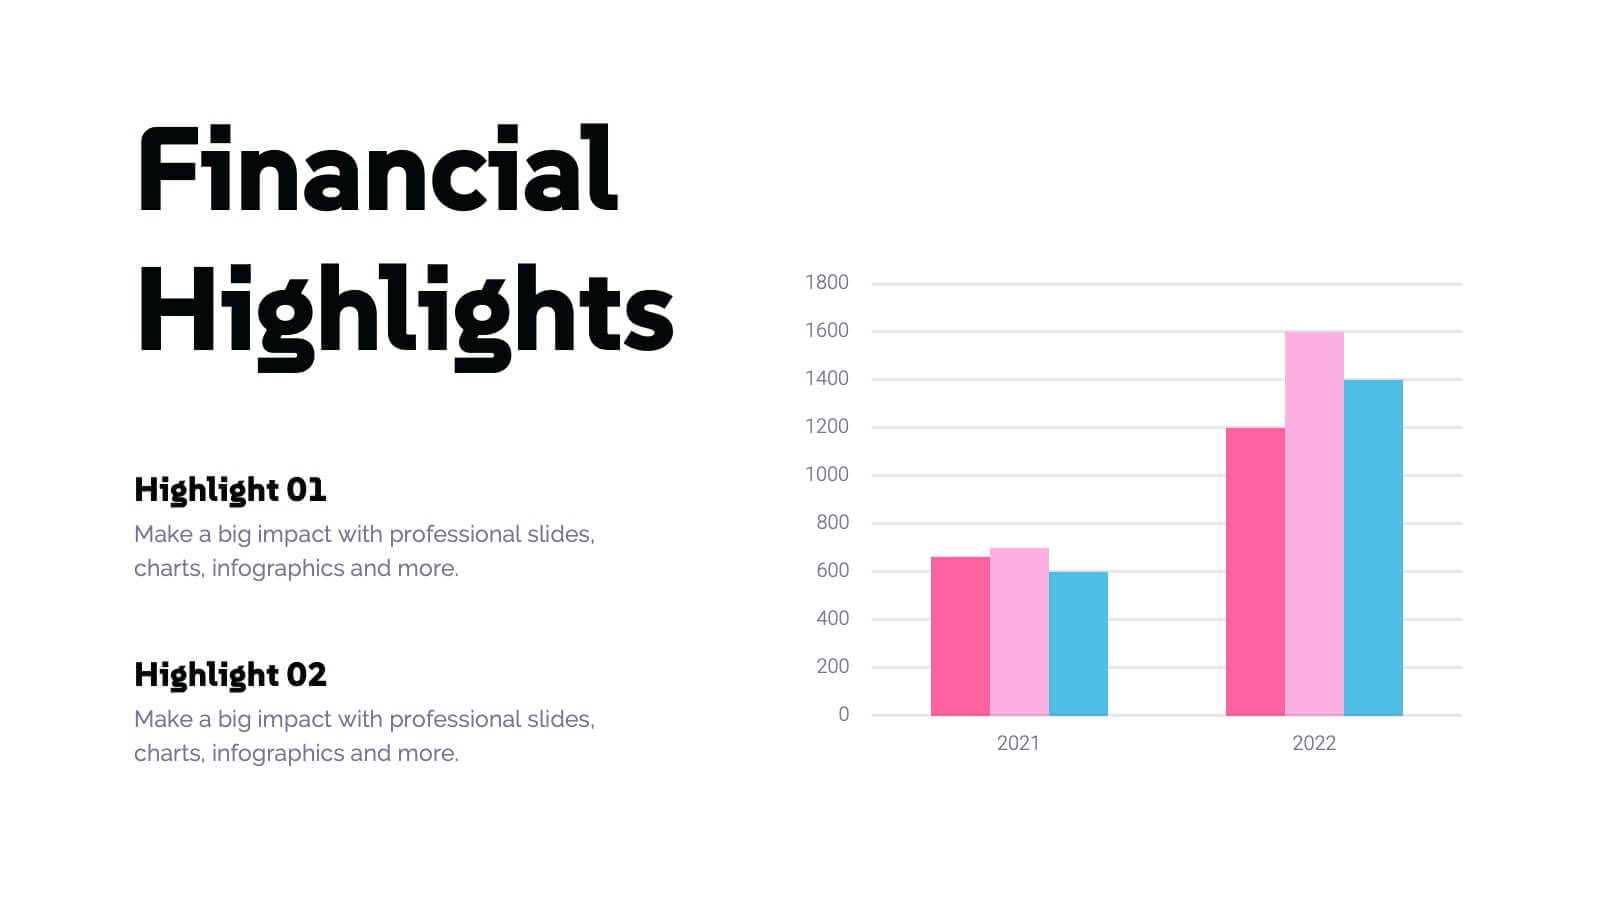
Feedback Collection Strategy Presentation
Engage your audience with a dynamic visual that simplifies how feedback is gathered and turned into meaningful action. This presentation helps illustrate communication loops, data flow, and process improvements with clarity and style. Fully editable and compatible with PowerPoint, Keynote, and Google Slides for seamless customization and professional delivery.


5 diapositivas
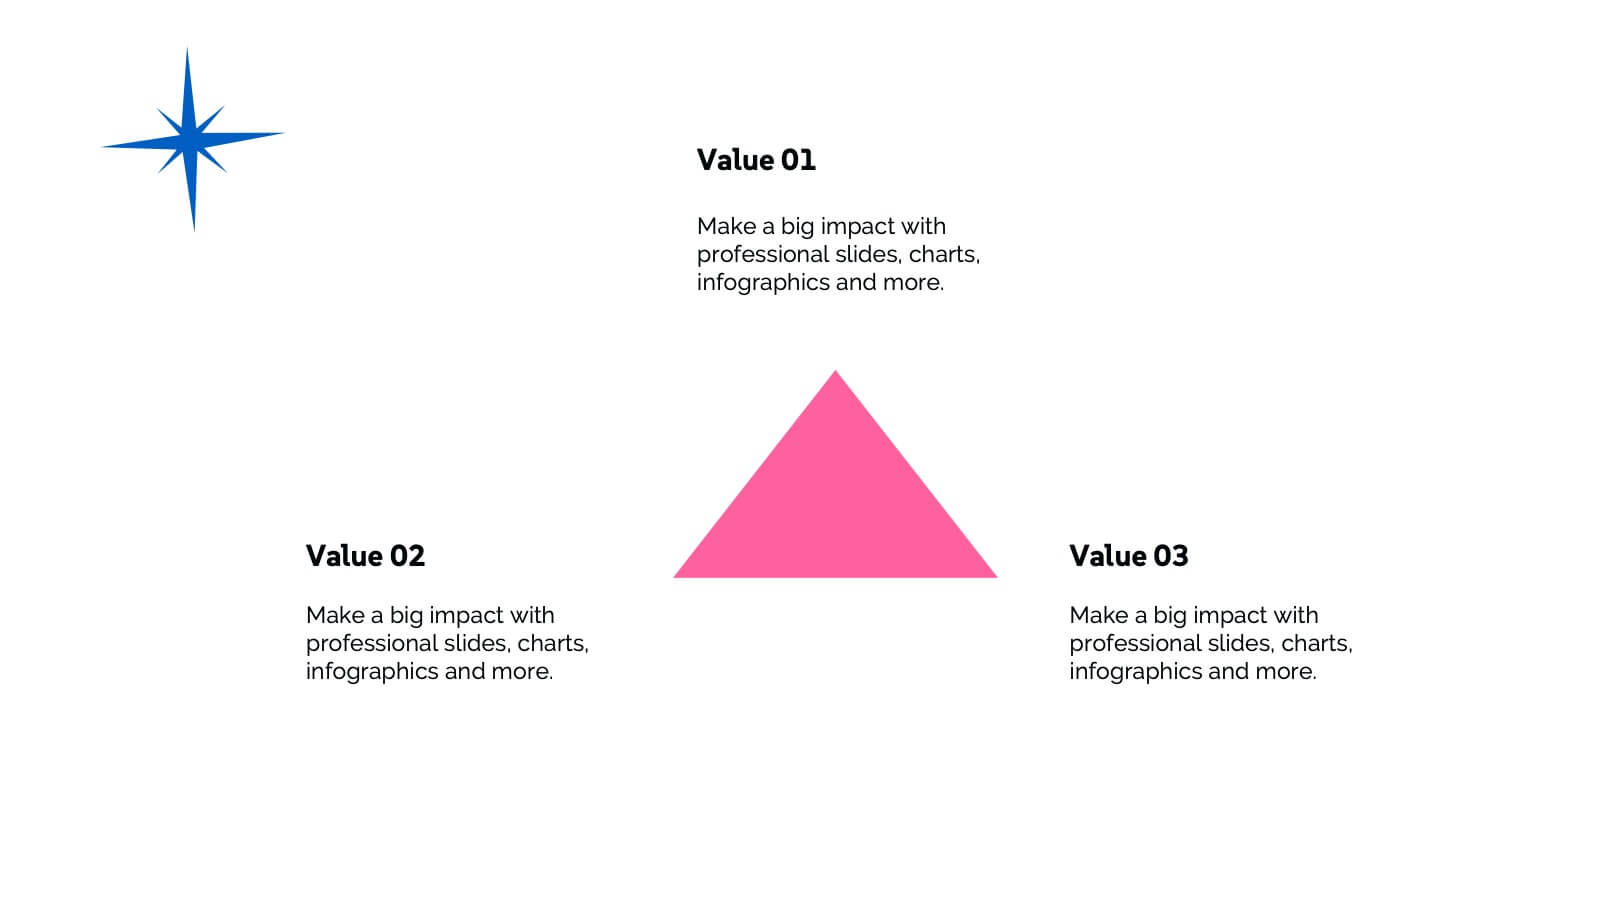
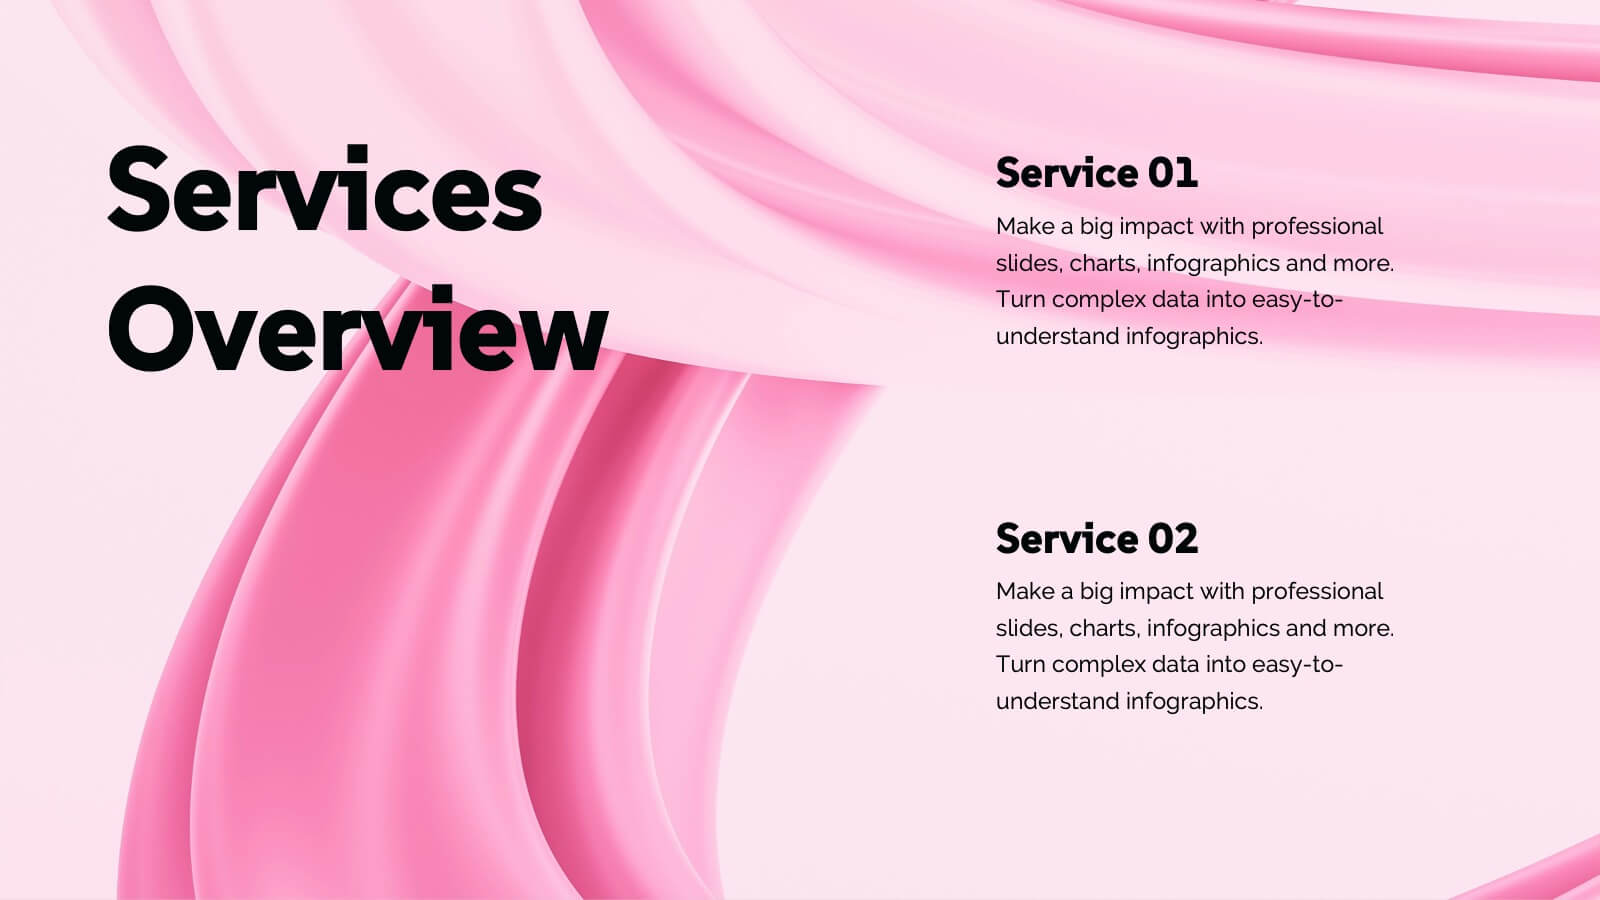
Innovation in Digital Technologies Presentation
Highlight key advancements with this Innovation in Digital Technologies Presentation. Designed with four modern icon segments, this slide helps communicate your digital transformation journey clearly. Ideal for showcasing emerging tools, platforms, or strategies. Fully editable in Canva, PowerPoint, or Google Slides for seamless integration into any tech-focused presentation.


19 diapositivas
Kinetic Sales Forecast Presentation
Forecast your sales with style using this vibrant template! Perfect for detailing company overview, sales process, team, and strategy. Includes sections for case studies, pricing, and future opportunities. Ideal for sales teams to impress stakeholders. Compatible with PowerPoint, Keynote, and Google Slides.


7 diapositivas
Website Mockup Infographic
Enhance your digital presence with this curated collection of website mockup templates, meticulously designed to showcase your online projects with clarity and professional flair. Each template features vibrant layouts that display your website designs on various digital devices, providing a comprehensive view of how your site will look across different platforms. These mockups are crafted with precision, emphasizing the responsive nature of web design and ensuring that your visuals translate beautifully from desktops to mobile devices. The use of bright colors and clear, concise text areas within the mockups makes them both attention-grabbing and informative. Perfect for web designers, developers, or digital marketers, these mockups are essential tools for client presentations, portfolio displays, or marketing pitches. They allow you to demonstrate the functionality and aesthetics of your website effectively, ensuring your digital projects resonate with your target audience.


6 diapositivas
Customer Journey Map Infographic
A customer journey map is a visual representation of the steps and touchpoints that a customer goes through when interacting with a product, service, or brand. This infographic template is designed to illustrate the customer journey and enhance understanding of the customer's experience with a product or service. It offers a comprehensive visualization of the various touchpoints and emotions experienced by customers throughout their interaction. This template illustrates the entire end-to-end experience from the customer's perspective. Each stage is visually represented with icons and brief descriptions to provide a clear understanding of the customer's progression.


6 diapositivas
Closing Summary and Key Takeaways Presentation
Wrap up your presentation with clarity using the Closing Summary and Key Takeaways Presentation. This slide features a semi-circular segmented layout, ideal for highlighting 3–5 final points, action steps, or reflections. Clean, modern, and easy to customize in PowerPoint, Keynote, Google Slides, or Canva—perfect for impactful conclusions.


5 diapositivas
Business SWOT Infographics
Dive deep into organizational analysis with our business SWOT infographics. Crafted in engaging shades of blue and pink, this collection is an essential tool for businesses aiming to uncover their strengths, weaknesses, and threats. This template, brimming with creative graphics and icons, is specifically designed for business strategists, educational instructors, and company executives who are keen to present SWOT analysis with clarity. Compatible with Powerpoint, keynote, and Google Slides. Its vertical, creative styling makes complex information digestible, fostering understanding and strategic thinking in your business planning sessions.


21 diapositivas
Sylvan Research Findings Report Presentation
The Research Findings Report Presentation Template features 21 modern slides designed to highlight key achievements, competitor insights, and actionable recommendations. Perfect for presenting performance metrics, market trends, and team productivity. Fully customizable and compatible with PowerPoint, Keynote, and Google Slides, it ensures clarity and professionalism for business reports and strategy reviews.


26 diapositivas
Sustainable Business Practices Presentation
Present your eco-friendly business approach with this straightforward template that reflects your commitment to sustainability. It's decked with leafy designs and organic textures that naturally convey your green message. From showcasing your leadership to illustrating growth with intuitive graphs, the template makes it simple to share your vision. Perfect for any platform, like PowerPoint or Google Slides, it’s designed to help you communicate big ideas, like reducing carbon footprints or embracing renewable resources, in a way that’s easy for everyone to grasp. Let this template be the backdrop as you chart a course for a sustainable future, making complex concepts like ‘green initiatives’ and ‘sustainable practices’ clear and actionable.


10 diapositivas
4 Stages of Strategic Execution Process Presentation
Clarify your strategy with the 4 Stages of Strategic Execution Process Presentation. This visually layered circle layout walks your audience through each key stage of execution—ideal for planning, operations, and team alignment. Each step is color-coded and fully editable, ensuring your message stays focused. Compatible with PowerPoint, Keynote, Google Slides, and Canva.


26 diapositivas
Home Solar Power System Presentation
Harness the incredible power of the sun and transform your home with our vibrant and detailed presentation on home solar power systems! Discover the benefits and functionalities of solar energy, designed to help you understand how solar panels work, their environmental impact, and cost savings. Our engaging template covers essential topics like installation processes, efficiency comparisons, and maintenance tips. It includes a variety of infographics, charts, and diagrams to illustrate complex information clearly and effectively. Perfect for homeowners, energy consultants, or anyone interested in sustainable living, this template offers a visually appealing and informative guide to adopting solar power. Customize each slide to fit your needs, whether you're presenting to a small group or a large audience. Compatible with PowerPoint, Keynote, and Google Slides, this template ensures a smooth and professional presentation experience. Ideal for showcasing the future of clean energy and encouraging the switch to renewable resources.


8 diapositivas
Data-Driven Market Segmentation
Visualize customer insights with clarity using the Data-Driven Market Segmentation Presentation. This dynamic circular infographic displays four key segments, each with percentage labels and curved connectors pointing to detailed descriptions. Ideal for marketing analysts, product strategists, or data-driven teams aiming to present behavioral, demographic, or purchasing trends. The sleek, radial layout makes comparisons intuitive and engaging. Fully editable in PowerPoint, Keynote, and Google Slides—customize colors, icons, and data points to match your brand and message.


20 diapositivas
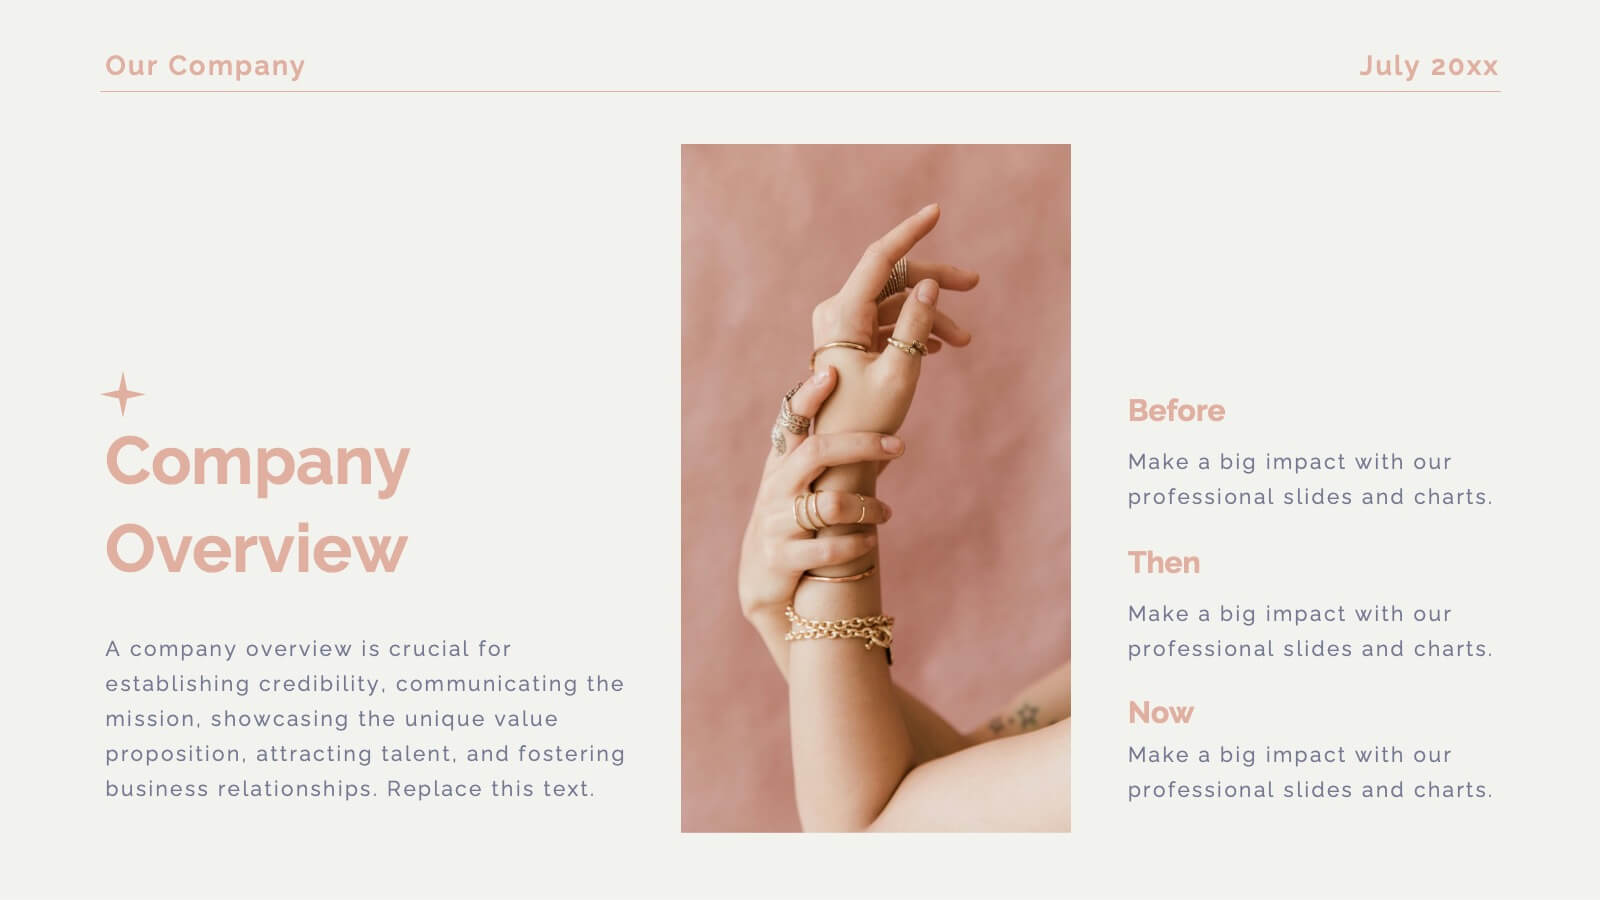
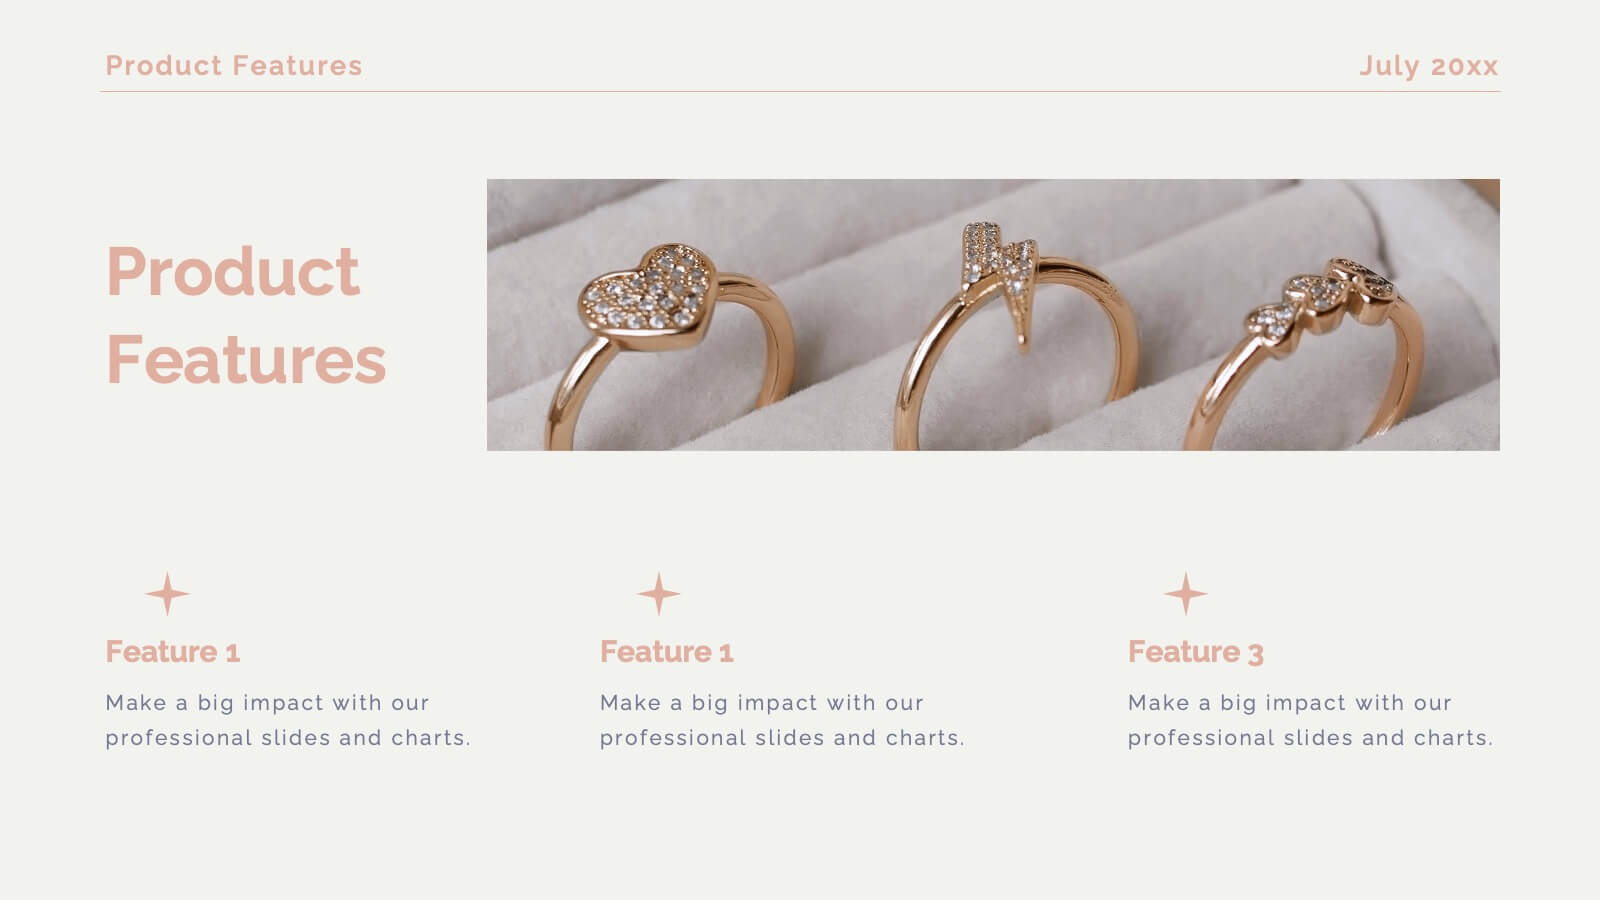
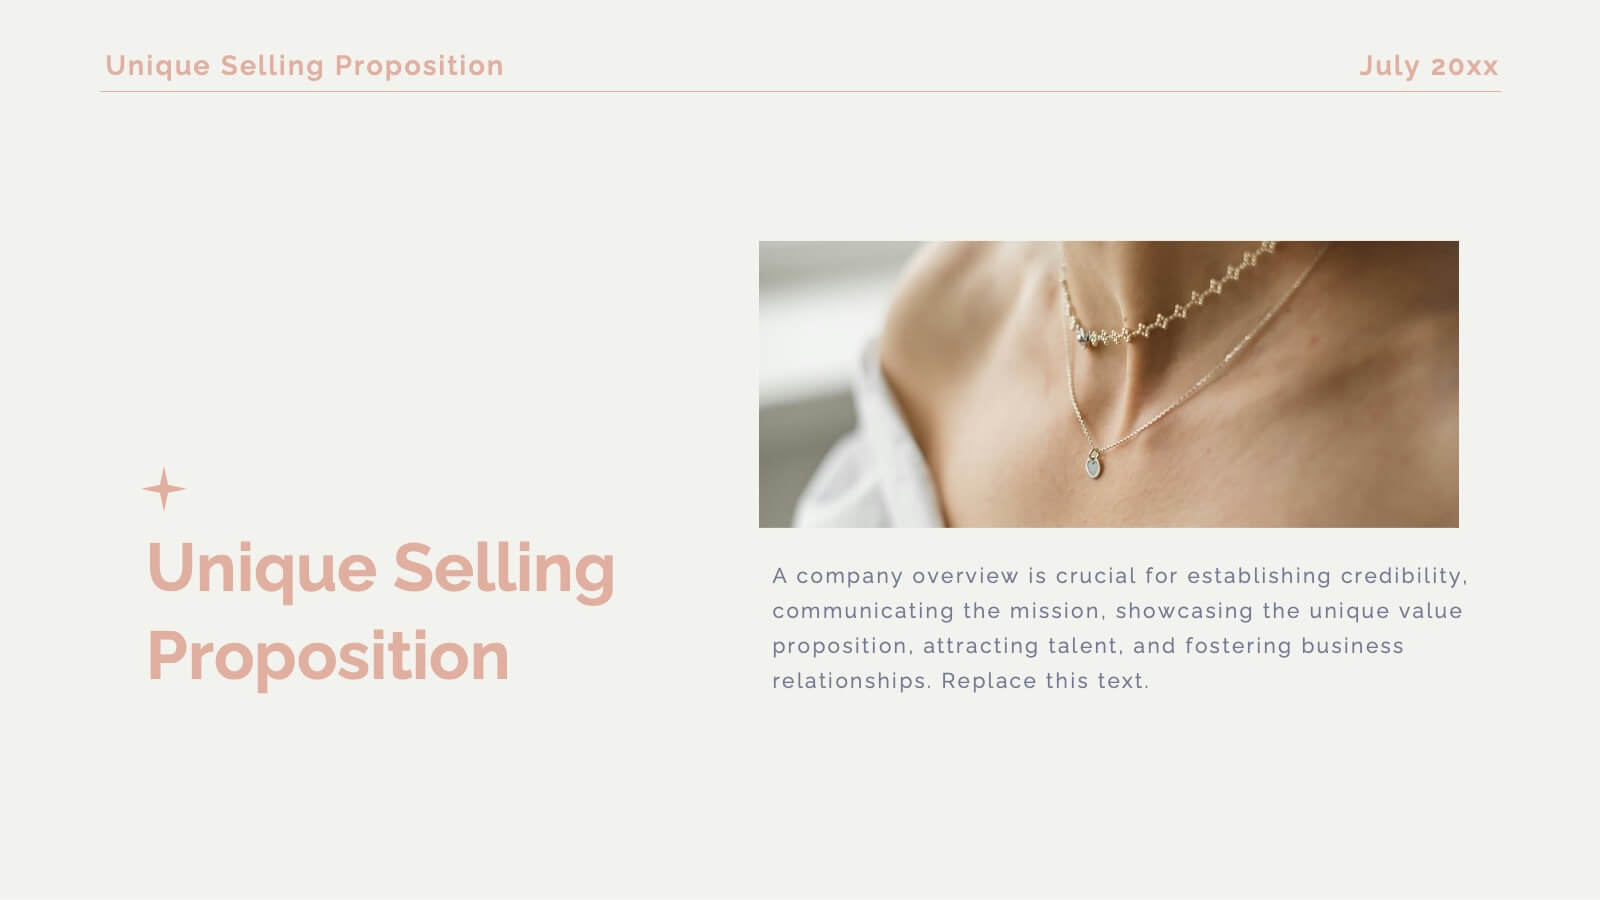
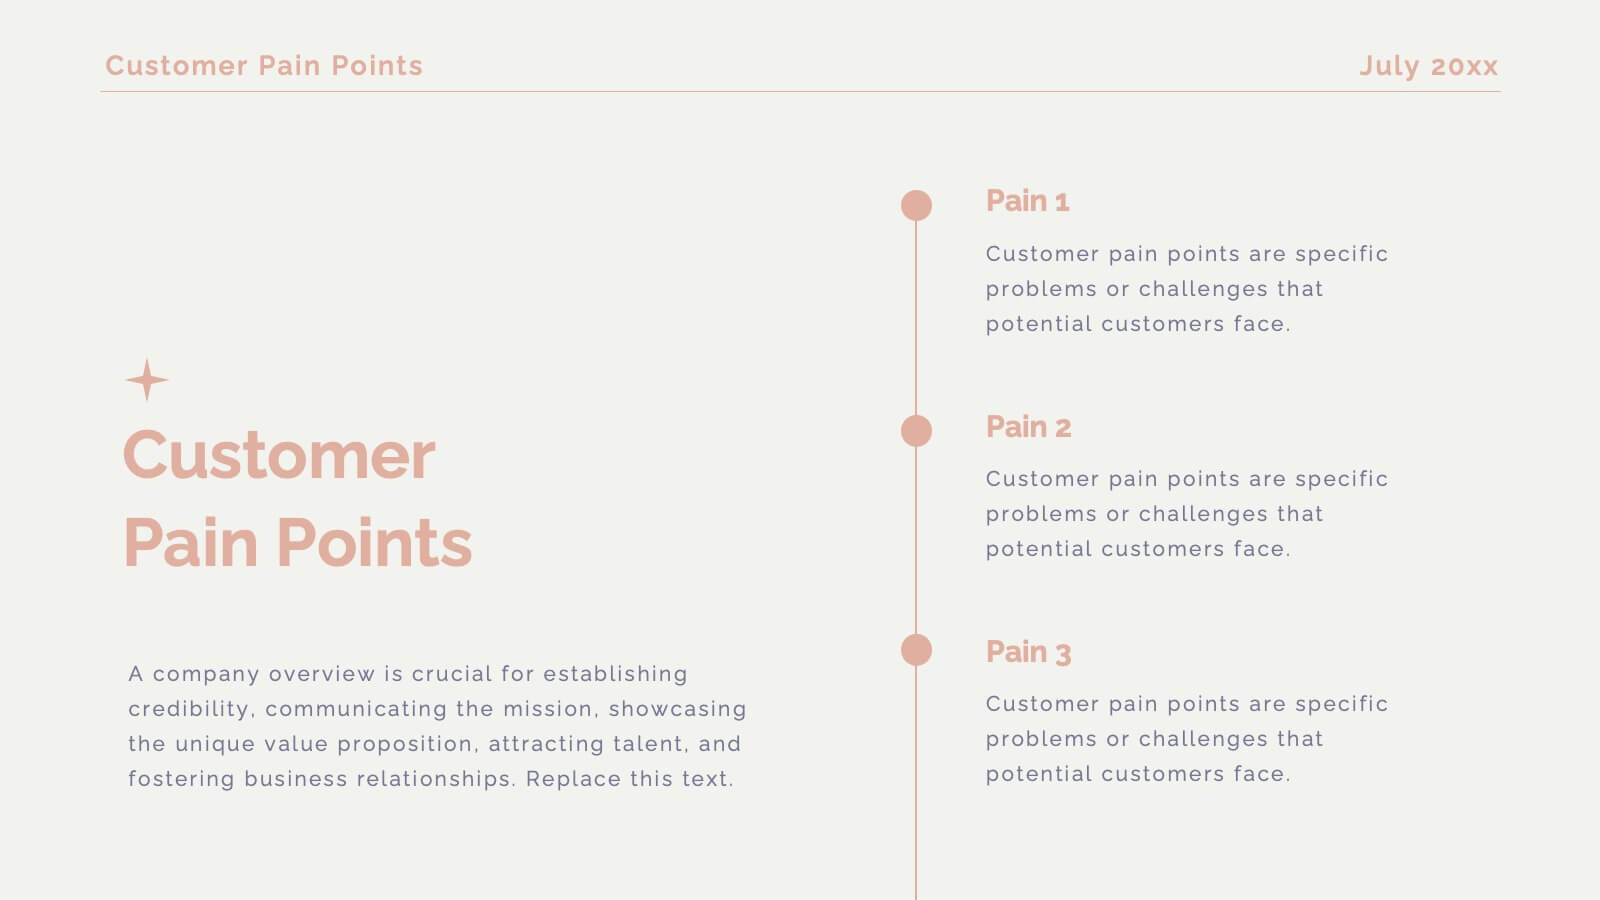
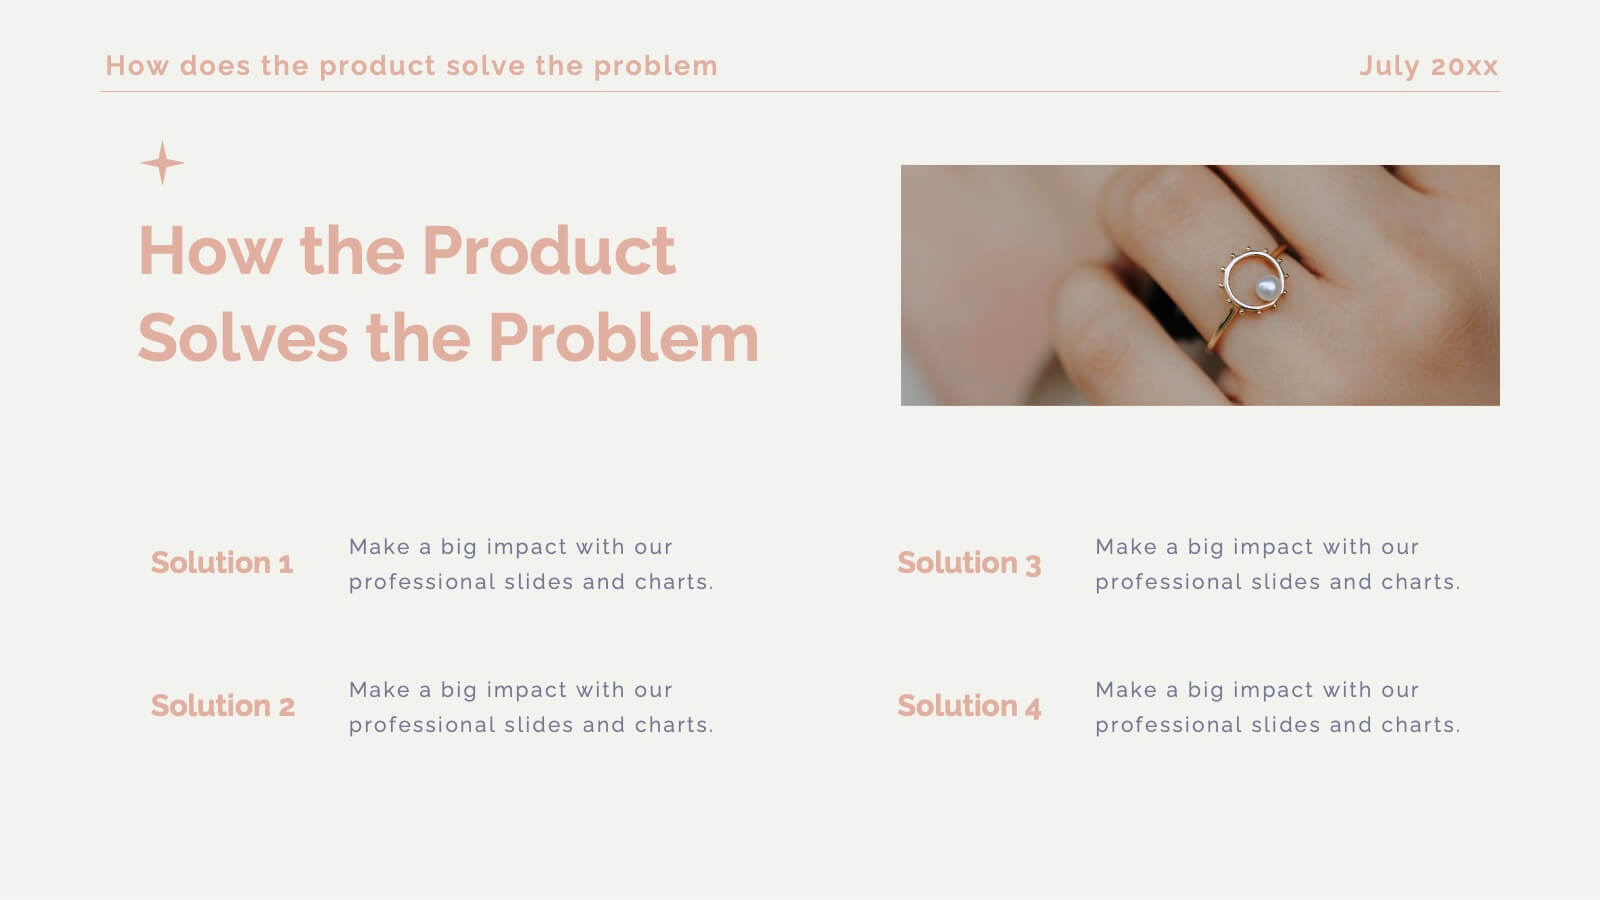
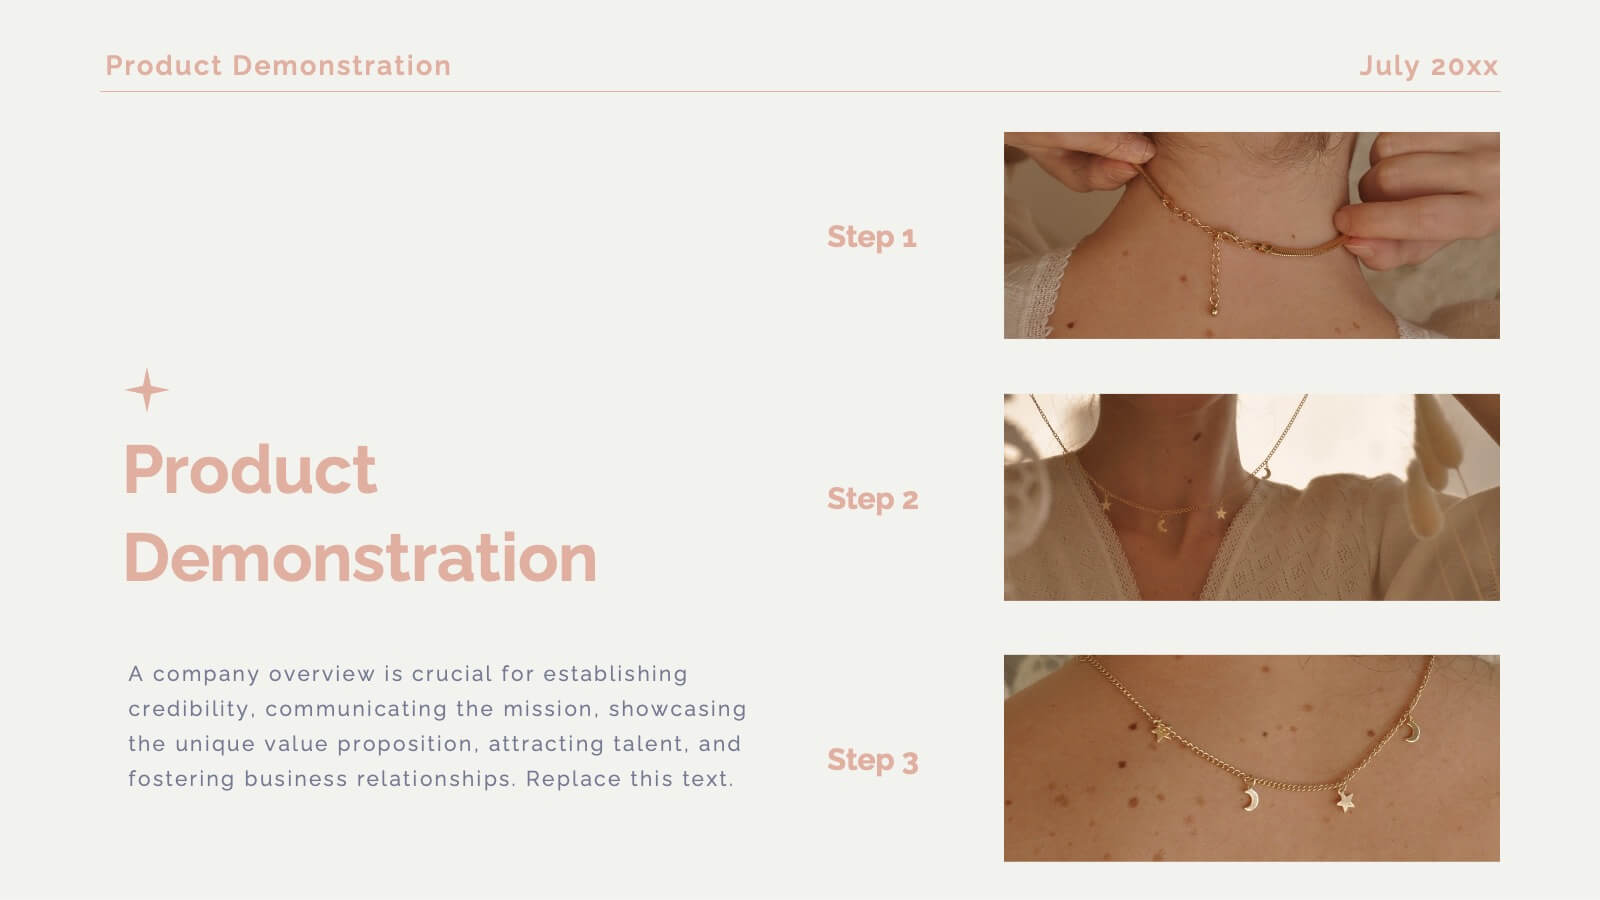
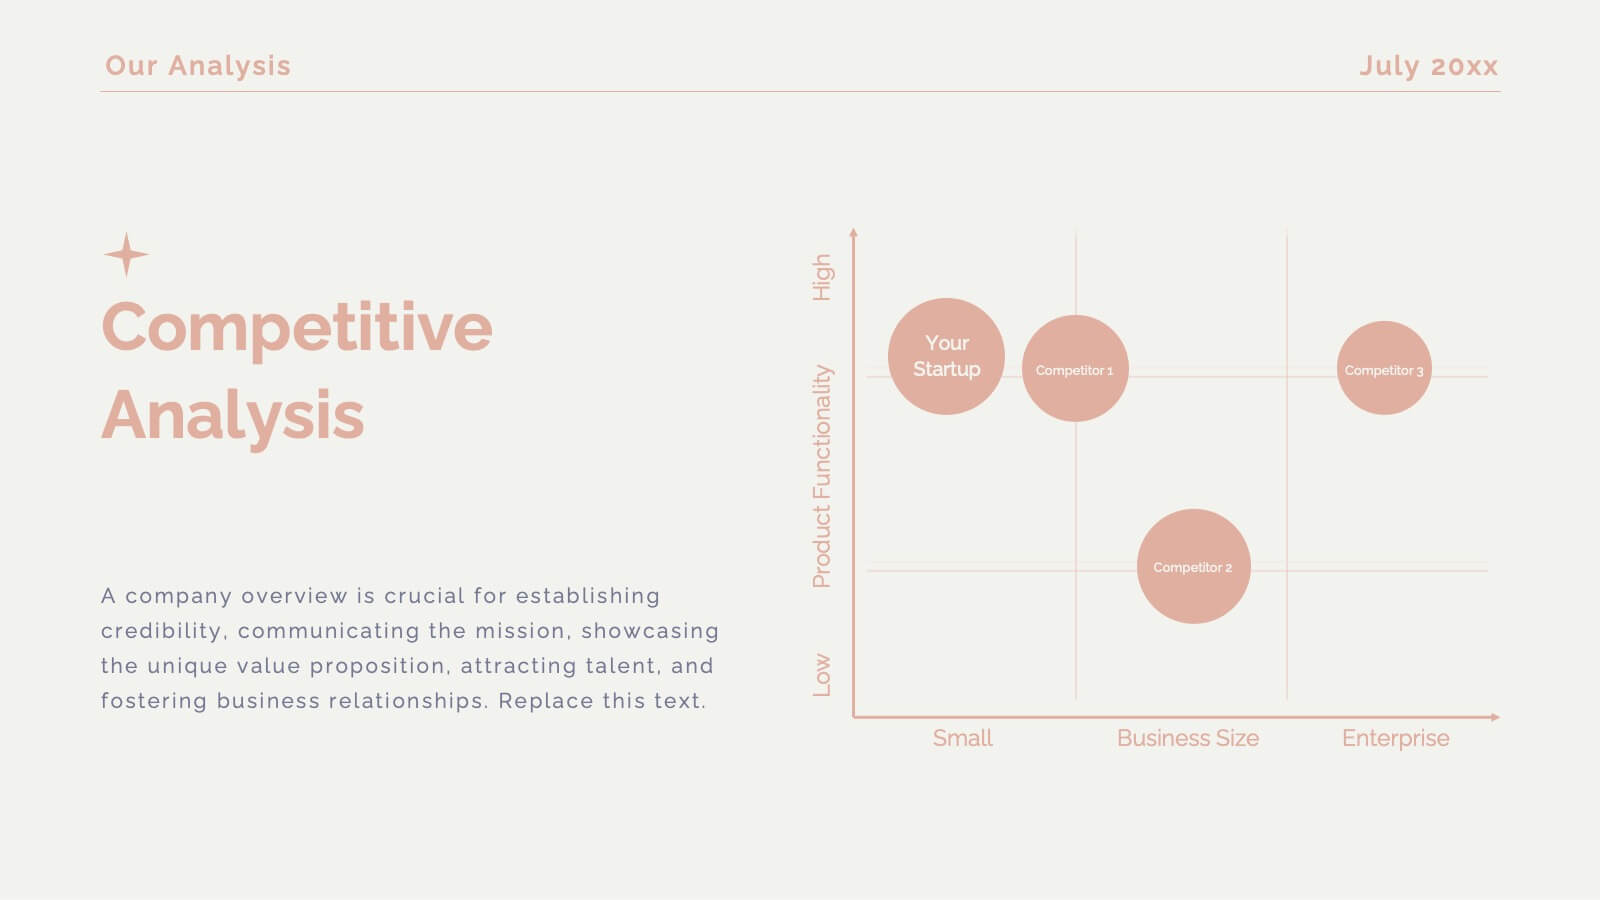
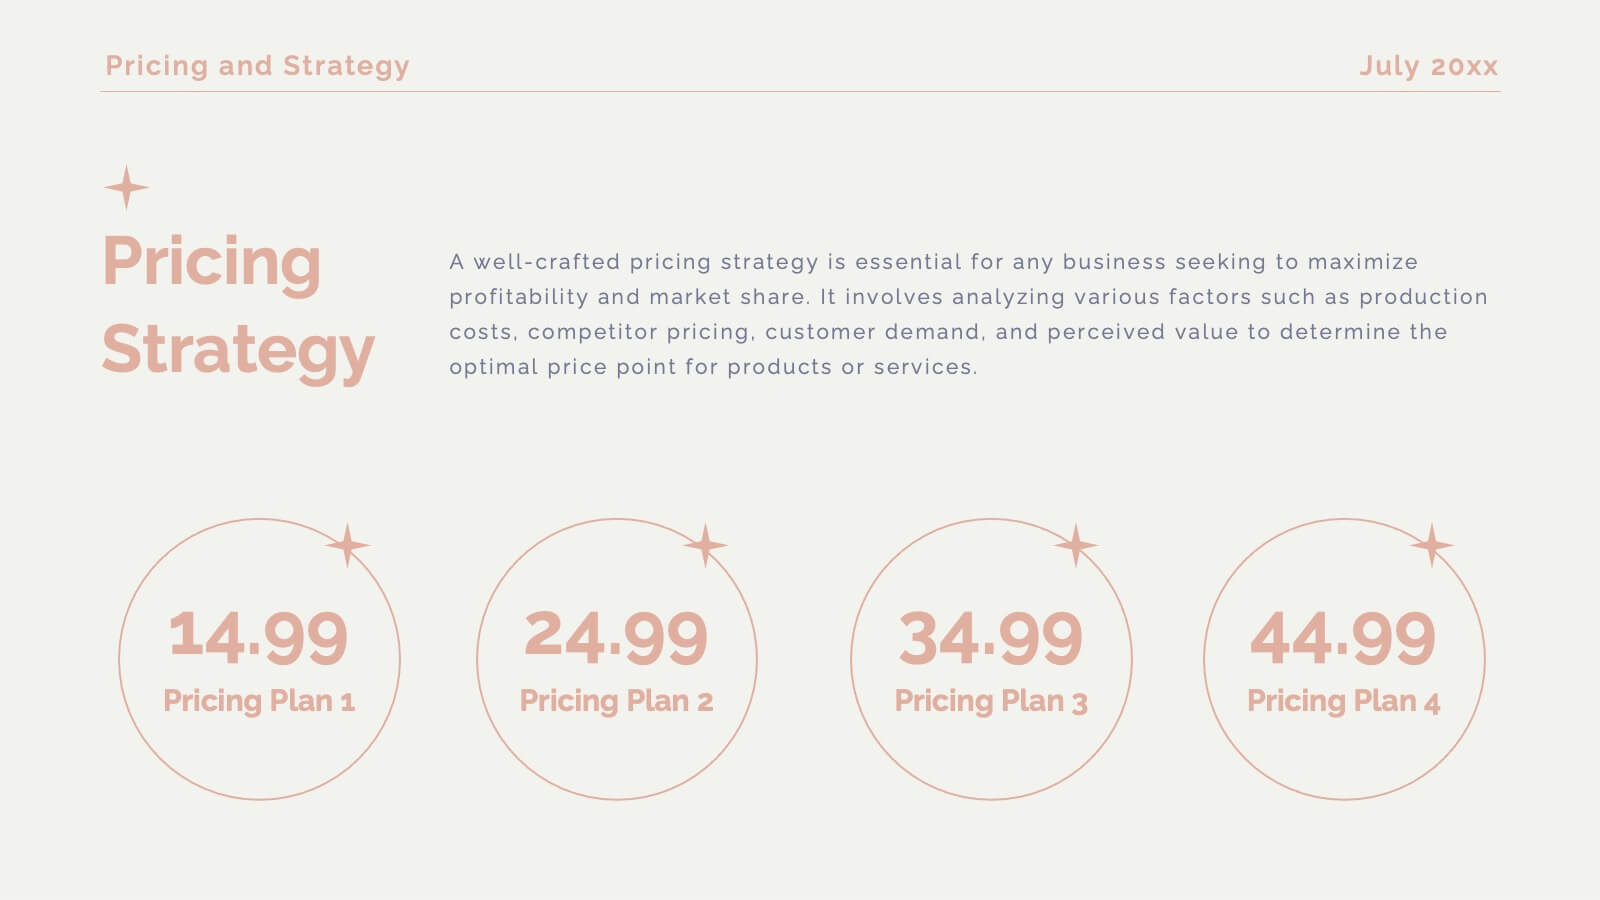
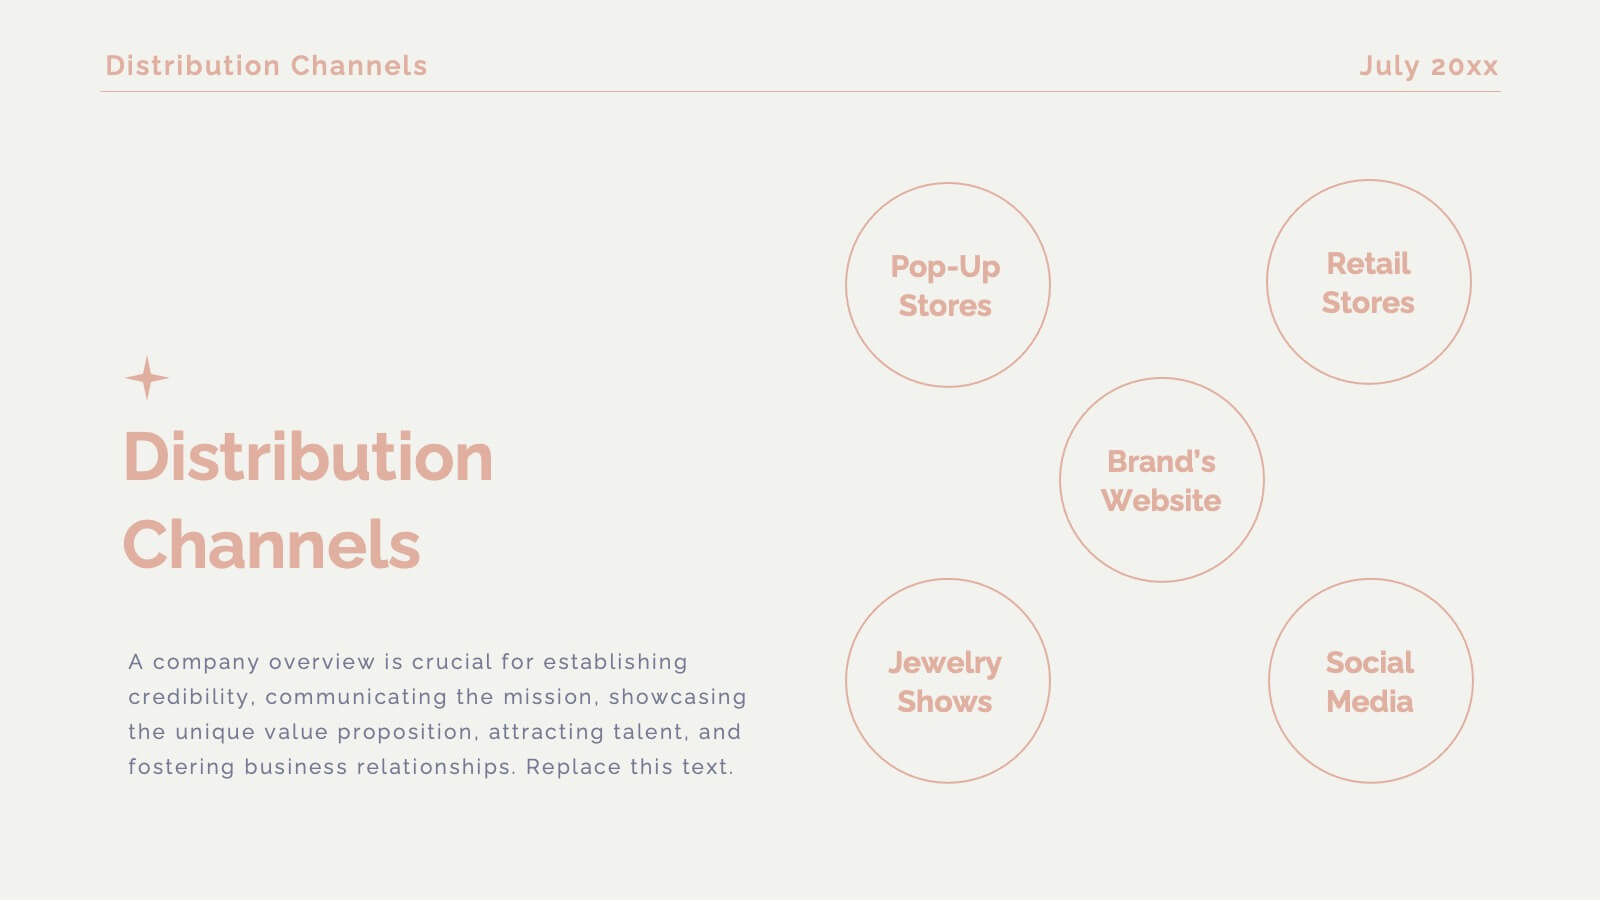
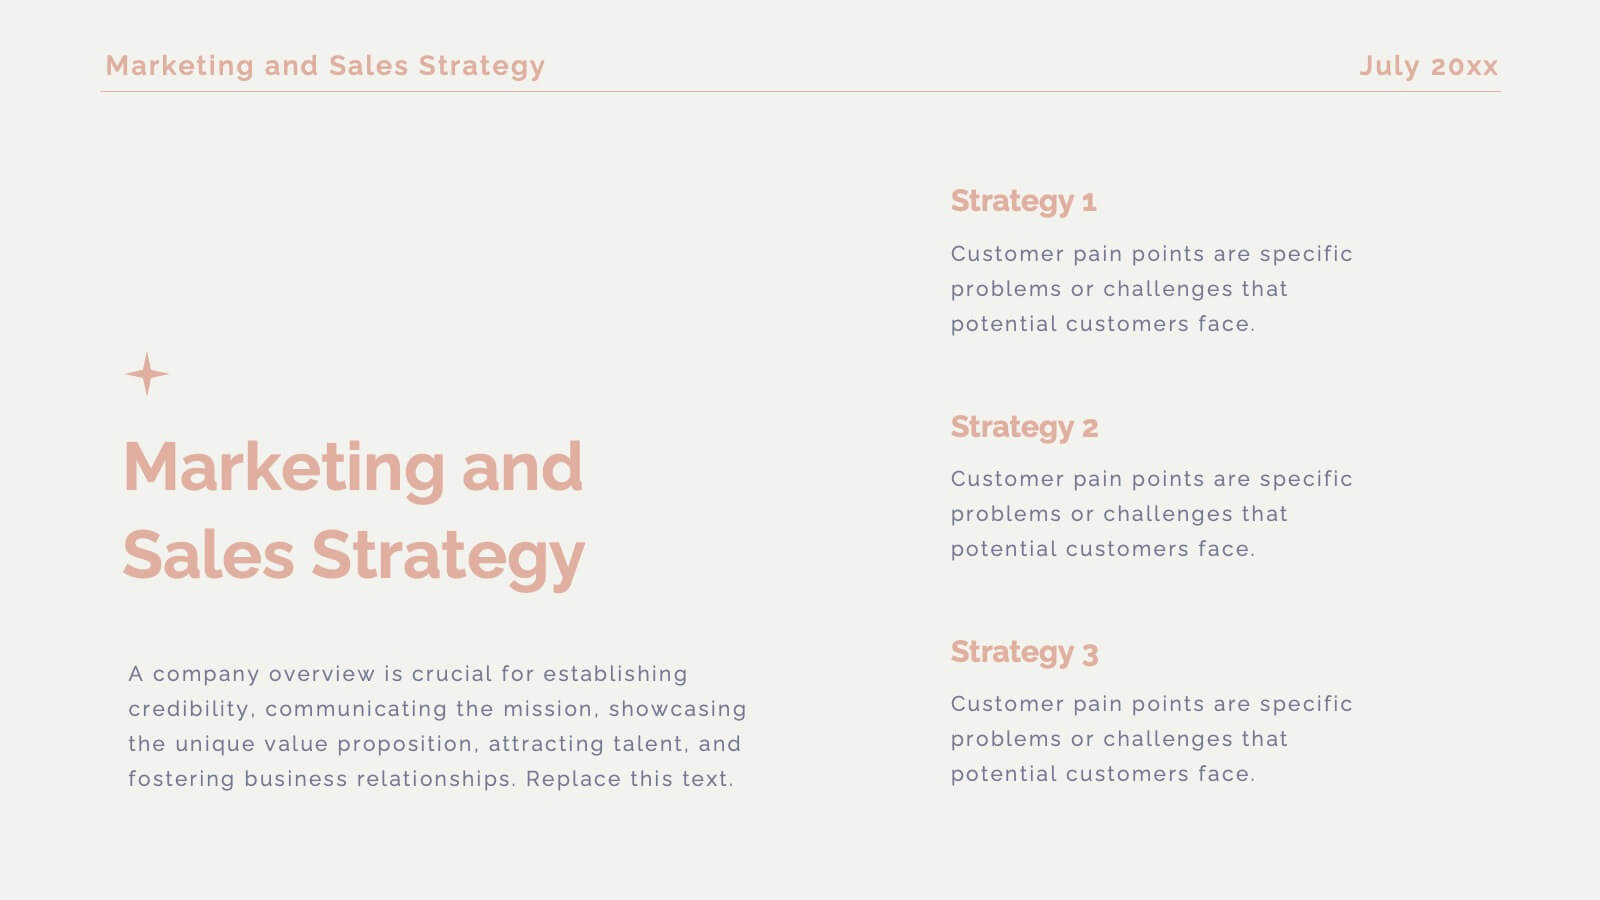
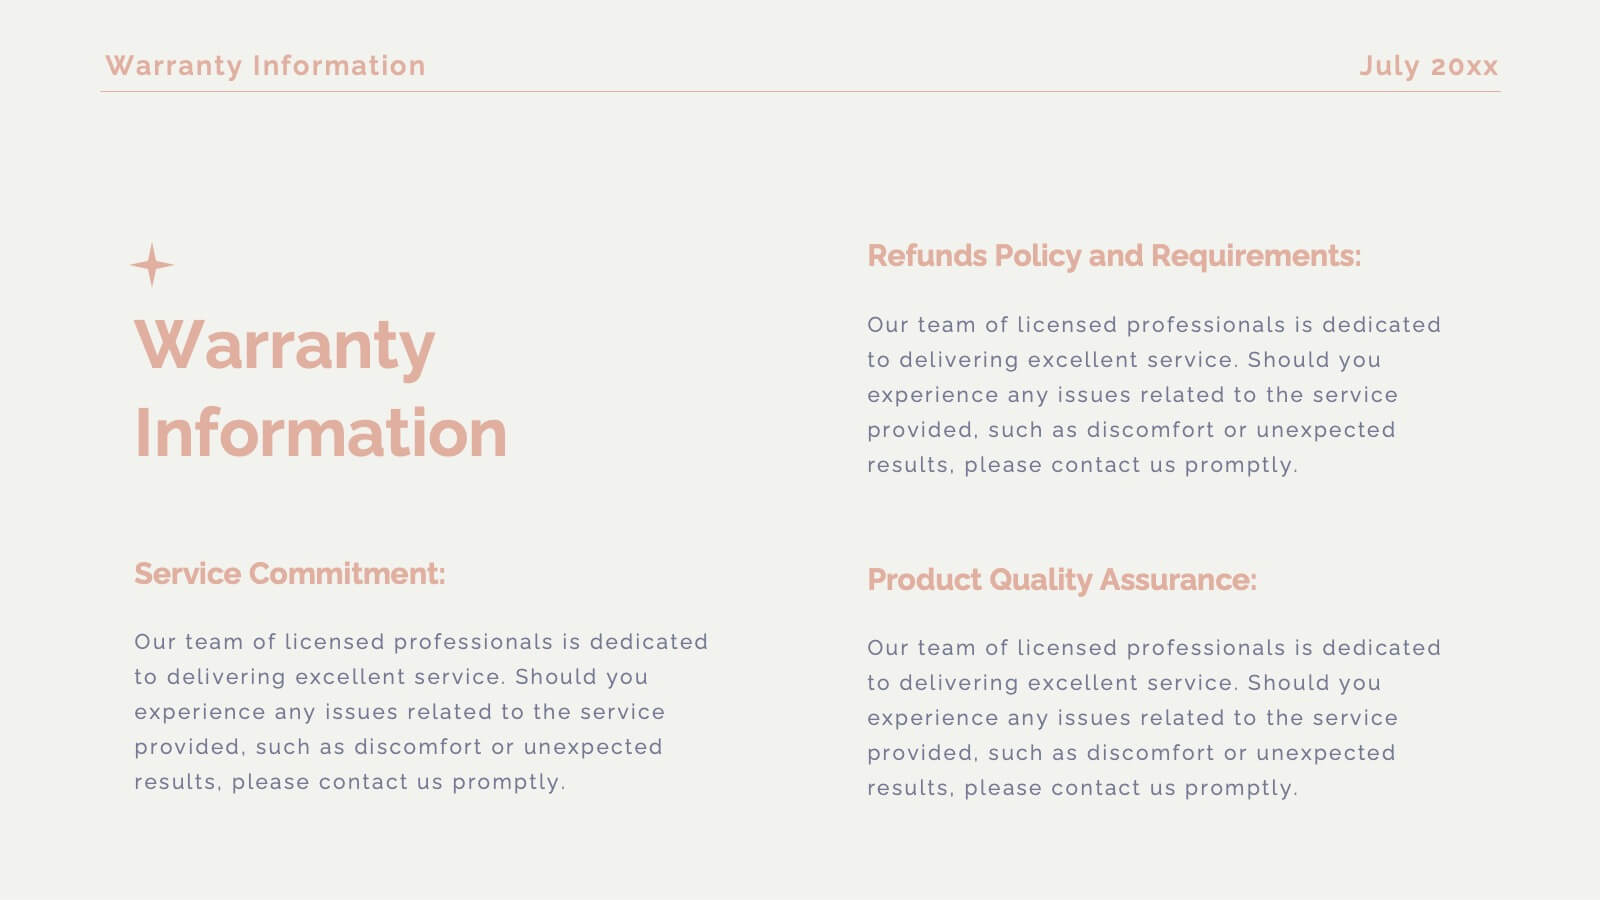
Legacy Product Launch Presentation
Get ready to unveil your product with a stunning and sophisticated launch template designed to captivate and convert! This template offers everything you need to present your product in the most compelling way possible, from an inviting welcome slide to an in-depth company overview that sets the stage for your brand’s story. The sleek design highlights key product features, unique selling propositions, and a thorough competitive analysis that positions your product as the market leader. With sections dedicated to customer pain points, solutions, and a powerful product demonstration, this template ensures your audience understands the value and impact of your offering. It also includes critical details like pricing strategy, distribution channels, and manufacturing processes, giving a full picture of your product’s journey from concept to market. Compatible with PowerPoint, Keynote, and Google Slides, this template is your ultimate tool for a successful product launch that leaves a lasting impression!


2 diapositivas
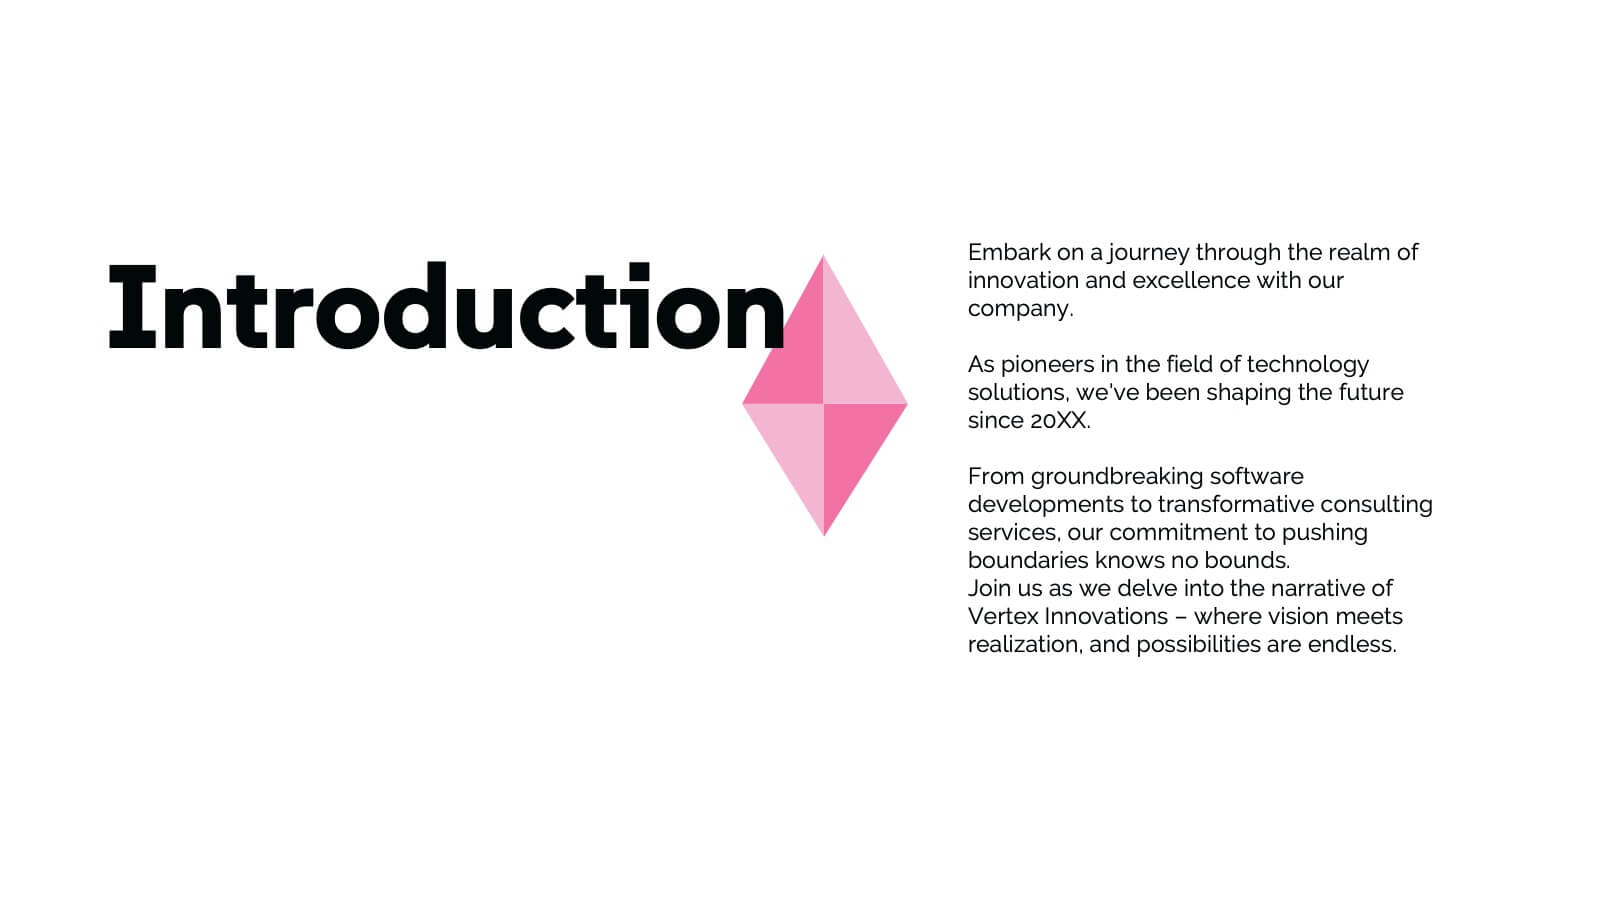
Bold and Minimal Opening Presentation Layout
Make your first slide speak volumes with this bold yet minimal opening layout. Designed to grab attention while keeping things simple, this template helps you introduce your presentation with clarity and confidence. Great for modern business decks, it’s fully customizable and works seamlessly in PowerPoint, Keynote, and Google Slides.


19 diapositivas
Prism Design Strategy Proposal Presentation
Bring your design strategy to life with this modern and stylish presentation template! Perfect for showcasing your design concepts, processes, and elements, this template ensures that your ideas are communicated effectively. With a sleek layout for design briefs, mood boards, prototypes, and project timelines, it's the ideal tool for creative professionals. Customize it easily in PowerPoint, Keynote, or Google Slides to make a lasting impression on your audience.


21 diapositivas
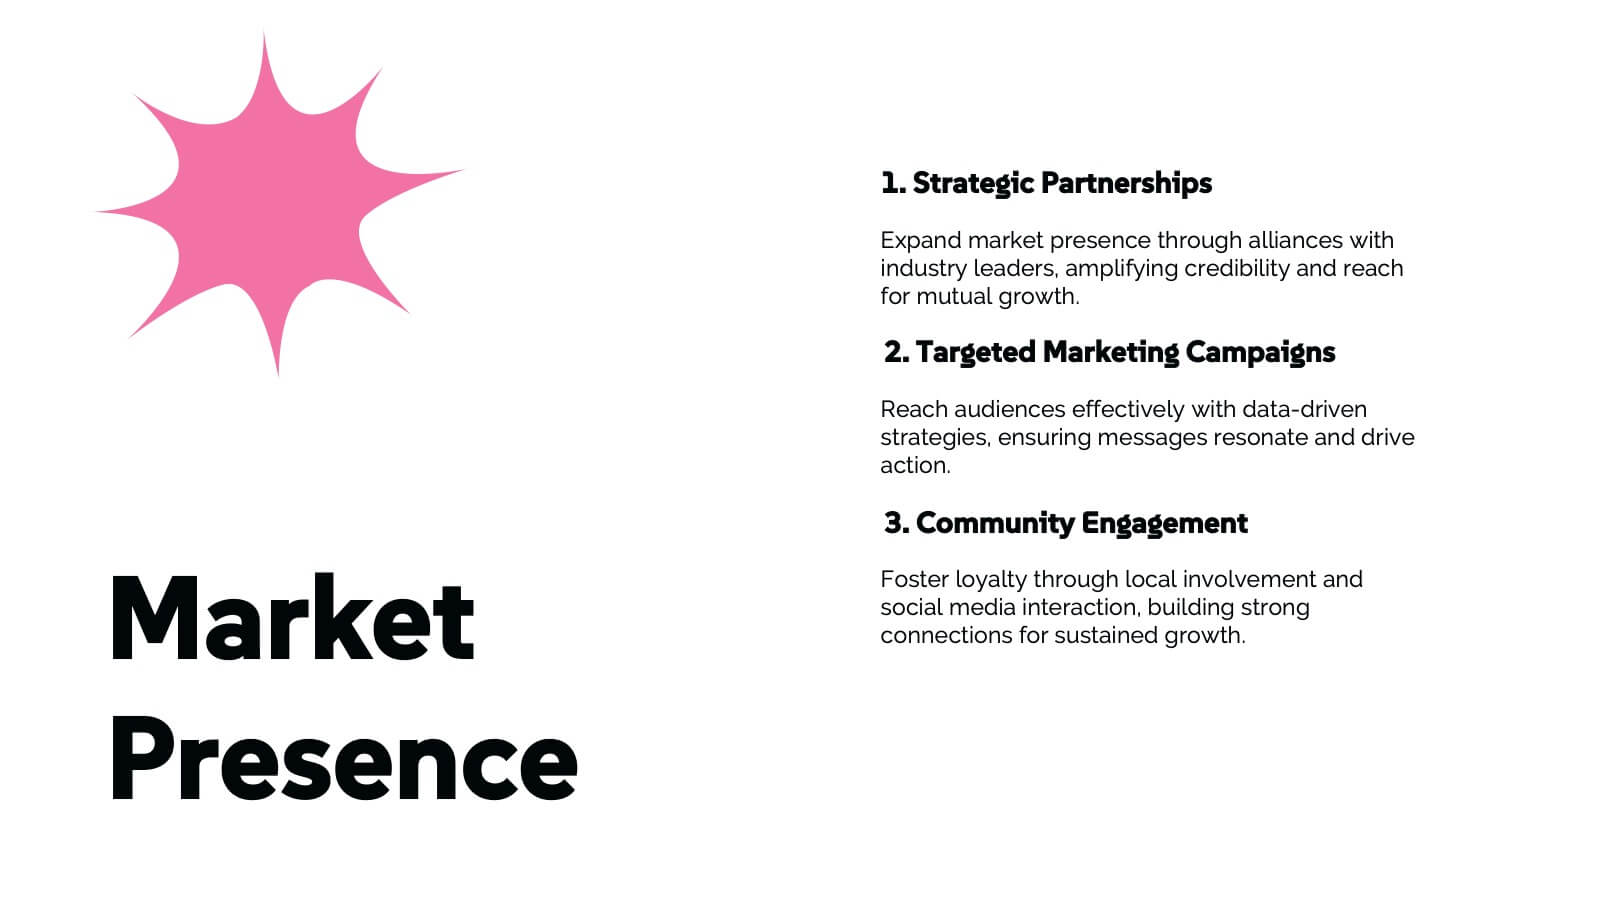
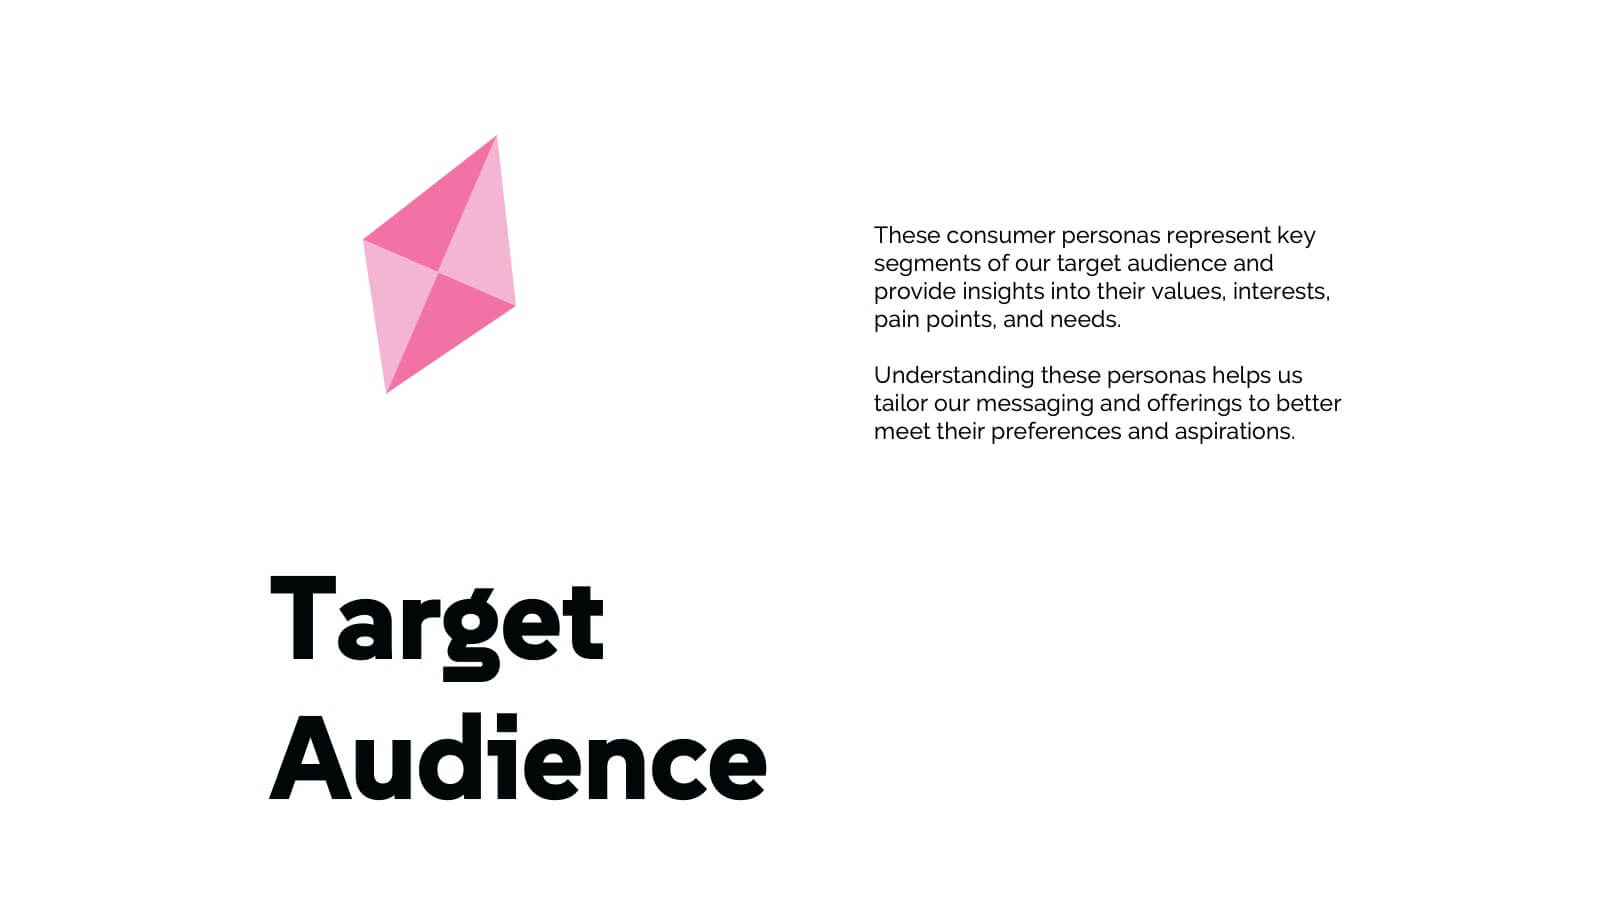
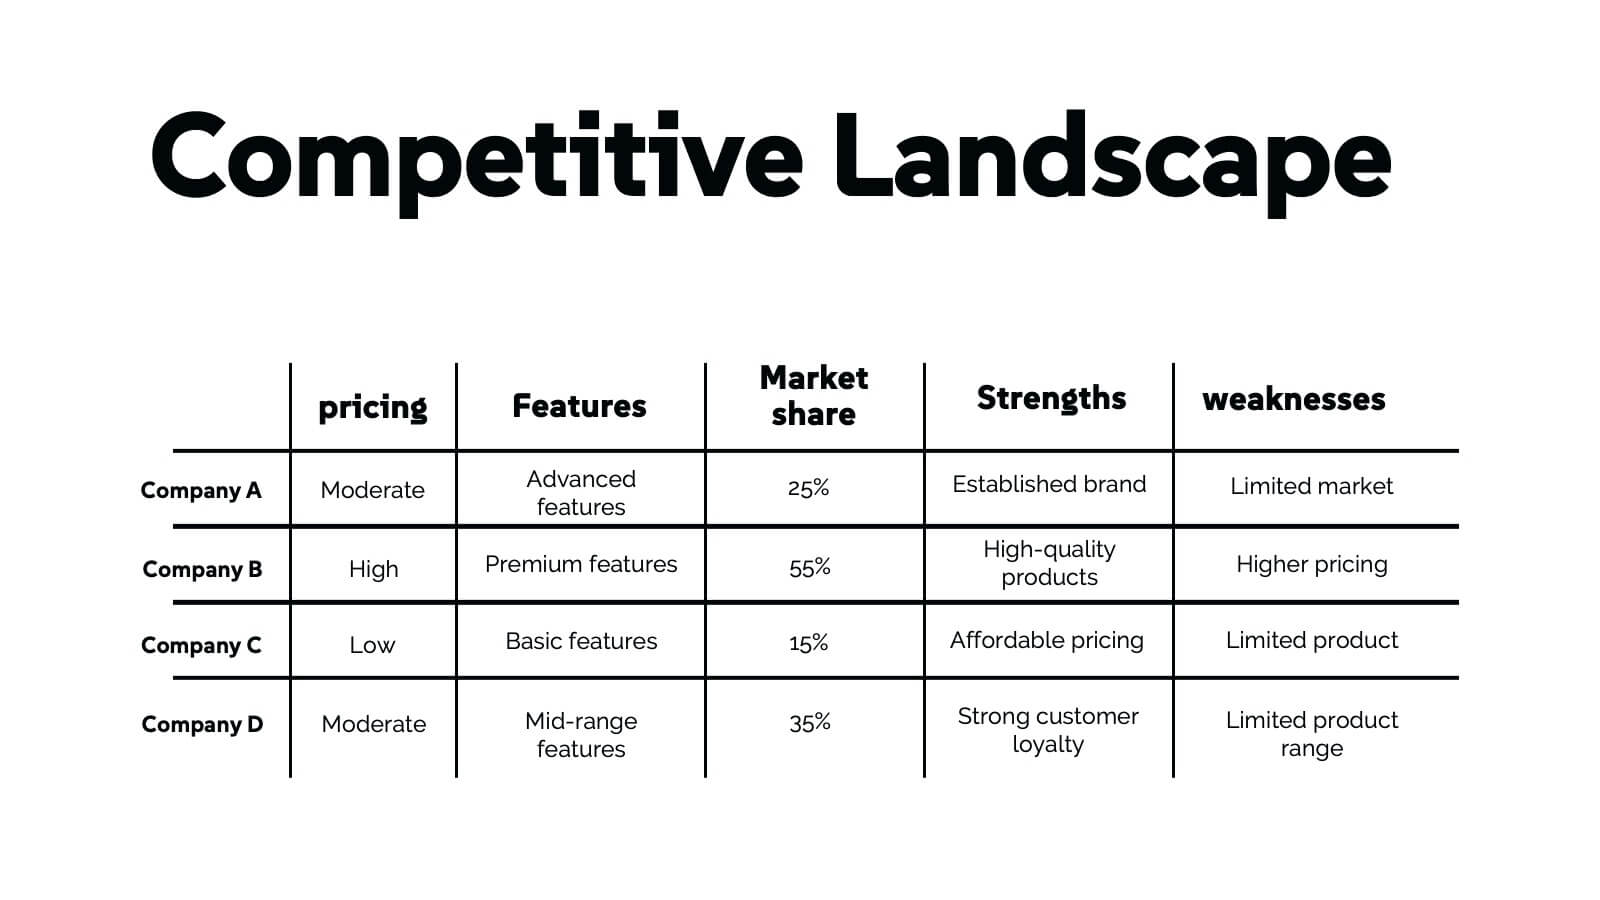
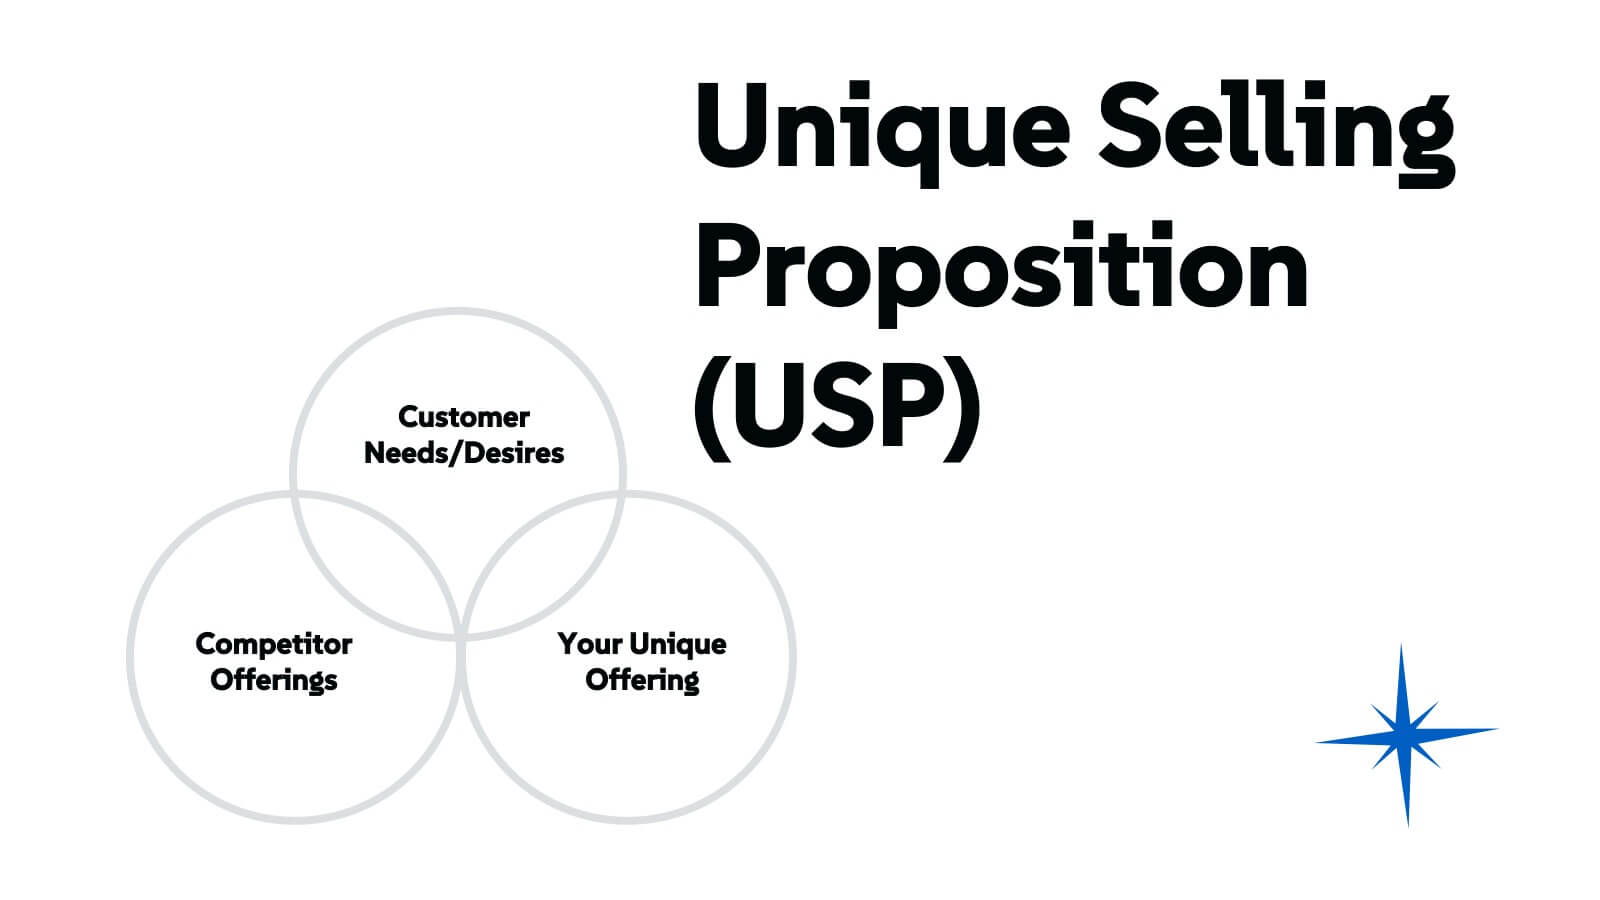
Chimera Marketing Campaign Presentation
Create a visually engaging digital marketing presentation with this modern template! Covering essential topics like company history, market presence, target audience, and competitive landscape, this template helps you showcase your marketing strategies effectively. Fully customizable, it works seamlessly with PowerPoint, Keynote, and Google Slides for professional presentations every time.


6 diapositivas
Gantt Chart Planner Infographic
A Gantt chart is a visual representation of a project schedule that helps in planning, scheduling, and tracking tasks over time. This infographic template is designed to display the timeline of a project, including the start and end dates of tasks, as well as their dependencies and progress. This infographic is ideal for project managers, teams, or individuals who need to communicate project timelines, tasks, and progress in a clear and organized manner. Choose a color scheme that aligns with the project or company's brand identity for a professional look. This is fully customizable and compatible with Powerpoint, Keynote, and Google Slides.