


Características


¿Tienes alguna pregunta?
Recomendar


10 diapositivas
Chronological Event Timeline Presentation
Present events with clarity using this linear timeline slide. Ideal for showcasing project milestones, historical developments, or sequential achievements. Features 5 editable points with icons, titles, and dates for easy customization. Compatible with PowerPoint, Keynote, and Google Slides—perfect for planners, managers, educators, and strategists needing organized time-based visuals.


6 diapositivas
Circle Schedule Infographic
A circle schedule, also known as a radial schedule, is a visual representation of time management that organizes tasks or activities in a circular format. This visually engaging infographic allows you to create a dynamic and intuitive schedule using a circular design. The template offers a creative way to showcase time-based information, such as daily routines, event schedules, project timelines, or weekly agendas. This can be used in various contexts where schedules or timelines need to be visually presented. Fully customizable and compatible with Powerpoint, Keynote, and Google Slides.


6 diapositivas
Medical Technologies Infographics
Explore the forefront of medical technology with this informative and sleek infographic template, tailored for professionals and students in the medical field. This template effectively presents key advancements and projects in medical technology, using a modern and clear design that is easy to follow. The slides are organized to detail different aspects of technology in healthcare, such as innovation in patient care, technological integration into existing systems, and future trends in the industry. Each section uses vibrant graphics and concise text to highlight important data and statistics, ensuring the information is both accessible and engaging. The color scheme is professionally chosen to represent trust and clarity, utilizing shades of blue and red to differentiate topics effectively. This not only enhances readability but also aligns with the themes of healthcare and technology. This template is a perfect tool for presenting at conferences, in educational settings, or during professional meetings where understanding the impact of technology on healthcare is crucial. It helps to convey complex information in a structured and visually appealing manner, making it an invaluable resource for anyone involved in the health technology sector.


7 diapositivas
Empathy Map Marketing Infographics
Gain deeper customer insights with our Empathy Map Marketing Infographic, ideal for marketing teams, product developers, and customer experience strategists. This infographic is a visual tool designed to help you understand your customers' experiences and perspectives. Our Empathy Map Marketing Infographic outlines a clear framework to map out what customers say, think, do, and feel. It's crafted to assist teams in building a customer-centric approach by examining various aspects of the customer journey. With sections dedicated to customer thoughts, emotions, actions, and pain points, you can tailor your marketing strategies to better address customer needs and enhance engagement. This SEO-optimized infographic ensures your marketing plans resonate with your target audience. Implement our infographic in your marketing workshops to foster an empathetic understanding of your customers, driving more personalized and effective marketing campaigns.


6 diapositivas
Network Security and Compliance Presentation
Safeguard your data with clarity and precision using these dynamic visuals. This presentation simplifies network security concepts, showcasing compliance checkpoints, threat zones, and secure access protocols. Ideal for audits, training, or executive briefings. Fully customizable and compatible with PowerPoint, Keynote, and Google Slides—perfect for your next cybersecurity presentation.


26 diapositivas
Navigating Freelance and Flexible Work Presentation
Take control of your career with this insightful presentation on navigating freelance and flexible work. Covering key topics like client management, productivity strategies, income stability, and remote work tools, this template helps you present a clear roadmap to success. Fully customizable and compatible with PowerPoint, Keynote, and Google Slides for a seamless experience.


6 diapositivas
Customer Needs and Segmentation Profile Presentation
Pinpoint what truly drives your audience with the Customer Needs and Segmentation Profile Presentation. This template helps you clearly map customer motivations, preferences, and pain points through segmented icons and visuals. Ideal for marketers and business analysts. Fully editable in Canva, PowerPoint, or Google Slides for easy customization.


6 diapositivas
Pyramid of Needs Strategy Model
Visualize priorities with clarity using the Pyramid of Needs Strategy Model Presentation. This slide presents a five-tier pyramid design, ideal for illustrating hierarchy in strategies, goals, or user needs. Each level includes numbered labels and editable titles with supporting text, making it easy to tailor to your framework. Compatible with PowerPoint, Keynote, and Google Slides.


26 diapositivas
Austin Presentation Template
Sports photography captures the essence of sports and its participants by conveying a strong image. The photographer needs to carefully plan the timing of taking these photos. The Austin Template is perfect for displaying information about your products and services. Vivid and bold colors draw your audience's attention, while the creative sections provide all the relevant details. With an appealing layout and stylish design, you can present yourself in the best light possible. This template will give your site the professional look it deserves, and be sure to stand out to your clients.


26 diapositivas
Personal Finance Management Presentation
Dive into the essentials of personal finance management with this comprehensive presentation template designed to empower individuals to achieve financial stability and growth. The template begins with an introduction that outlines the importance of effective financial management and the objectives of the presentation. It serves as a roadmap for those seeking to understand and enhance their financial literacy. In the main content section, the template offers detailed slides covering a variety of topics crucial for managing personal finances, such as budgeting strategies, savings plans, investment options, and debt management. Each slide is designed with clarity and focus, using engaging visuals and concise bullet points to explain complex financial concepts in an accessible manner. Features like comparison slides, process infographics, and timeline visuals help illustrate the progression and impact of good financial practices over time. The final segment ensures the presentation is practical for all users by confirming compatibility with popular platforms like PowerPoint, Google Slides, and Keynote. This ensures that the template can be easily accessed and utilized across different devices and settings, making it a versatile tool for individuals, financial advisors, or educational workshops looking to promote sound financial habits.


7 diapositivas
Important Stats and Metrics by Numbers Presentation
Display key metrics with impact using this modern numeric infographic layout. Ideal for summarizing performance statistics, benchmarks, or data highlights across six categories. The circular markers and bold percentages enhance readability and focus. Fully editable in Canva—perfect for business reviews, investor decks, or analytical presentations that demand clarity.


20 diapositivas
Egeria Artist Portfolio Presentation
Showcase your artistry with this vibrant portfolio template, featuring sections for project displays, creative process, awards, and testimonials. Perfect for artists seeking a polished presentation of their work. Customizable and suitable for PowerPoint, Keynote, and Google Slides, this template highlights your unique style and professional journey.


7 diapositivas
Enterprise Sales Infographic
Enterprise sales, often referred to as B2B (business-to-business) sales, involves selling products or services to larger organizations and enterprises. Prepare for an exhilarating journey through our sales infographic - a high-energy presentation designed to fuel your enterprise sales like never before. Illuminate the path to a seamless customer experience, leading to a galaxy of satisfaction. This infographic is fully customizable and compatible with Powerpoint, Keynote, and Google Slides. This template isn't just a sales roadmap; it's a launchpad to your unparalleled success!

22 diapositivas
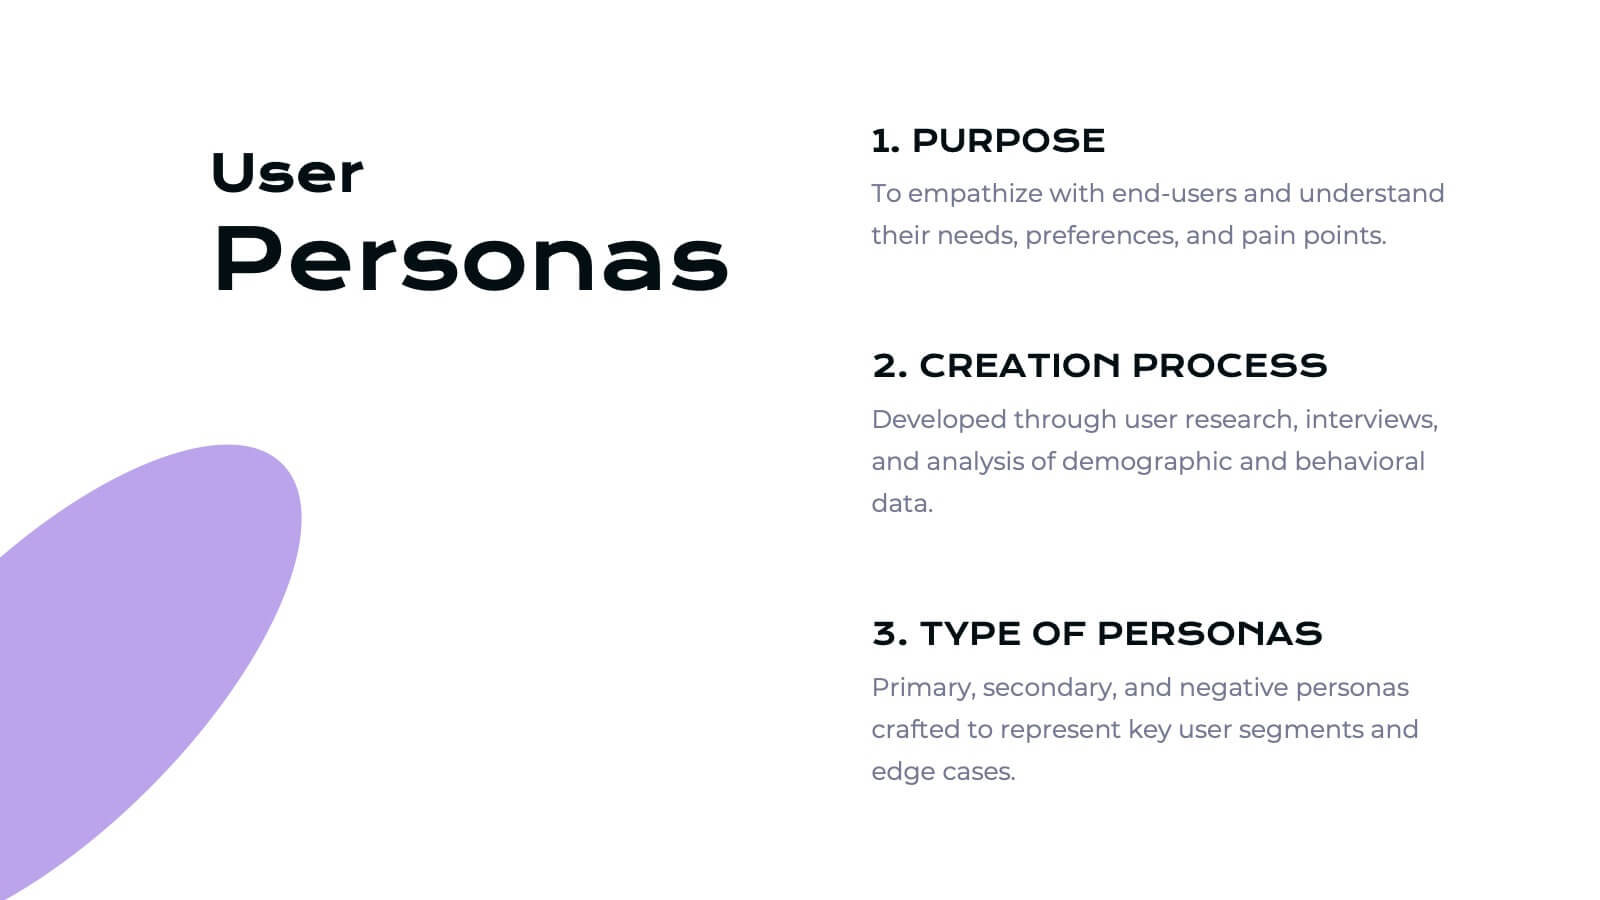
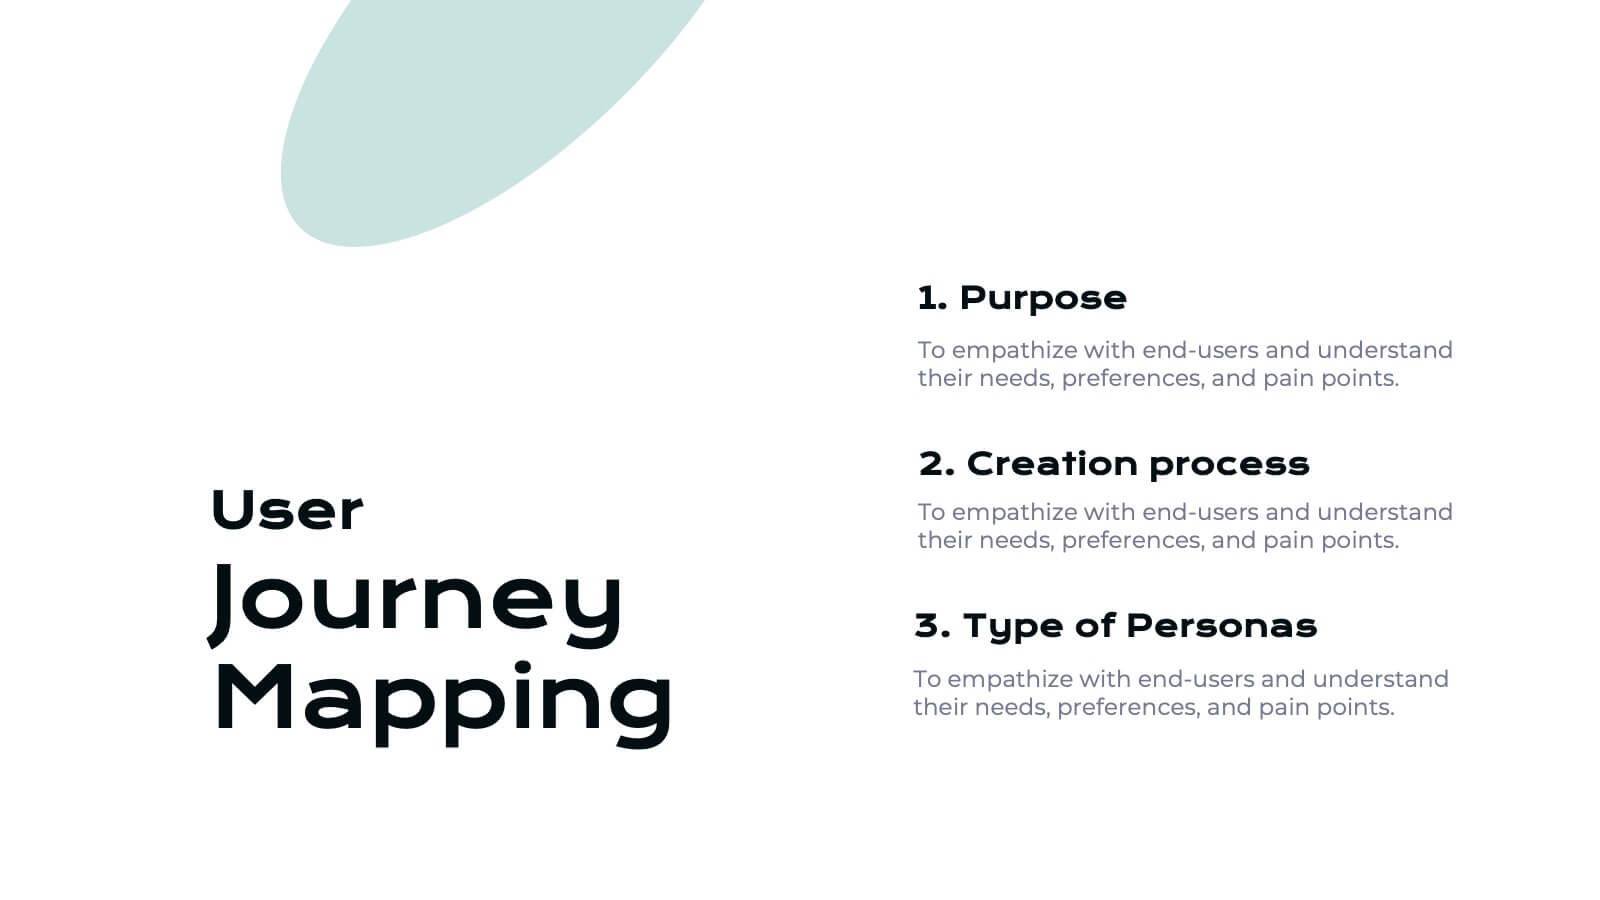
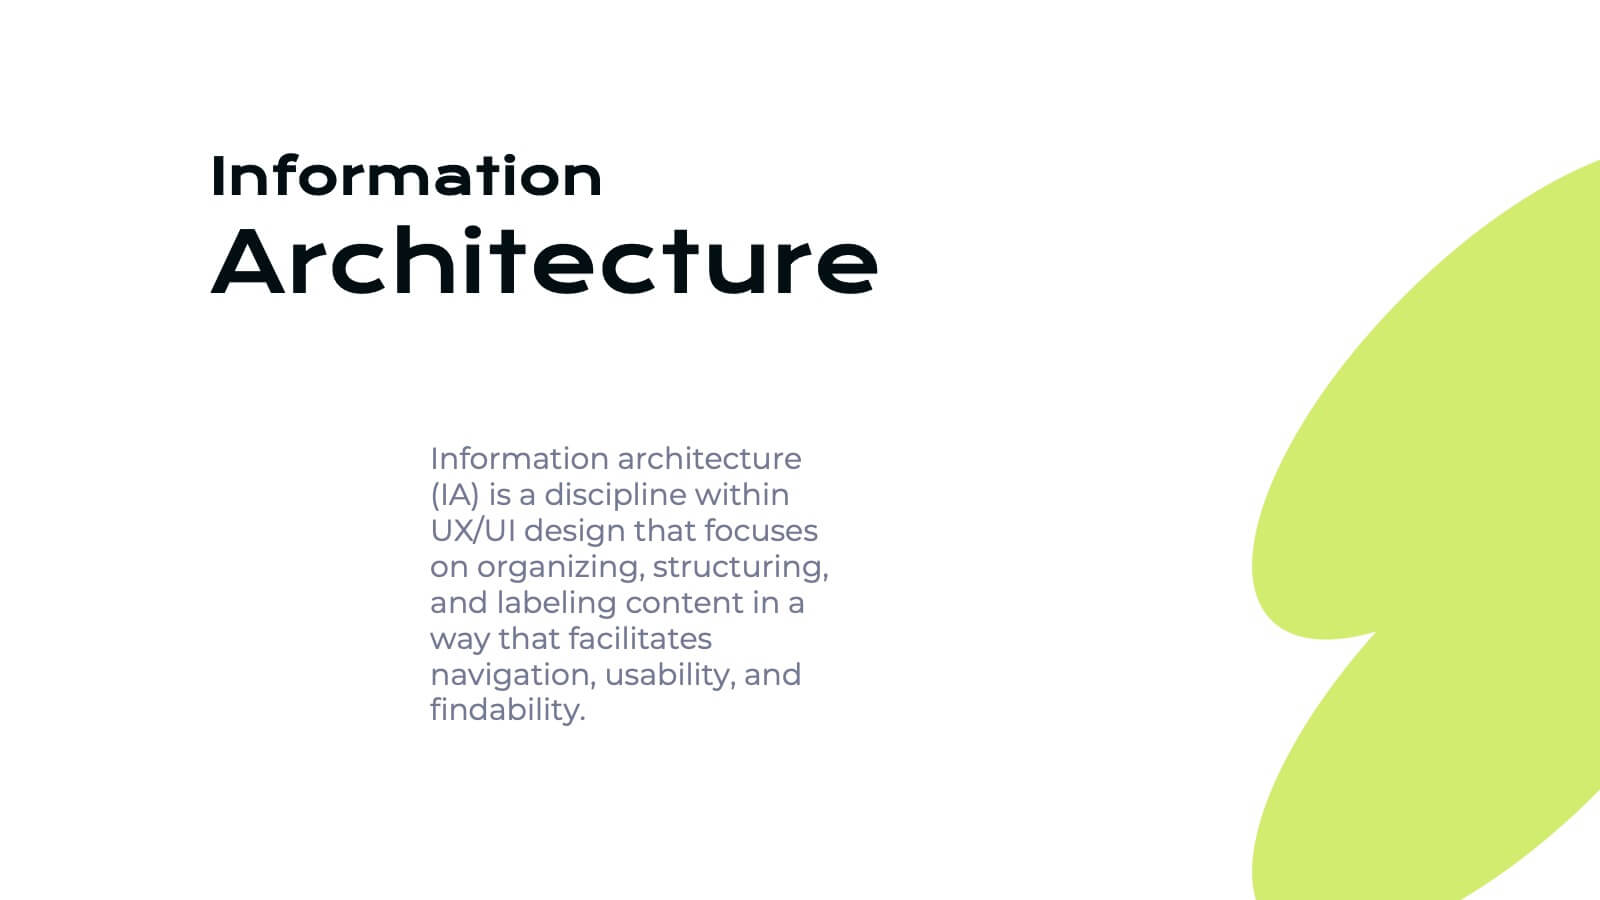
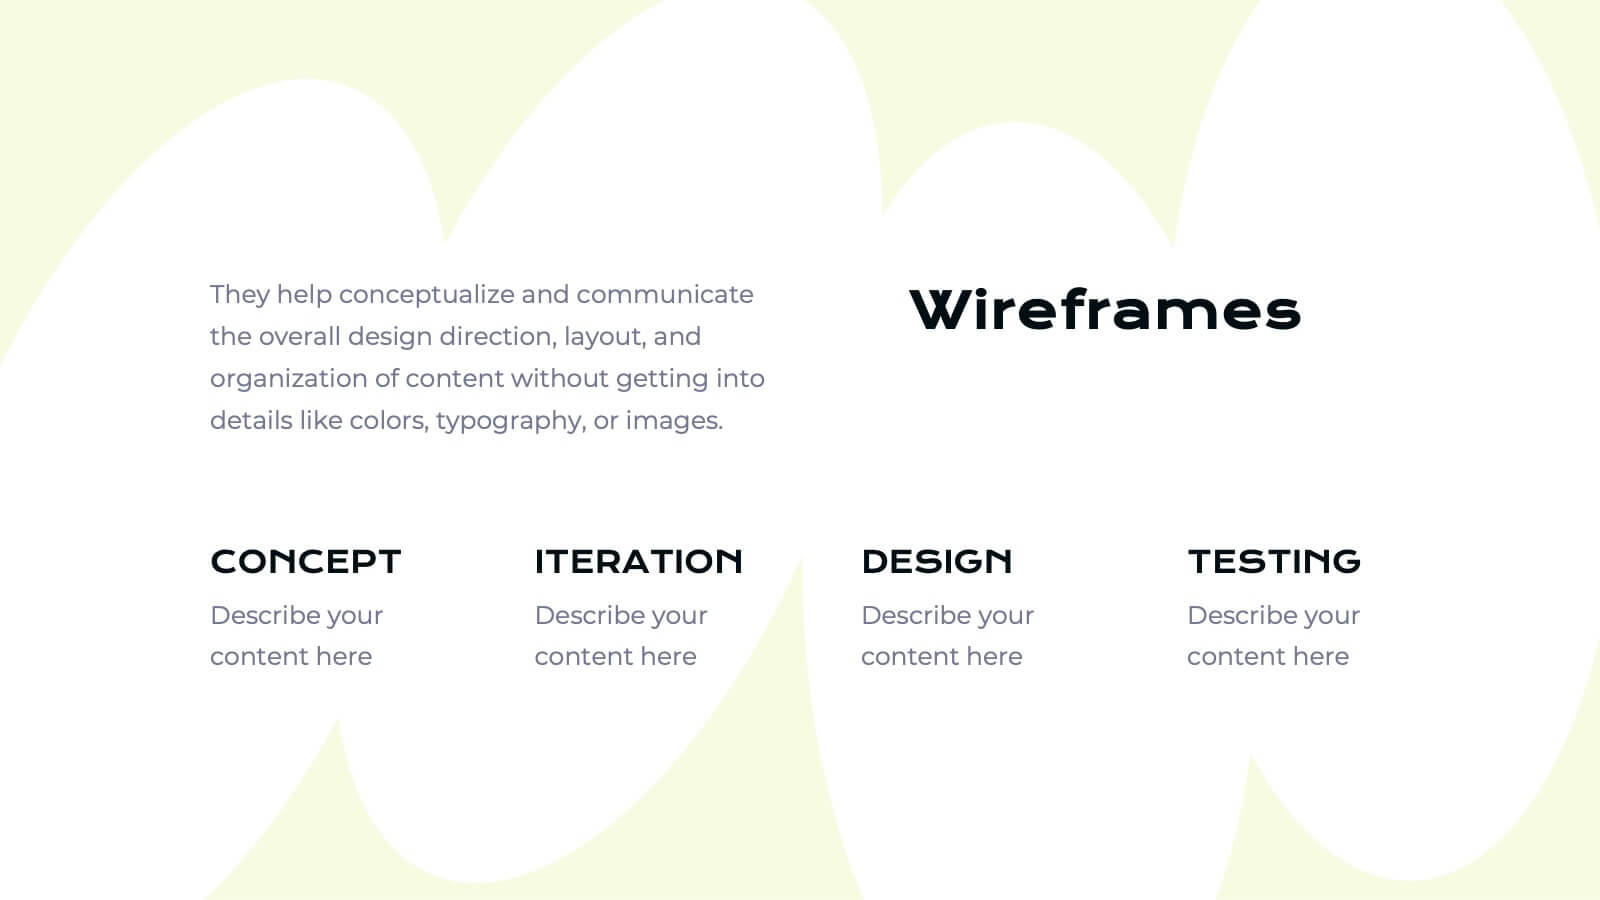
Ifrit User Experience Proposal Presentation
Unleash the power of great design with this fiery Ifrit-inspired presentation, perfect for delivering your user experience proposal! This template lets you showcase your UX strategies, research, and design process in a visually striking and well-organized format. Impress stakeholders with every slide. Compatible with PowerPoint, Keynote, and Google Slides.


6 diapositivas
Interview Question Infographic
Illuminate the path to insightful dialogue with our sleek Infographic Template, a visual masterpiece designed to make every question count! With its chic, minimalist design, this template pairs clean lines and soft colors to create an environment where information stands out and engagement flourishes. Perfect for those looking to elevate dialogue, whether through educational content, team meetings, or customer interactions, this tool makes communication clear and effective. It elegantly balances text and imagery, turning complex questions into easy-to-understand visuals that captivate and inform. Adaptable to various contexts, this template allows for full customization to match your brand’s aesthetic, ensuring that your message not only resonates but also reflects your unique style. Ideal for use in digital forums, presentations, or as part of interactive guides, it ensures your points are both seen and remembered, making every interaction more meaningful.


6 diapositivas
Defining Project Scope
Visualize your project's key components with this sleek hexagonal layout, perfect for outlining milestones, deliverables, and priorities. This six-part diagram helps teams align goals and clarify scope early in the process. Ideal for PMs, strategists, and consultants. Fully editable in PowerPoint, Keynote, and Google Slides.


6 diapositivas
Strategic Planning with Hexagon Diagram Presentation
Visualize key components of your strategy with the Strategic Planning with Hexagon Diagram Presentation. Featuring a layered 3D hexagon structure, this template helps communicate processes, goals, or stages with clarity and depth. Fully customizable in PowerPoint, Keynote, or Google Slides—perfect for corporate planning, project managers, and consultants.