


Características


¿Tienes alguna pregunta?
Recomendar


5 diapositivas
Innovation with Design Thinking Framework
Boost creativity and problem-solving with the Innovation with Design Thinking Framework Presentation. This slide features a vertically stacked rocket diagram symbolizing the five key phases of design thinking—perfect for illustrating iterative innovation processes. Each level includes editable text and icons, helping you align stakeholders around empathy, ideation, and prototyping. Ideal for workshops, innovation teams, educators, or product development presentations. Fully customizable in PowerPoint, Keynote, and Google Slides.


23 diapositivas
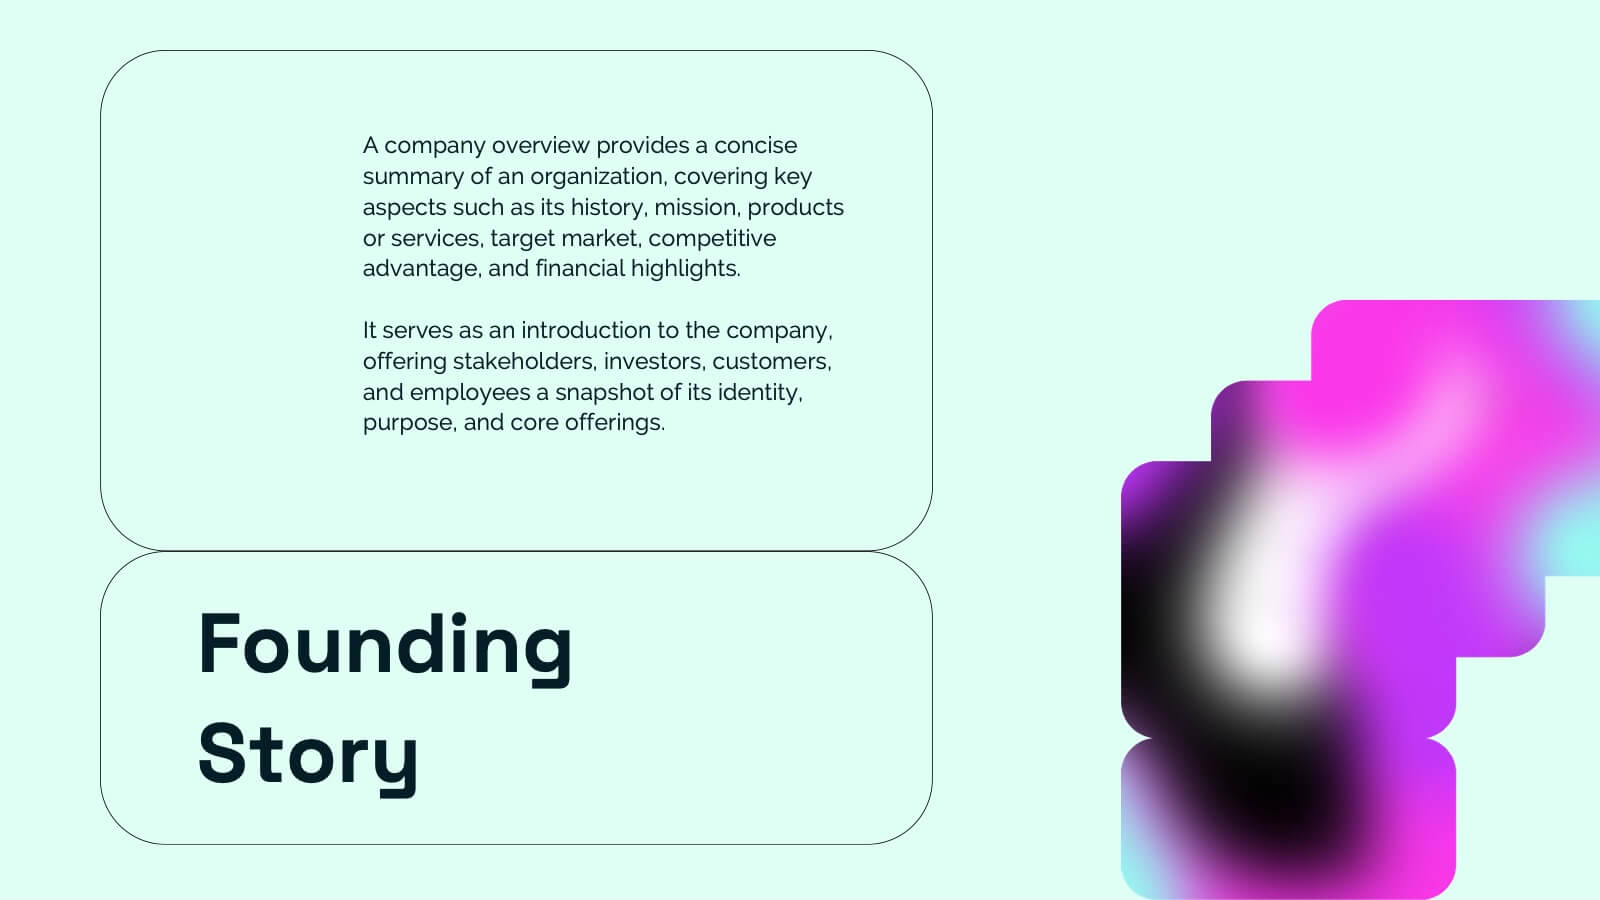
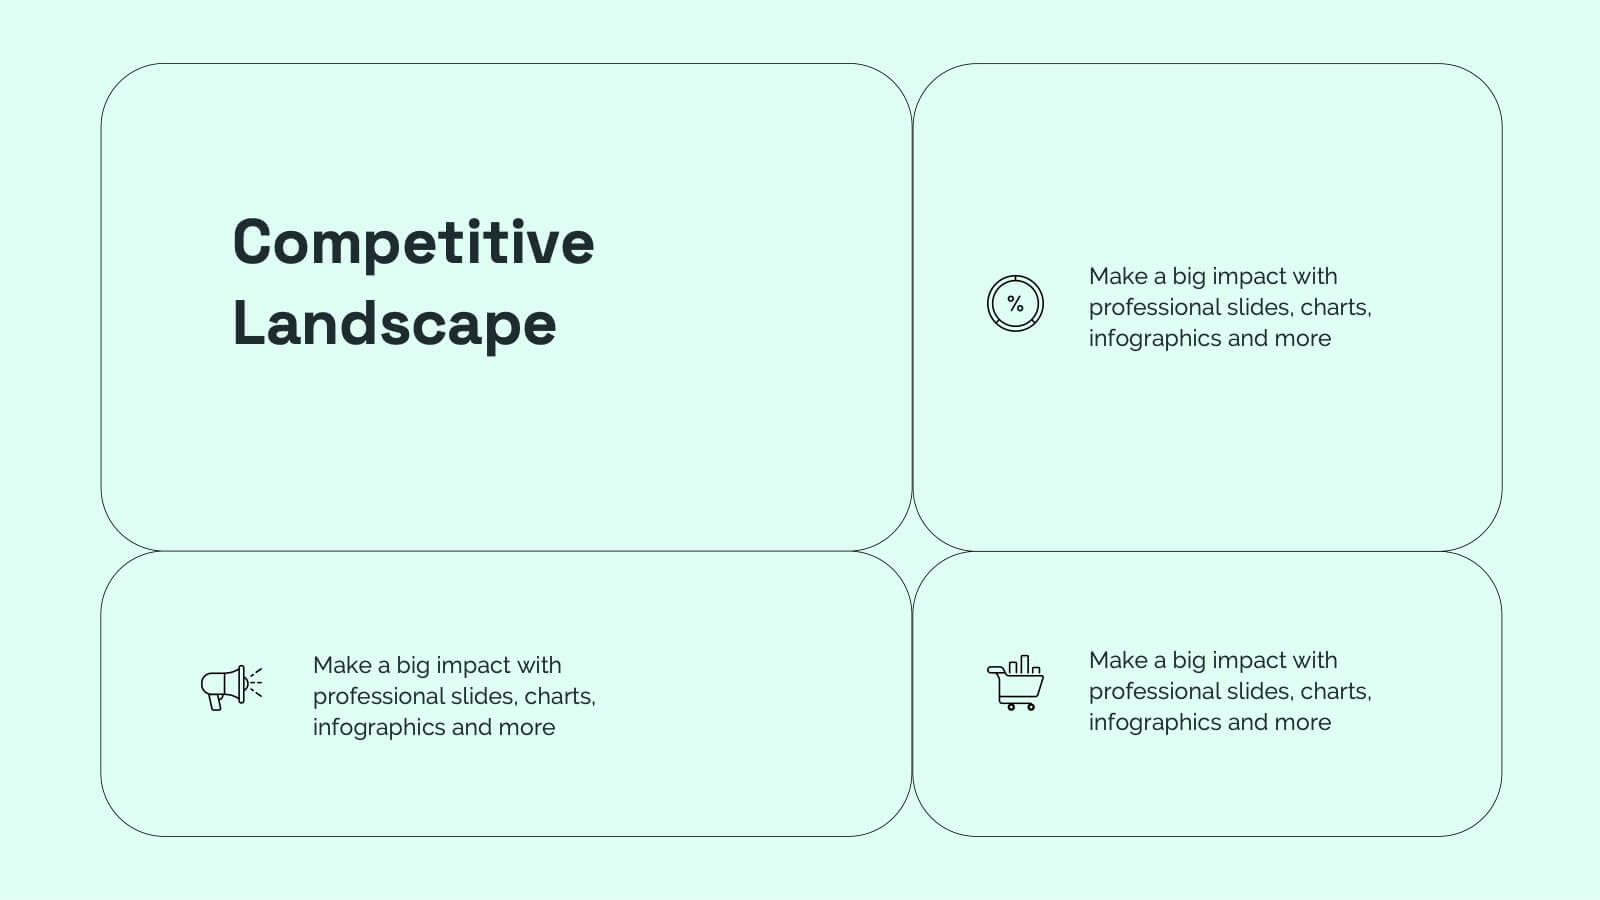
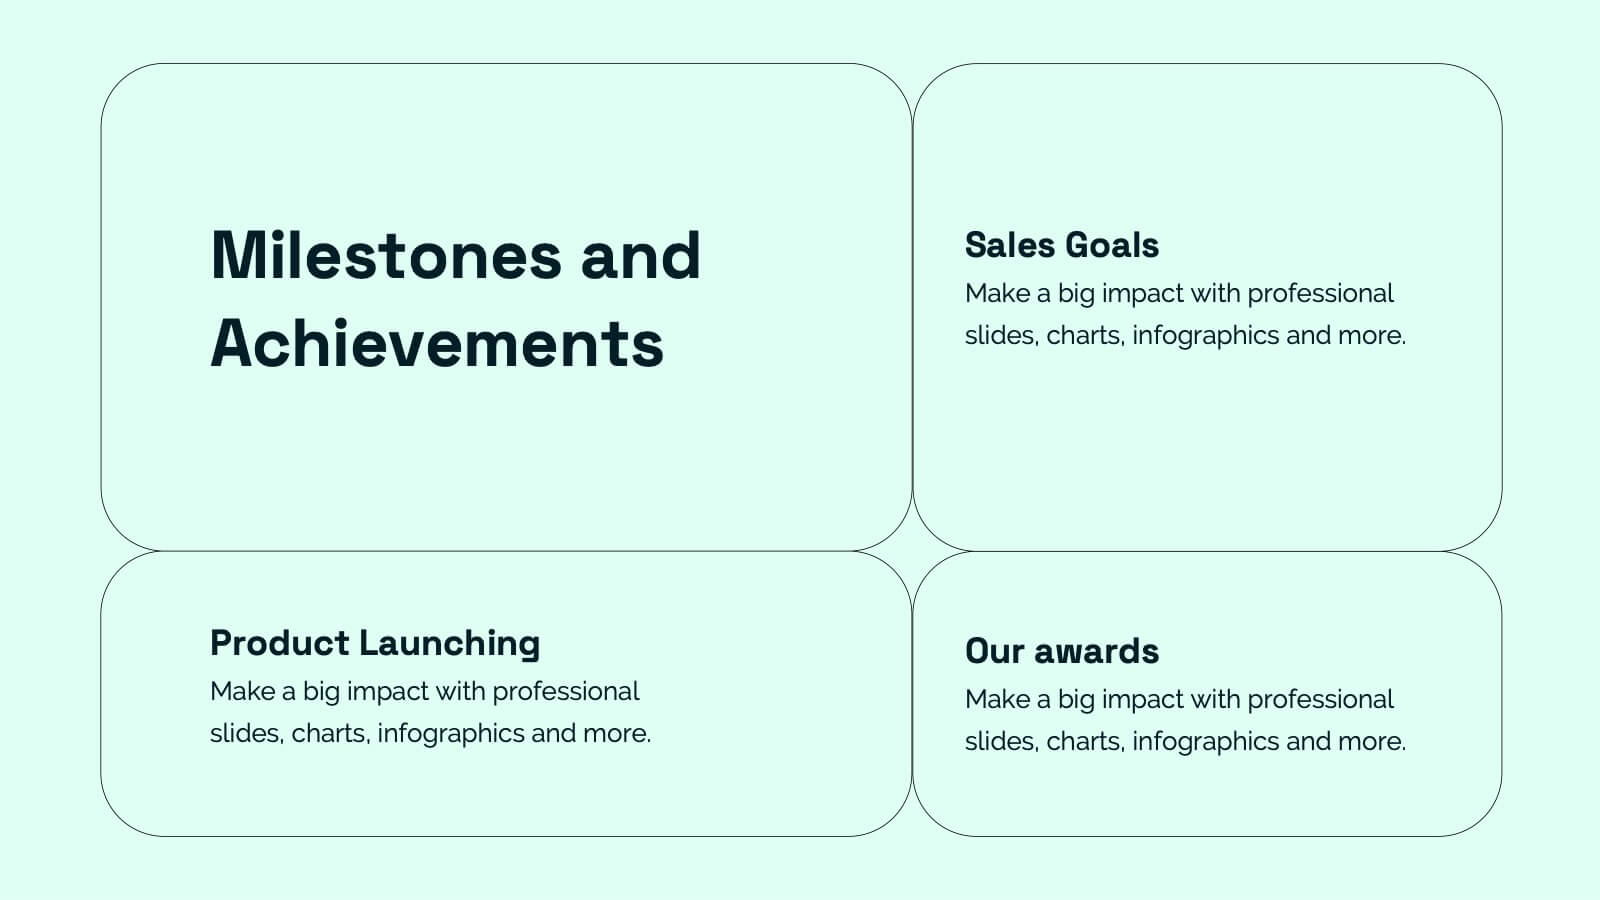
Mystic Small Business Pitch Deck Presentation
Elevate your small business presentations with this sleek, professional pitch deck template! It’s designed to highlight your company's background, market opportunities, and key objectives in a visually appealing format. Perfect for showcasing your products, services, value proposition, and financial performance, this template makes your pitch stand out. Customize it for PowerPoint, Keynote, or Google Slides to suit your needs.


6 diapositivas
Iceberg Chart Infographic
An iceberg infographic is a visual representation that uses the metaphor of an iceberg to convey information. This infographic template is designed to highlights the idea that only a small portion of the iceberg is visible above the waterline, while the majority of its mass remains hidden beneath the surface. The larger portion of the iceberg, submerged below the waterline, symbolizes the deeper or less obvious aspects of a topic. This can include underlying causes, complexities, challenges, or additional information that may not be immediately apparent. This is fully customizable and compatible with Powerpoint, Keynote, and Google Slides.


6 diapositivas
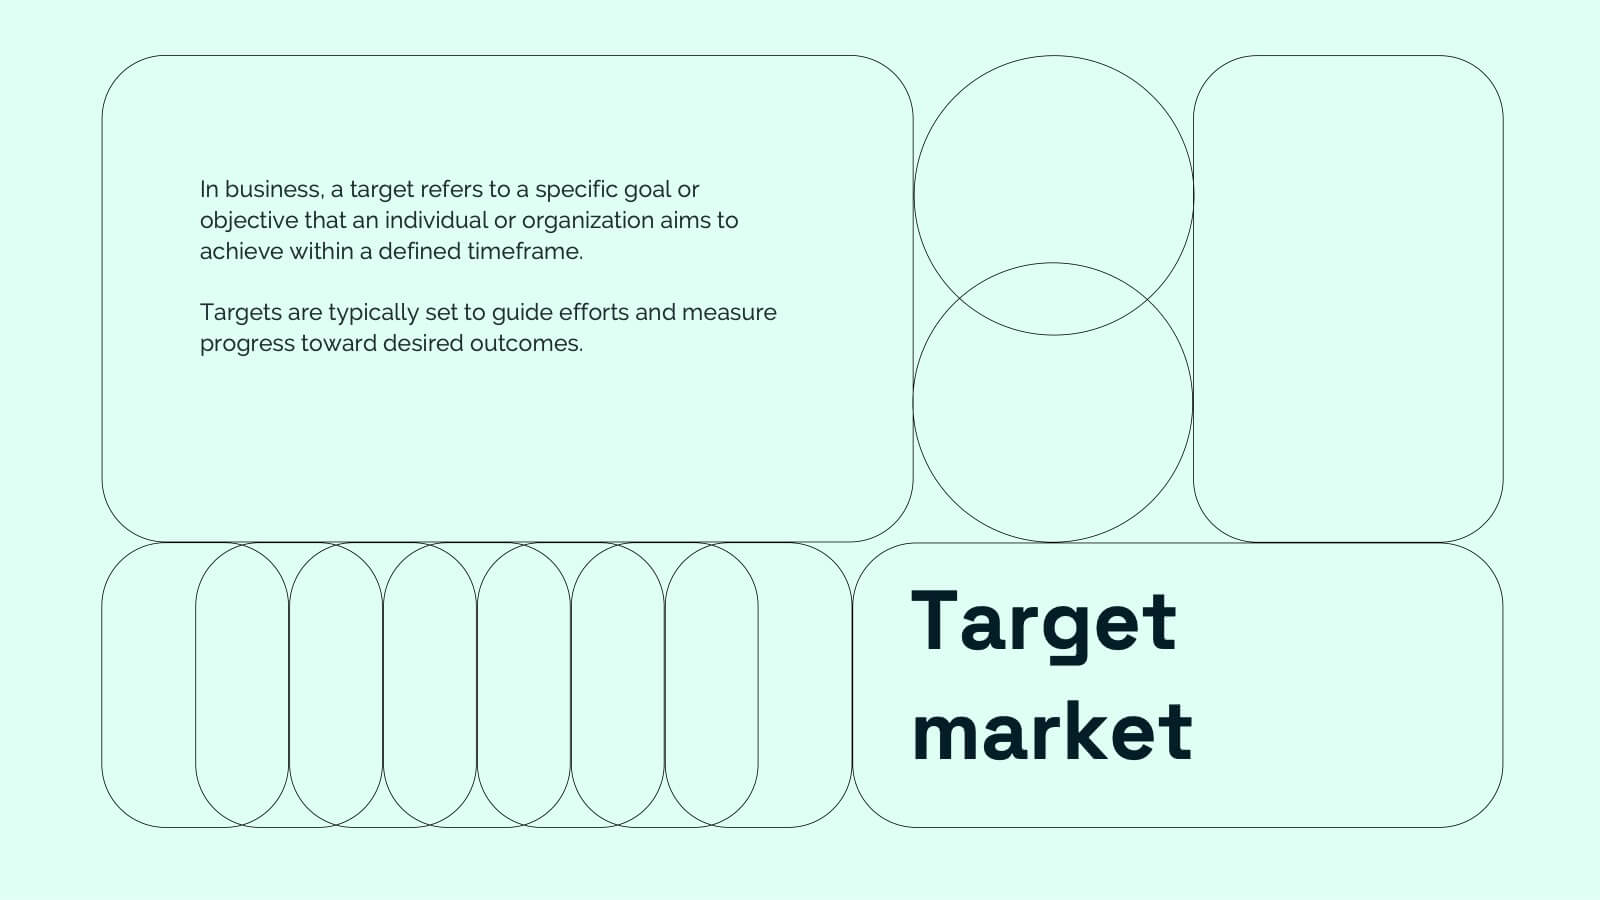
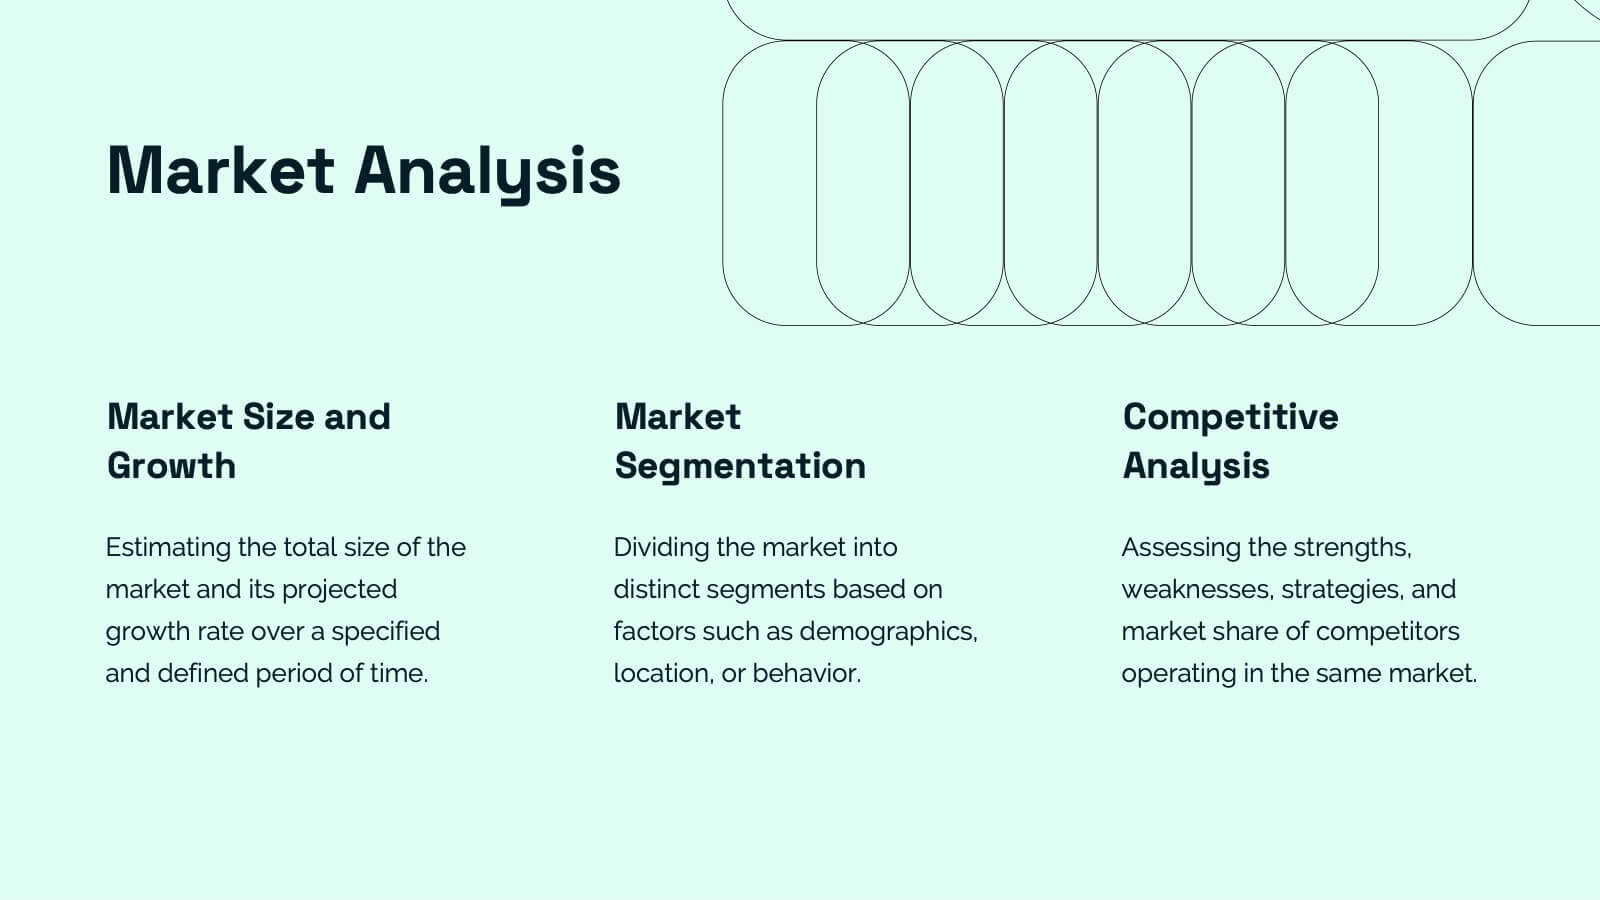
Targeted Segment Analysis and Mapping Presentation
Highlight your market focus with the Targeted Segment Analysis and Mapping Presentation. This circular layout is perfect for breaking down five audience segments, using subtle icons and visual emphasis for clarity. Ideal for marketers, strategists, and business analysts presenting niche targeting. Fully editable in Canva, PowerPoint, Keynote, and Google Slides.


4 diapositivas
Decision Making with Option Comparison Presentation
Illuminate your choices with the Decision Making with Option Comparison Presentation. This slide uses a bold lightbulb illustration surrounded by icons to visually break down multiple options or solutions. Ideal for showcasing pros and cons, strategic alternatives, or scenario evaluations. Each option includes space for a clear title and supporting insights, making it easy to compare ideas side-by-side. Fully editable in PowerPoint, Keynote, and Google Slides—perfect for business strategy sessions, team decisions, or client pitches.


7 diapositivas
Porter's Five Forces Infographics Presentation Template
Porter's Five Forces model is a framework for analyzing the competitive environment of an industry. The five forces are: threat of new entrants, bargaining power of suppliers, bargaining power of buyers, threat of substitute products or services, and rivalry among existing competitors. By using this template to analyze these five forces, you can gain a better understanding of the industry's environment and make more strategic decisions. Use this template to help your business analyze. This will help you make a great presentation evaluating the potential profitability of entering a new market.


5 diapositivas
Project Status Update and Timeline Presentation
Keep your team aligned with this clean, easy-to-read status update template. Featuring progress bars, monthly Gantt chart visuals, and icons for each task, it’s perfect for tracking milestones, team updates, and project phases. Fully editable in PowerPoint, Keynote, and Google Slides.


23 diapositivas
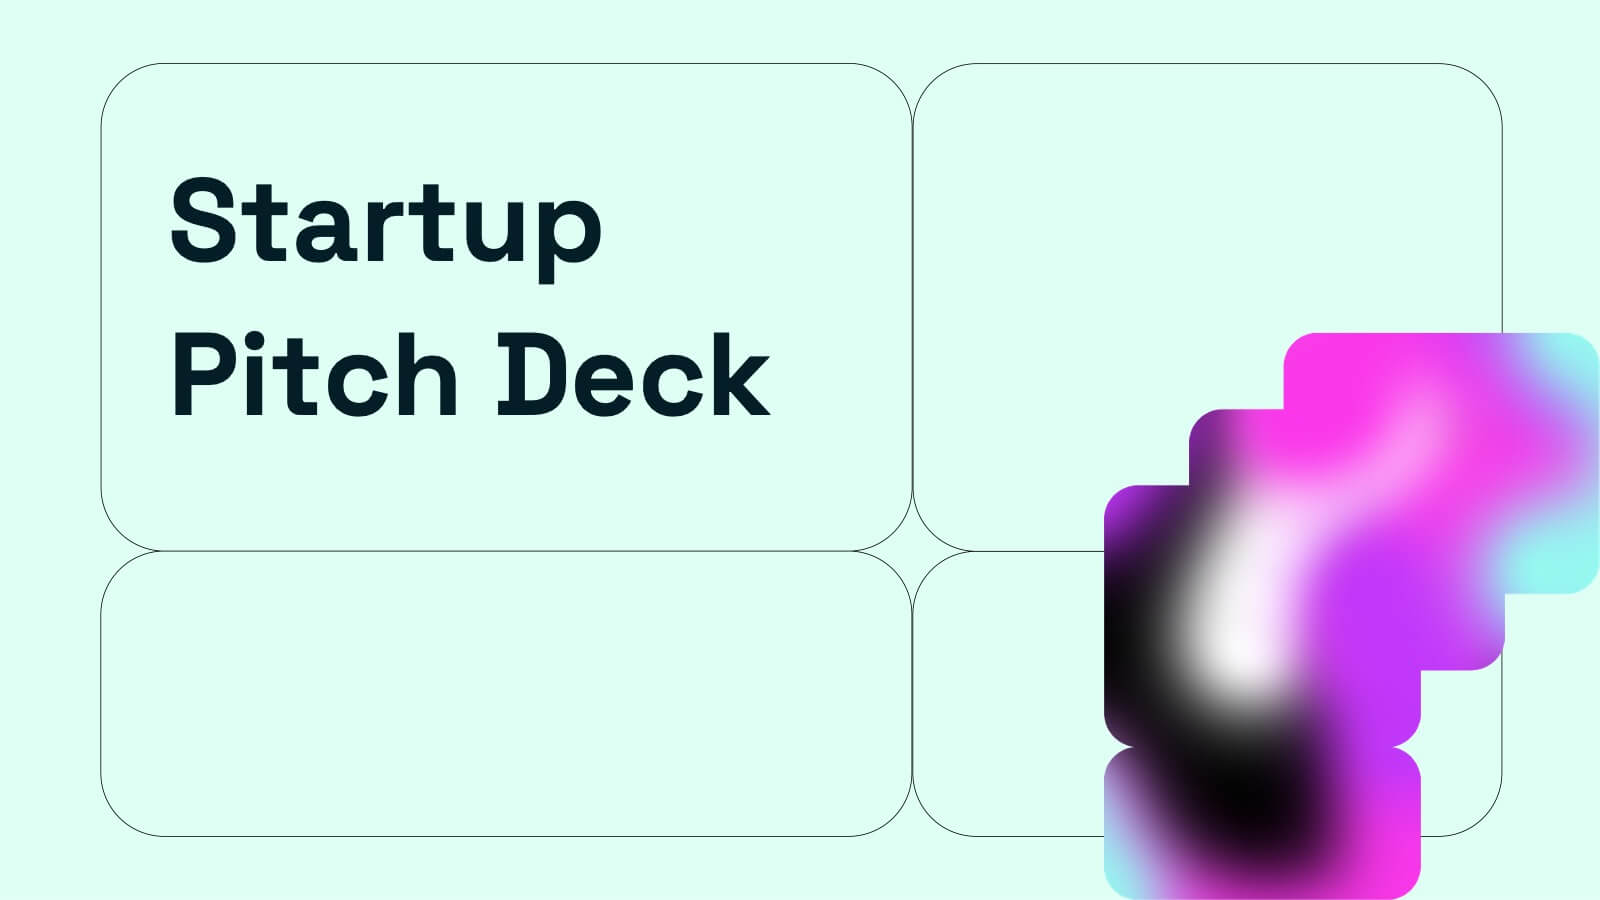
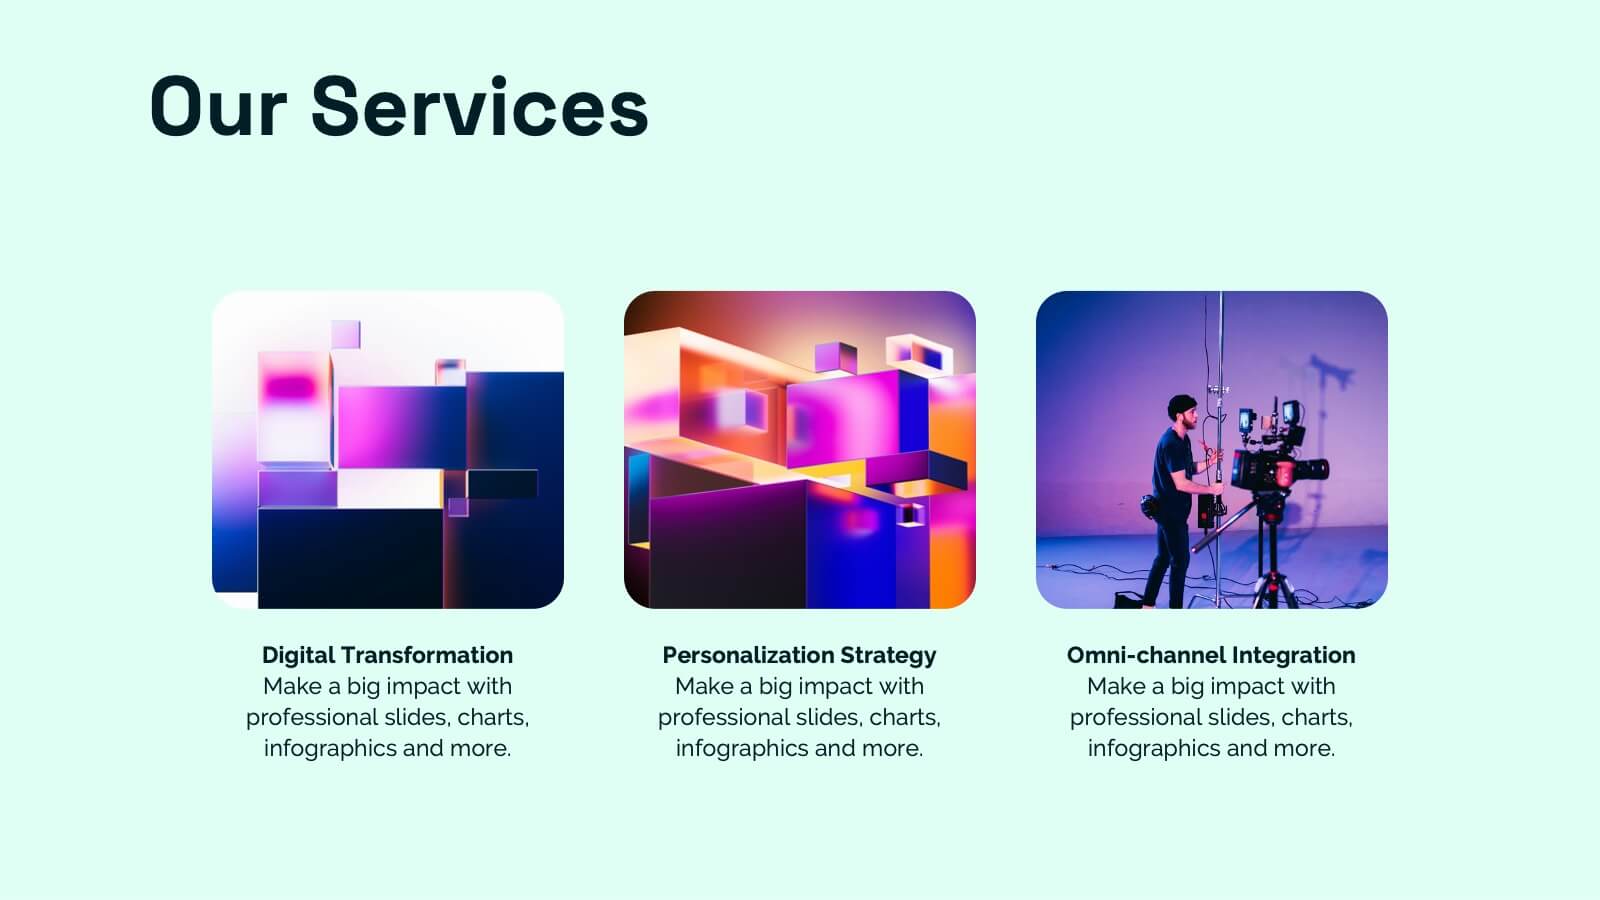
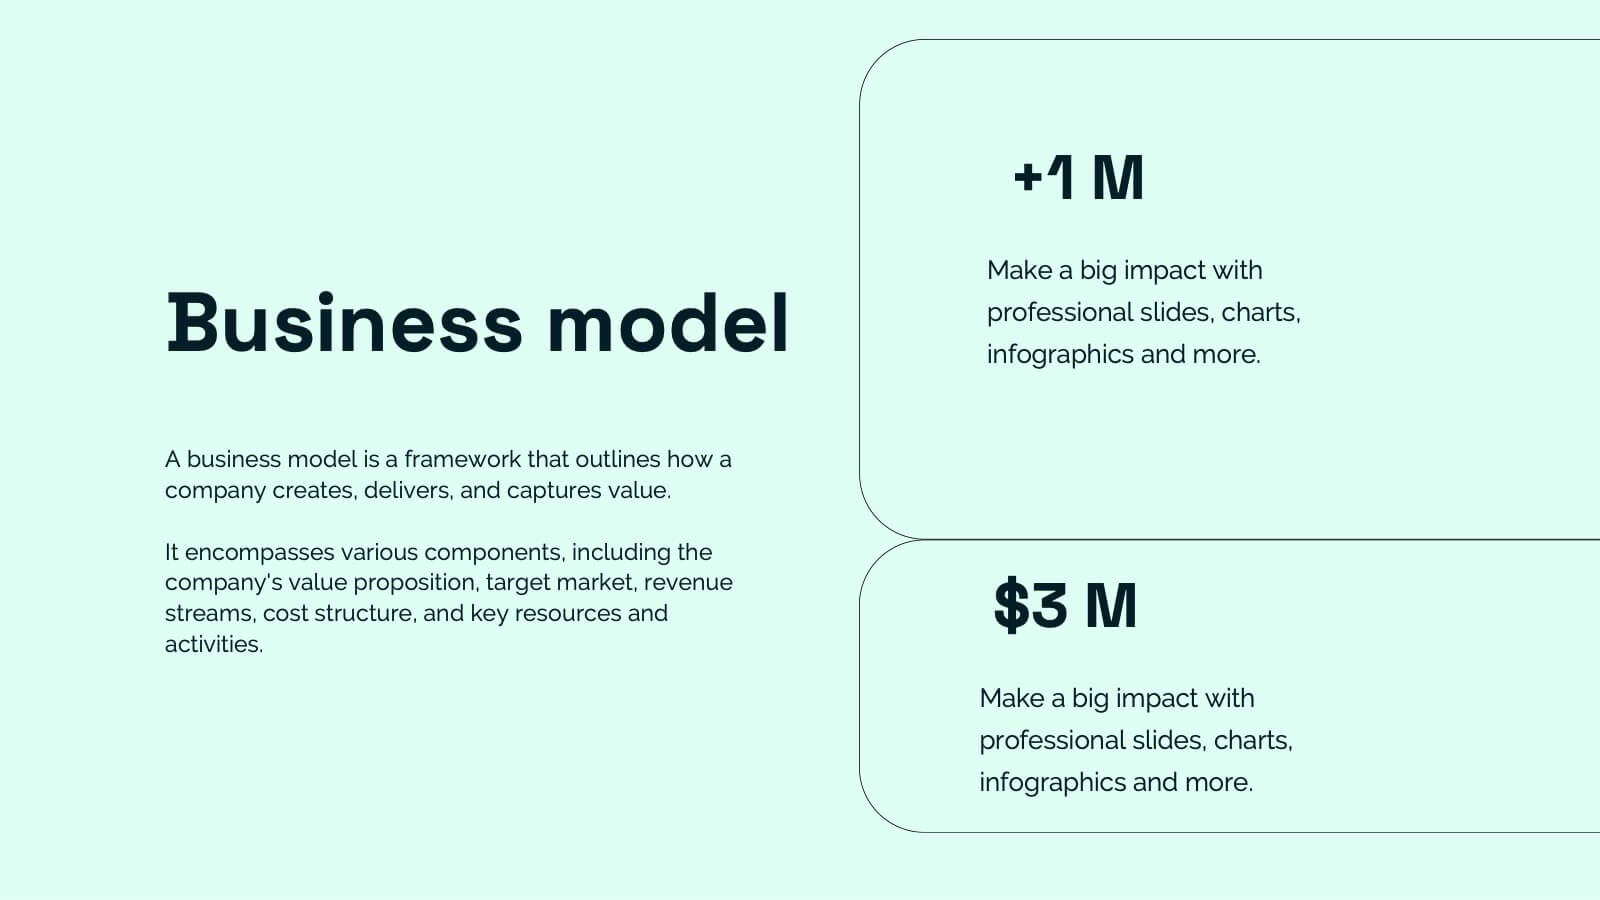
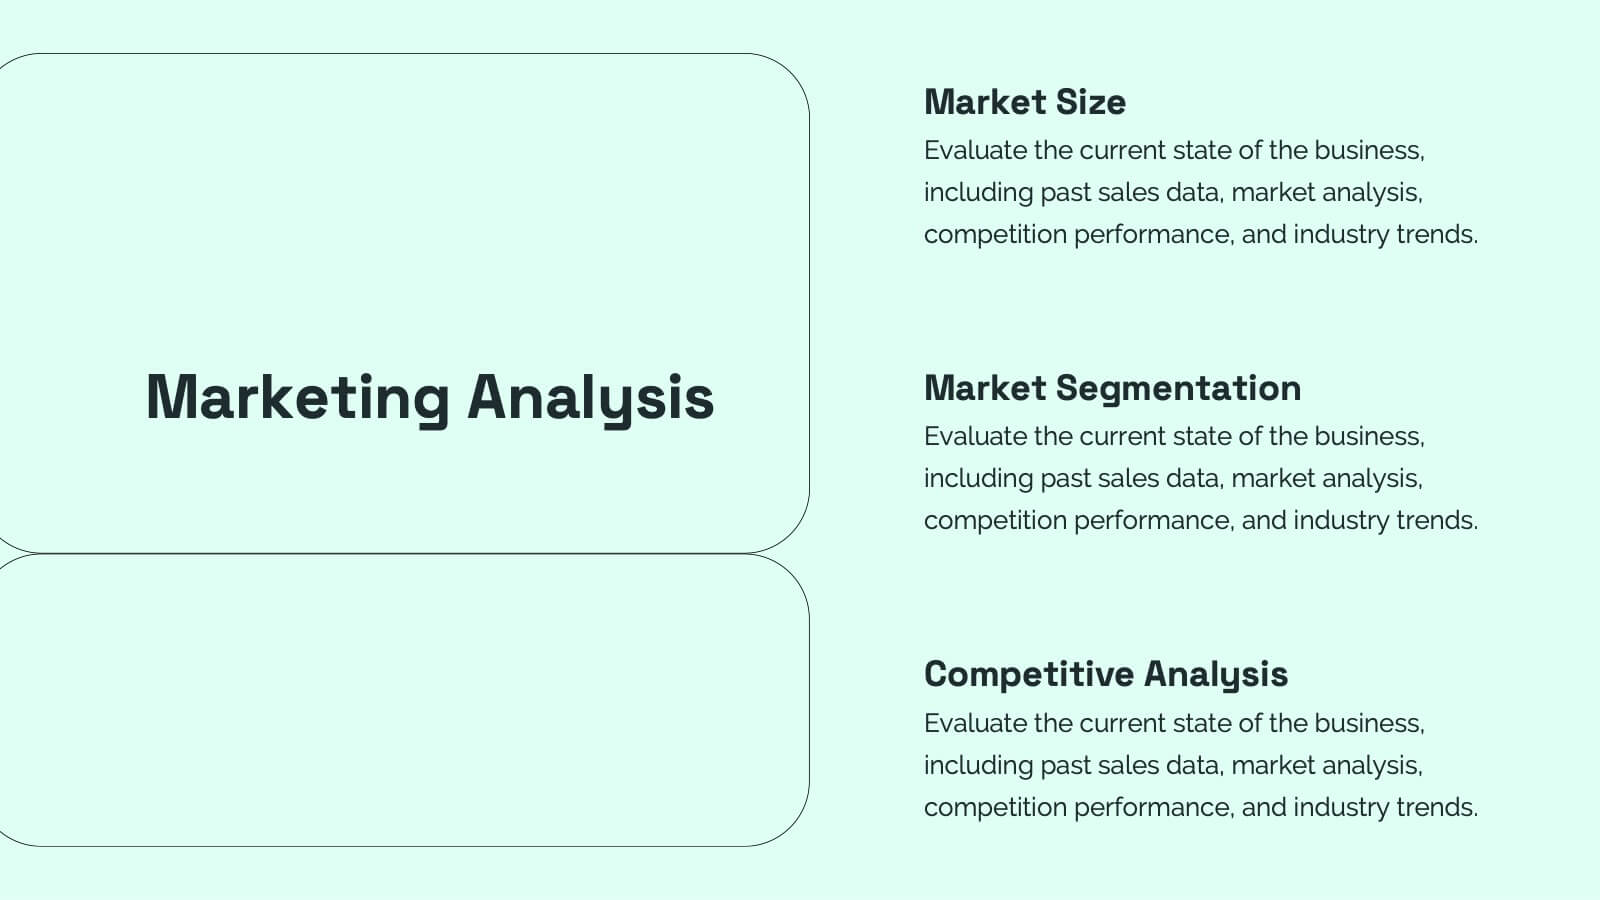
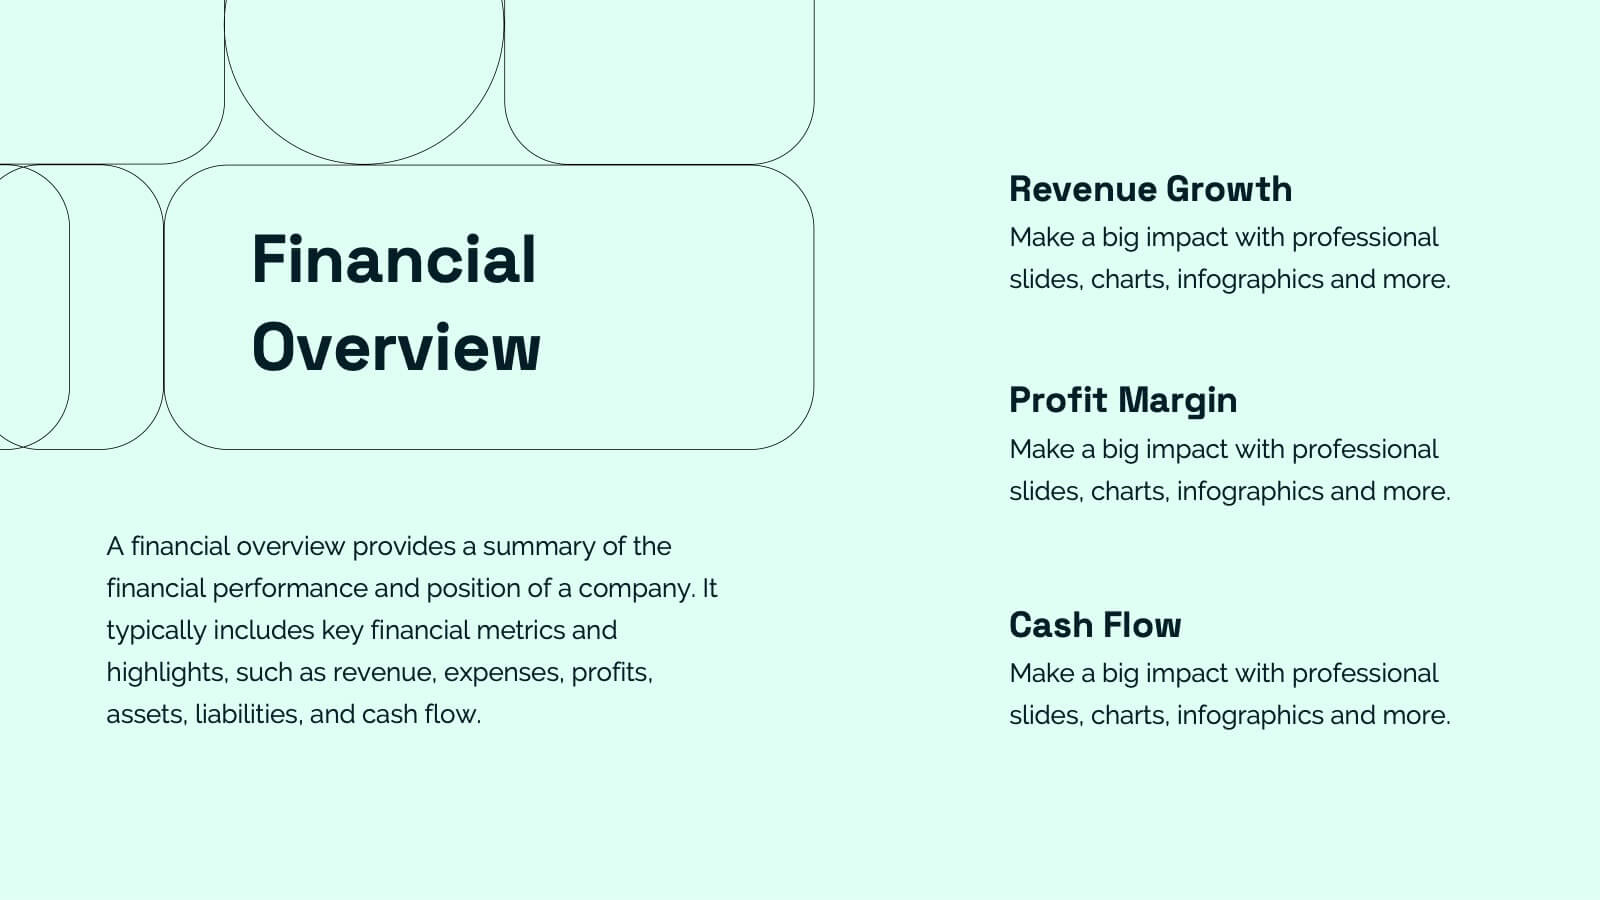
Nymph Startup Pitch Deck Presentation
This startup pitch deck template covers all the essentials for presenting a business. It includes slides for mission and vision, business model, market analysis, value proposition, and financial overview. Easily customizable for any startup industry, this modern design makes presenting your ideas a breeze. Compatible with PowerPoint, Keynote, and Google Slides.


4 diapositivas
Business Communication Strategy
Visualize communication channels with this walkie-talkie themed strategy layout. Each section represents a key step in your communication plan—ideal for internal operations, team workflows, or stakeholder messaging. Easily editable in PowerPoint, Keynote, and Google Slides.


4 diapositivas
Competitive Strategy Framework Presentation
Visualize your market position with this competitive strategy framework. Featuring a 2x2 matrix layout, this template is ideal for analyzing key strategic areas. Use the chess-themed icons and editable labels to highlight strengths, risks, and opportunities. Fully customizable in PowerPoint, Keynote, or Google Slides for strategic planning or business analysis.


6 diapositivas
Decision Flow Diagram Presentation
Make complex decisions easier to follow with the Decision Flow Diagram Presentation. This clean and logical layout breaks down two main options and guides viewers through possible outcomes using a visual tree structure. Featuring checkmark and X icons to clearly denote decisions, this template is ideal for strategic planning, operations, or troubleshooting. Includes light and dark modes, editable in PowerPoint, Keynote, and Google Slides.


5 diapositivas
Quality Control with Six Sigma Strategy Presentation
Showcase your quality control framework using the Quality Control with Six Sigma Strategy Presentation. This modern layout highlights each stage of the DMAIC process in a visually engaging format, ideal for Lean Six Sigma teams and continuous improvement professionals. Fully customizable in PowerPoint, Keynote, Canva, and Google Slides.


5 diapositivas
Marketing Sales Funnel Presentation
Watch your customer journey come to life with a clean, visual flow that makes each stage easy to understand at a glance. This presentation breaks down your funnel into clear steps, helping you explain conversions, behaviors, and strategy with confidence. Fully compatible with PowerPoint, Keynote, and Google Slides.


6 diapositivas
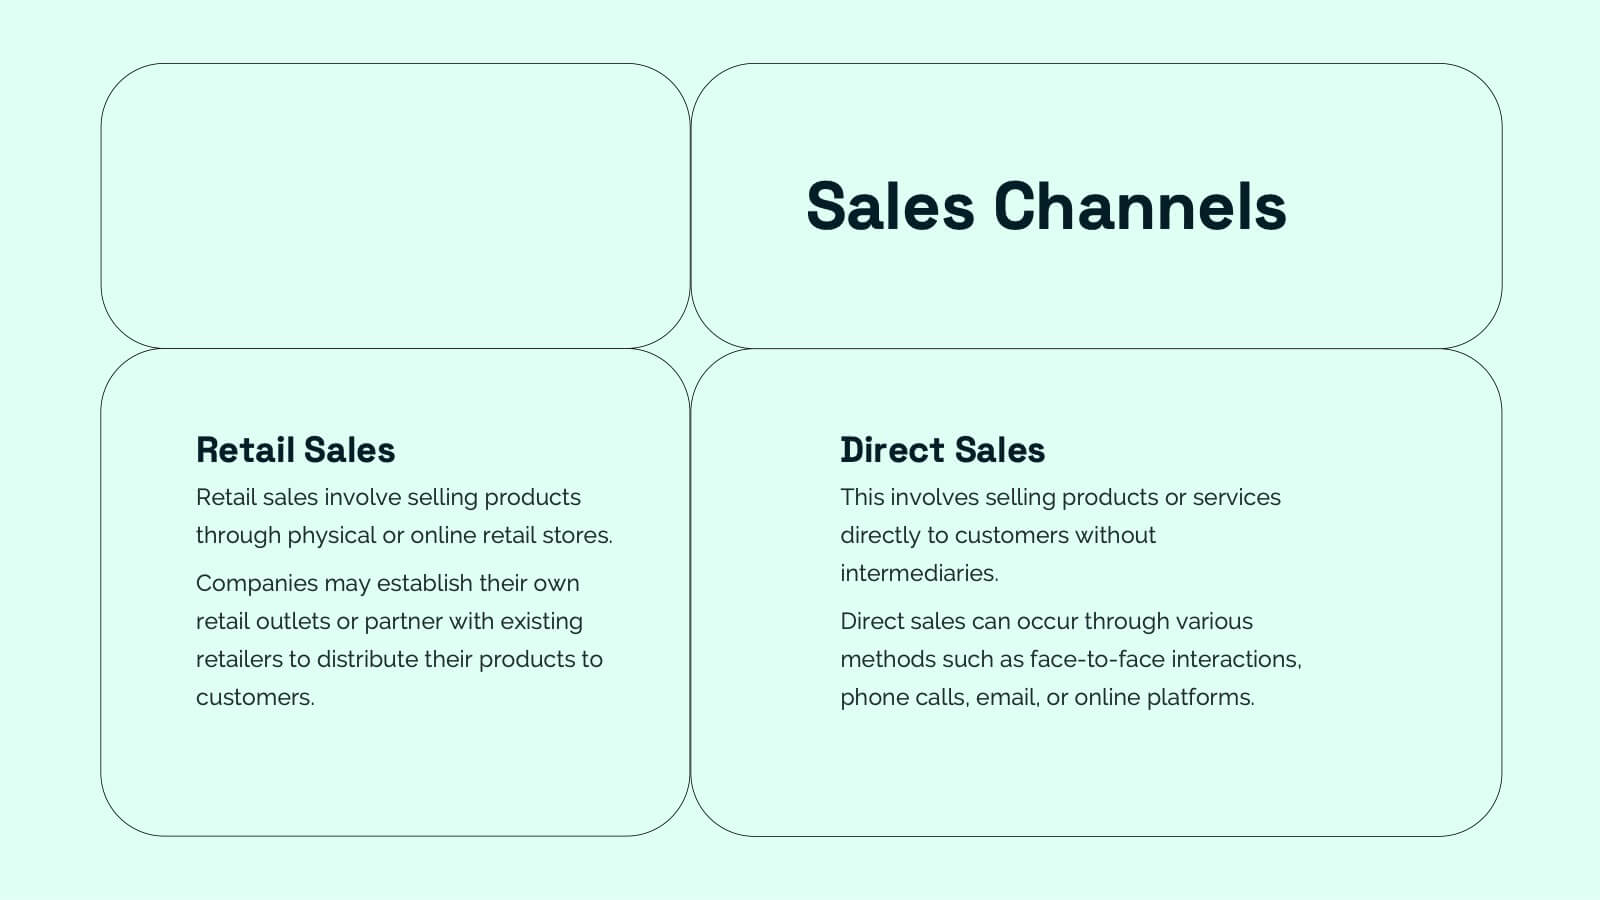
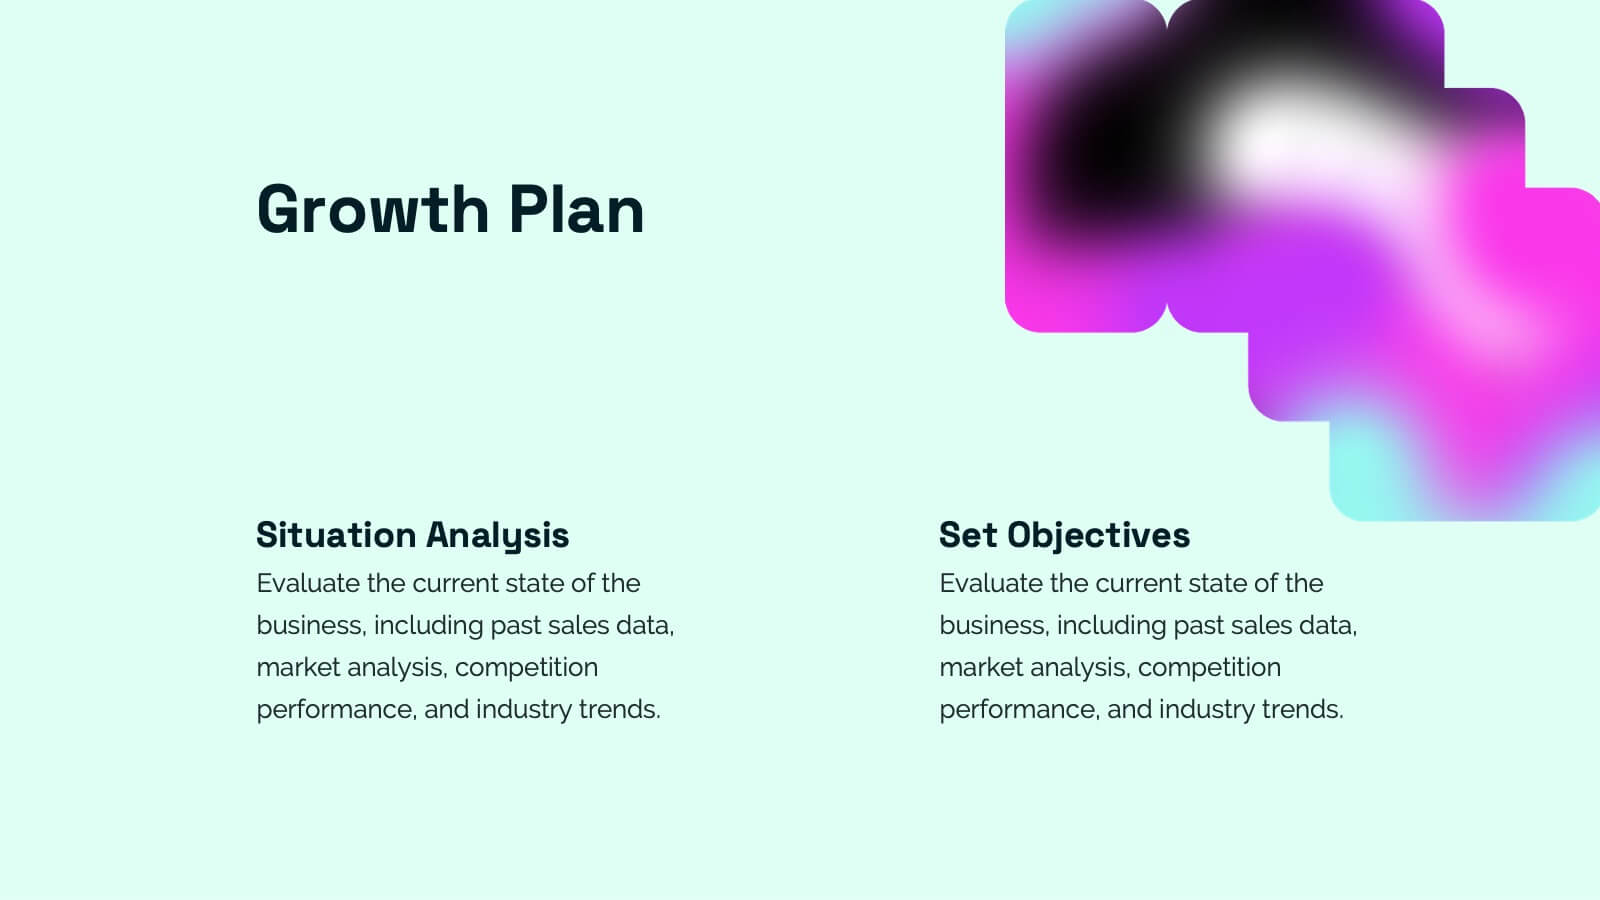
Startup Business Launch Framework Presentation
Showcase your startup journey with the Startup Business Launch Framework Presentation. This step-by-step visual illustrates four key stages in your business launch process—from ideation to execution—using ascending blocks and modern icons. Ideal for founders, incubators, and pitch decks. Fully customizable in PowerPoint, Keynote, Google Slides, and Canva.


6 diapositivas
Financial Trading and Stock Performance Presentation
Explore market dynamics with the "Financial Trading and Stock Performance" presentation template. Perfect for finance professionals, these slides offer a visual analysis of stock trends over the years. Featuring bar graphs and gauge charts for annual comparison, it's designed for impactful presentations. These templates are compatible with PowerPoint, Keynote, and Google Slides, enhancing their accessibility across different platforms.


7 diapositivas
Demographic Traits Infographic
Dive deep into the world of demographics with our demographic traits infographic. Painted in hues of white, yellow, and blue, this infographic expertly visualizes population data within a map layout, ensuring a cohesive understanding of varied traits across regions. Tailored for market researchers, sociologists, business analysts, and educators, this tool is designed to make complex demographic data comprehensible and engaging. Whether you're using PowerPoint, Keynote, or Google Slides, our infographic will seamlessly fit, elevating the quality and clarity of your presentation.


4 diapositivas
Root Cause Analysis Fishbone Presentation
Pinpoint problems efficiently with this Root Cause Analysis Fishbone template. Designed to help you identify and visualize causes clearly, it’s perfect for process improvement and team brainstorming. Fully editable and easy to use in PowerPoint, Keynote, and Google Slides for maximum flexibility across your workflow.