


Características


¿Tienes alguna pregunta?
Recomendar


5 diapositivas
Leadership Styles Overview Presentation
Explore what makes great leaders stand out with this engaging and visually balanced presentation design. Perfect for outlining different management approaches, personality-driven leadership models, or team dynamics, it helps audiences grasp key insights with clarity. Fully editable and compatible with PowerPoint, Keynote, and Google Slides for effortless customization.


5 diapositivas
Six Sigma DMAIC Process Flow Presentation
Streamline your process improvement with this Six Sigma DMAIC Flow template. Visually organize each stage—Define, Measure, Analyze, Improve, Control—using clean, professional layouts. Perfect for Lean Six Sigma projects, quality control, and operational excellence. Fully customizable in PowerPoint, Keynote, and Google Slides for versatile team presentations and process reviews.


7 diapositivas
Medical Center Infographic
A medical center, often referred to as a healthcare center, is a facility or establishment where a range of medical services and care are provided to individuals in need of medical attention. This infographic template is designed to provide a comprehensive overview of the medical center, emphasizing its services, healthcare professionals, facilities, patient satisfaction, and community engagement. This infographic is fully customizable and compatible with Powerpoint, Keynote, and Google Slides. Easily customize and design this to align with your specific medical center's brand and message.


26 diapositivas
Philp Presentation Template
Our Philp template is perfect for presenting your furniture shop business. It has a modern design, allowing you to make your product/service stands out from the crowd, and it’s easily customizable so that it can be tweaked to your exact needs. This template contains slides with beautiful graphics and captions describing the most important aspects of your business. Our presentation template can be used to promote your products, services, benefits and much more! This template can also be used to present your company's vision and mission, business strategy, portfolio and more.


4 diapositivas
EU Business Coverage Map Presentation
Highlight your European business presence with the EU Business Coverage Map Presentation. This slide layout uses pinpoint markers and color-coded regions to showcase operations, regional offices, or market coverage across Europe. Ideal for quarterly reports, sales updates, or investor briefings. Fully editable in PowerPoint, Keynote, Google Slides, and Canva.


4 diapositivas
Timeline of Business Achievements Presentation
Visualize progress with clarity using the Timeline of Business Achievements Presentation. This sleek template features both horizontal and vertical timeline formats to showcase yearly milestones, step-by-step phases, and key tasks. Ideal for project reporting, strategy rollouts, and roadmap updates. Fully editable and compatible with PowerPoint, Keynote, and Google Slides.


4 diapositivas
Target Audience Slide Deck Presentation
Make your message click instantly with a bold, puzzle-style slide that brings your audience insights to life. This presentation helps you break down key segments, user needs, and demographic details in a clear, engaging format that supports strategic decision-making. Fully compatible with PowerPoint, Keynote, and Google Slides.


12 diapositivas
Geometric Shapes Design Slide Presentation
Make your content stand out with a bold, modern layout built from clean geometric forms that guide the viewer’s eye effortlessly. This presentation helps you organize ideas, highlight key points, and create a polished visual flow without distractions. Fully editable and compatible with PowerPoint, Keynote, and Google Slides.


4 diapositivas
Medical Overview and Clinical Solutions Presentation
Present medical insights with clarity using the Medical Overview and Clinical Solutions Presentation. This slide features a segmented pill bottle graphic paired with three labeled sections (A, B, C), ideal for explaining treatments, protocols, or phased approaches. Fully editable in Canva, PowerPoint, Keynote, and Google Slides for seamless customization.


26 diapositivas
HIIT Workout Pink Presentation
Unleash the energy with our vibrant HIIT gym workout presentation template, a dynamic blend of pink, red, orange, and yellow, designed to bring your fitness regime to life. This energetic palette is perfect for gym owners, fitness influencers, and personal trainers aiming to showcase the high-intensity intervals that promise fast results. The template offers various graphics, icons, and image placeholders that add a visual punch to your information. Dive into creating an engaging, motivational fitness journey that highlights the benefits, routines, and transformative power of HIIT workouts, ensuring your audience is pumped and ready to go!


4 diapositivas
Mobile and Laptop Mockup Devices
Present your digital products with style using this modern mockup slide. Featuring a realistic laptop and smartphone duo, this layout is perfect for showcasing websites, apps, or UI designs. Fully editable in PowerPoint, Keynote, and Google Slides—customize text, colors, and layout with ease.


5 diapositivas
Conference Agenda Slide Presentation
Keep your sessions structured and engaging with the Conference Agenda Slide Presentation. Designed with a visual screen-style format, it showcases a 4-part schedule using color-coded blocks for clarity. Perfect for corporate events, speaker lineups, or workshops. Fully editable in PowerPoint, Keynote, and Google Slides.


8 diapositivas
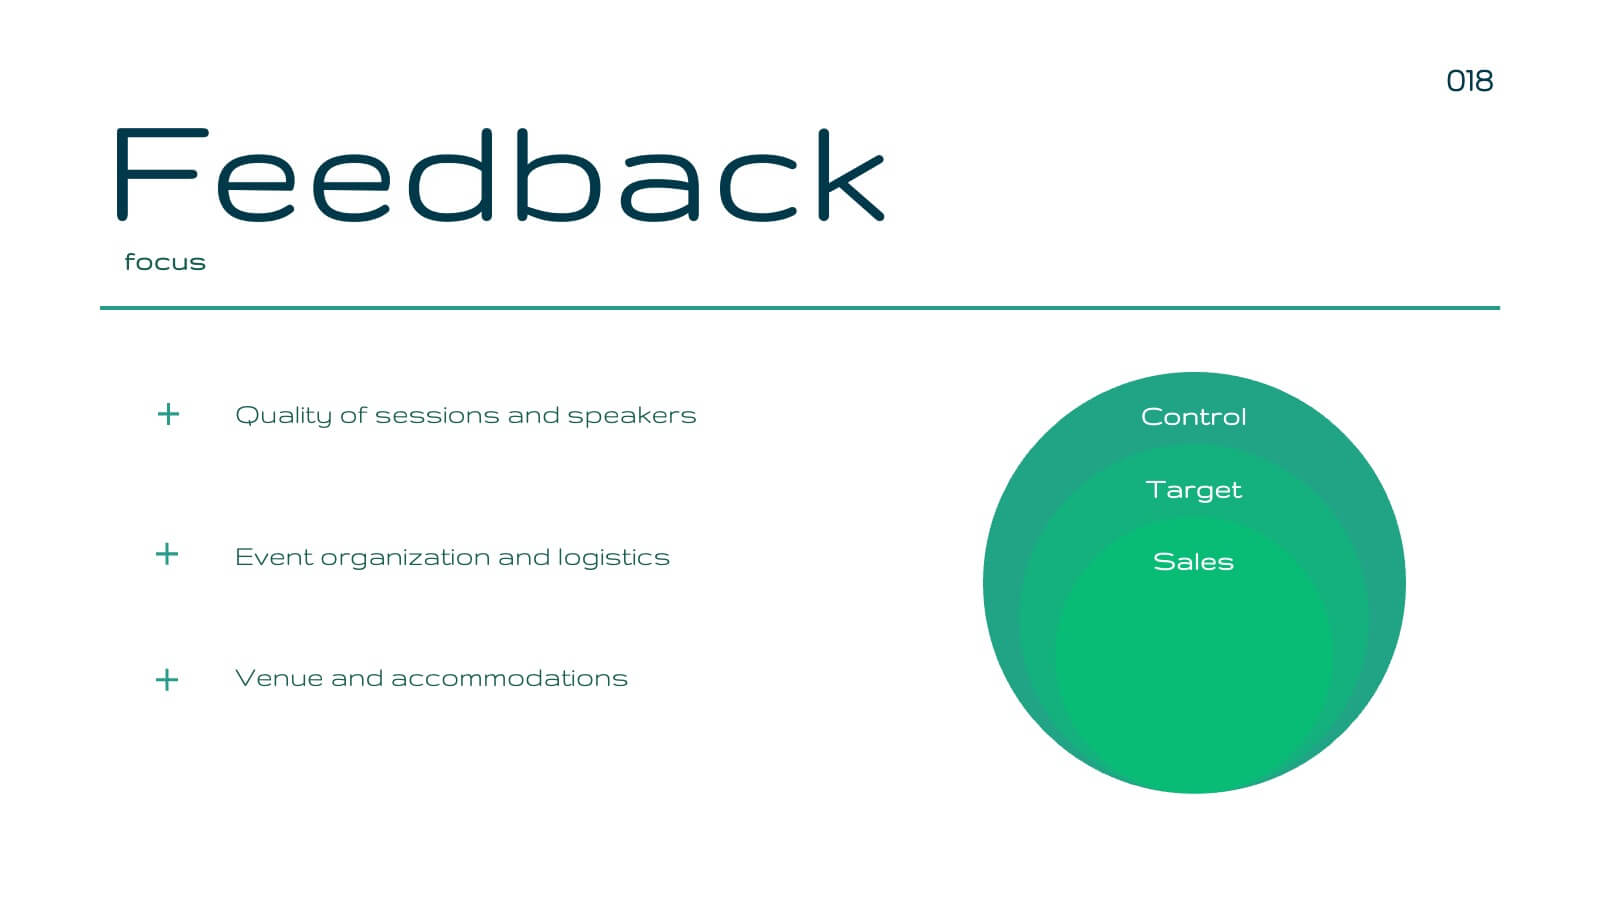
Business Risk Identification and Management
Simplify complex risk factors with this visually engaging diagram. This template uses overlapping circular segments to categorize and assess risk impact across four business areas—ideal for project managers, analysts, and consultants. Customizable progress bars help communicate risk levels with clarity. Compatible with PowerPoint, Keynote, and Google Slides.


8 diapositivas
Social Media Engagement Metrics
Track engagement with clarity using the Social Media Engagement Metrics Presentation. This layout features a smartphone mockup at the center, with four vertically stacked icons representing key engagement indicators. Surrounding the device, space is allocated for concise data insights or definitions labeled A through D. Perfect for presenting analytics like likes, shares, comments, and reach. Fully editable in PowerPoint, Keynote, and Google Slides.


5 diapositivas
Online Learning Strategy Slides Presentation
Transform your virtual training ideas into visually engaging lessons with this dynamic presentation. Ideal for educators and online course creators, it helps structure digital learning strategies with clarity and purpose. Clean visuals make complex plans easy to follow. Fully compatible with PowerPoint, Keynote, and Google Slides for effortless customization.


22 diapositivas
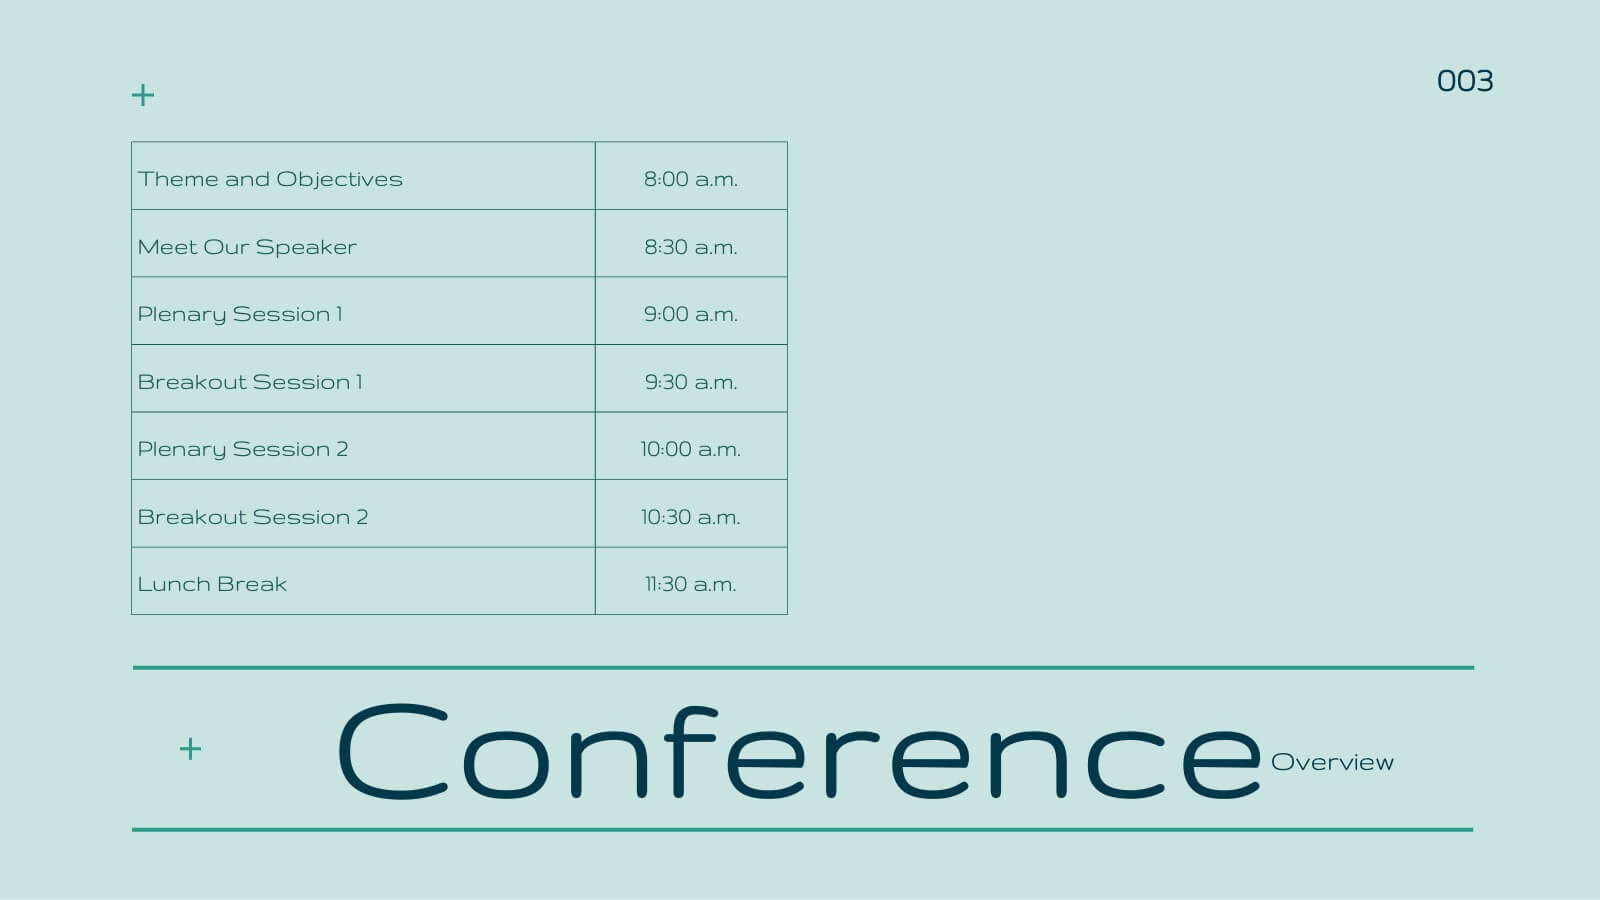
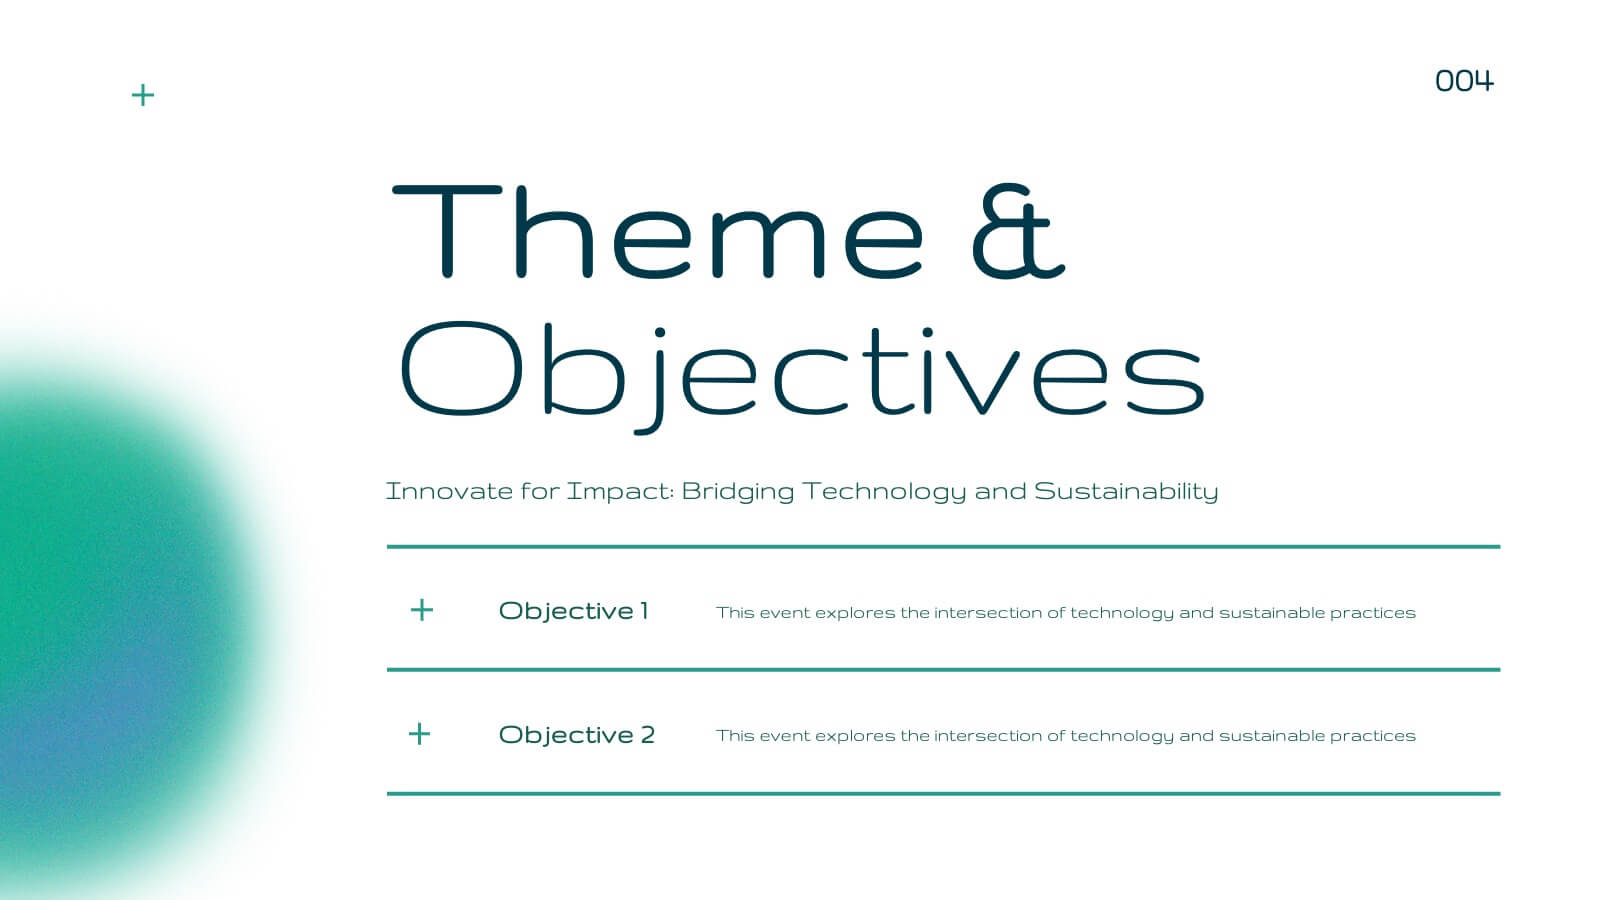
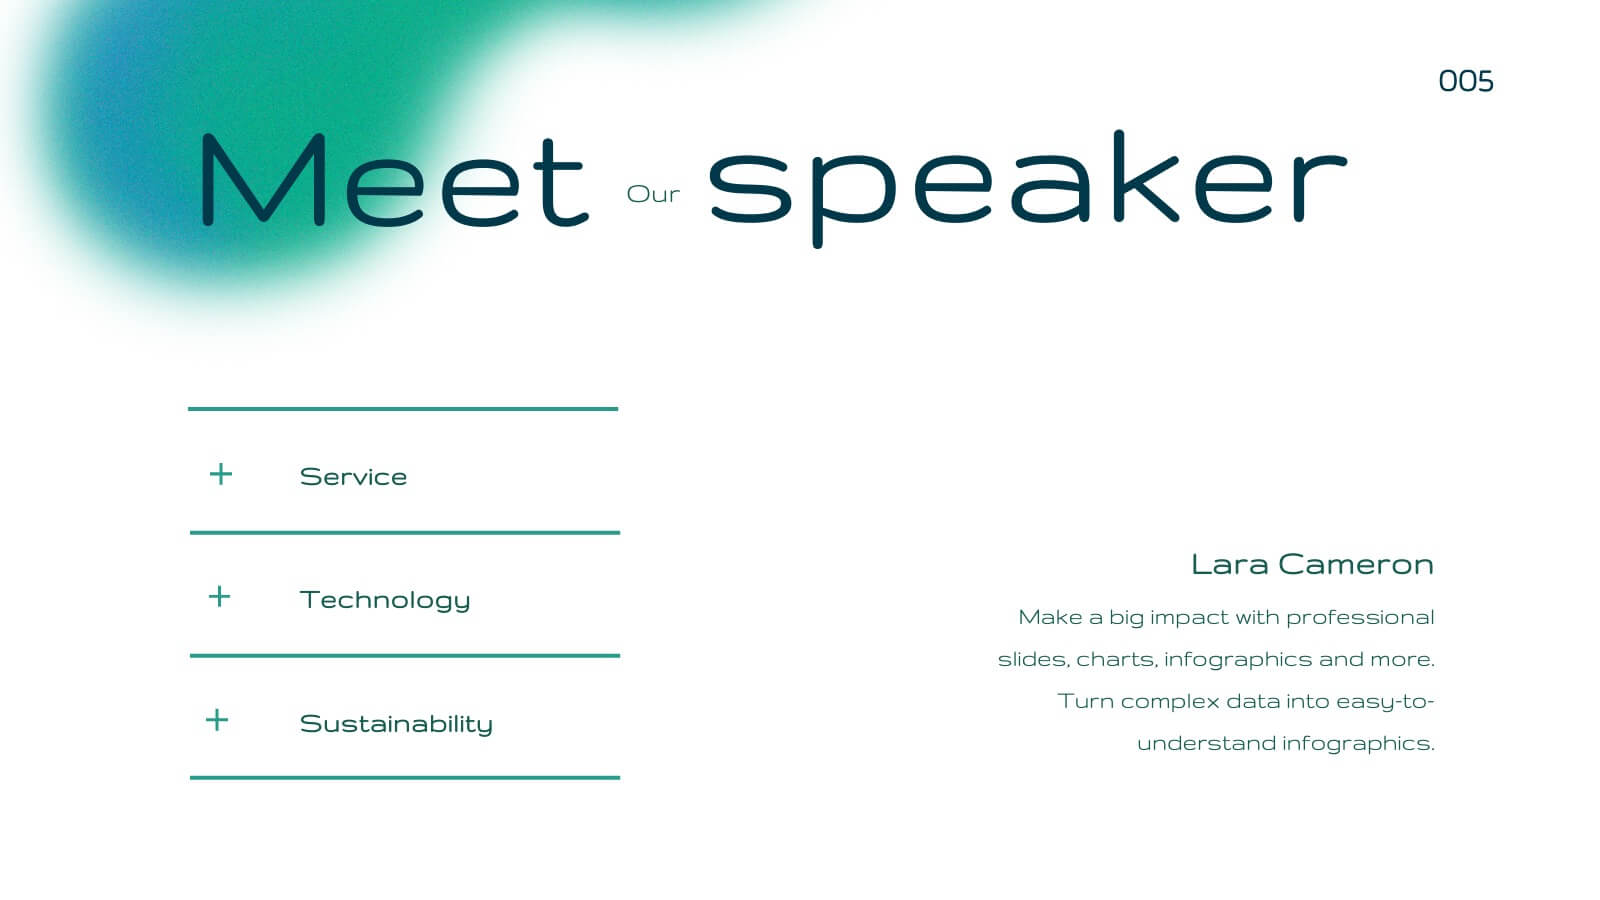
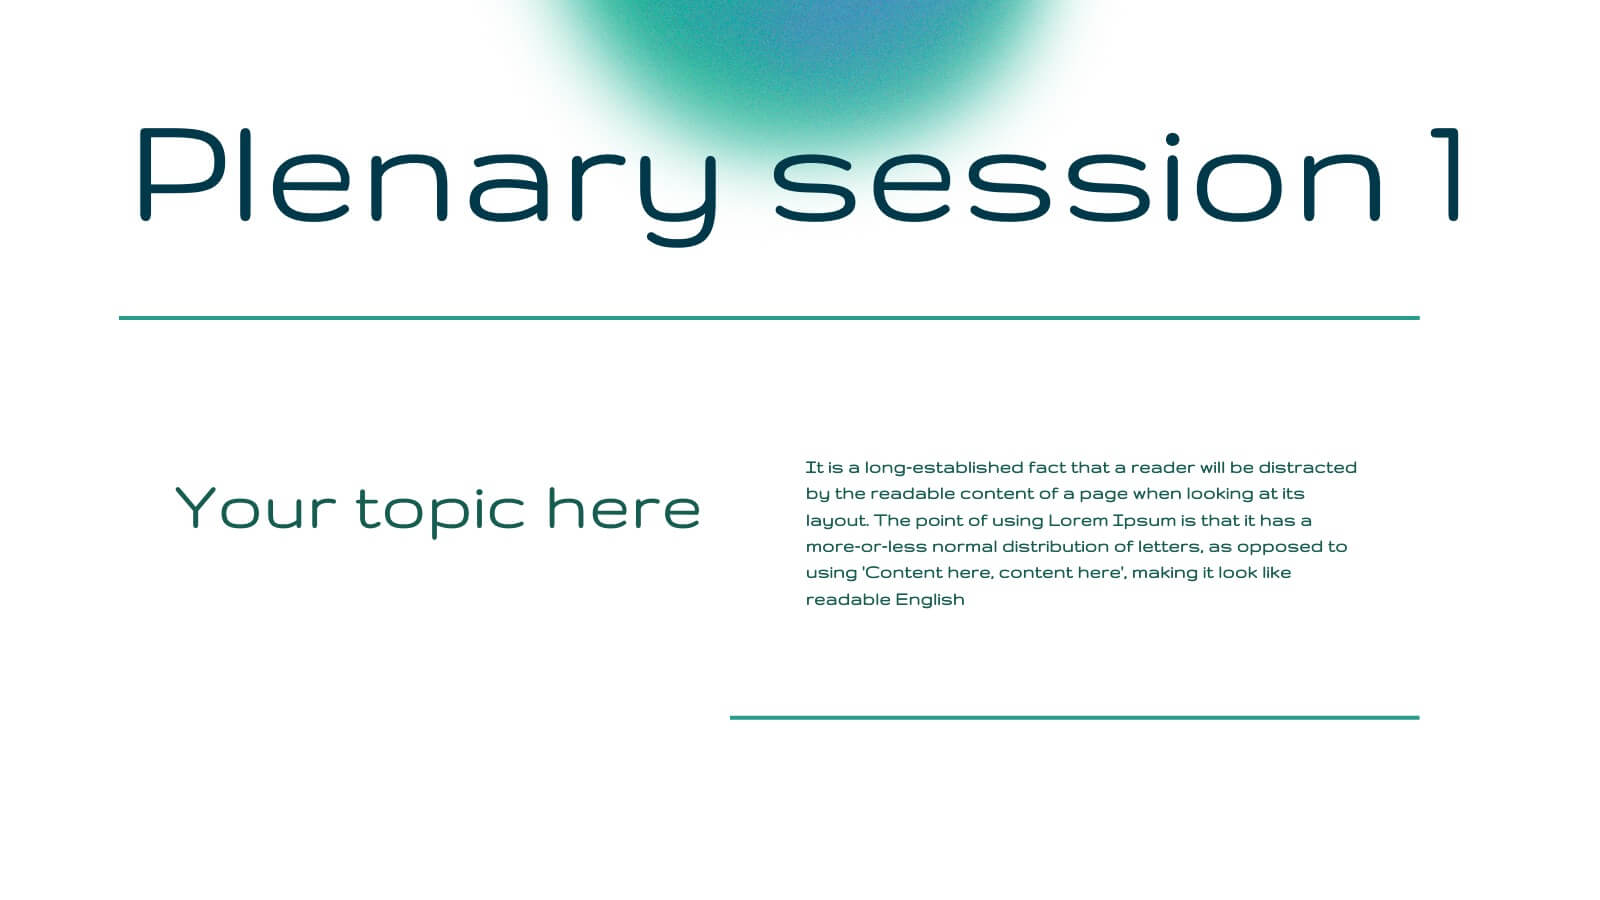
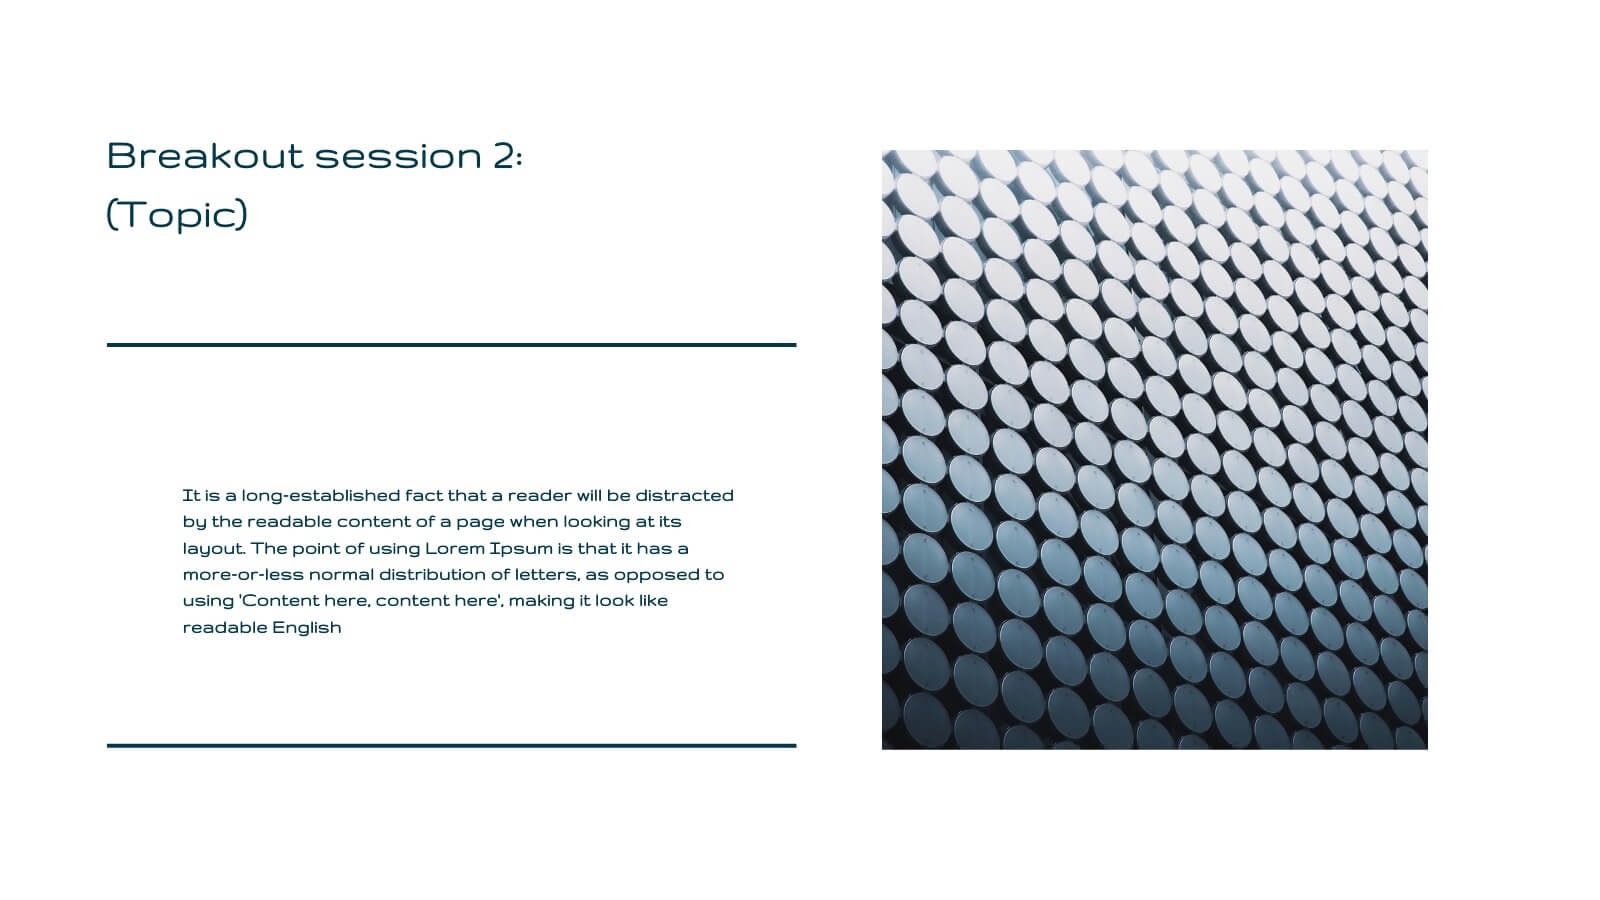
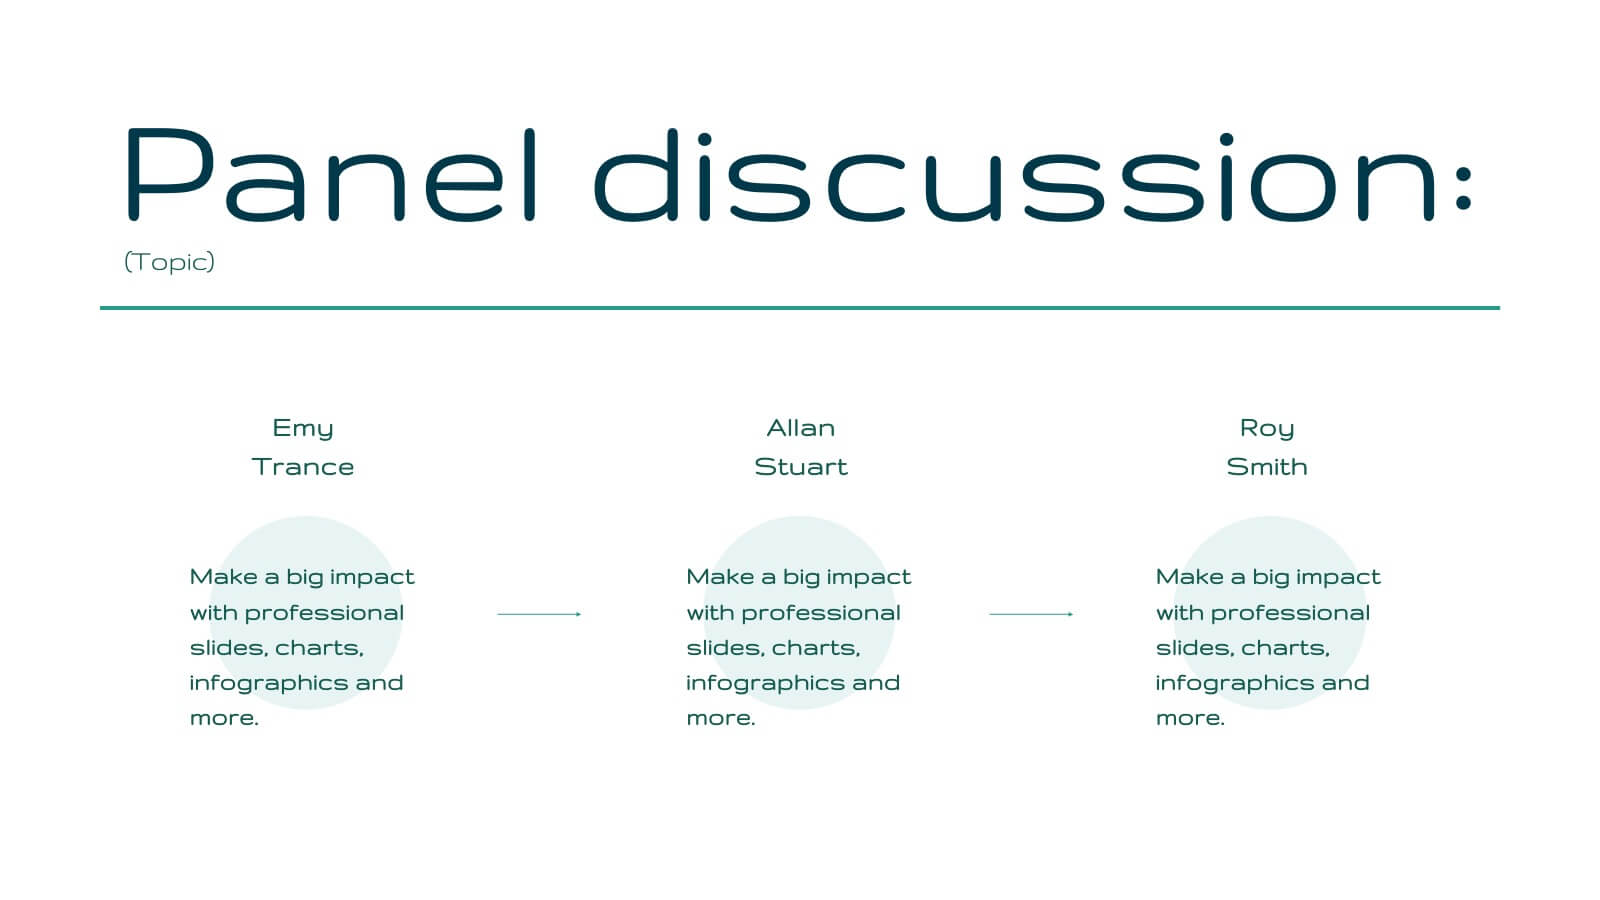
Blaze Business Operations Plan Presentation
Elevate your business presentations with this elegant, modern template designed for comprehensive business operations. Perfect for covering themes, objectives, workshops, and panel discussions, it ensures a professional and engaging delivery. The clean design and structured layout enhance clarity and impact. Compatible with PowerPoint, Keynote, and Google Slides, it’s versatile for any platform.


5 diapositivas
Business Hierarchy Pyramid Presentation
Present your business structure or priorities with clarity using our "Business Hierarchy Pyramid Presentation" template. This infographic elegantly segments different layers or levels within your organization, project, or planning strategy, with a pyramid design that visually emphasizes the foundational to advanced stages. Each level of the pyramid is distinctly colored and labeled, allowing you to easily insert key points or data relevant to each segment. Ideal for corporate presentations, strategic meetings, and management training, this template ensures your key concepts are organized and clearly communicated. Compatible with PowerPoint, Keynote, and Google Slides, it integrates effortlessly into your professional toolkit.