


Características


¿Tienes alguna pregunta?
Recomendar


6 diapositivas
AIDA Diagram
The AIDA Diagram is a simple and effective marketing tool used to guide the design of advertising and promotional materials with the goal of attracting and retaining customers. AIDA stands for Attention, Interest, Desire, and Action, and it represents the four stages a potential customer goes through when exposed to marketing content. This infographic template is a classic marketing and advertising framework used to understand and guide the consumer's journey through the buying process. This infographic is completely customizable and compatible with Powerpoint, Keynote, and Google Slides.


6 diapositivas
Task Automation Workflow
Illustrate streamlined processes, AI-powered sequences, or automated tasks with this gear-based workflow layout. Ideal for tech teams, business consultants, or IT professionals explaining step-by-step automation. Fully editable in PowerPoint, Keynote, and Google Slides—customize text, icons, and colors with ease.


4 diapositivas
Regional Economic Analysis of Europe Map Presentation
Explore Europe's economy with the Regional Economic Analysis of Europe Map template, a streamlined presentation designed to showcase economic data and trends across the continent. Designed for clarity, it includes a customizable map and data bars for financial statistics. Ideal for PowerPoint presentations, it helps professionals highlight economic trends and investment opportunities in different European regions effectively.


22 diapositivas
Garnet Qualitative Research Findings Presentation
This qualitative research findings presentation template provides a structured layout for sharing in-depth insights from your study. It includes sections for objectives, methodology, data analysis, key findings, and future directions, offering a clear flow for presenting research in a professional format. Perfect for researchers, it’s fully customizable in PowerPoint, Keynote, and Google Slides.


7 diapositivas
Adventure Challenge Infographic
The Adventure Challenge is a concept or product designed to encourage individuals or groups to step out of their comfort zones and embrace new, exciting experiences. This infographic template is designed to spark your inner explorer and conquer new horizons. This infographic is your compass to discover, challenge, and triumph in the realm of adventure. Compatible with Powerpoint, Keynote, and Google Slides. Illustrate the metaphorical mountains you'll climb during your adventure journey. This infographic will showcase various checkpoints of your adventure, guiding you as you chart your course and achieve milestones.


6 diapositivas
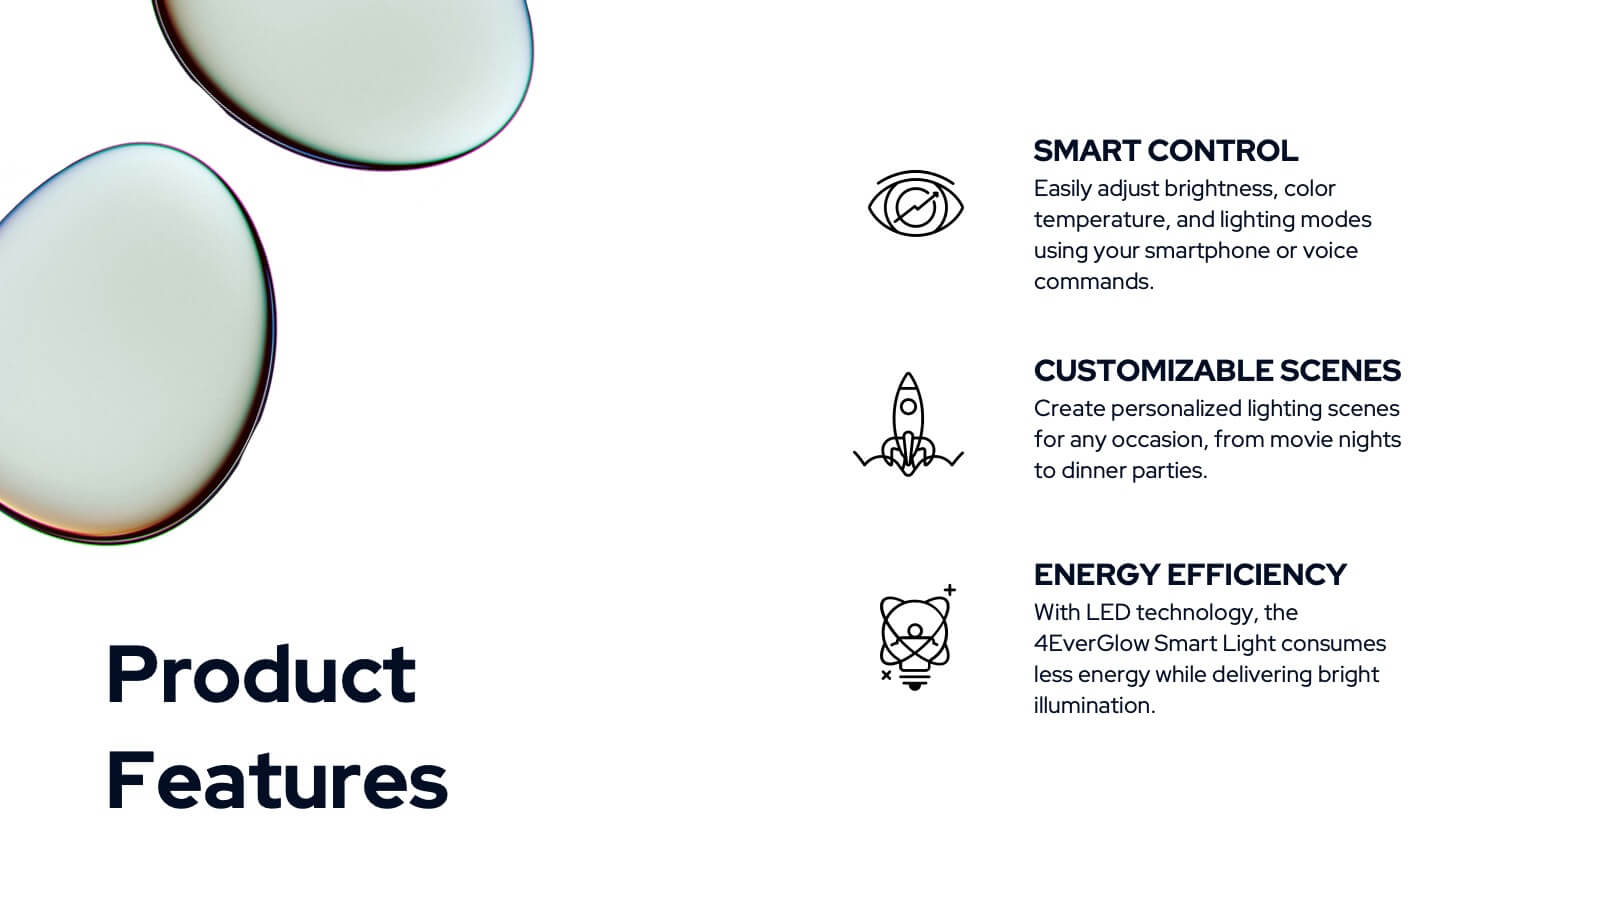
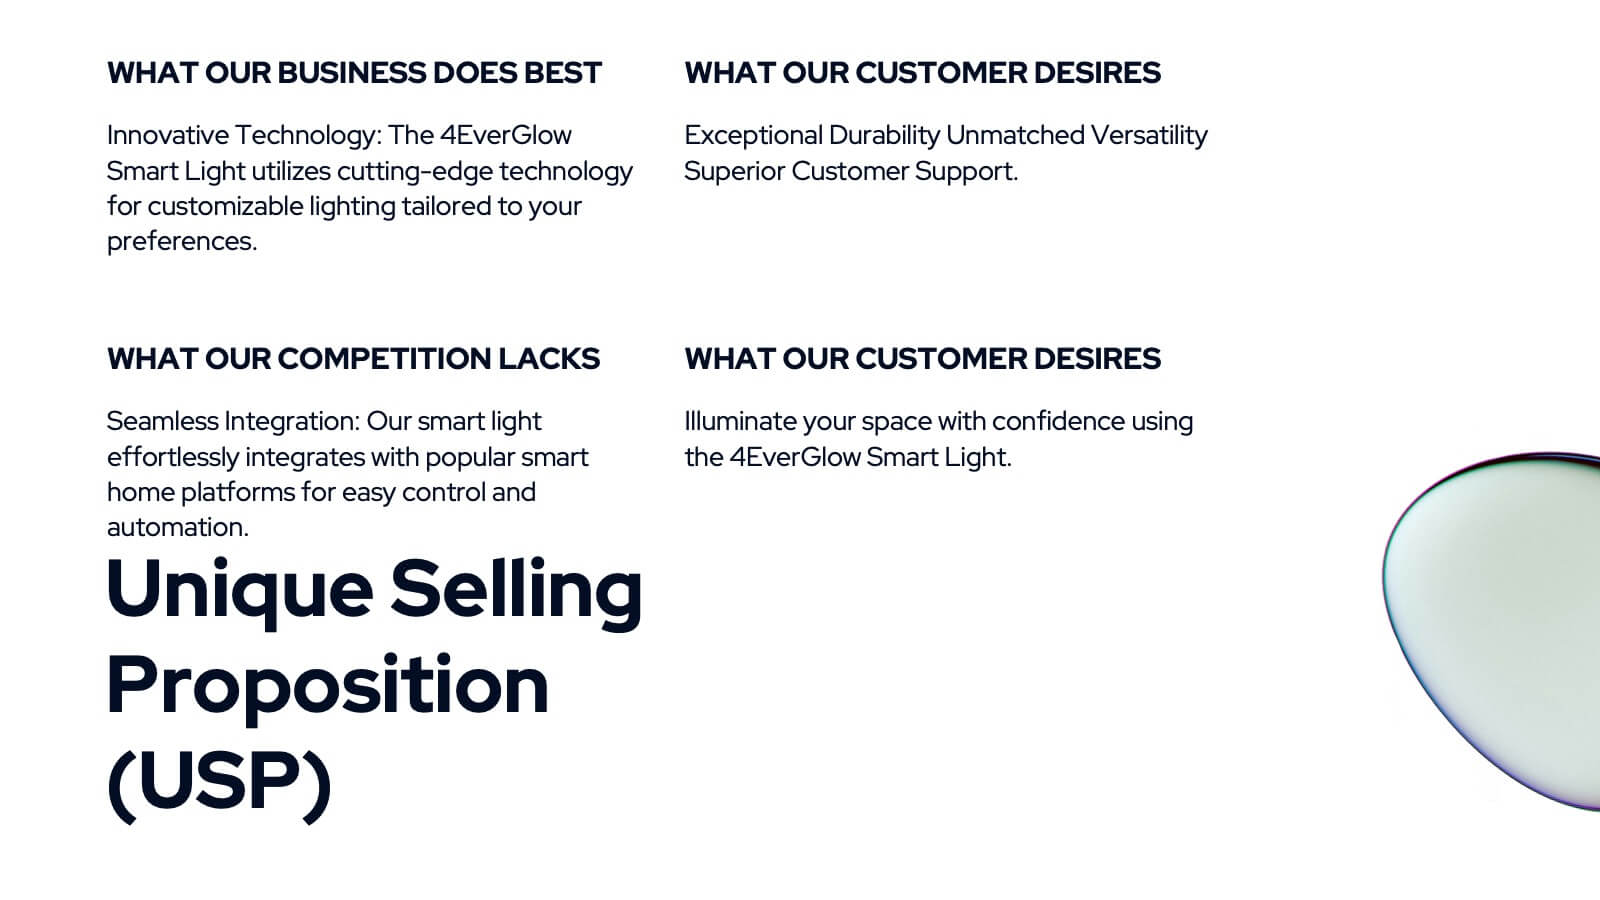
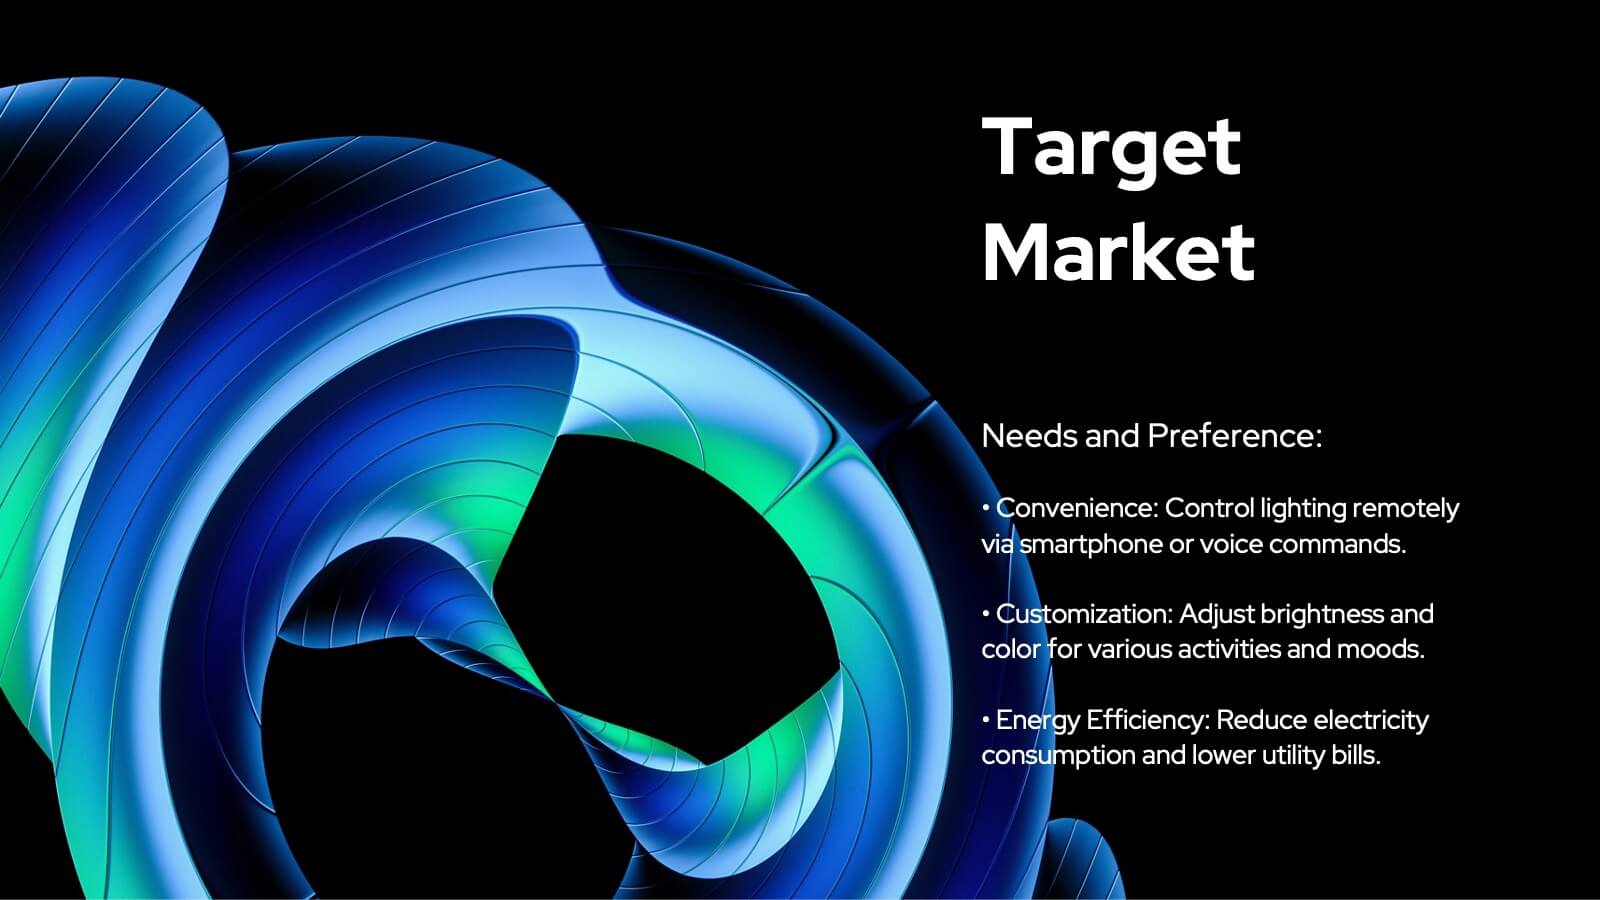
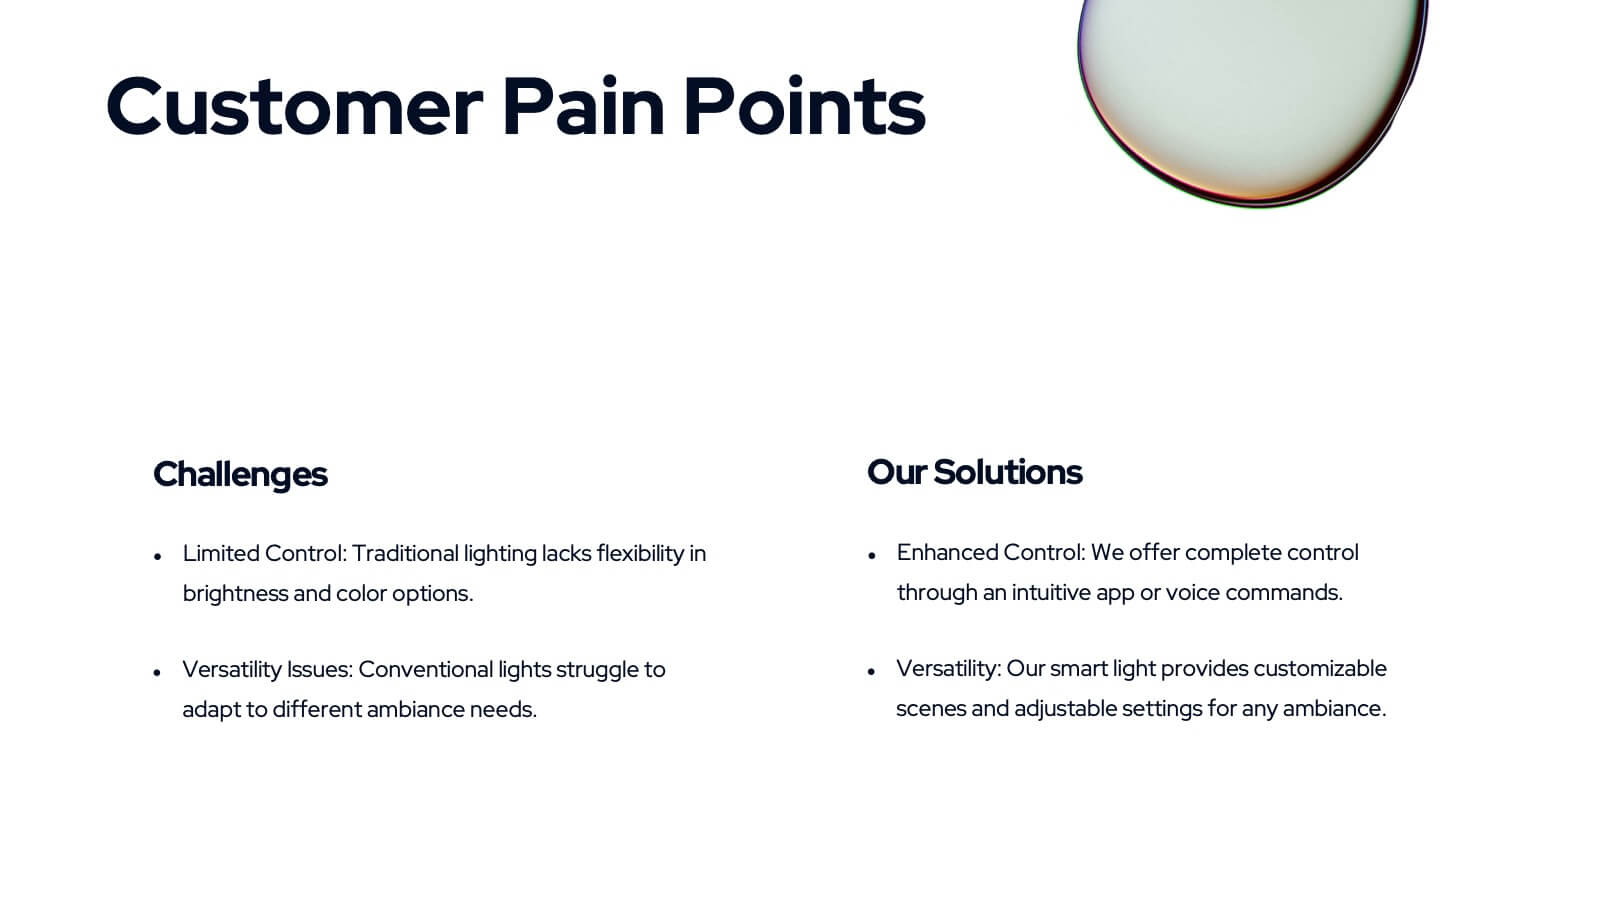
Business Value Proposition Presentation
Ignite your strategy with this captivating template that highlights your unique business value. This tool breaks down key value propositions, market differentiators, and customer benefits in an engaging format. Perfect for pitching ideas, it clarifies competitive advantages and growth opportunities. Compatible with PowerPoint, Keynote, and Google Slides for seamless presentations.


6 diapositivas
Bubble Chart Data Visualization Presentation
Make your data pop with visuals that tell a story at a glance. This modern presentation transforms raw numbers into clear, engaging bubble charts that simplify complex insights and comparisons. Fully editable and compatible with PowerPoint, Keynote, and Google Slides for effortless customization and professional results.


4 diapositivas
IT Infrastructure and Architecture Presentation
Enhance your IT Infrastructure and Architecture presentations with this structured infographic. Featuring a layered, circular design, this template is ideal for illustrating network systems, data management, cloud computing, and cybersecurity strategies. Fully editable and compatible with PowerPoint, Keynote, and Google Slides.


5 diapositivas
Annual Overview Report Template Presentation
Bring your yearly achievements to life with this sleek and structured layout designed for clarity and impact. Ideal for summarizing company performance, milestones, and future goals, it organizes data into easy-to-follow visuals. Fully editable and compatible with PowerPoint, Keynote, and Google Slides for a smooth presentation experience.


6 diapositivas
Network Solution Infographic
Network Solution refers to a system of interconnected components or entities that work together to achieve a specific purpose, whether that's communication, collaboration, or something else. This infographic template can be a powerful way to visually represent various aspects of a network, whether it's a computer network, social network, or any interconnected system. This is fully customizable and compatible with Powerpoint, Keynote, and Google Slides. This allows you to keep the infographic visually appealing, informative, and easy to understand. The goal is to help your audience grasp complex network concepts at a glance.


5 diapositivas
Health Care Access and Equity Infographics
Health Care Access refers to the ability of individuals and communities to obtain medical services and receive appropriate care when needed. These infographic templates serve as an educational and advocacy tool, helping to raise awareness about the importance of equitable healthcare access and the need for addressing disparities. Whether used in healthcare organizations, educational settings, or public awareness campaigns, this template effectively communicates the urgency of achieving health equity and encourages individuals to take action towards a more equitable healthcare system. Compatible with Powerpoint, Keynote, and Google Notes.


6 diapositivas
Big Data Analytics Presentation
The "Big Data Analytics Presentation" template is expertly designed to visualize global data analytics strategies across different regions. The map highlights key areas in distinct colors, drawing attention to where data initiatives are being implemented or where significant market trends are observed. Each region on the map corresponds to specific titles that can be customized to represent various analytical focuses such as market penetration, user demographics, or revenue growth. Accompanying the map are percentage circles that quantify planning, execution, and success rates, making this template invaluable for analysts, data scientists, and corporate strategists who need to present complex data in an easily digestible format. This visual tool is perfect for enhancing presentations, strategic meetings, and reports with a clear, concise, and visually engaging representation of data-driven insights.


6 diapositivas
Project Proposal Timeline Infographic
Effectively manage and present the timelines of your projects with our Project Proposal Timeline Templates. Designed for clarity and impact, these templates aid project managers, planners, and coordinators in outlining the key milestones and phases of projects, ensuring all stakeholders are aligned with the project schedule. Each slide in the collection features a streamlined design, utilizing shades of green to emphasize different stages and important dates. The templates are equipped with intuitive layouts that include Gantt charts, timelines, and lists, making it easy to visualize the sequence of activities, dependencies, and deadlines. Customizable for various types of projects, these timeline slides allow for detailed specifications, enabling you to adjust durations, update tasks, and refine objectives as your project evolves. Whether used for internal planning or external presentations, these templates help convey your project's scope and schedule in a professional and easily understandable manner.


5 diapositivas
AI for Business Innovation Presentation
The "AI in Business" presentation template showcases how AI can be applied across different business processes. It features a friendly robot icon that creatively represents AI's role in modern business, making it visually engaging. The four connected nodes A, B, C, and D likely detail specific applications or case studies of AI in business, such as data analysis, automation, customer interaction, and innovation. This layout is excellent for presentations that aim to explain complex technological implementations in a straightforward and accessible manner, perfect for corporate training or stakeholder briefings.


21 diapositivas
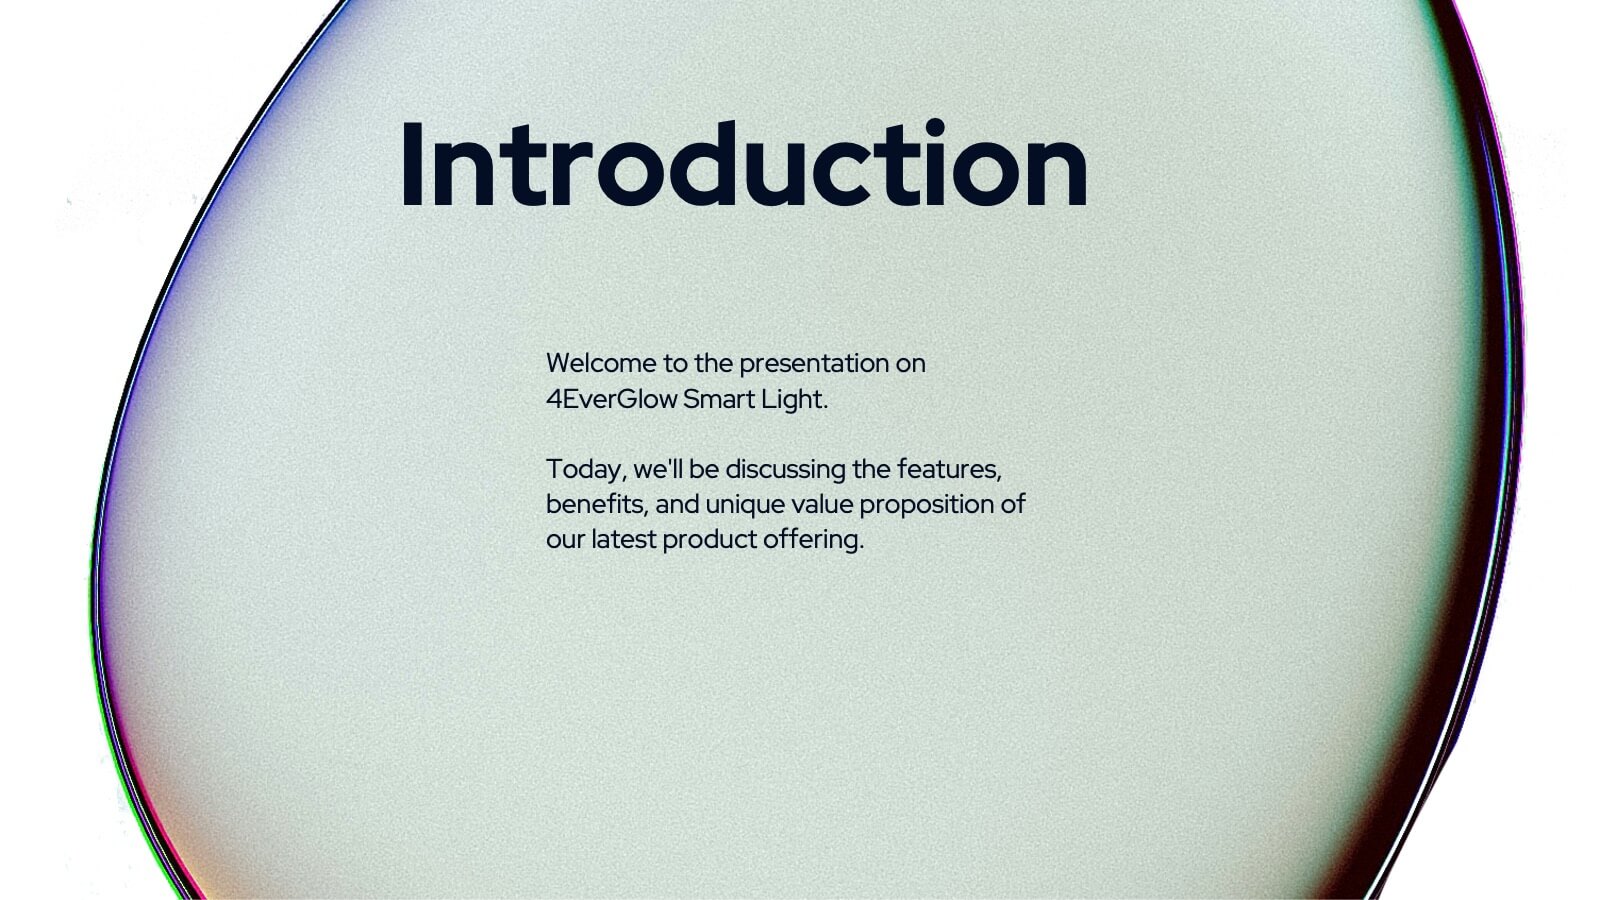
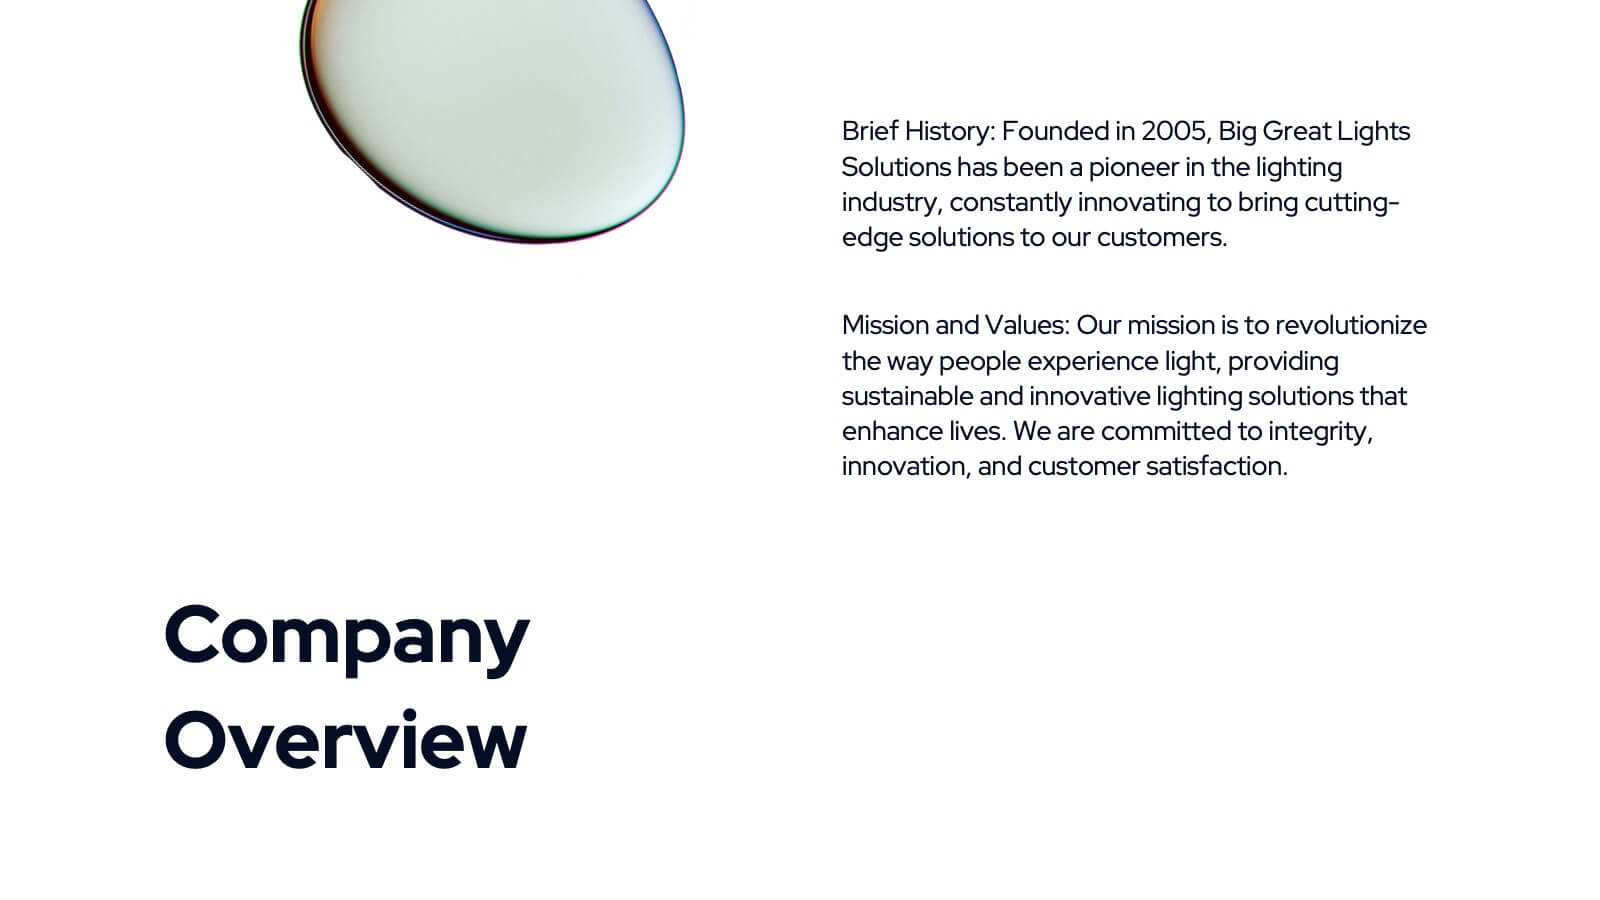
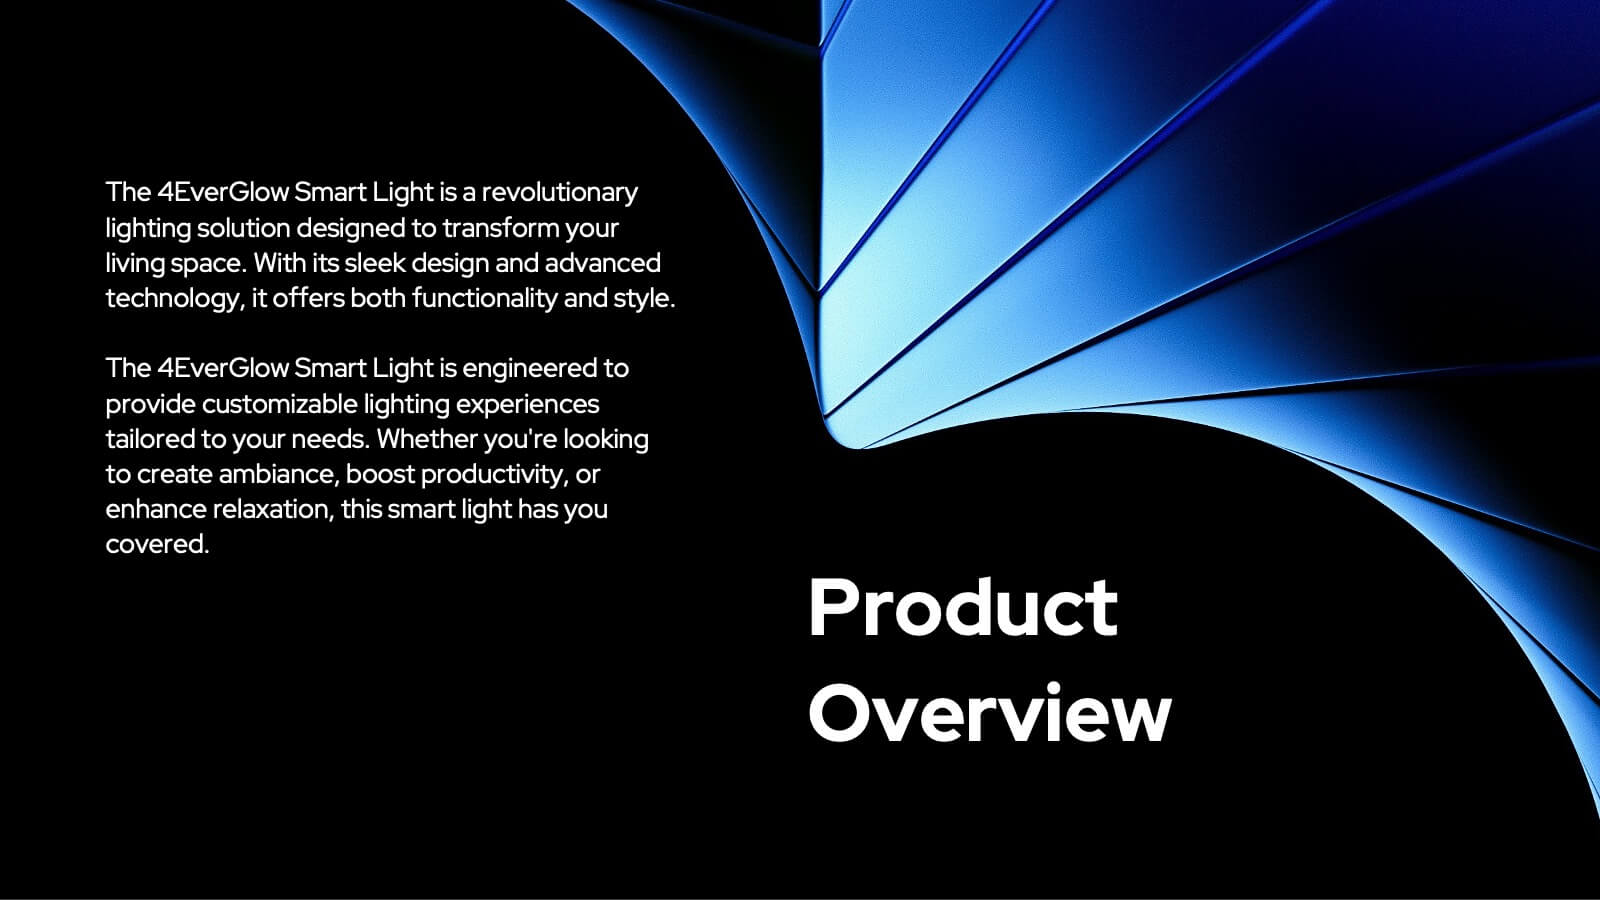
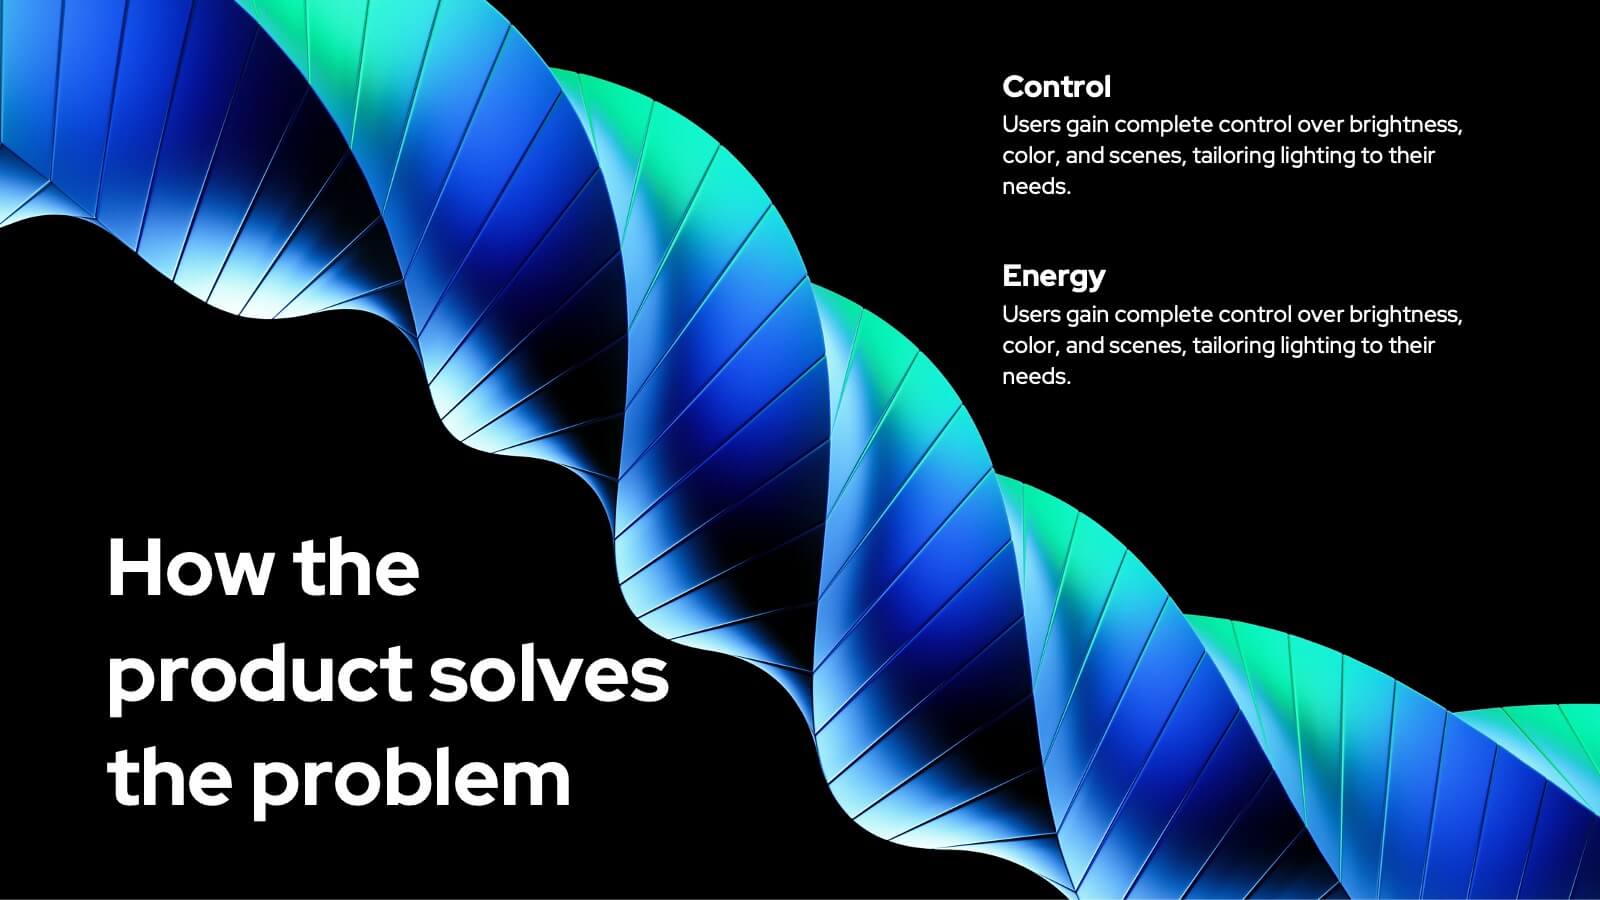
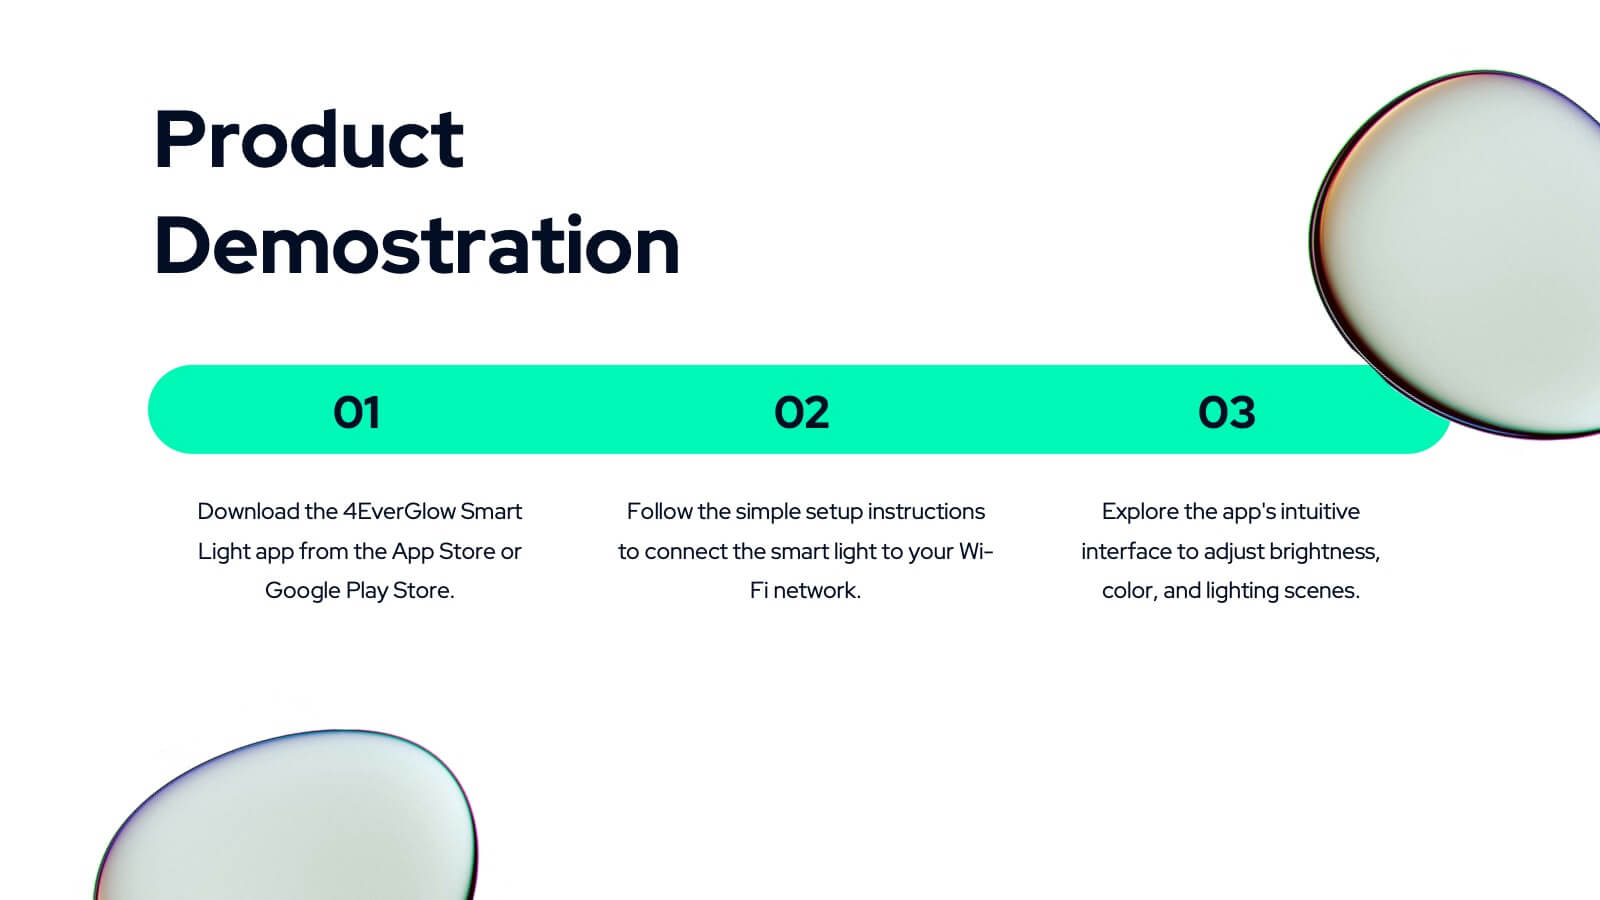
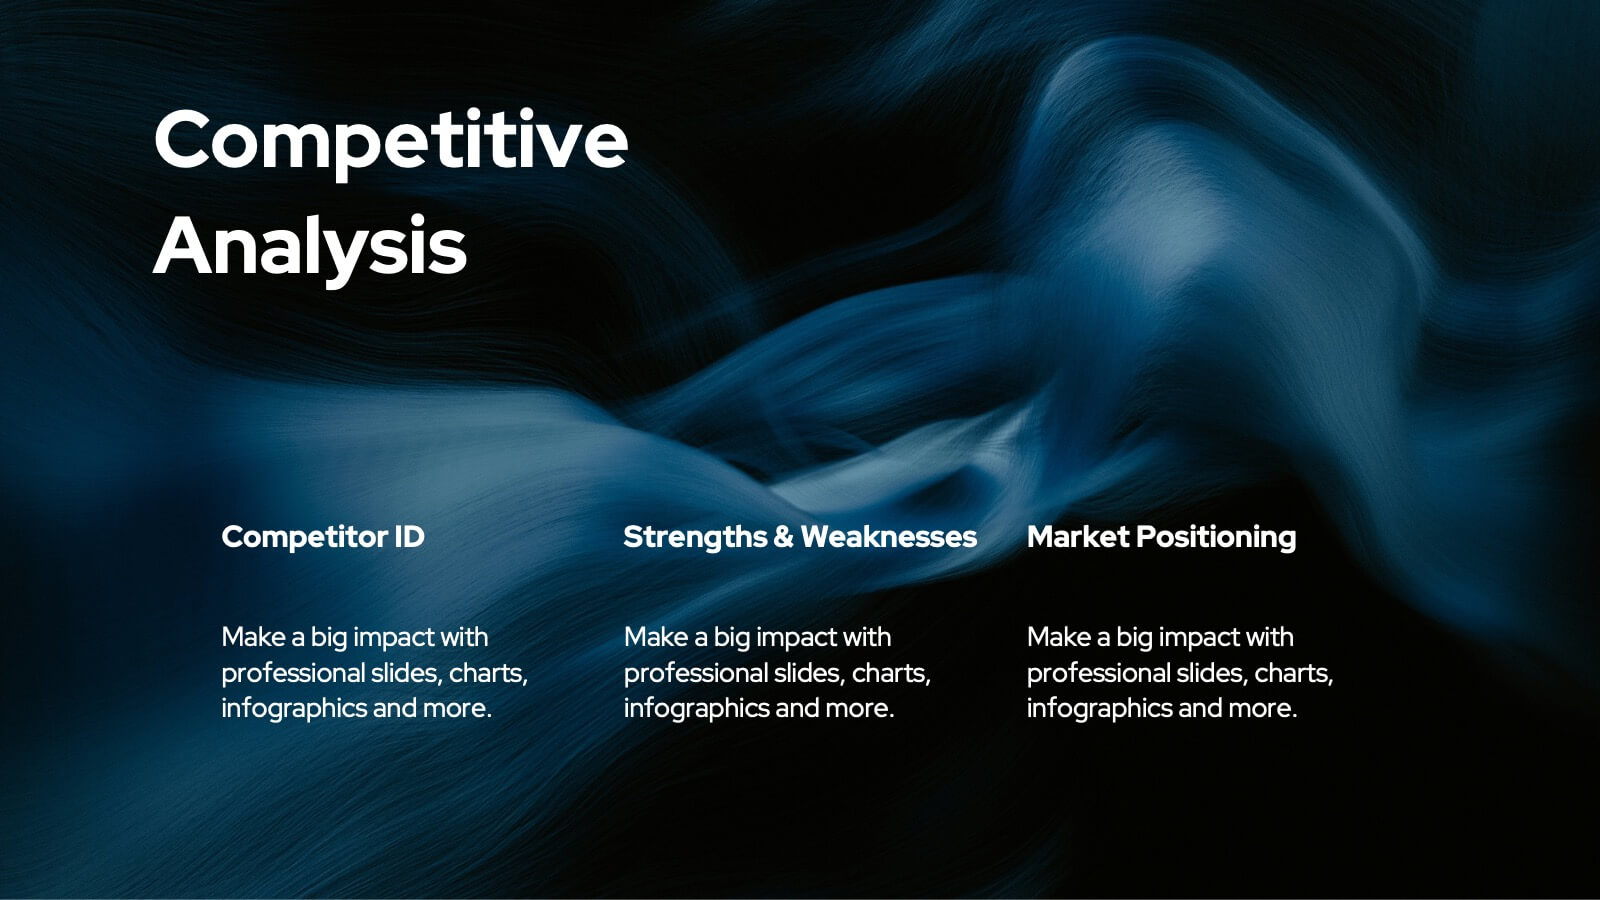
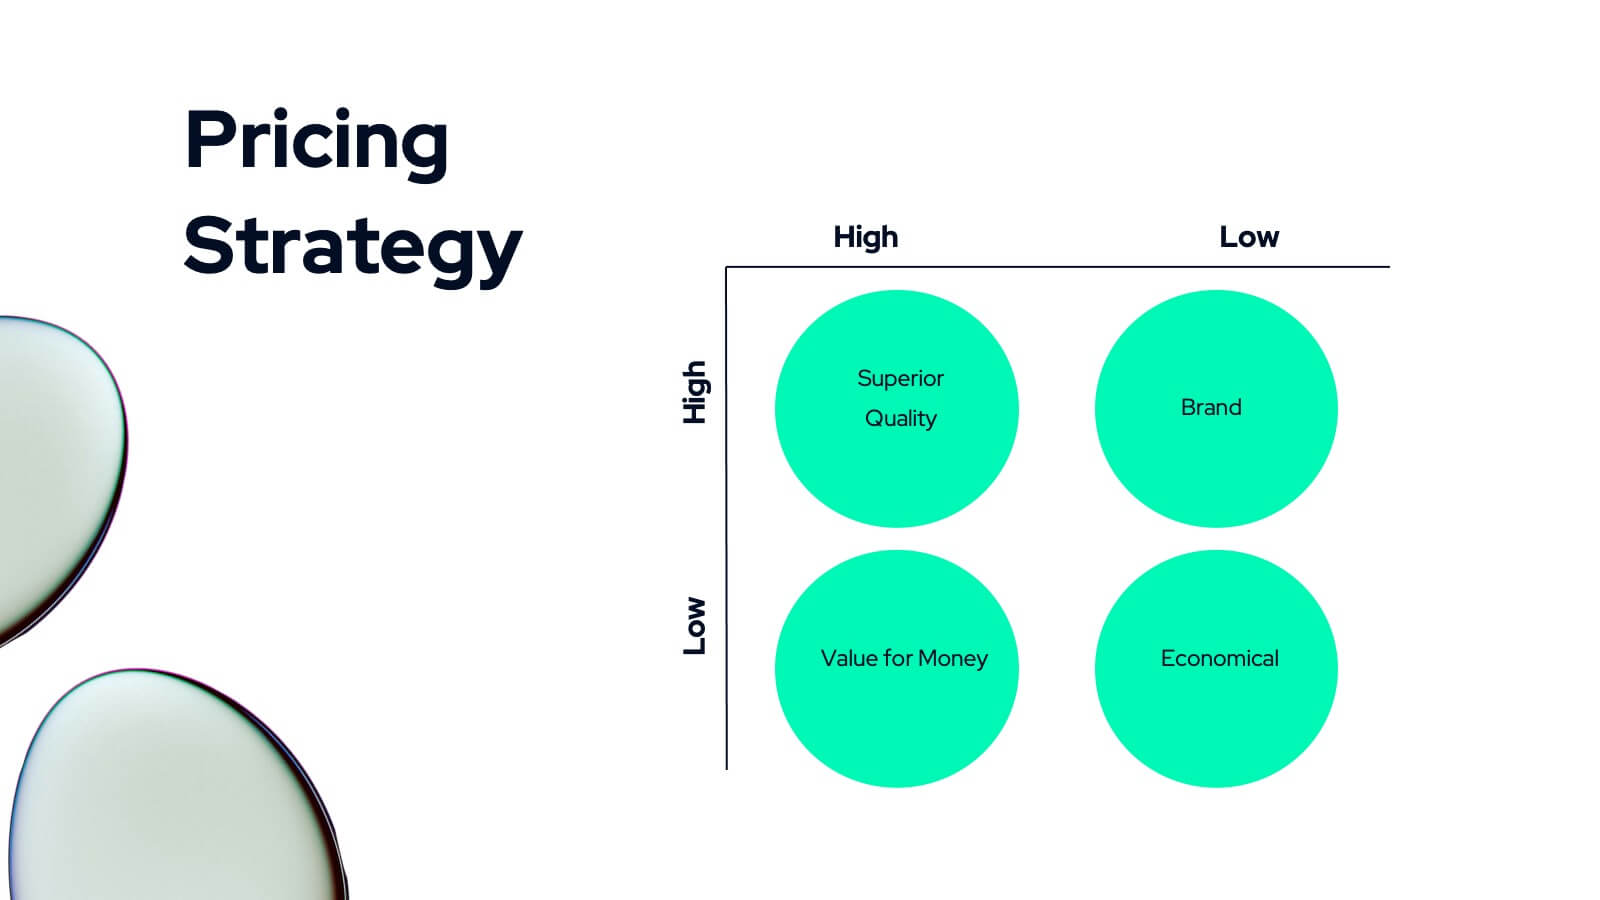
Selkie New Product Proposal Presentation
Dive into your next big idea with this sleek, Selkie-inspired presentation template, designed for presenting a new product proposal! Highlight key features, market opportunities, and potential growth in a visually captivating format that flows effortlessly. Engage your audience and make an impact. Compatible with PowerPoint, Keynote, and Google Slides for easy customization.


7 diapositivas
Watercolor Infographic Presentation Template
A Watercolor Infographic is a type of visual representation that combines elements of traditional watercolor paintings with information and data. This template uses soft, flowing lines and splashes of color to create an eye-catching design that communicates information in a unique and creative way. This Watercolor infographic can be used to showcase statistics, trends, or other information in a visually appealing way, making them ideal for presentations, reports, and marketing materials. This template is perfect for teachers, students, or anyone who wants to make their information stand out.


5 diapositivas
Tiered Strategy Framework Pyramid Presentation
Break down your plan into clear, actionable steps with this Tiered Strategy Framework Pyramid presentation. Each arrow-shaped tier helps visualize hierarchical strategies, workflows, or growth levels. Use this layout to communicate priorities, initiatives, or milestones in a sleek and modern format. Fully editable in Canva, PowerPoint, or Google Slides.