


Características


¿Tienes alguna pregunta?
Recomendar


2 diapositivas
Pink Ribbon Event Slide Deck Presentation
Bring awareness and compassion to your presentation with a bold ribbon design that symbolizes unity and support. Perfect for health campaigns, charity events, or educational talks, this layout helps you share key messages with clarity and impact. Fully compatible with PowerPoint, Keynote, and Google Slides for easy customization.


4 diapositivas
Cost Comparison Analysis Chart Presentation
Turn your price evaluations into something visually compelling with this sleek and modern layout. Perfect for showcasing product features, service packages, or market comparisons, it simplifies decision-making with a clear side-by-side design. Fully editable and compatible with PowerPoint, Keynote, and Google Slides for effortless customization.


7 diapositivas
Smile Rating Operation Infographic
A smile rating is a way to measure or gauge satisfaction, happiness, or approval, often used in customer service, feedback systems, or surveys. This infographic template involves the use of smiley faces or emojis to represent different levels of contentment or approval. The purpose is to make feedback collection more engaging and easier for you and your audience. This template allows you to introduce the concept of a smile rating that celebrates smiles and rates experiences. This infographic will showcase how collective smiles paint a powerful picture of happiness and customer satisfaction.


14 diapositivas
Business Proposal Presentation
Step into a world of strategic planning and execution with the Business Plan presentation template. The leading slide grabs attention, emblazoned with the bold title 'Business Plan', ready to unfold the story of your enterprise. Progress through a detailed Table of Contents, foreshadowing the comprehensive analysis within. You'll find meticulous breakdowns of data analytics, budget and pricing, benefits for clients and customers, and returns on investment. Each segment is crafted to deliver a thorough examination of your business model and projections. Punctuating the proposal are thought-provoking quotes and a clear call to action, guiding your potential partners towards engagement. A friendly 'We will be delighted to work with you' solidifies the welcoming approach, and the credits slide ensures due acknowledgement of all sources and contributions. This template is a beacon for any business aiming to present a compelling case for partnership or investment.


5 diapositivas
Facts About Vegan Infographics
Veganism is a lifestyle and dietary choice that seeks to avoid the use of animal products and by-products. These infographic templates are perfect for showcasing key facts and information about veganism. This allows you to effectively communicate the positive impacts of veganism on health, the environment, and animal welfare. It serves as an engaging and persuasive resource to promote awareness, education, and understanding about the benefits of a vegan lifestyle. The templates features a variety of engaging and eye-catching infographic designs, each focusing on a specific aspect of veganism. Compatible with Powerpoint, Keynote, and Google Slides.


7 diapositivas
Budget Forecasting Infographic Presentation Template
The process of budget forecasting consists of estimates and analysis. By projecting future revenue and expenses you can plan for the future of your business. This technique aims to provide a quantitative assessment of an organization's financial position at a specific point in time. This template will help you budget forecast, organize income and expenses, and track spending over time. This template can be used to give a professional presentation on forecasting and projections. The diagrams and graphs ensure that the numbers are easy to read while the ideas they represent are clearly explained.


7 diapositivas
Fishbone Diagram Infographic Presentation Template
A Fishbone diagram, also called a cause-and-effect diagram, is a tool used to identify and analyze the potential causes of a particular problem or issue. It is named for its shape, which looks like a fish skeleton with the problem or effect as the head and the various causes as the bones. This template includes a variety of different fishbone diagrams, which are representations of fish skeletons that help show you the different causes of a problem. This template is easy to use and you can add your own information to make it look just how you want, and show how different causes are connected.


5 diapositivas
Pandemic Preventive Measures Infographics
Pandemic Preventive Measures refer to a set of actions taken to prevent the spread of infectious diseases. These vertical infographics are focused on informing the audience about the preventive measures that can be taken during a pandemic. They contains various customizable elements such as icons, charts, and diagrams that can be easily edited to suit your needs. The design is clean and easy to follow, making it an effective tool for communicating important information. Educate your audience on the essential pandemic preventive measures, and provide them with the necessary information to stay safe and healthy!


6 diapositivas
Six Sigma Process Improvement Presentation
Dive into efficiency with our Six Sigma Process Improvement template! This presentation guide maps out each step from Define to Control, ensuring your project targets are met with precision. Ideal for quality assurance and process optimization, it's compatible with PowerPoint, Keynote, and Google Slides. Perfect for professionals keen on streamlining operations and enhancing productivity.


23 diapositivas
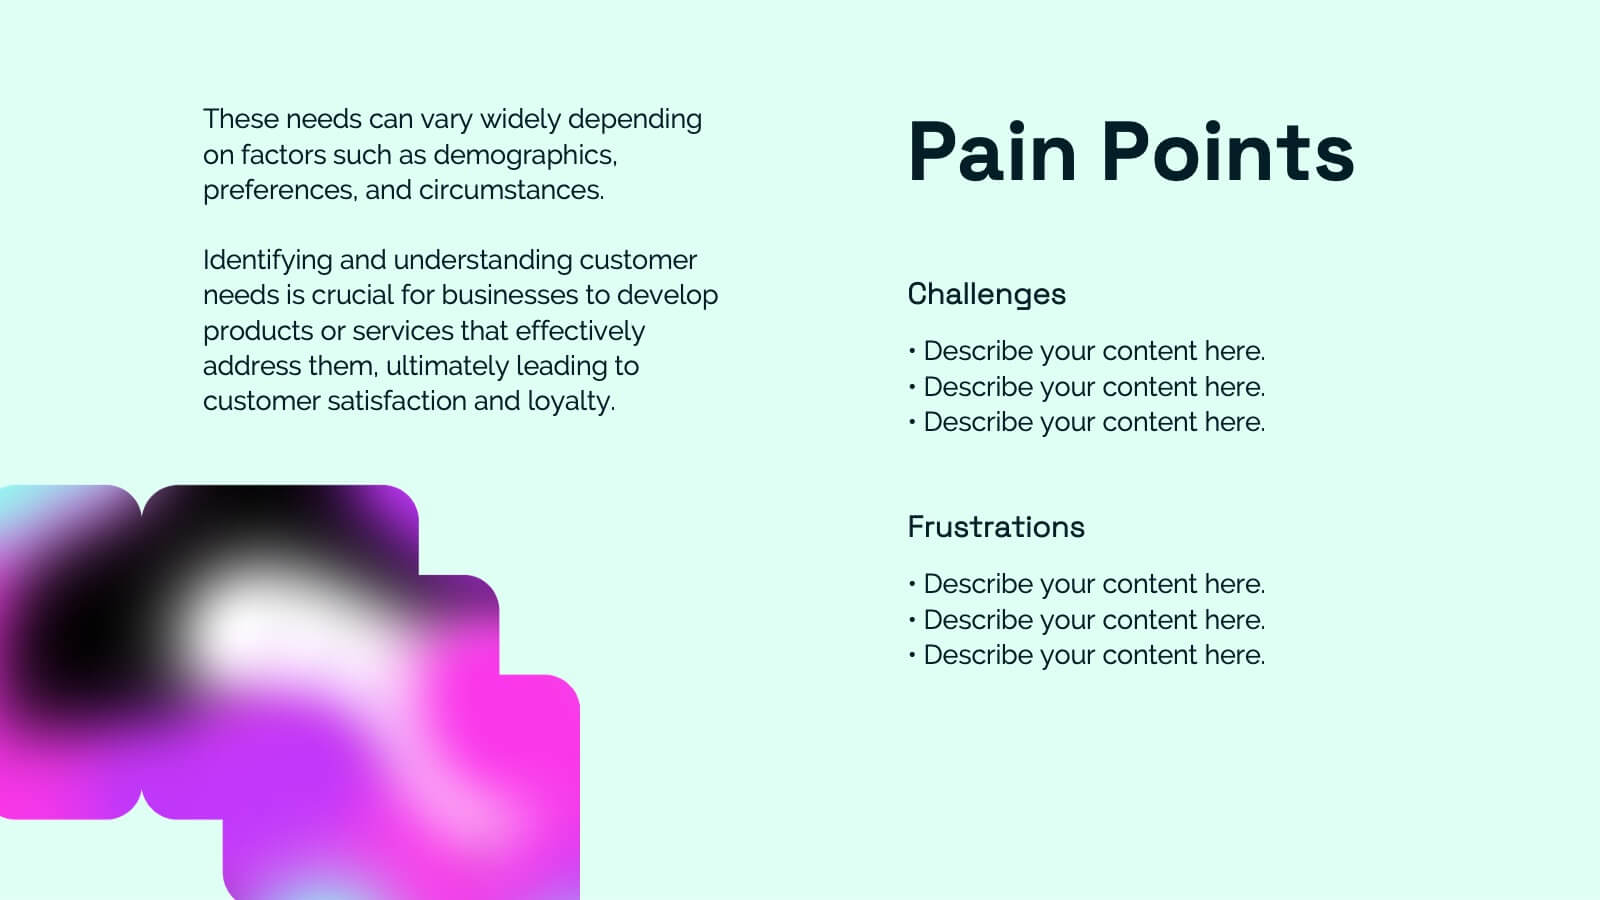
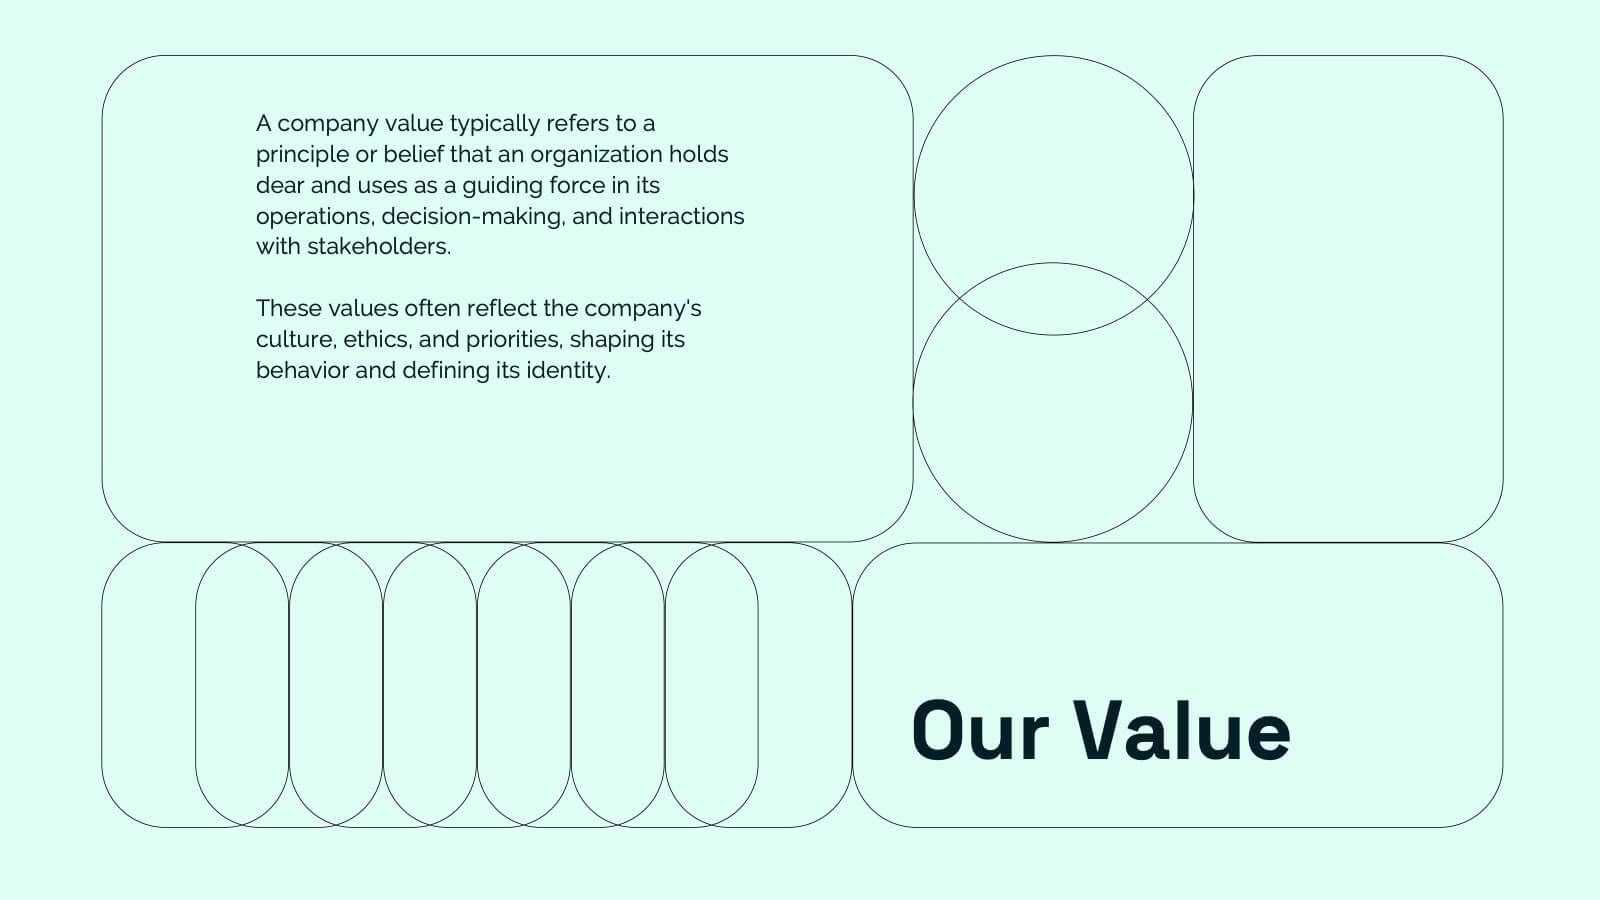
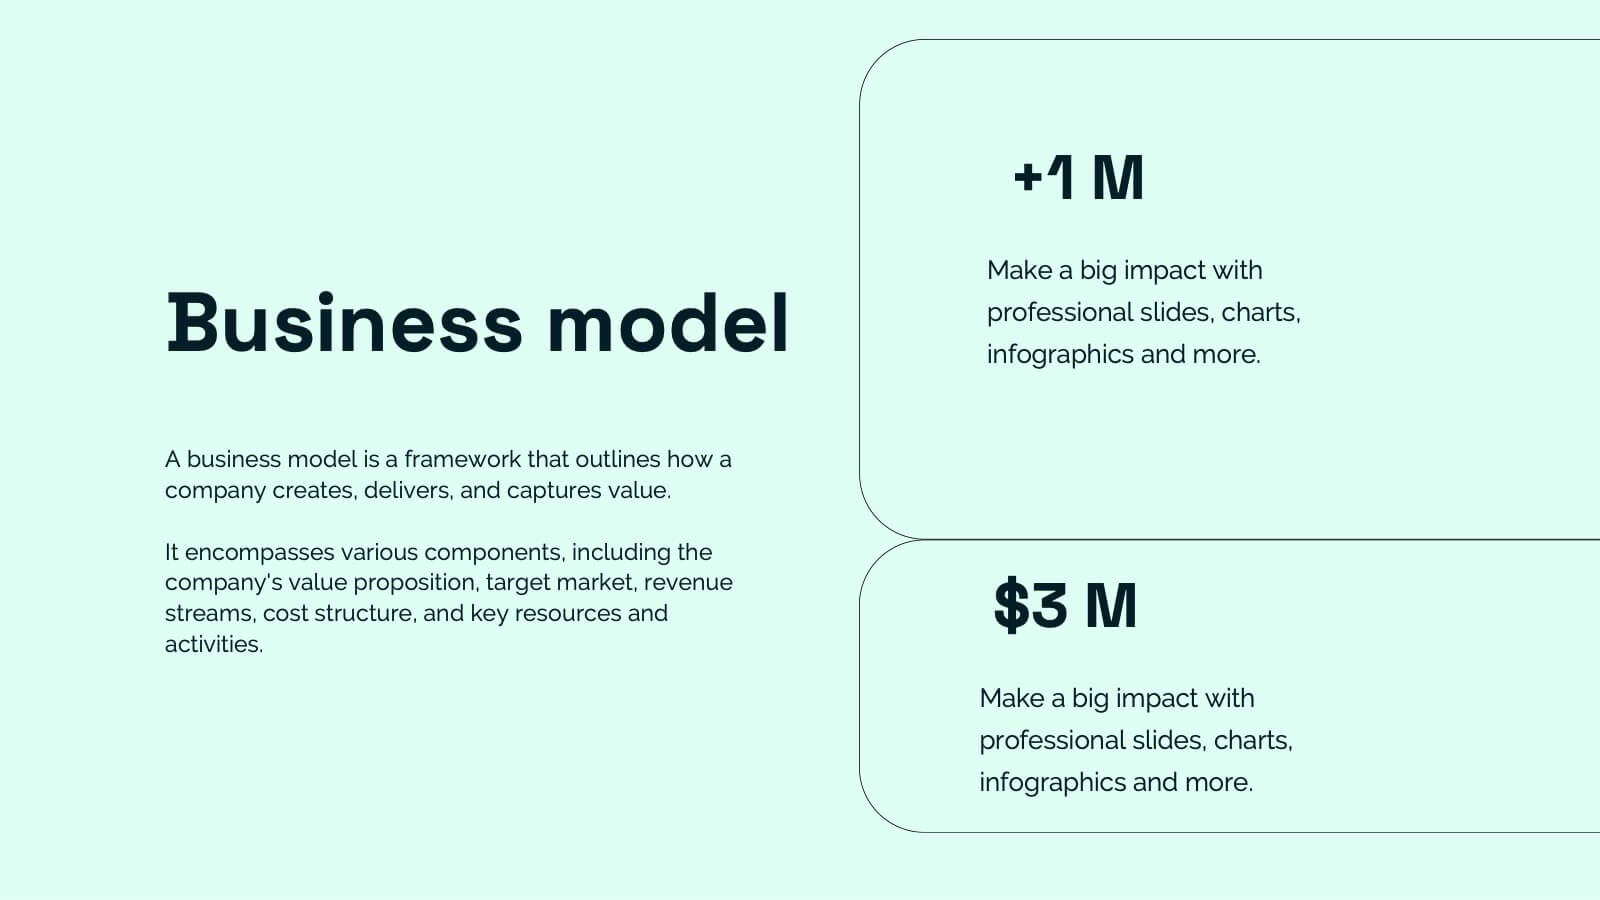
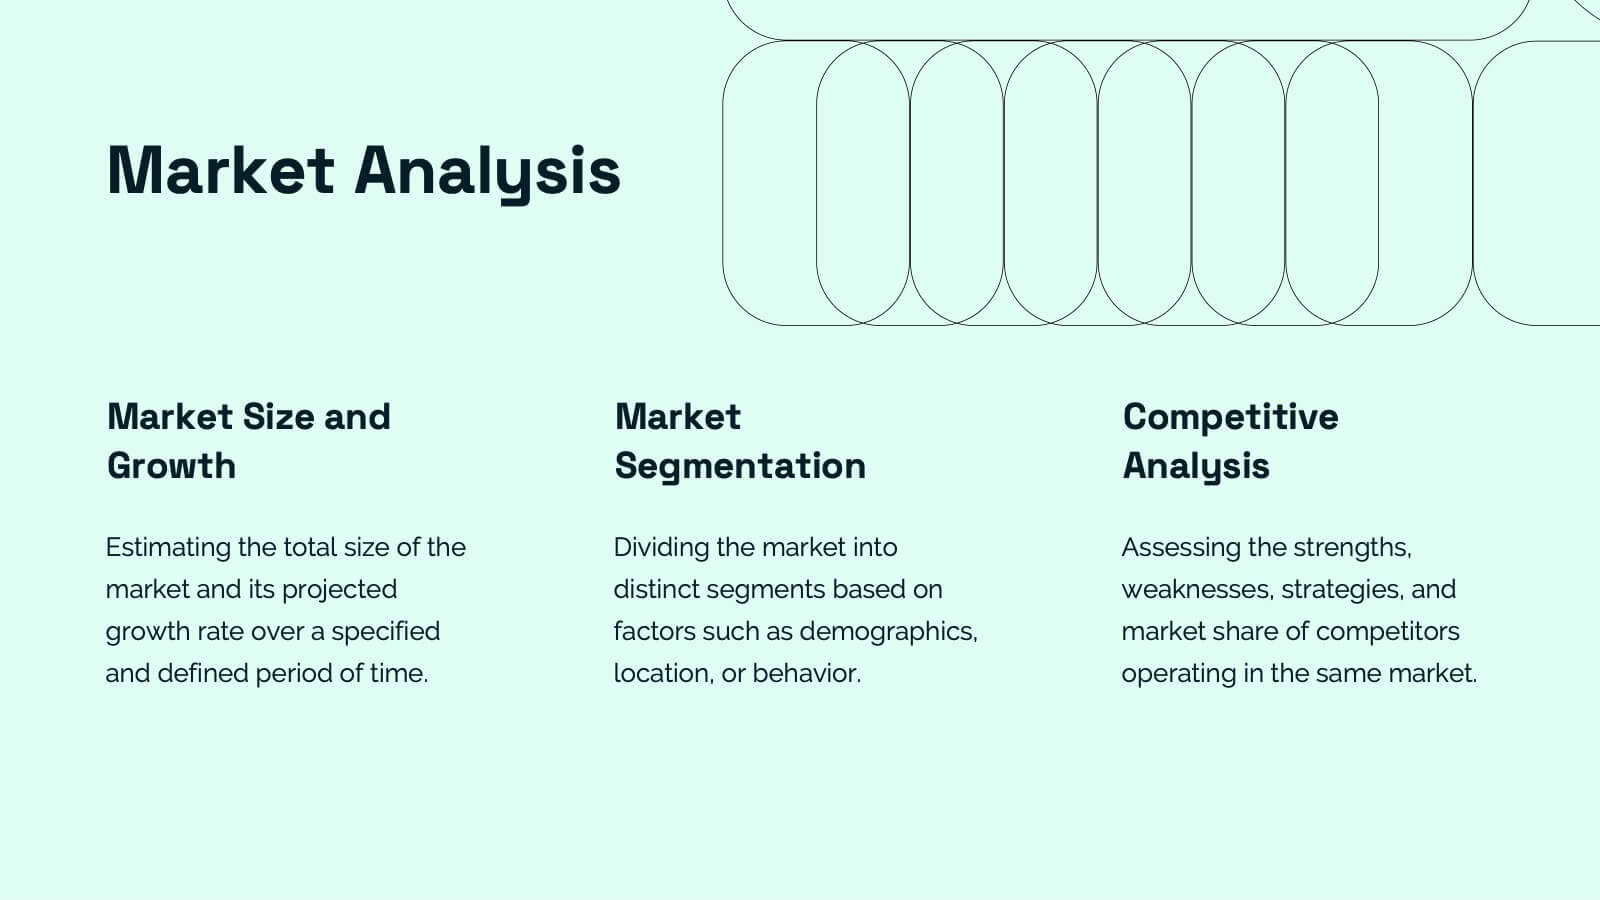
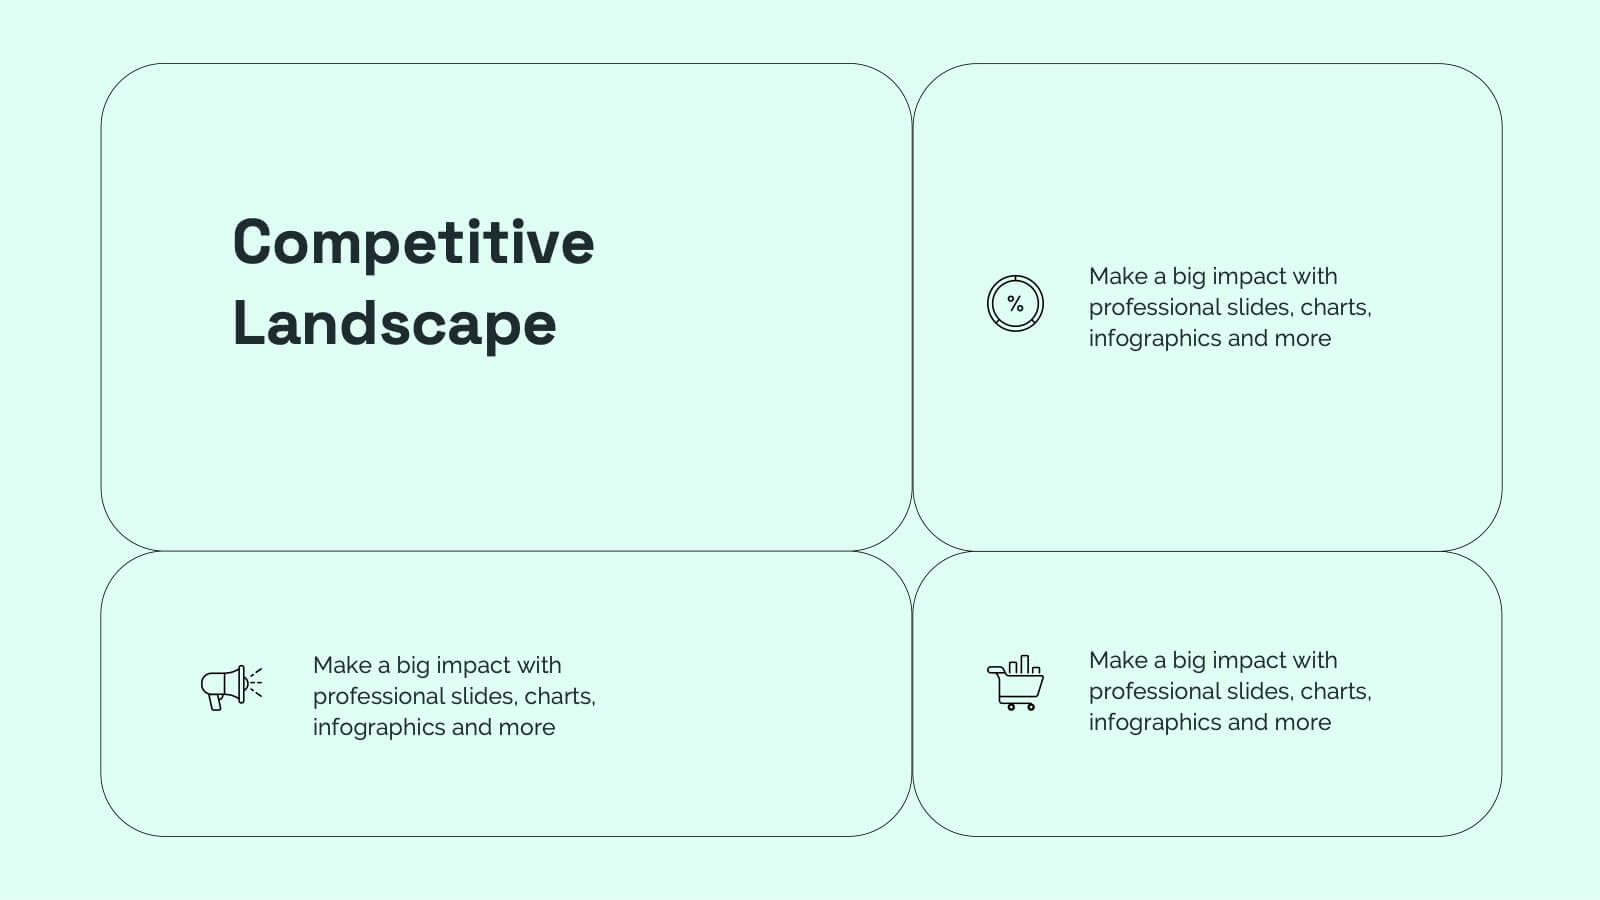
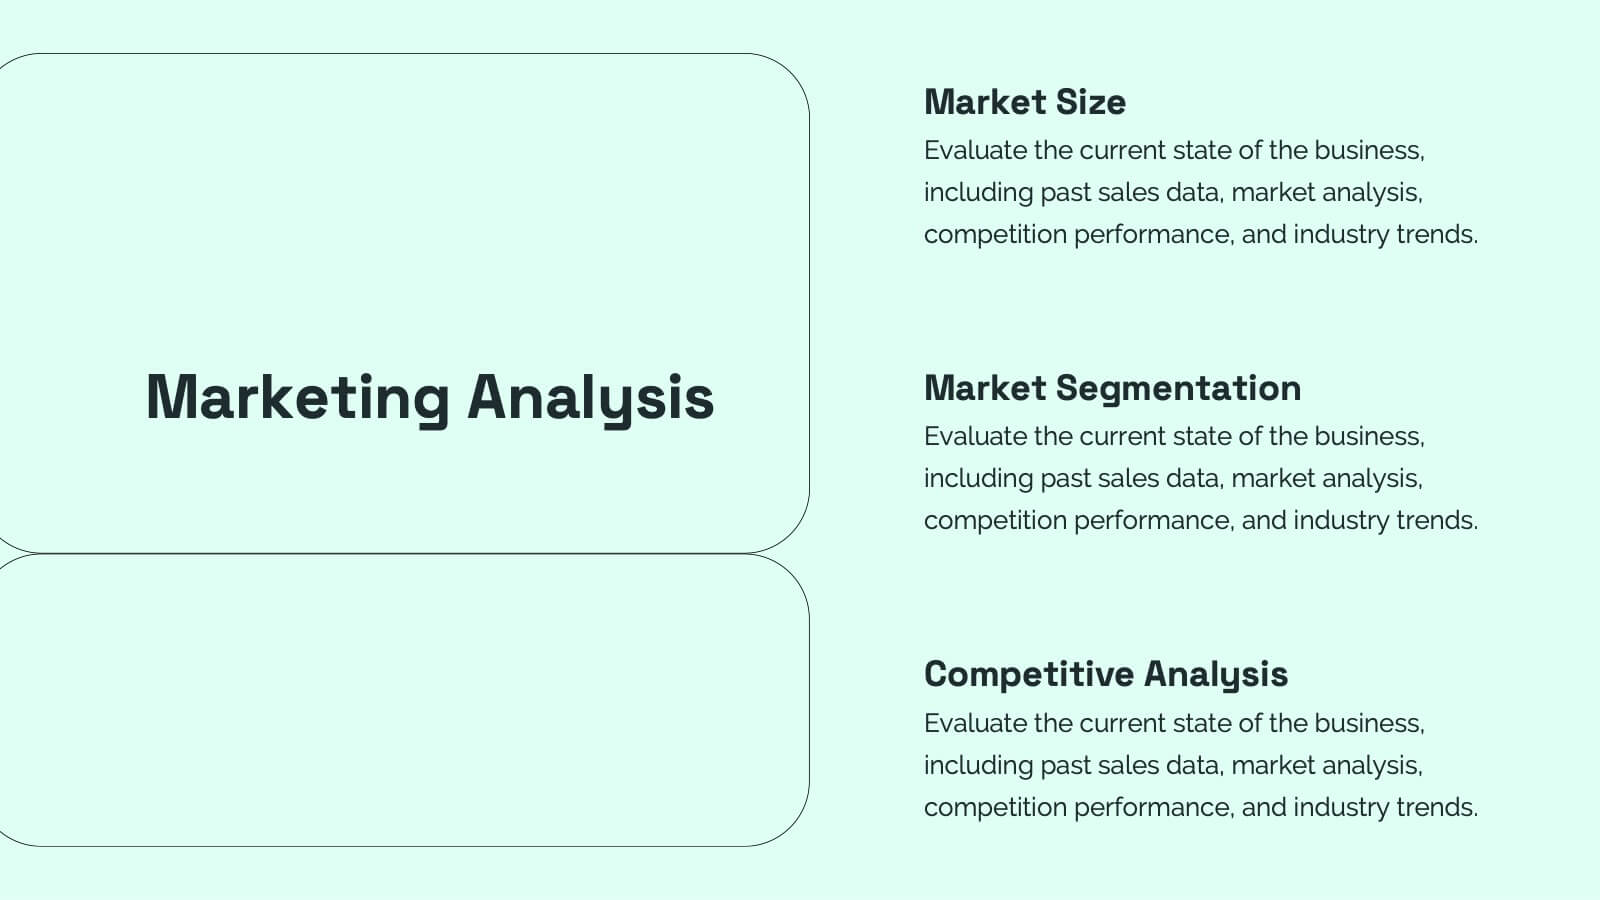
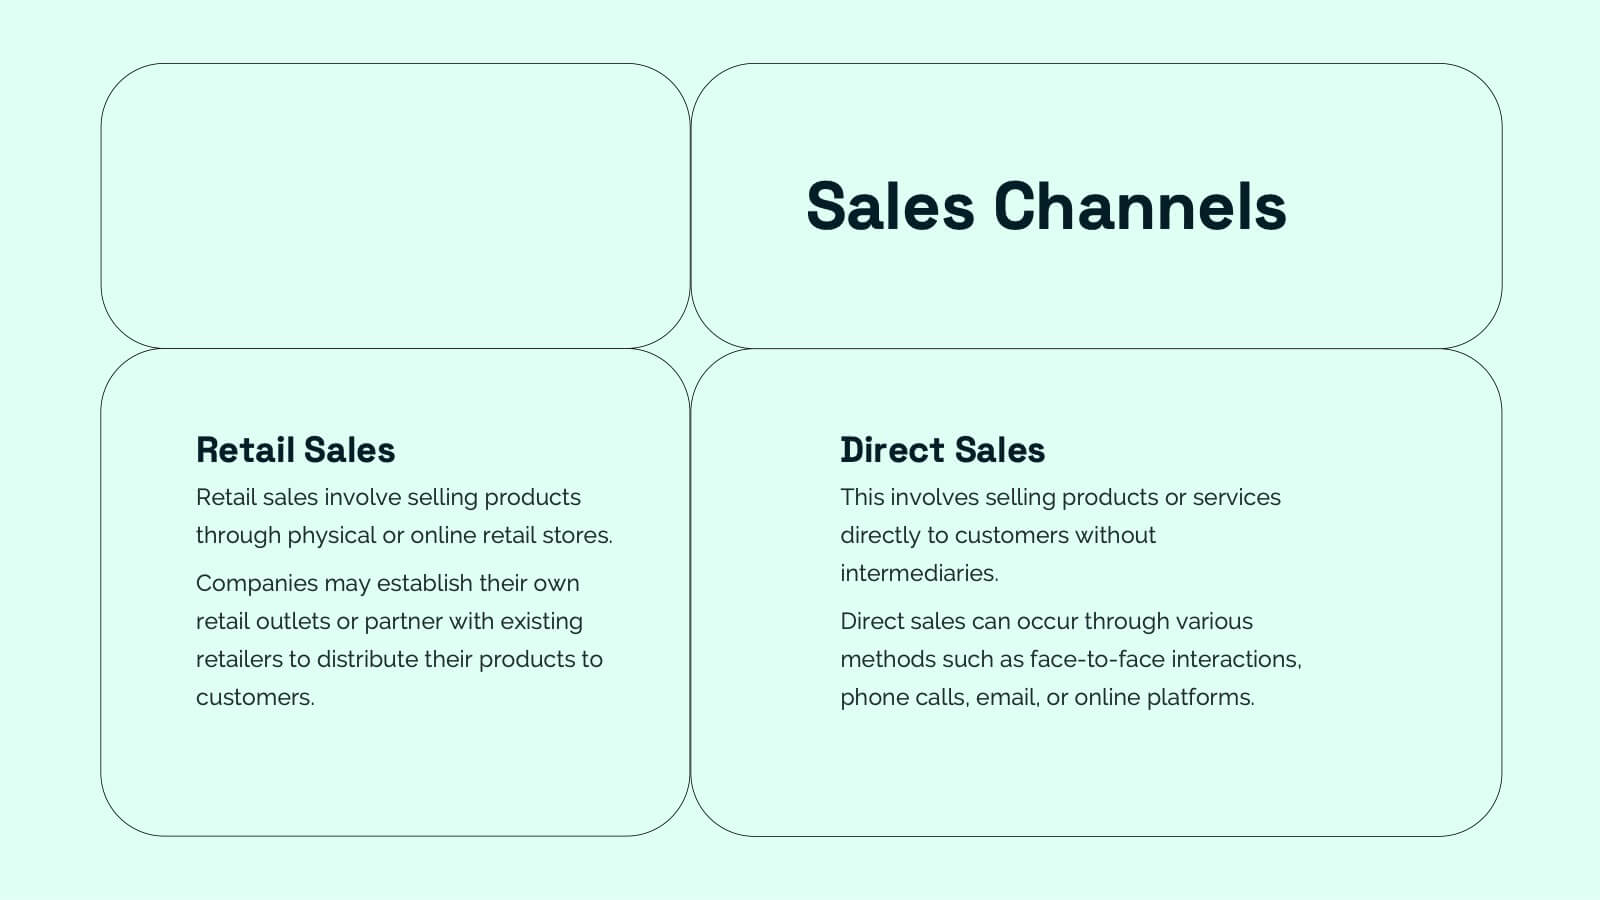
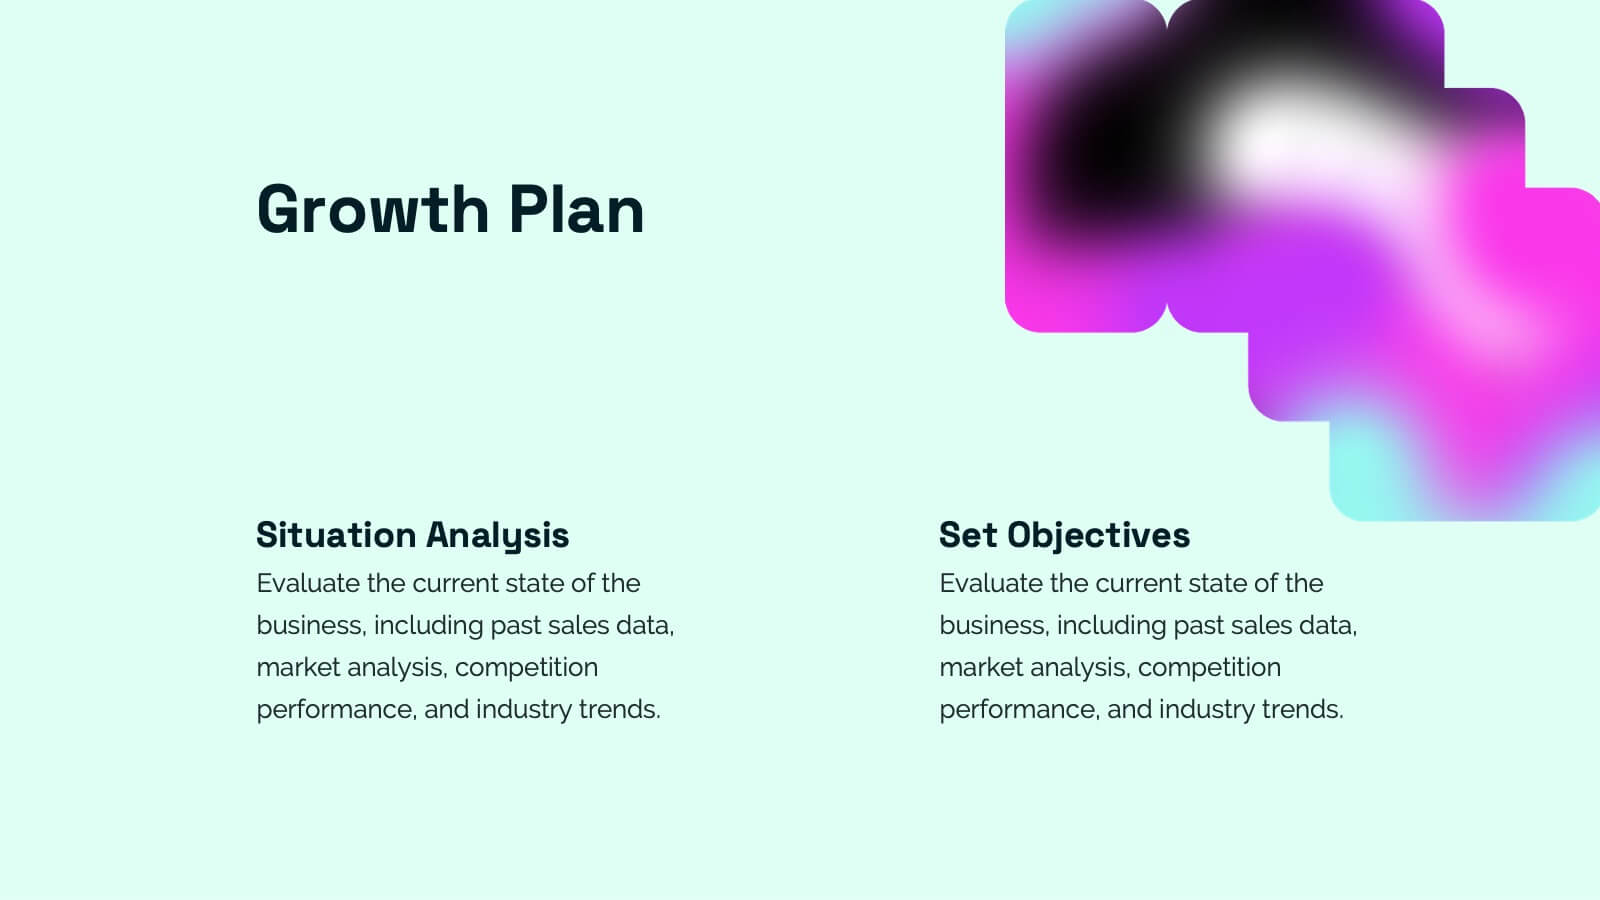
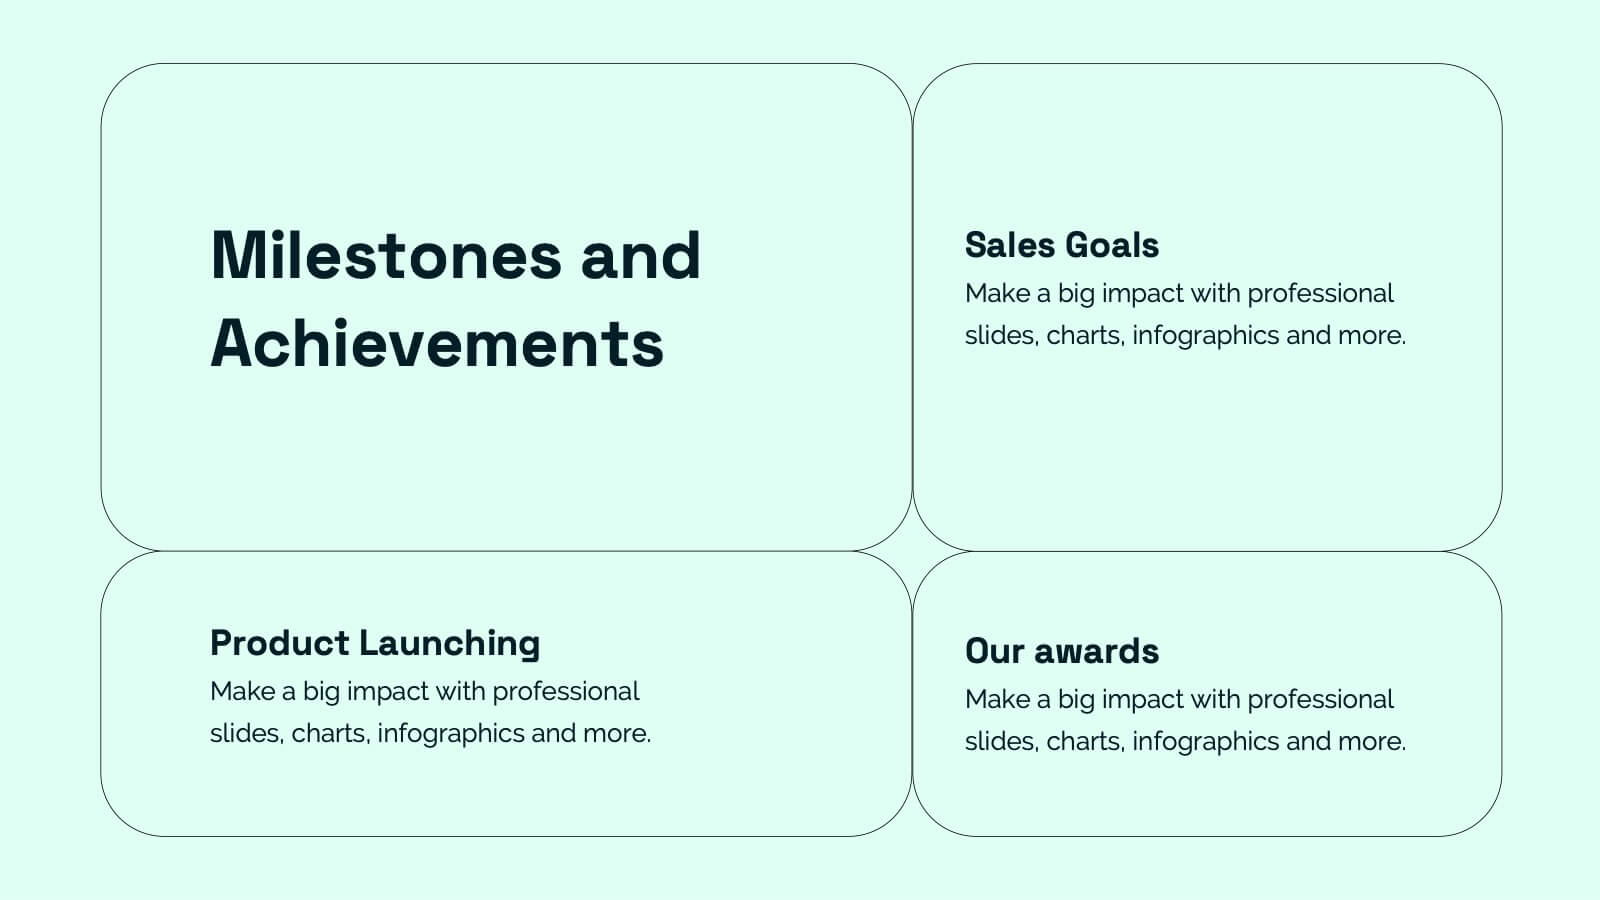
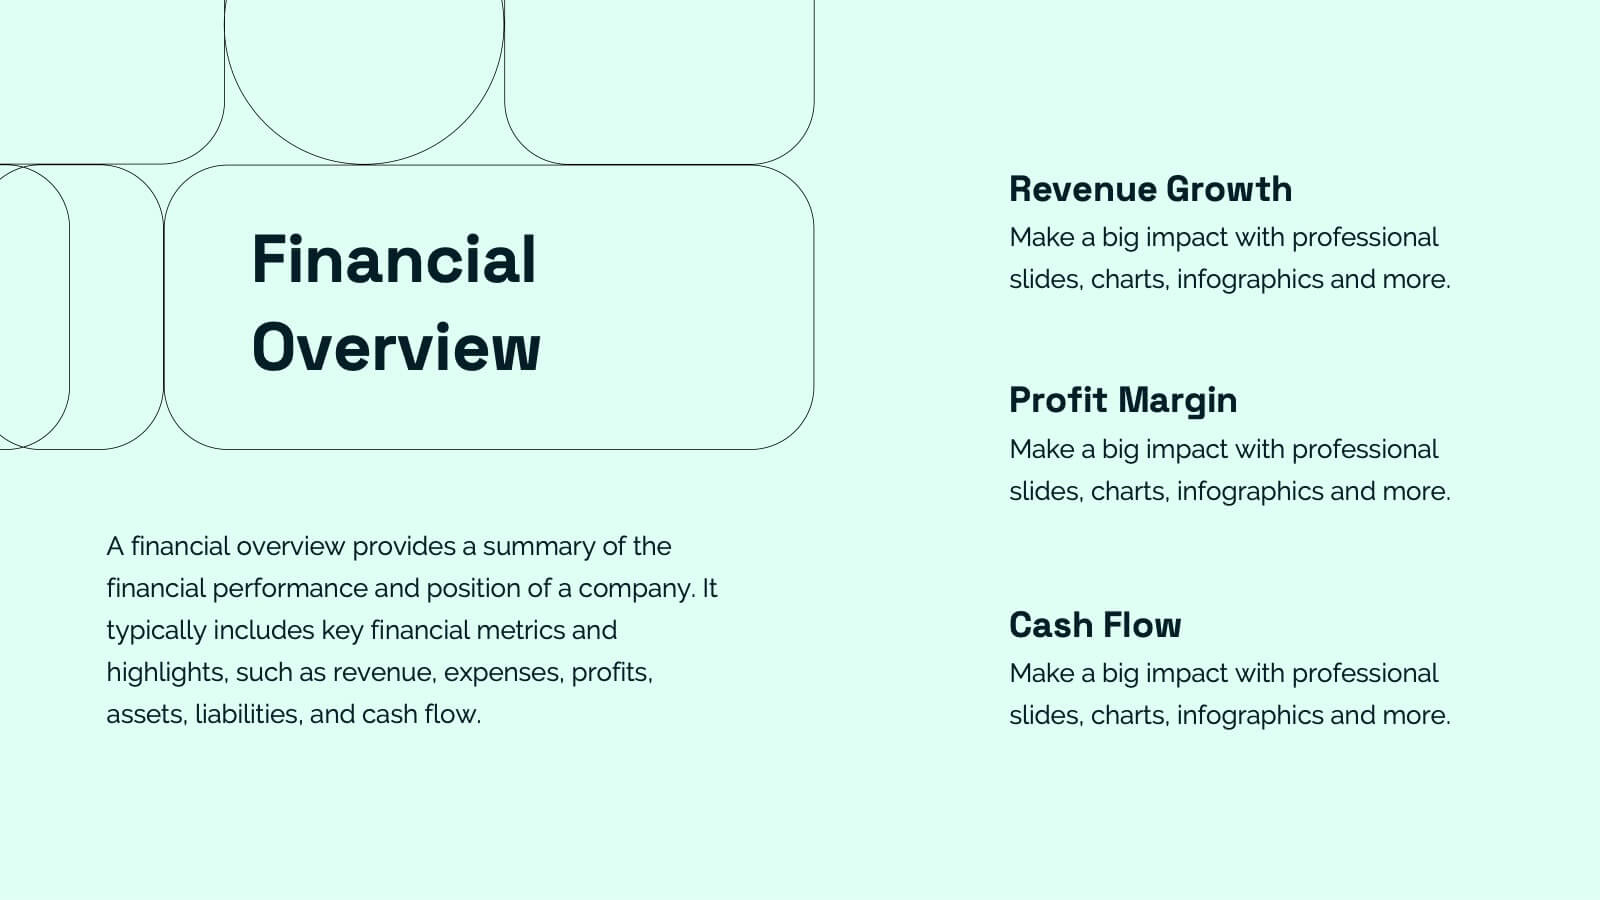
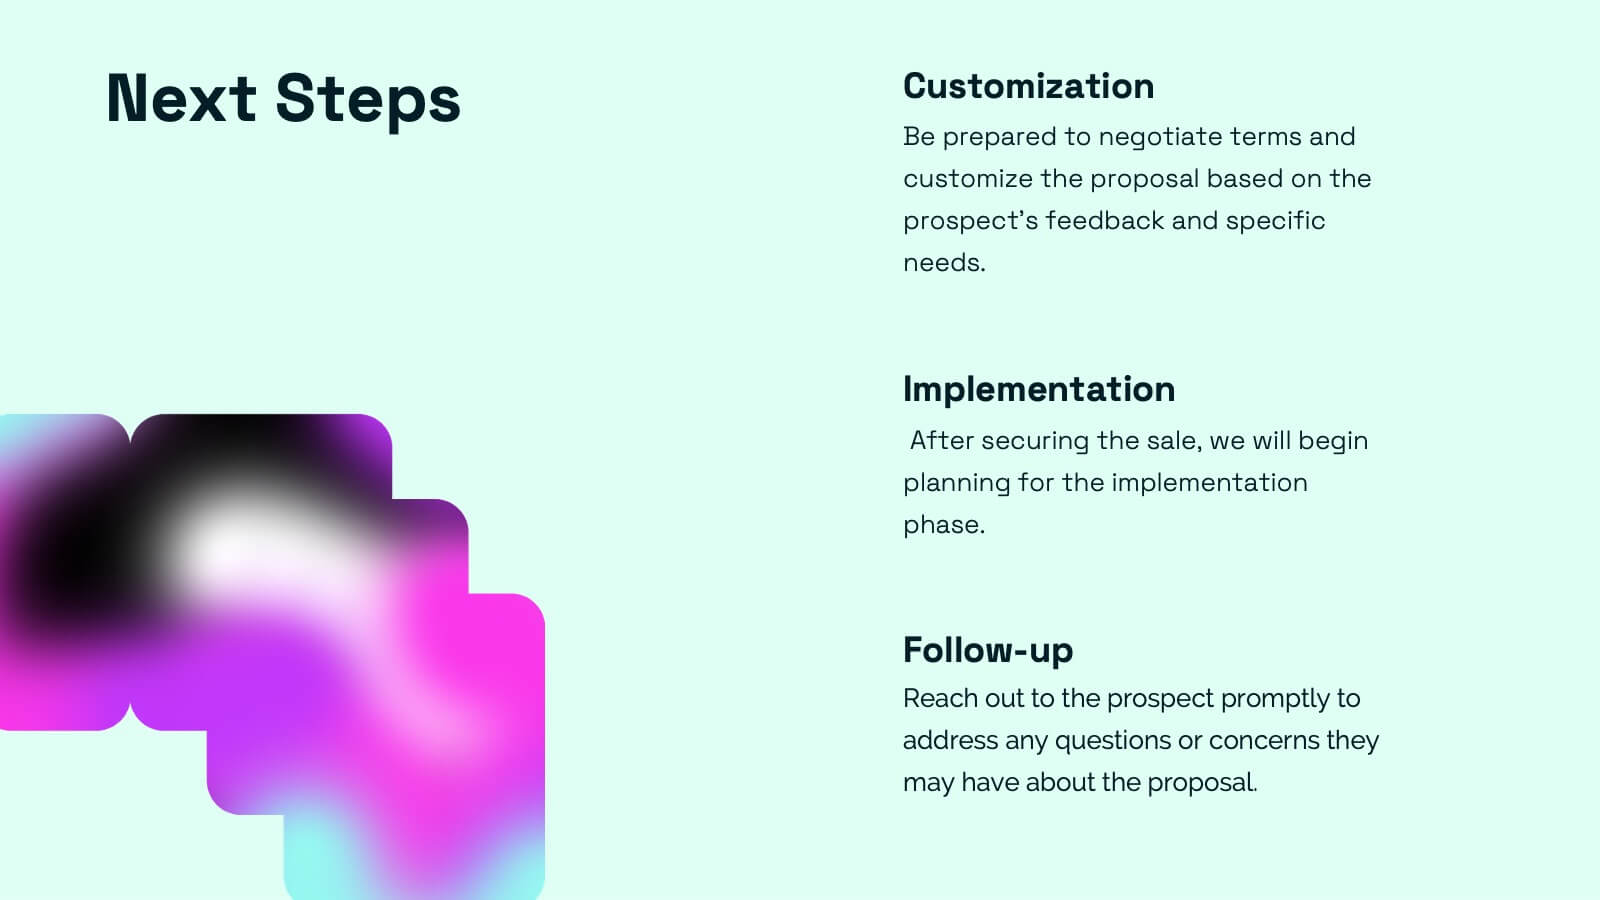
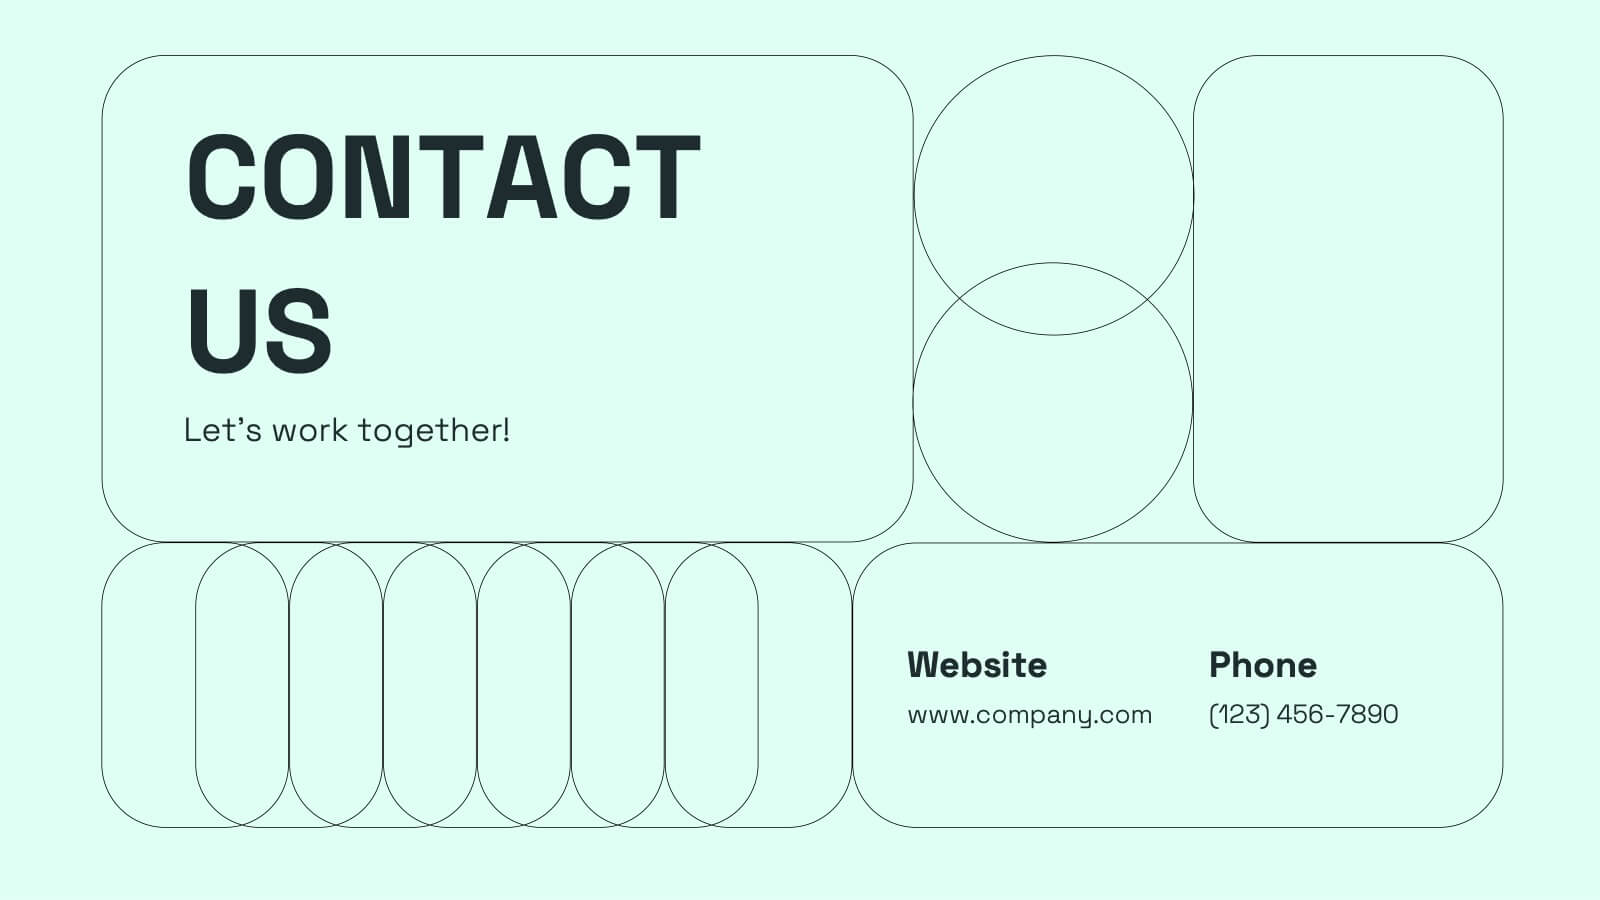
Nymph Startup Pitch Deck Presentation
This startup pitch deck template covers all the essentials for presenting a business. It includes slides for mission and vision, business model, market analysis, value proposition, and financial overview. Easily customizable for any startup industry, this modern design makes presenting your ideas a breeze. Compatible with PowerPoint, Keynote, and Google Slides.


6 diapositivas
Data Analysis Methods Infographics
This Data Analysis Methods Infographic is an excellent tool for professionals and students alike to present statistical findings and patterns. Designed for seamless integration with PowerPoint, Google Slides, and Keynote. The infographics are ideal for illustrating trends, and summarizing large amounts of data in an easily digestible format. With a variety of chart styles, including bar graphs, line charts, and icon arrays, the template allows for versatile data representation. Make your data speak volumes with this crisp and informative infographic, ensuring your audience grasps the insights at a glance. Perfect for market research, academic research, and business performance presentations.


5 diapositivas
Marketing Strategy Wheel Diagram Presentation
Visualize your marketing framework in a clear and engaging way with this Marketing Strategy Wheel Diagram. Designed to highlight key components like audience targeting, communication channels, and campaign goals, this circular format brings strategy to life. Fully customizable and compatible with PowerPoint, Keynote, and Google Slides. Ideal for marketers, agencies, and branding professionals.


5 diapositivas
Banking Services Infographics
Banking Services refer to the financial and investment services provided by banks to individuals, businesses, and other organizations. These Infographics are visual representations of information about different types of banking services provided by various financial institutions. This infographic provides an overview of the key features, benefits, and drawbacks of each service, such as checking/saving accounts, credit cards, and online banking. Included are statistics, charts, and other visual aids to convey data more effectively. The aim is to help individuals make informed decisions about the right banking services for their needs.


4 diapositivas
Human Anatomy Infographic
Visualize internal body systems with clarity using this editable human anatomy slide. Ideal for educational, medical, or health-related topics, this layout helps present organs and body functions with precision. Fully customizable in PowerPoint, Keynote, and Google Slides—adjust labels, icons, and colors to fit your needs.


3 diapositivas
Company Mission Overview Presentation
Bring your message to life with a bright, modern slide that highlights purpose, direction, and organizational goals in a clean, engaging layout. This presentation helps you communicate mission-driven insights with clarity and visual impact, making it ideal for internal teams or stakeholders. Fully compatible with PowerPoint, Keynote, and Google Slides.


6 diapositivas
Community Network Infographic
A community network is a localized, often root-driven, communication infrastructure that connects individuals, organizations, and institutions within a specific geographical area or community. This Infographic template visually represents the connections, relationships, and interactions within a community, often focusing on its members, resources, and activities. This template is a powerful way to showcase the dynamics and vitality of a community. This highlights the central theme or purpose of the community at the center of the infographic. This is fully customizable and compatible with Powerpoint, Keynote, and Google Slides.


5 diapositivas
Behavioral Psychology Diagram Presentation
Give your audience something to think about—literally. This bold and modern infographic layout lets you visualize complex human behavior patterns through simple, colorful brain-mapping diagrams. Perfect for presenting psychological insights, decision-making models, or behavioral science data. Fully compatible with PowerPoint, Keynote, and Google Slides for easy customization and professional use.