


Características


¿Tienes alguna pregunta?
Recomendar


5 diapositivas
Traveling Needs Infographics
Travel Infographics play an important role in providing valuable and engaging information to travelers. These infographics are visual representation of the essential items and considerations for travelers. This template is designed to provide travelers with an overview of what they need to pack, plan, and prioritize before a trip. This consists of customizable elements such as icons and illustrations that visually depict different categories of traveling needs. These categories can include clothing and accessories, travel documents, health, and more. This template will help you convey the essential items and tips for a successful and enjoyable trip.


5 diapositivas
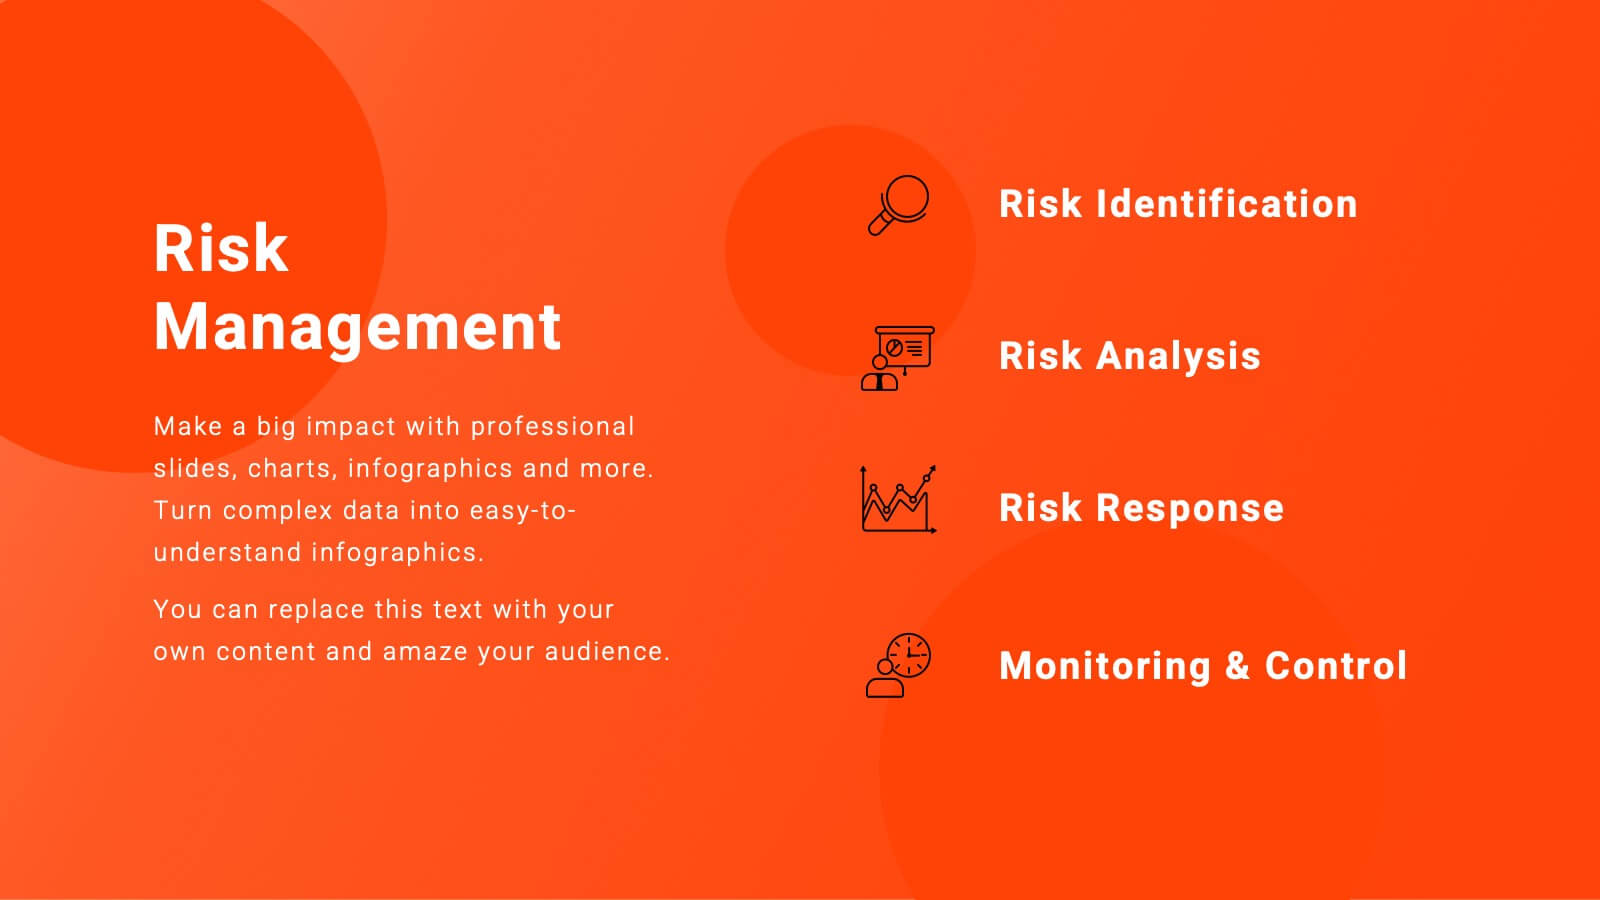
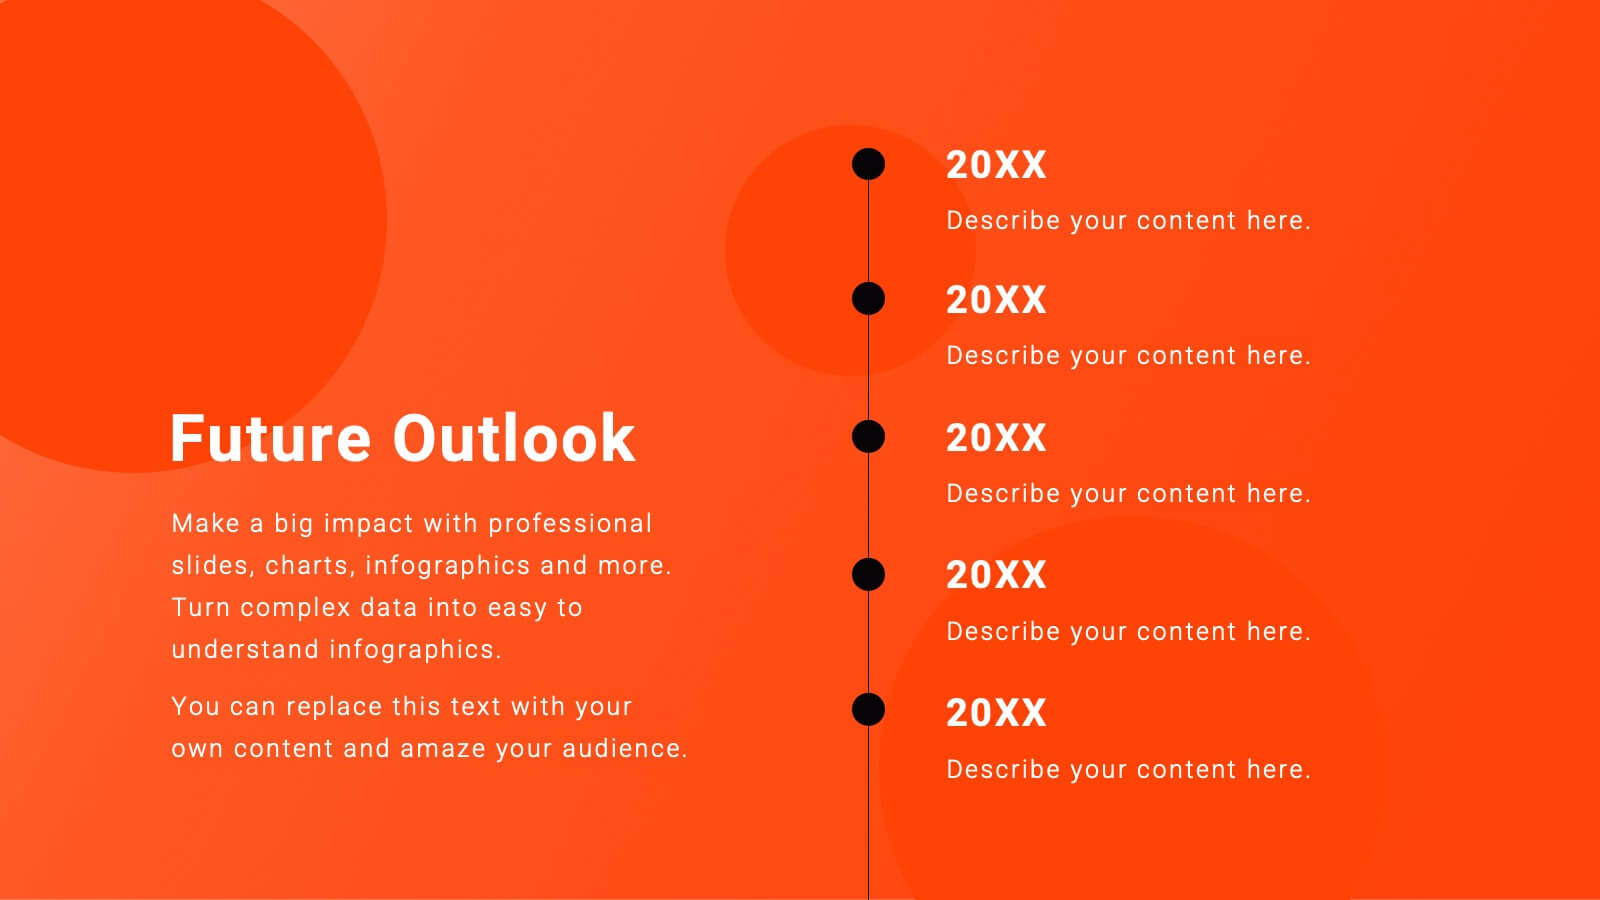
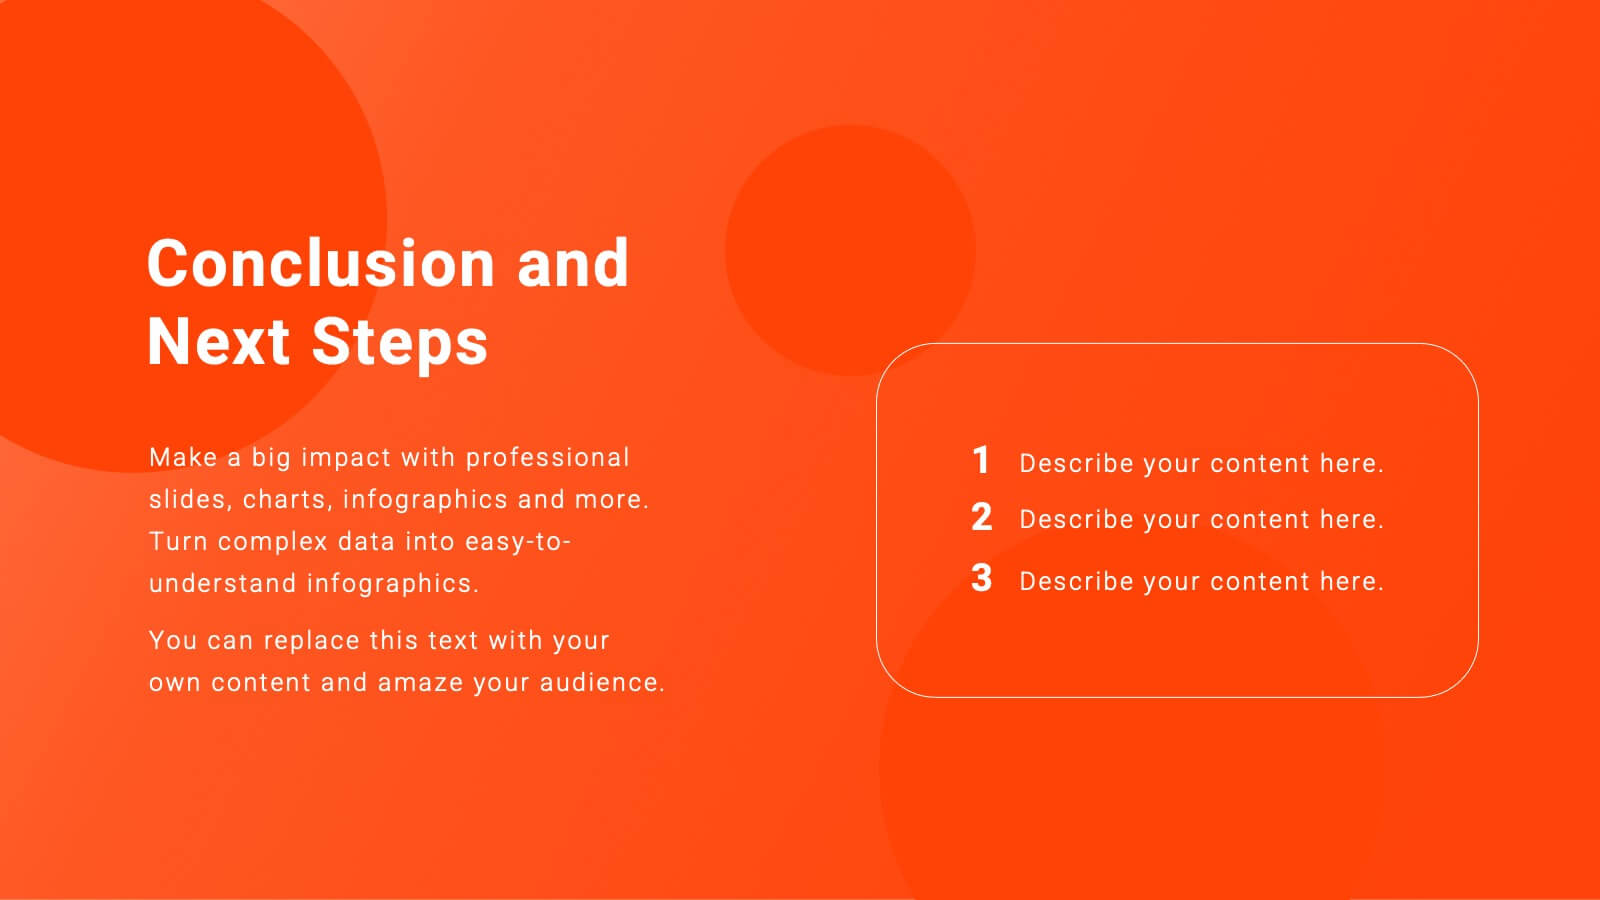
Workforce Alignment Strategy Presentation
Energize your strategy conversations with a clean, modern layout that makes team alignment feel clear, structured, and actionable. This presentation helps you break down goals, track priorities, and visualize key initiatives in a simple, intuitive flow. Ideal for planning sessions and leadership updates. Fully compatible with PowerPoint, Keynote, and Google Slides.


23 diapositivas
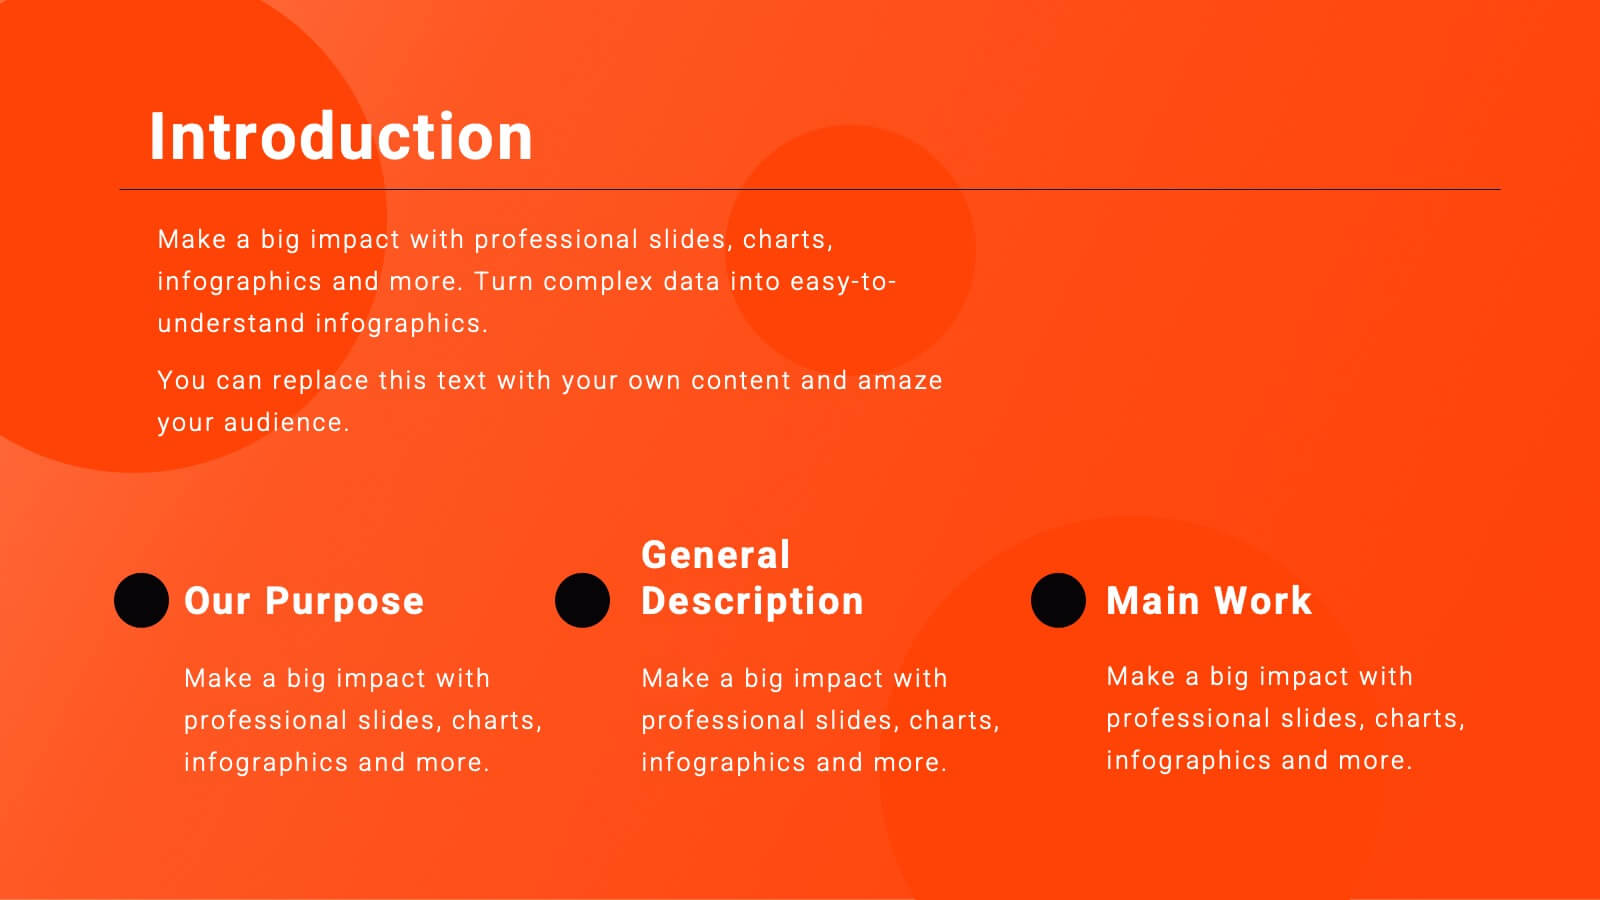
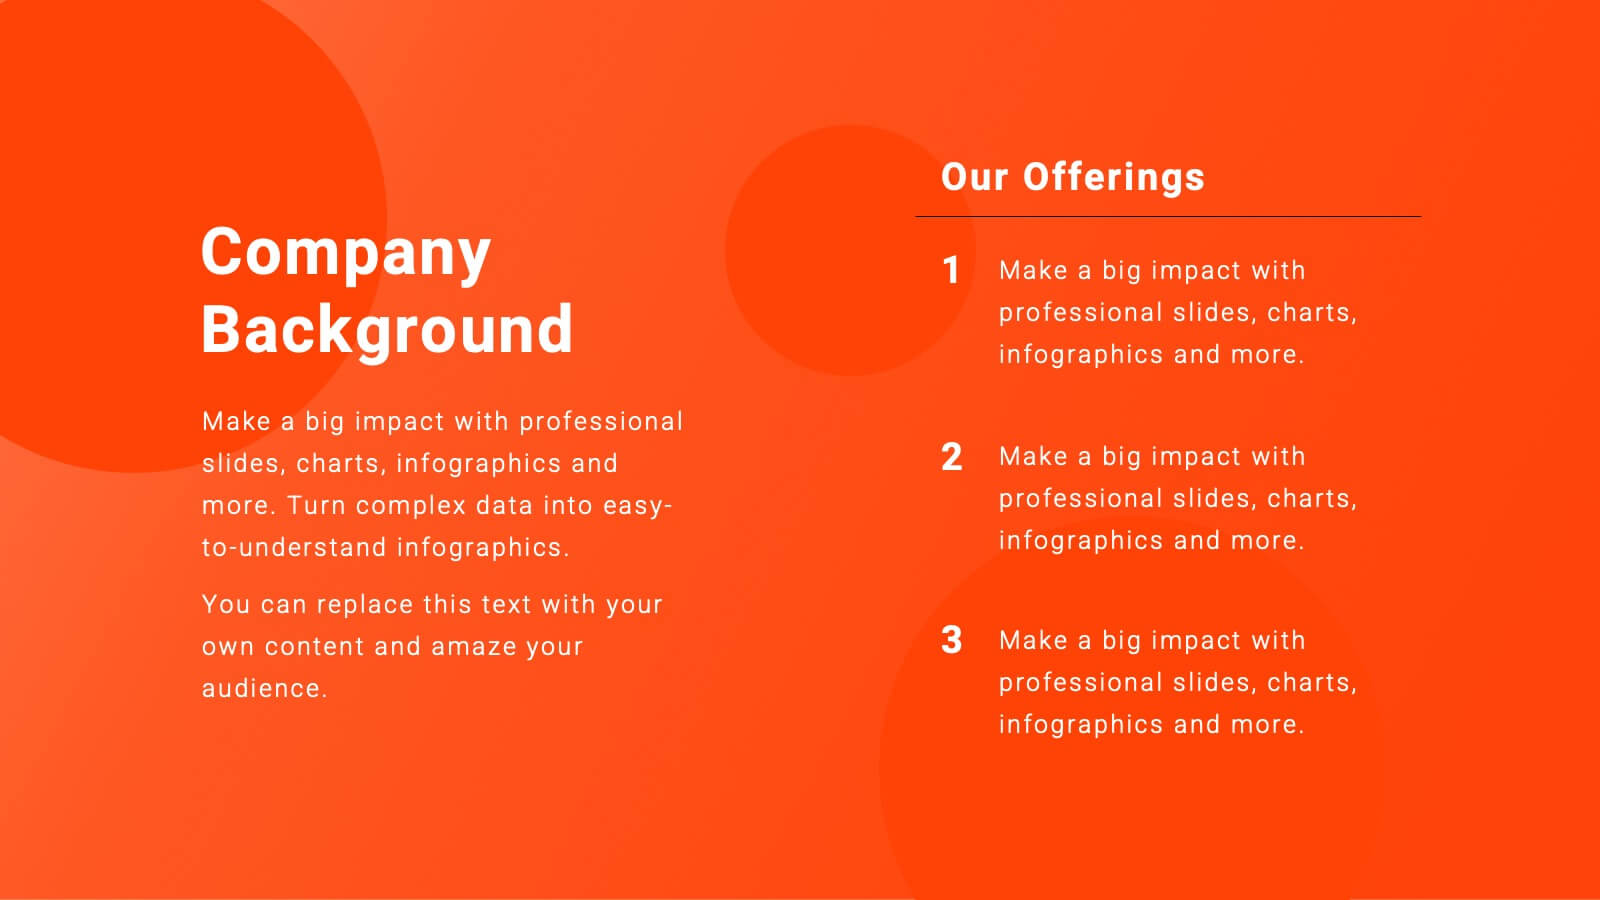
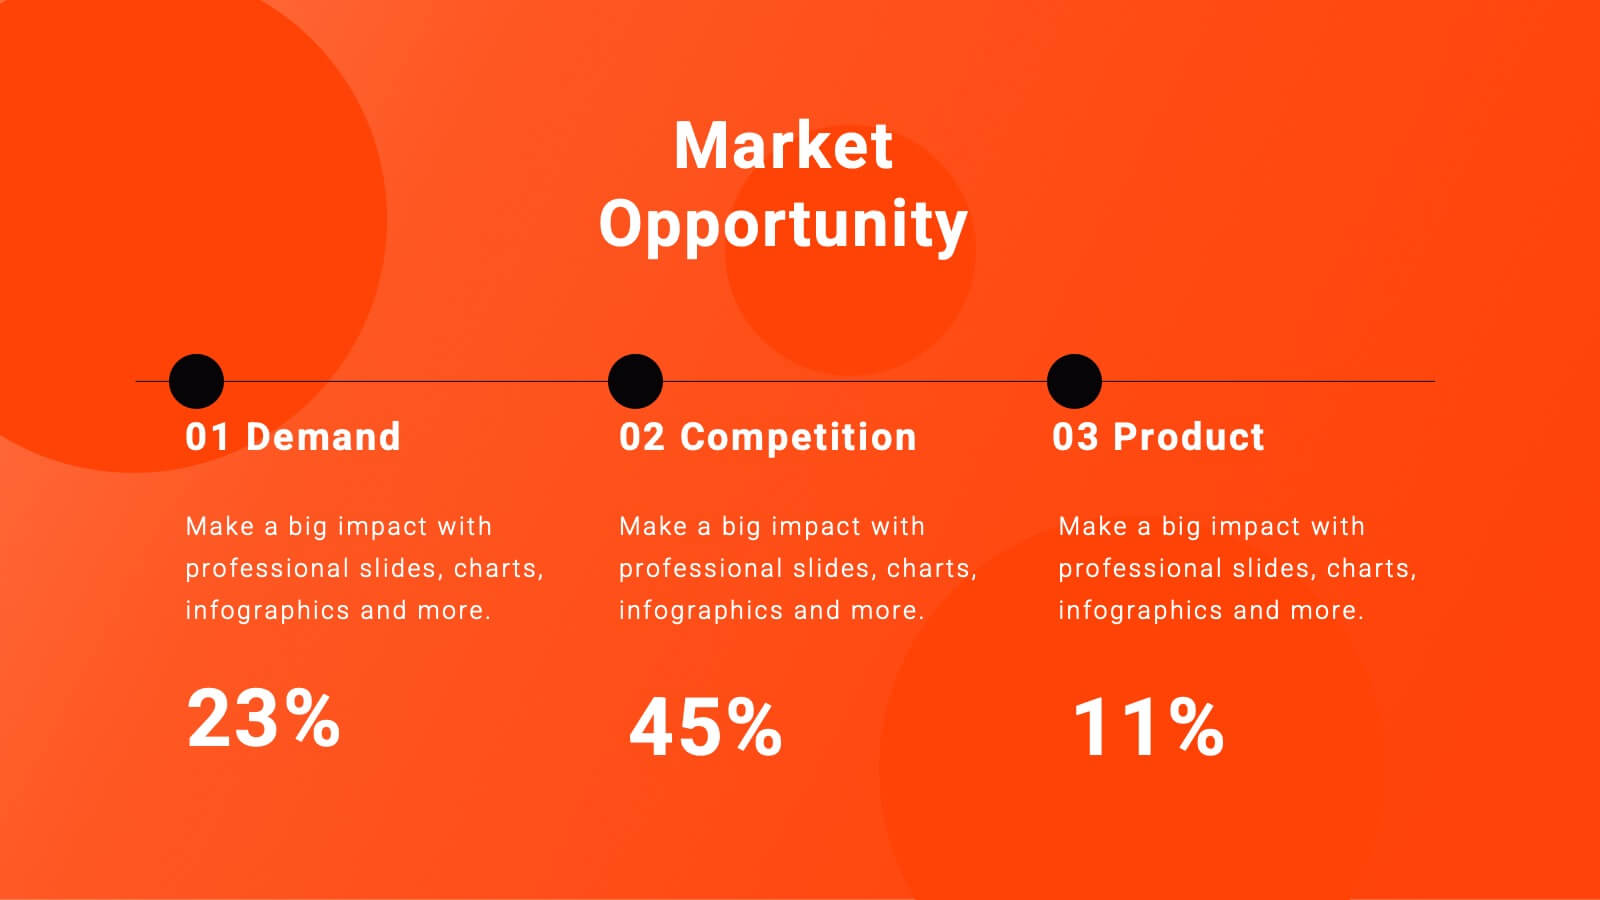
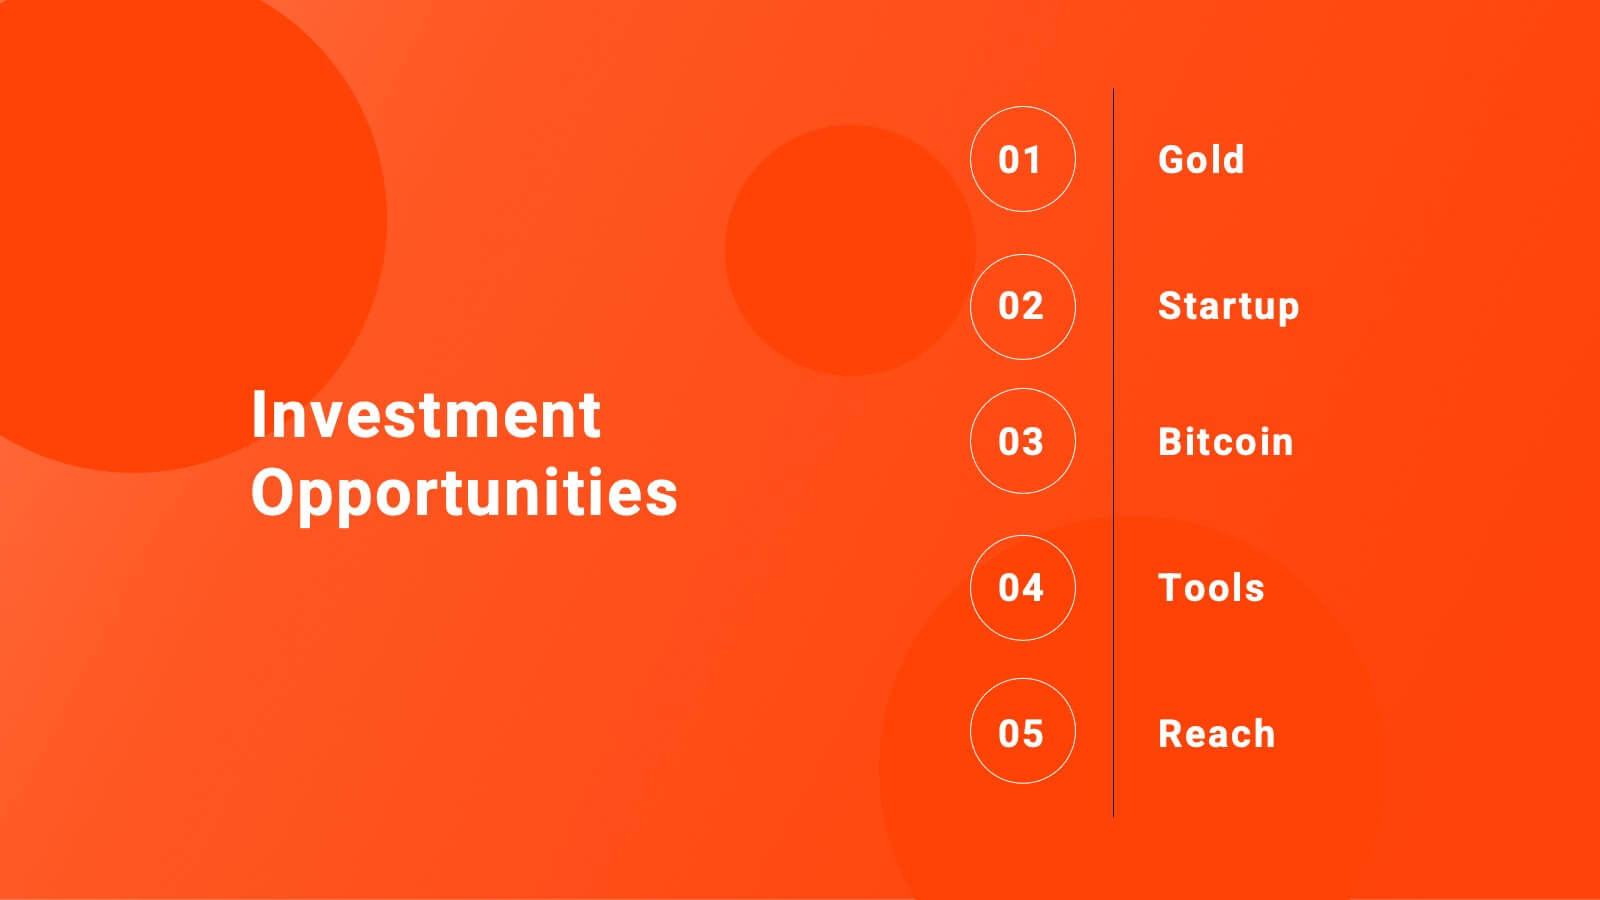
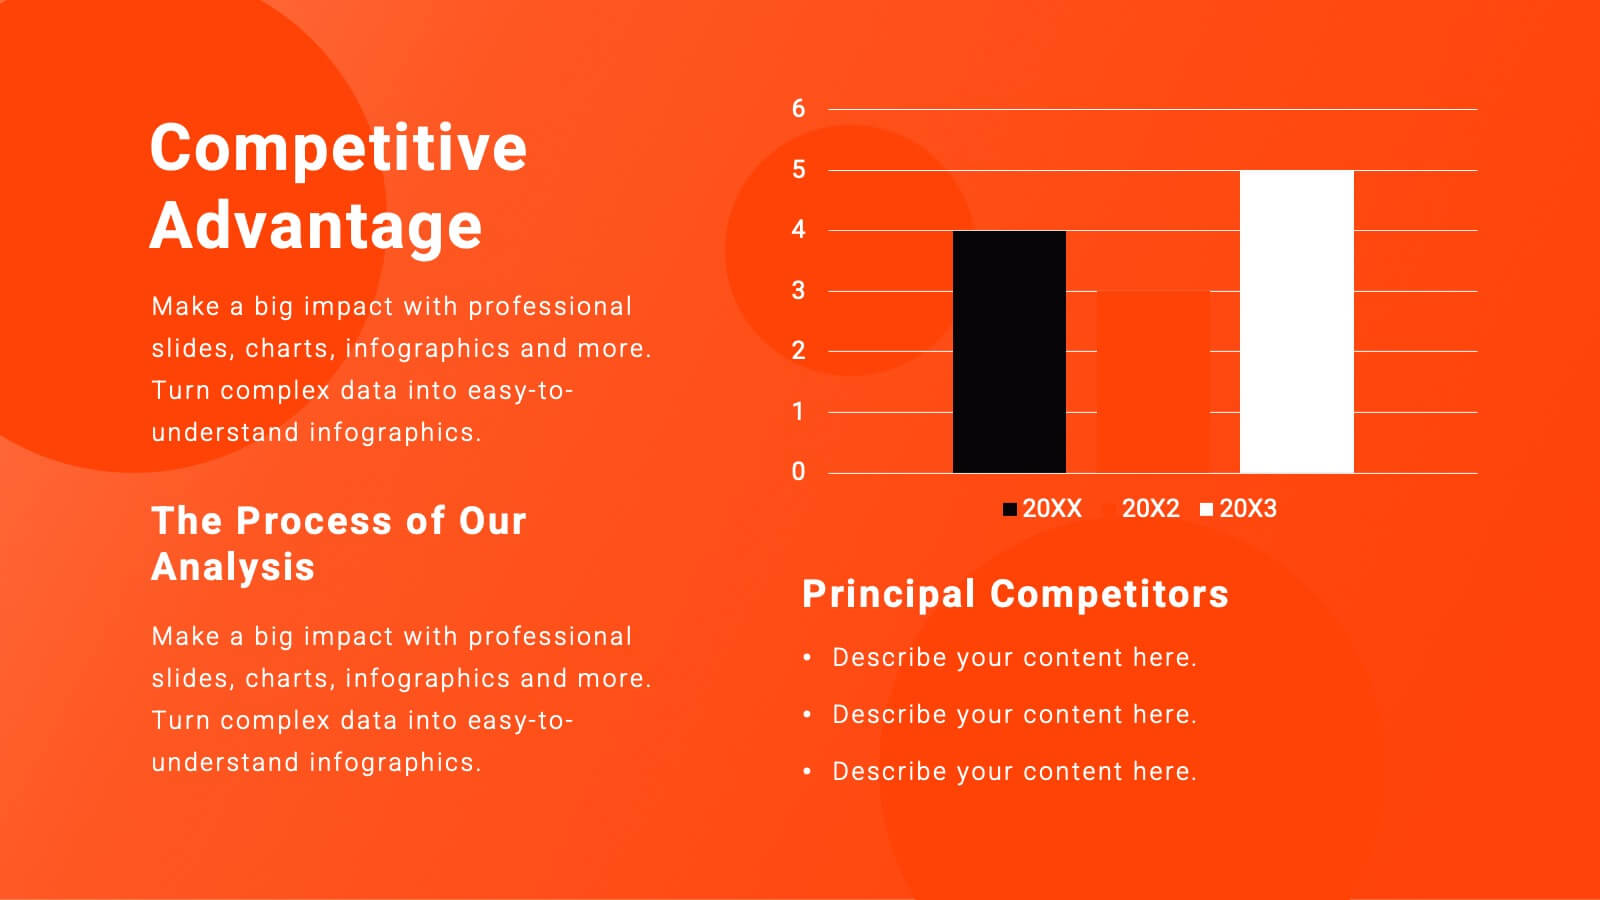
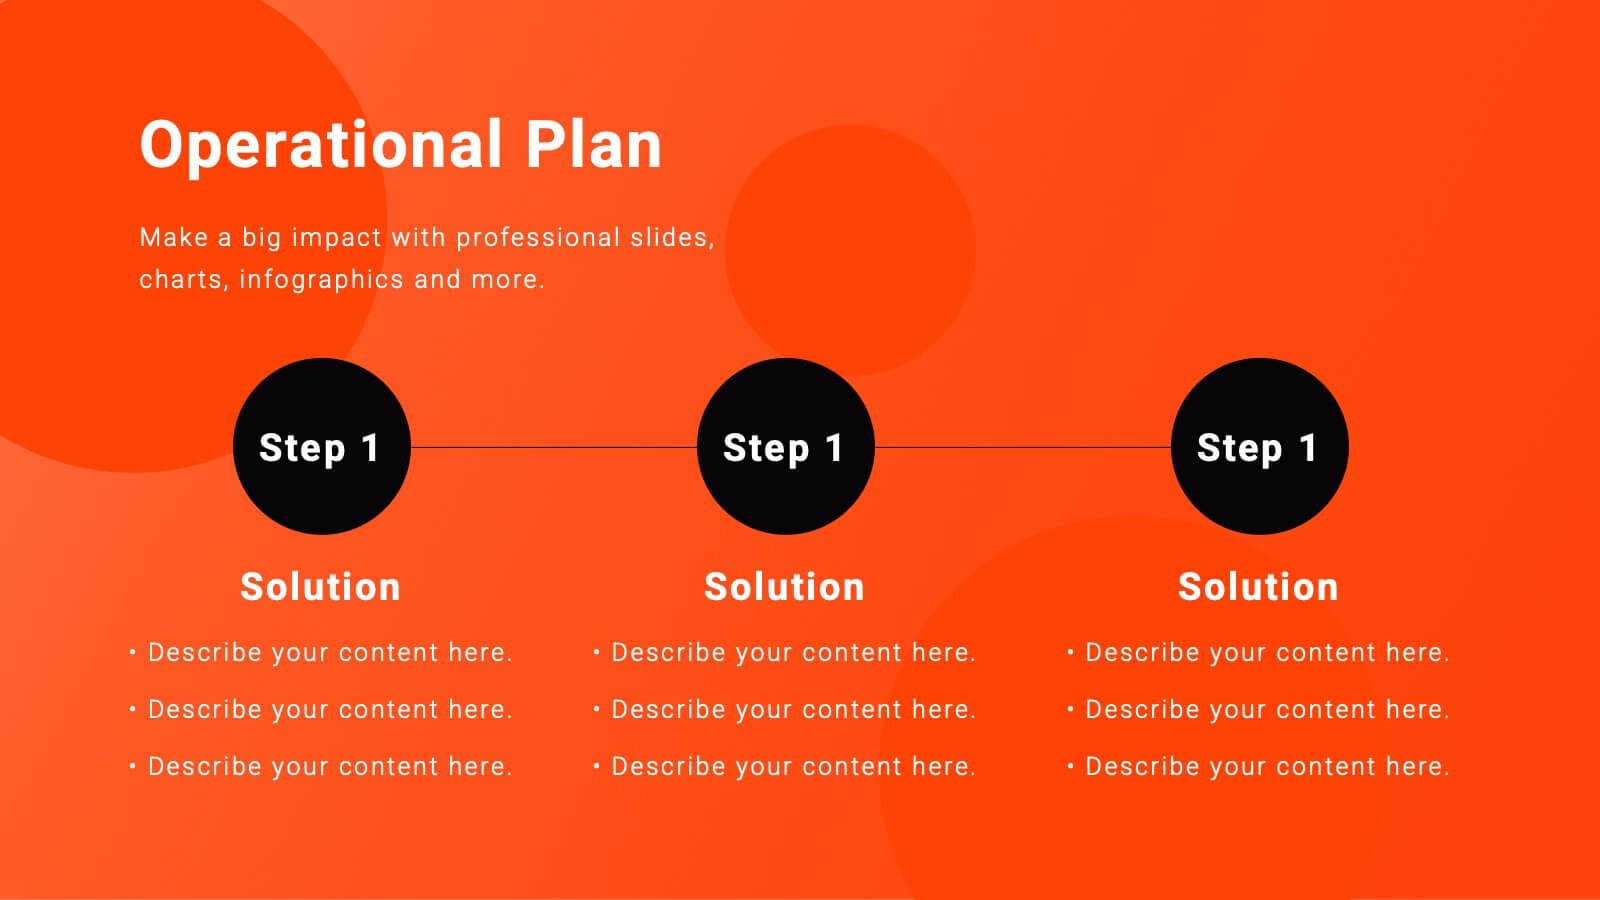
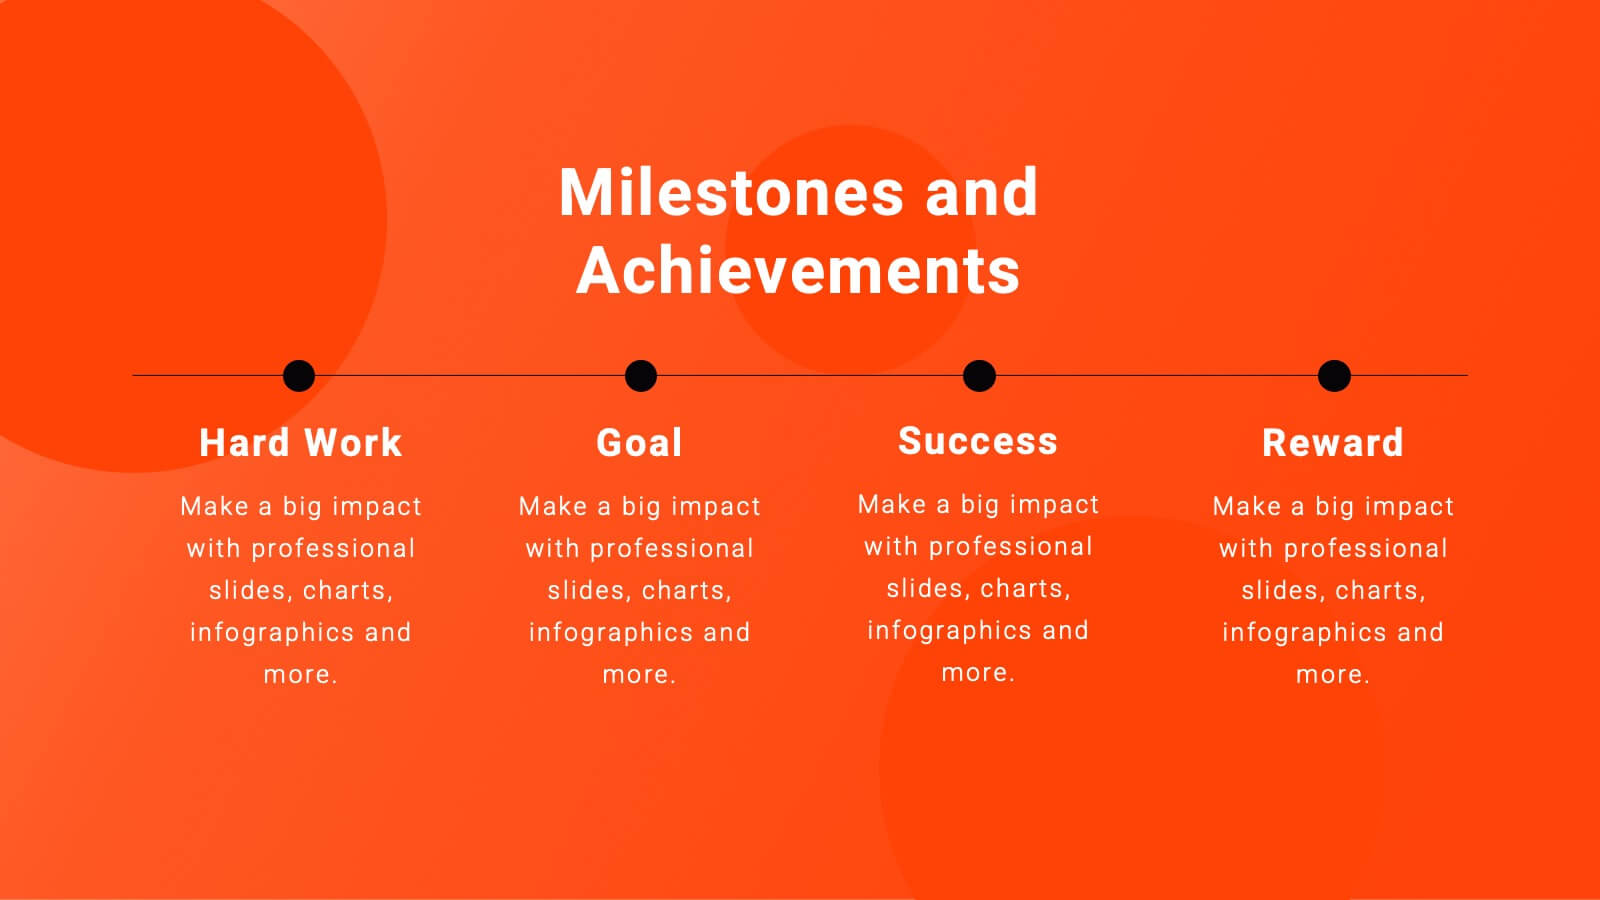
Equinox Business Operations Plan Presentation
Elevate your business operations with this dynamic plan template! Perfect for detailing company background, market opportunities, and strategic objectives. Ideal for business leaders and managers aiming to streamline operations and drive growth. Compatible with PowerPoint, Keynote, and Google Slides, this template ensures your business plan is clear, professional, and impactful. Drive success today!


7 diapositivas
Digital Business Strategy Infographic
Navigate the complex landscape of digital business strategy with this comprehensive infographic template, which is meticulously designed to aid business strategists, entrepreneurs, and students in understanding and developing effective business plans. This resource breaks down the core components of a successful business strategy into digestible, visually engaging segments. The template spans several key areas of strategic planning including execution, governance, planning, marketing, and innovation. Each section is clearly delineated with vibrant colors and icons that correspond to different aspects of business strategy, such as venture, capital, and brand positioning. The layout is thoughtfully organized to guide the viewer through the process step-by-step, making complex concepts accessible and straightforward. Utilizing a clean and professional design, this template is ideal for presentations, educational materials, or as a visual aid during business meetings. It provides a clear roadmap for aligning digital tools and platforms with business objectives, highlighting the pathways to profitability and market expansion. Whether for internal strategy sessions, academic purposes, or entrepreneurial pitches, this infographic is an invaluable tool for conveying the essentials of digital business strategy effectively and efficiently.


7 diapositivas
Process Solution Infographic
Streamline intricate workflows with our process solution infographic. Anchored in a pristine white base and infused with varying shades of professional blue, our template elegantly delineates step-by-step solutions and systematic approaches. Decked with meticulous infographics, representative icons, and versatile image placeholders, it transforms complexities into a navigable visual journey. Masterfully curated for Powerpoint, Keynote, or Google Slides. An invaluable asset for process managers, business analysts, strategists, or any organization keen on optimizing workflows. Navigate processes with confidence; let each slide chart the path to optimized solutions.


6 diapositivas
Monthly Agenda and Events Presentation
The "Monthly Agenda and Events" presentation template features a calendar format, segmented by months, for detailed planning and tracking of events. Each month is color-coded for easy reference and contains placeholders for listing specific tasks or events. This template is perfect for individuals and teams who need to organize and visualize monthly activities, providing a clear overview of upcoming commitments and timelines, ensuring that all events and tasks are completed efficiently throughout the year.


7 diapositivas
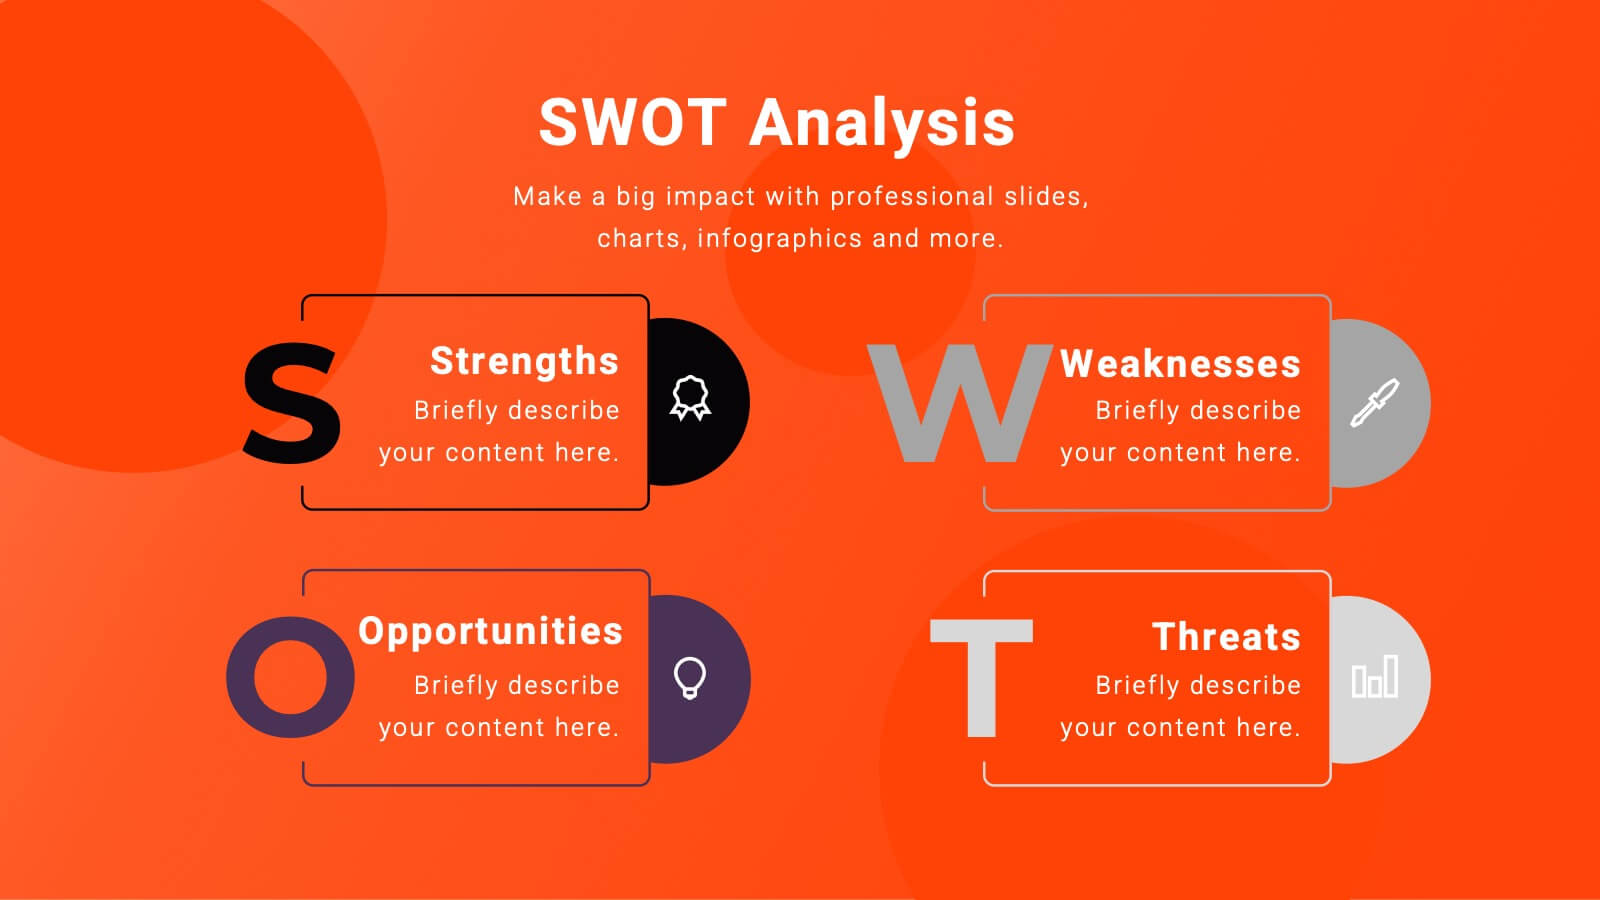
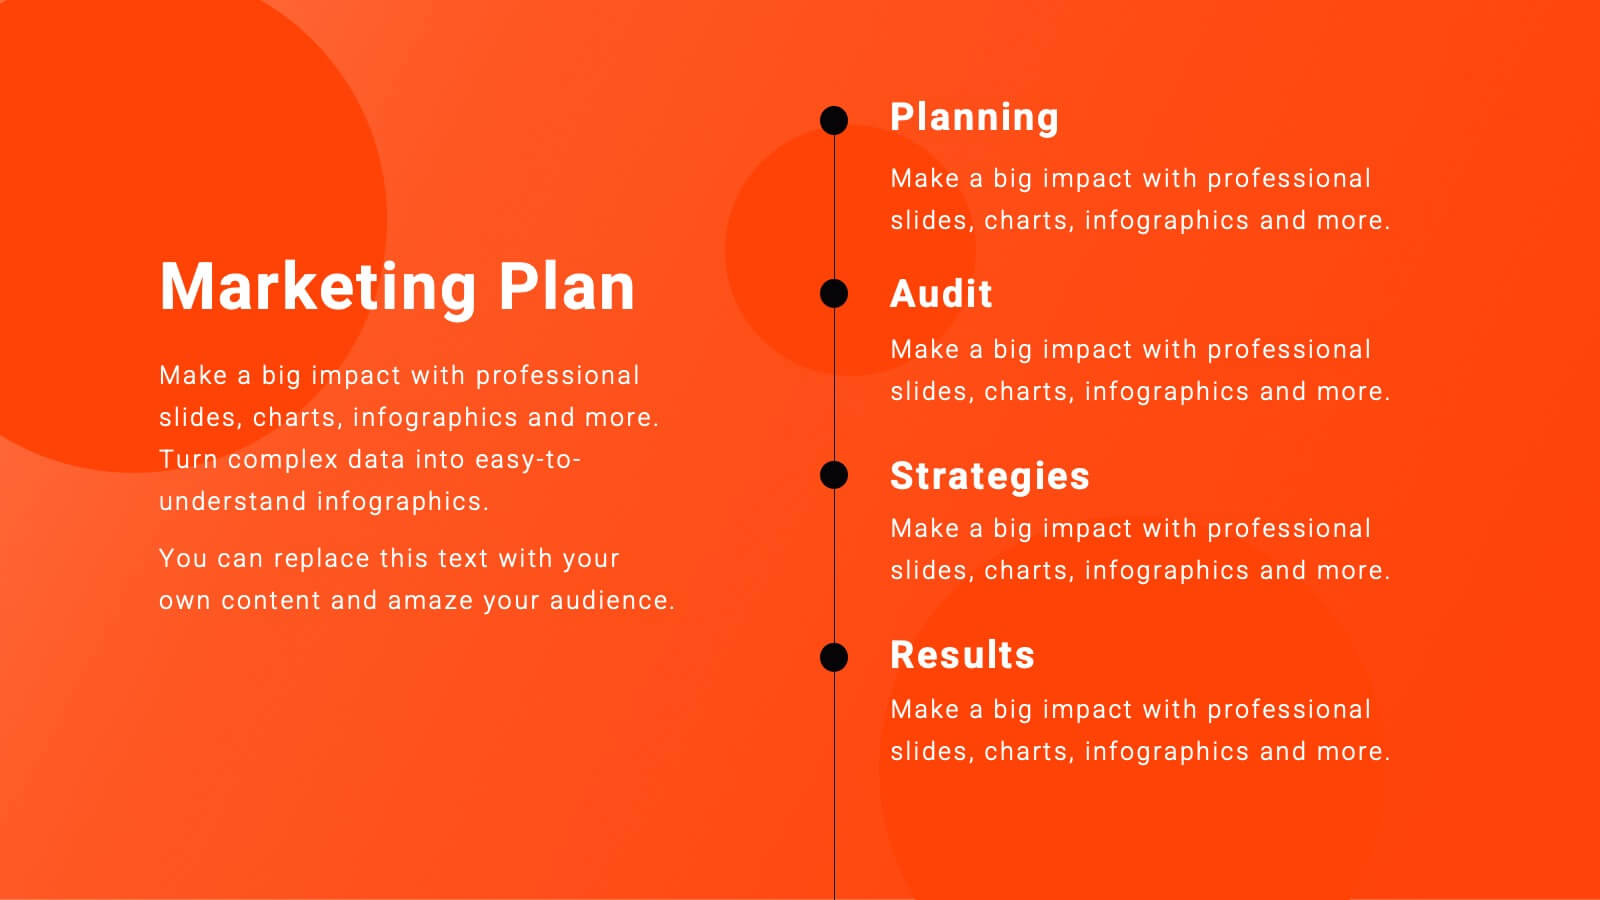
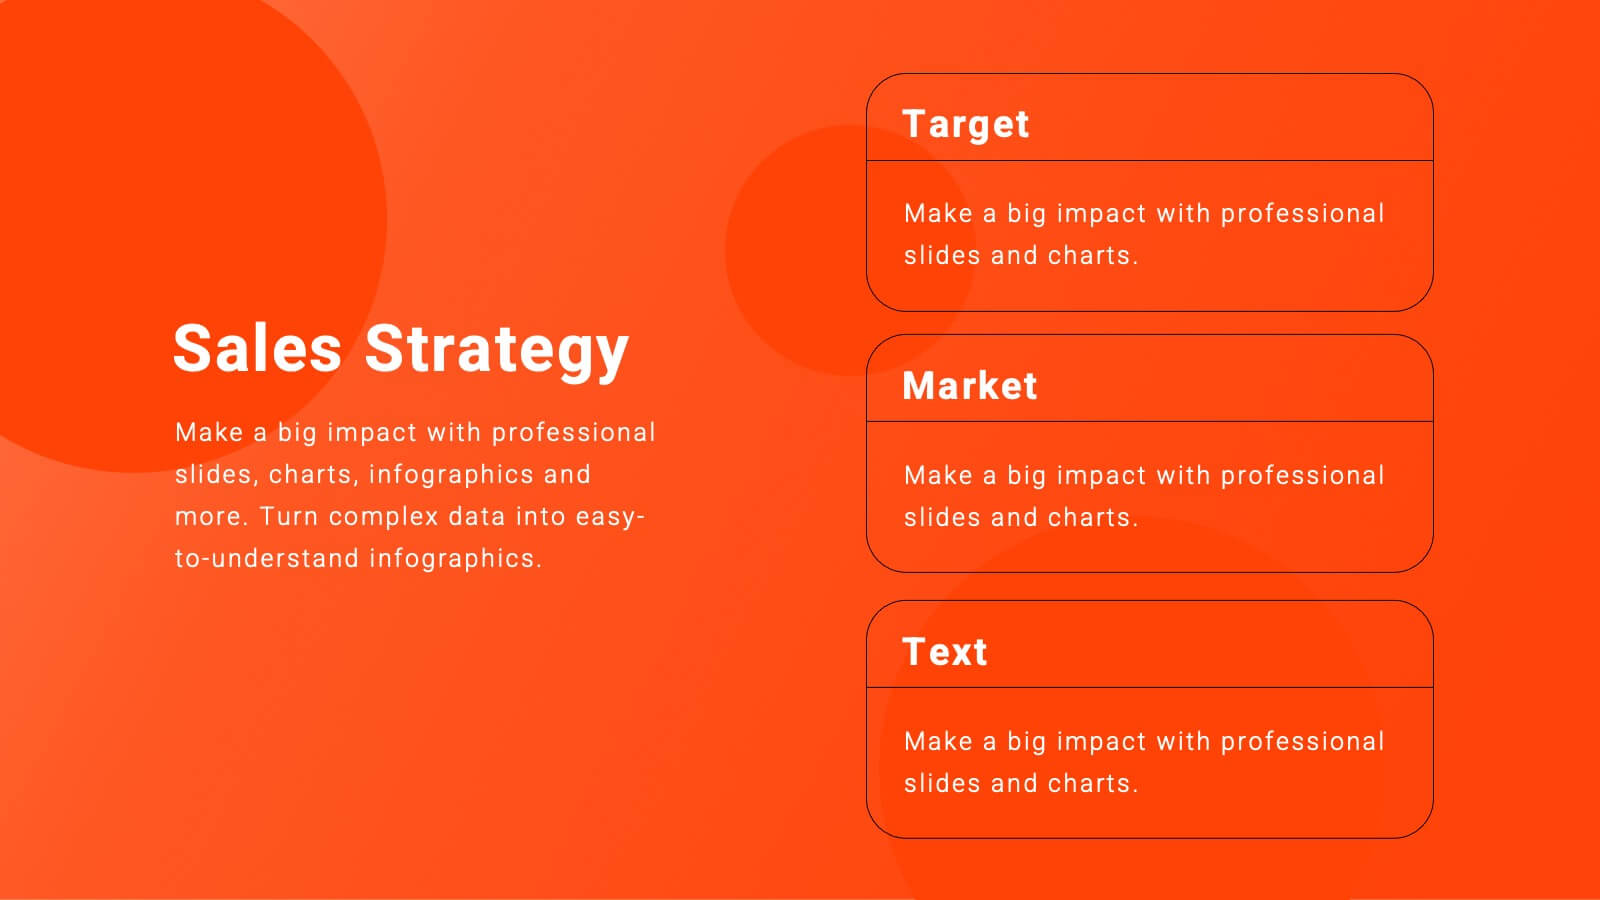
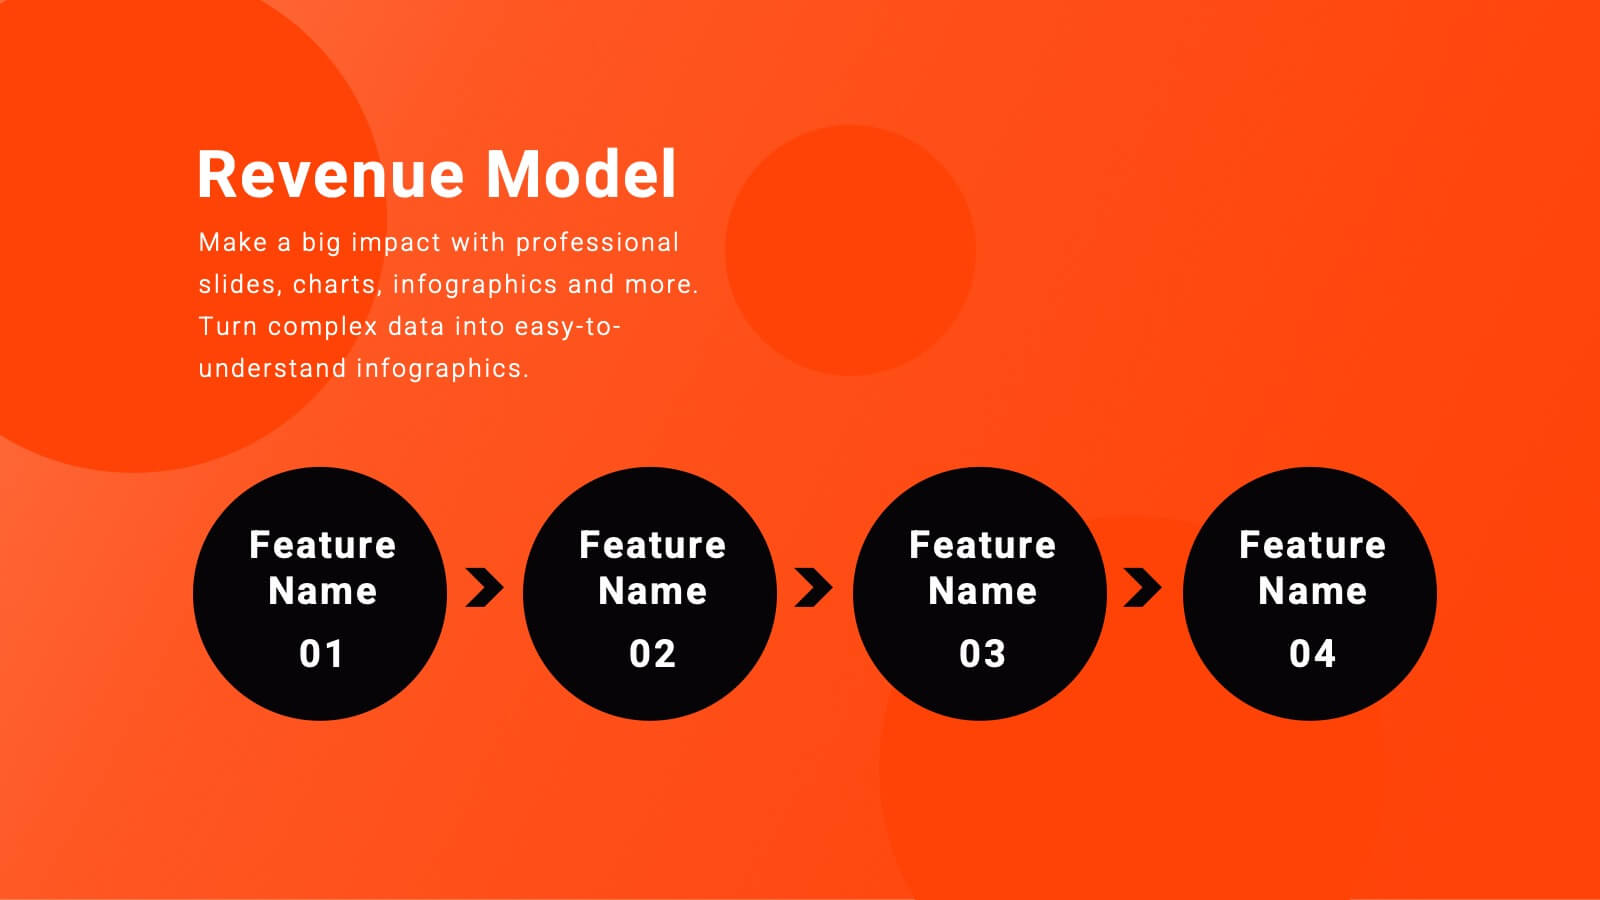
Business Strategy Infographic Presentation Template
A business strategy is a detailed plan that lays your goals, accomplishments and direction for the whole organization. A strategic plan will bring stability to your business and make it more profitable. This template can be used to inform your business on how essential a business strategy is. With this template, your business will learn that creating a strategy will help gain a better understanding of their organization's current strengths and weaknesses. This template is easy to use, includes helpful illustrations and allows you to add tips for managing your business more effectively.


6 diapositivas
Brain Development Infographic
Brain Development refers to the growth, maturation, and organization of the brain throughout an individual's life, starting from early prenatal stages and continuing into adulthood. This infographic template serves as a valuable educational resource for educators, parents, healthcare professionals, and anyone interested in understanding the fascinating process of brain development. This infographic highlights the stages and factors that shape brain growth, to help promote awareness and emphasize the importance of creating supportive environments for brain development. Compatible with Powerpoint, Keynote, and Google Slides.


4 diapositivas
AIDA Marketing Funnel Slide Presentation
Capture attention from the very first slide with a bold, structured layout that turns each stage of your message into a clear, engaging flow. This presentation helps simplify complex decision paths and guide viewers through each step with ease. Fully editable and compatible with PowerPoint, Keynote, and Google Slides.


7 diapositivas
Mission Infographic
The showcased templates are meticulously designed to articulate the mission of an organization effectively, making them an invaluable tool for any corporate or non-profit entity aiming to communicate its core purpose and objectives. Each slide is crafted to guide the audience through the foundational elements that define the company’s ethos, goals, and strategic approaches. These templates feature a clean and professional layout, incorporating subtle design elements that draw attention without overwhelming the content. They utilize a harmonious blend of typography, iconography, and spacing, which helps in making the presentation not only visually appealing but also highly readable. The versatility of these templates allows them to be adapted for various contexts, whether it's part of an employee onboarding packet, investor presentations, or external company introductions. The color schemes and design motifs can be customized to align with specific brand guidelines, ensuring consistency across all corporate communications. By employing these slides, organizations can effectively communicate their mission, foster a cohesive understanding among stakeholders, and reinforce their commitment to their foundational values and objectives. This not only enhances internal morale but also strengthens the organization’s image externally, making these templates a strategic asset for any business.


3 diapositivas
Work from Home Setup and Productivity Plan Presentation
Ready to supercharge your productivity from your kitchen table to your couch office? This visual template helps you map out ideal remote work setups, task plans, and daily focus routines. Organize workspace essentials and time blocks in a clean, engaging format. Fully compatible with PowerPoint, Keynote, and Google Slides.


7 diapositivas
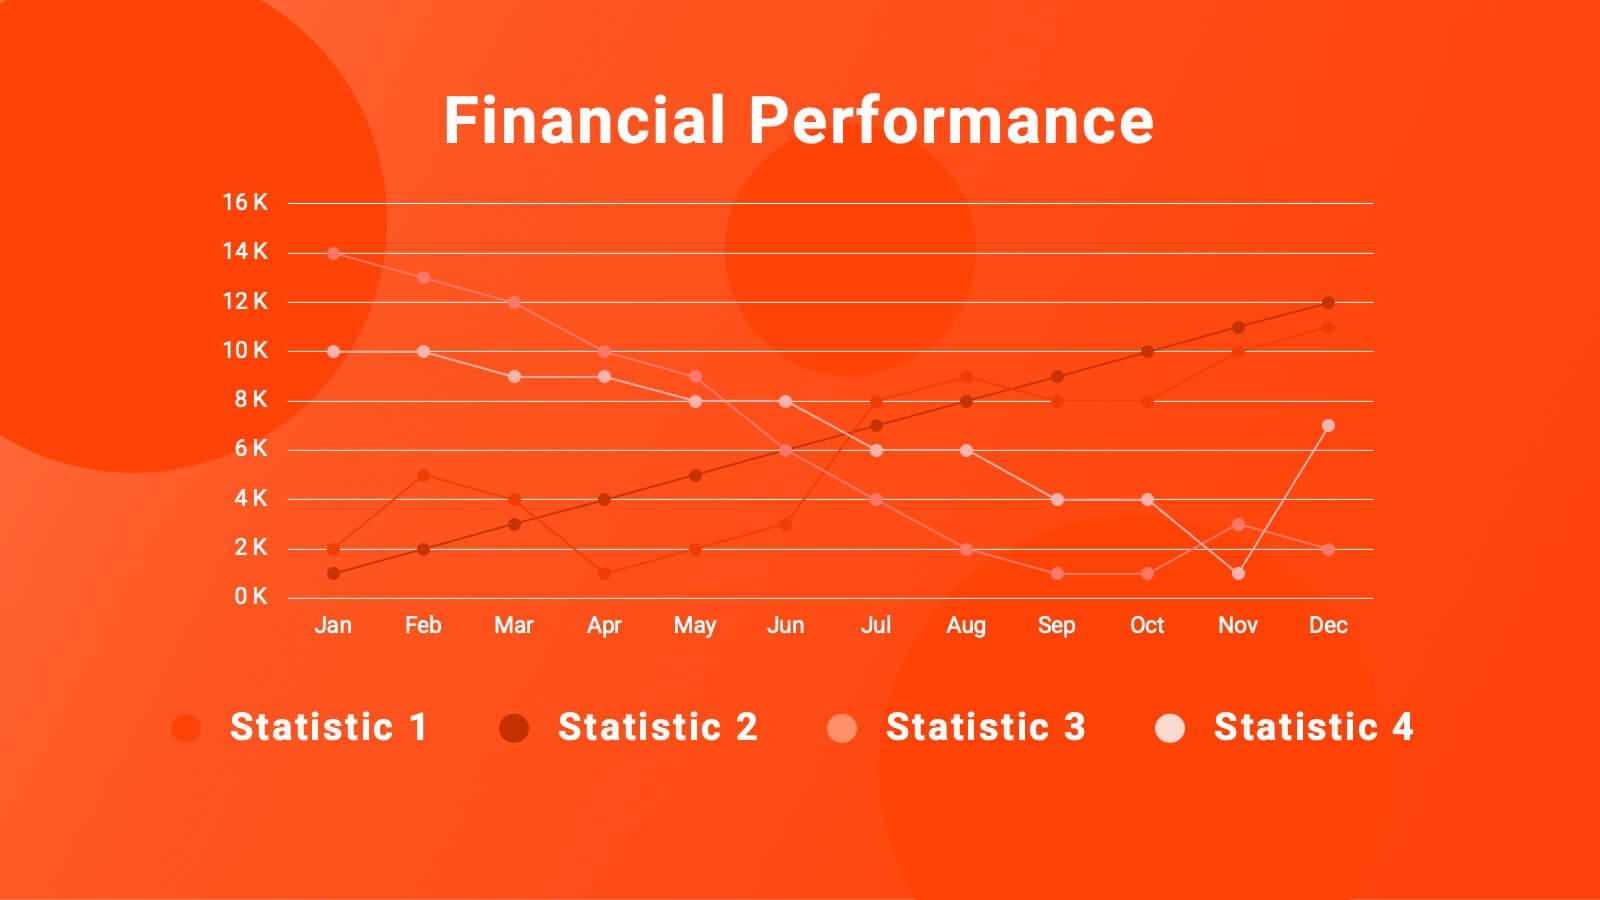
Harvey Ball Infographics Presentation Template
Featuring our Harvey Ball Infographic template, this is best used for presenting data from a variety of sources in an interactive way, showing charts and graphs, with the main point highlighted by using a bullet-pointed list at the bottom of the slide. This presentation template was designed to help you put your data into a visual representation that will capture the attention of your audience. This is great for business presentations and data visualizations, it is simple to create a professional looking presentations that will showcase your data in the most effective way possible.


7 diapositivas
Communication Styles Infographic
Dive into the diverse world of communication with our communication styles infographic. Set against a palette of blue, yellow, and white, this template offers a visual exploration of different communication methods and their nuances. Whether it's assertive, passive, aggressive, or passive-aggressive, understanding these styles is vital in both personal and professional settings. Ideal for corporate trainers, educators, students, or anyone aiming to improve their interpersonal skills. Crafted for clarity and compatibility, this infographic is an excellent addition to PowerPoint, Keynote, and Google Slides, ensuring your presentations resonate with both substance and style.


2 diapositivas
Website UI Mockup Device Display Presentation
Showcase your website's interface with the Website UI Mockup Device Display slide. This professional and modern layout features a desktop screen to elegantly present your web design, user interface, or digital product. Perfect for designers, developers, and marketing presentations. Fully editable and compatible with PowerPoint, Keynote, and Google Slides.


26 diapositivas
Kasra Presentation Template
Fitness is an important part of good health. It improves your quality of life and may keep you from getting sick by helping to strengthen your immune system, prevent heart disease and reduce the risk of diabetes and much more. The Kasra template will help you deliver your message with an impact. Whether you're selling your product, promoting an event, or creating a landing page, this template features the necessary components to capture your audience's attention. This provides you with a powerful platform to engage others, illustrate key messages and demonstrate deep insight into an issue.


24 diapositivas
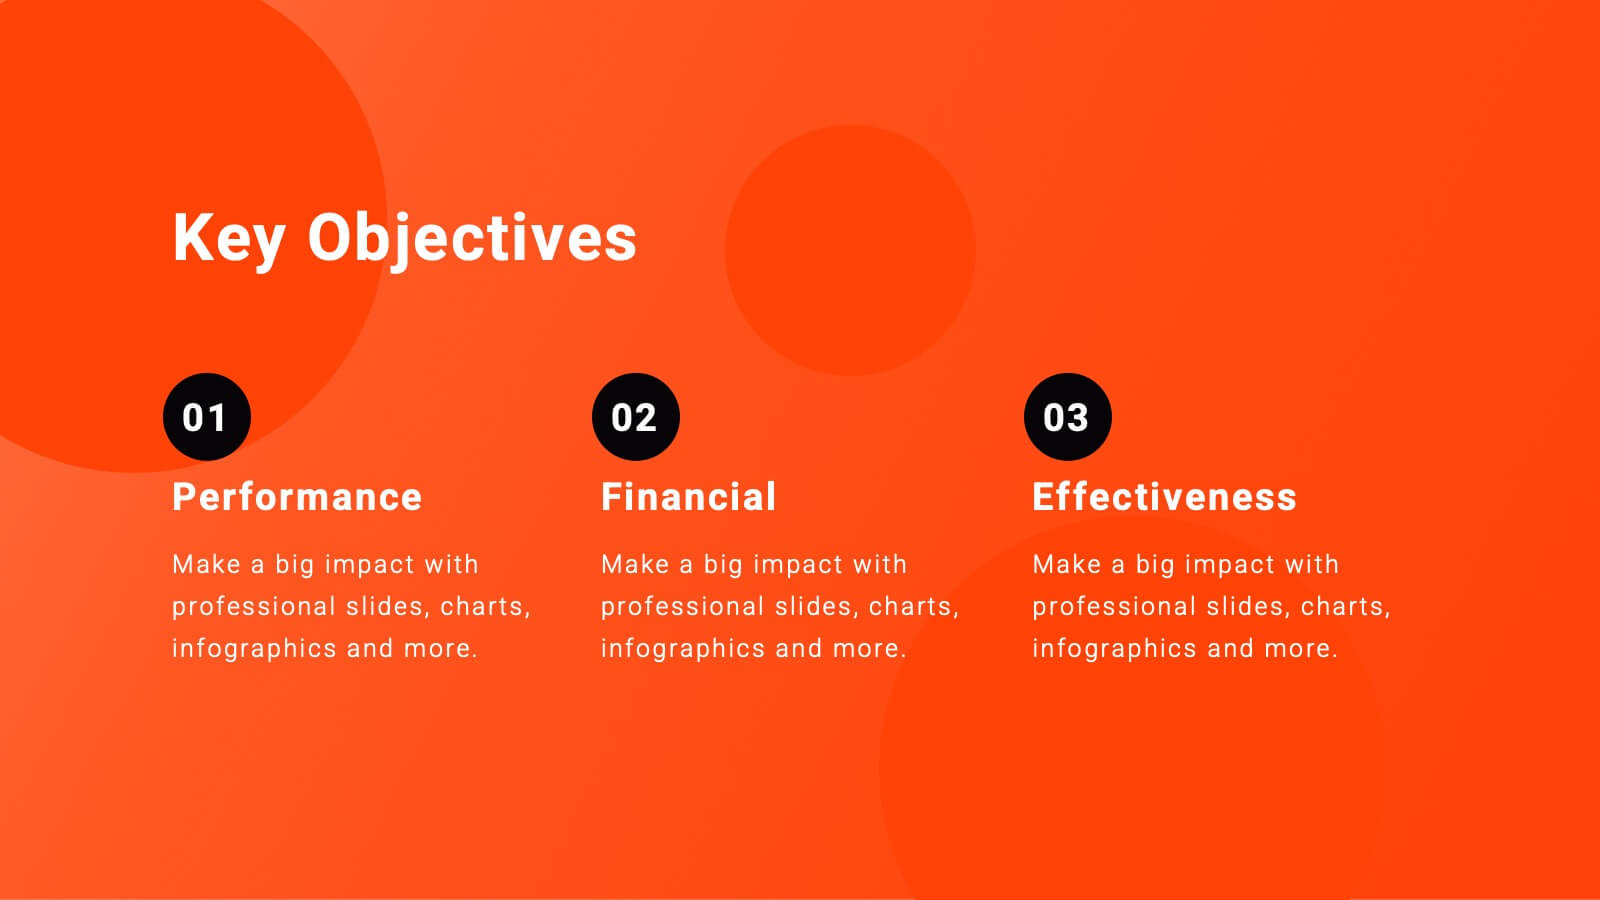
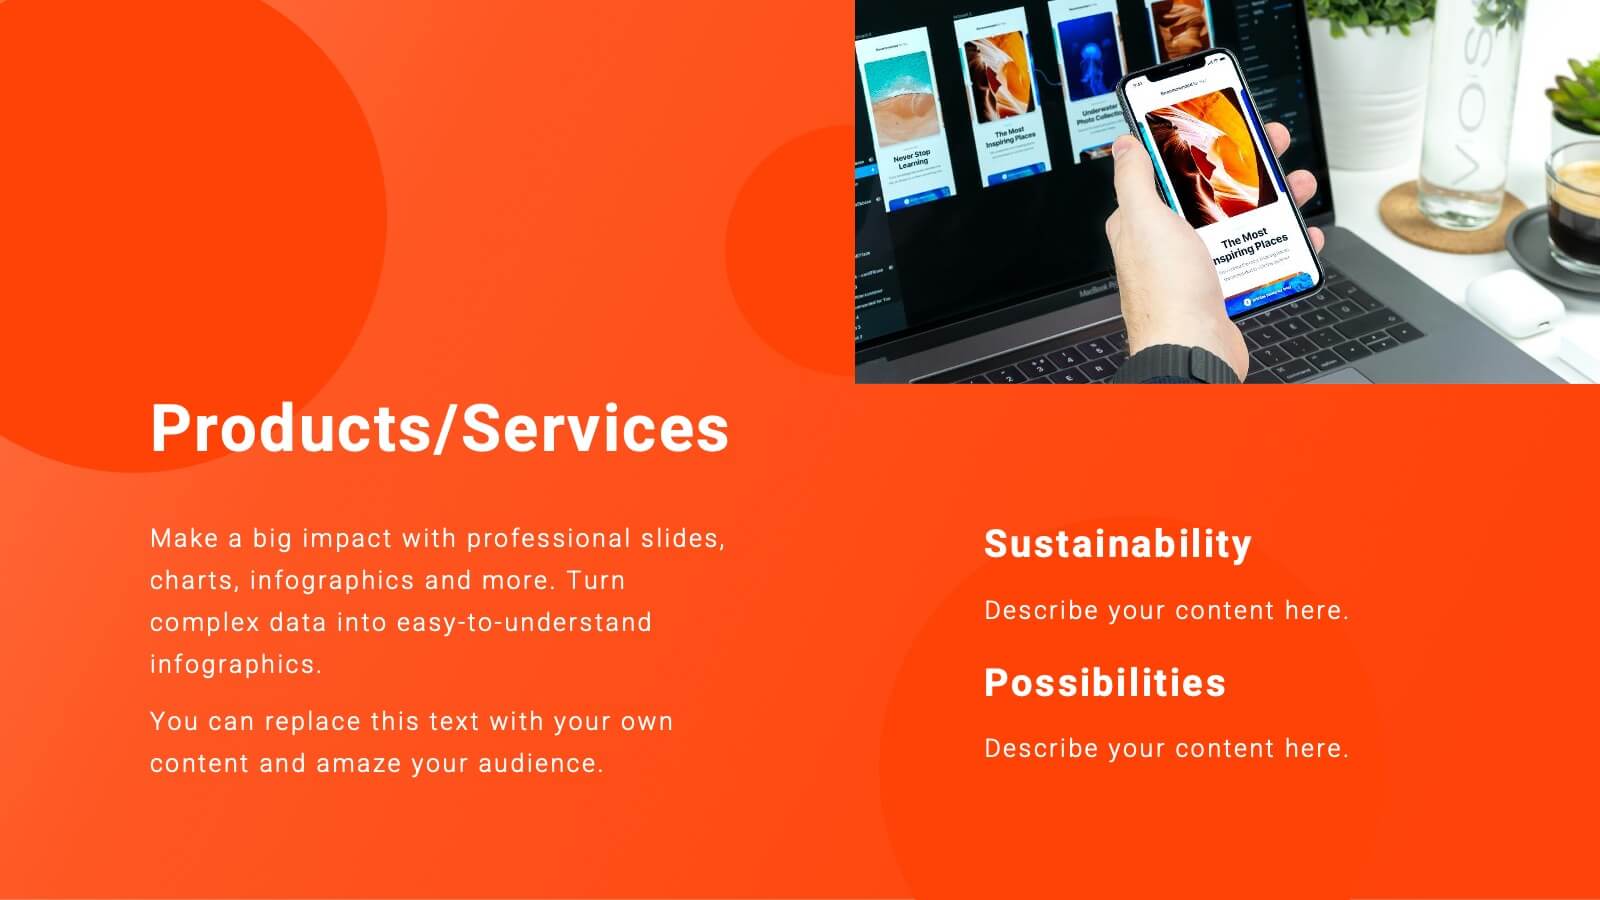
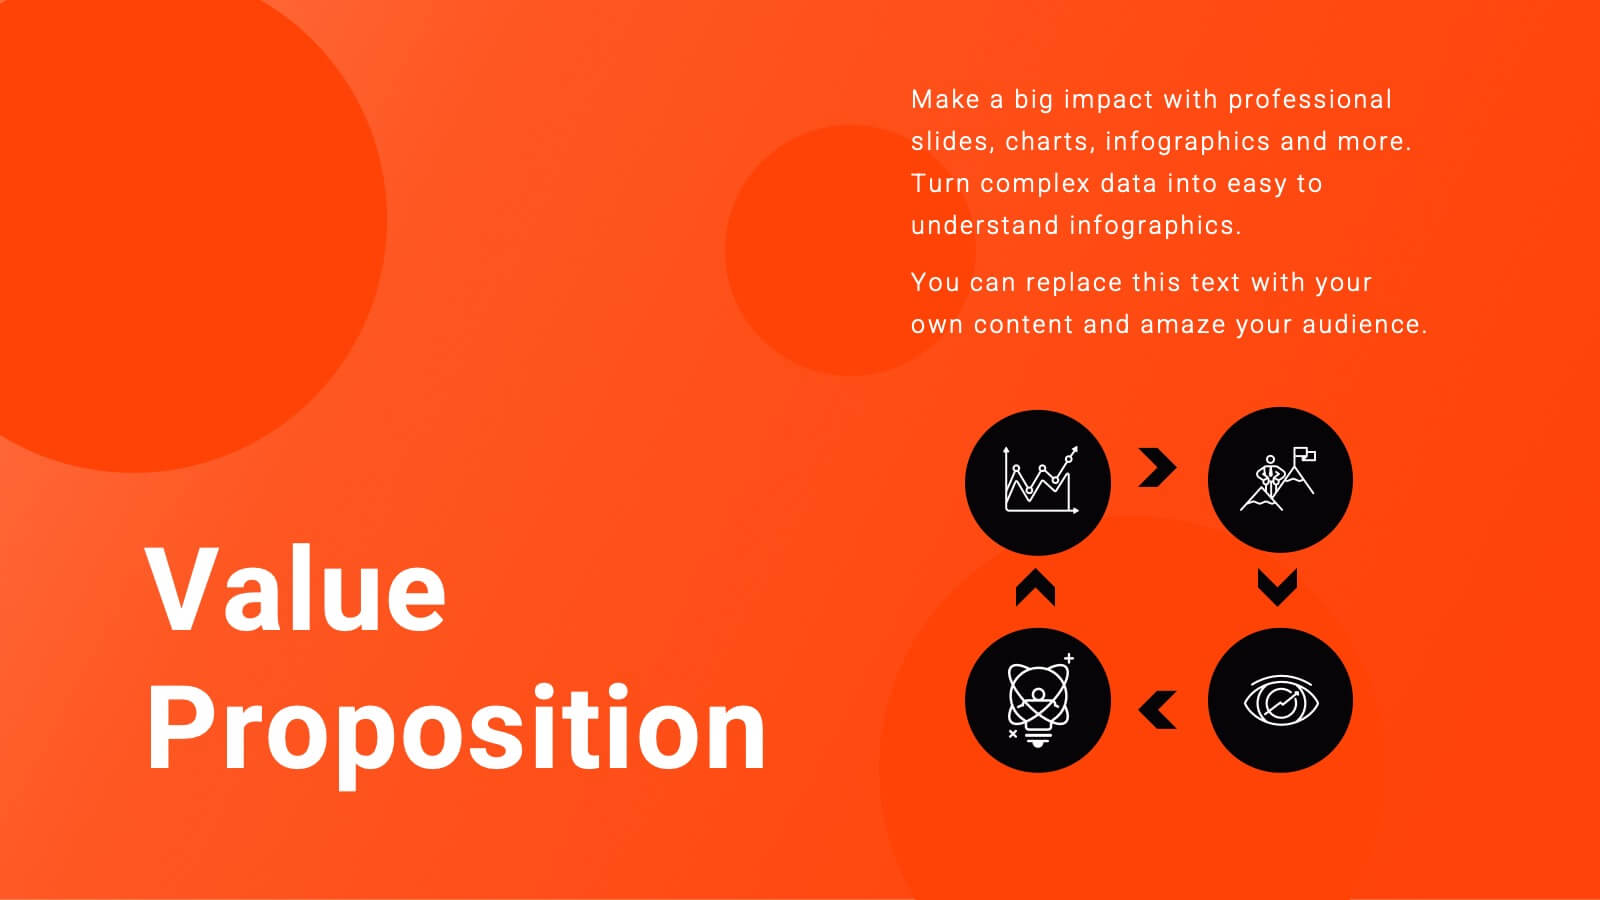
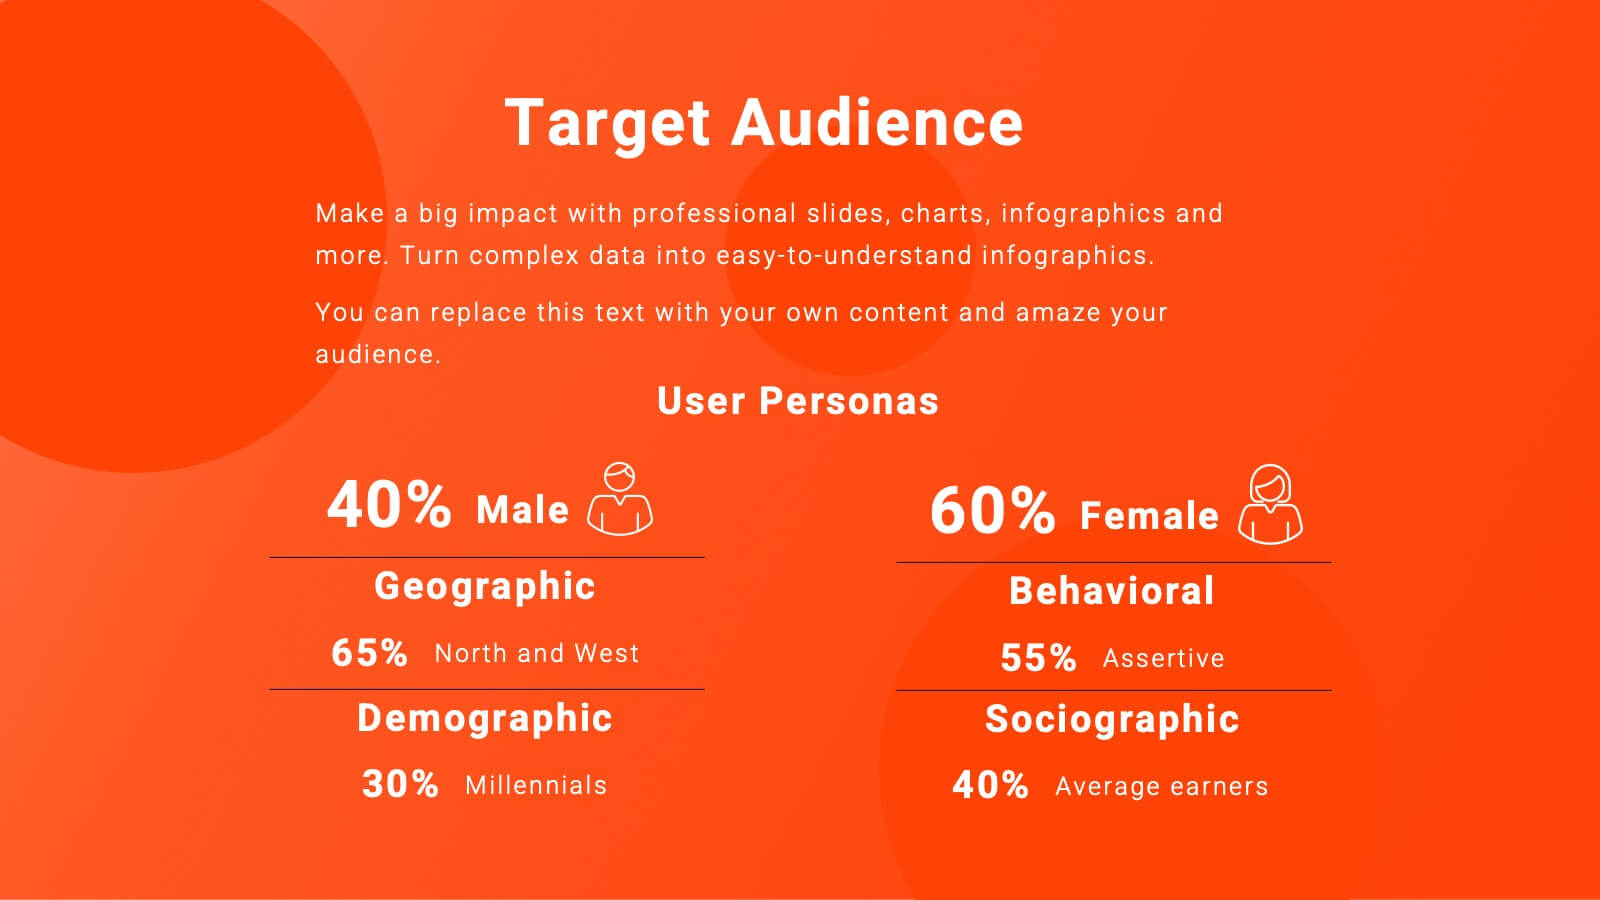
Djinn Brand Identity Presentation
Unleash the power of your brand with this sleek and modern presentation template! From brand identity components to target audience personas, this template covers everything you need to craft a cohesive and compelling brand strategy. Whether showcasing brand guidelines or success stories, it’s designed for maximum clarity and impact. Compatible with PowerPoint, Keynote, and Google Slides for effortless presentations.


26 diapositivas
Coffee Shop Simple Presentation
Perk up your presentation with this Coffee Shop template, brimming with the energy of a bustling café. It’s the perfect blend for baristas, café owners, or anyone presenting on the coffee industry. The design features rich, warm colors and images that evoke the cozy ambiance of a coffee shop. Introduce your team with 'Meet Our Team' slides, and discuss your menu or business strategies with the option slides. Utilize the 'Chart Slide' for sales figures or customer preferences, and map out your global coffee sources with the 'Asia Map Slide'. The 'Mobile Device Mockup' is ideal for demonstrating your café's app or online ordering system. Each slide is like a cup of your finest brew—crafted to energize and engage your audience. The 'Thank You' slide sends them off with the satisfaction of a well-spent coffee break. This template isn’t just a visual aid; it's an experience, inviting your audience to savor every detail of your coffee-centric venture.