


Características


¿Tienes alguna pregunta?
Recomendar


8 diapositivas
Corporate Office Scenes Illustrations Presentation
Bring workplace communication to life with this slide featuring an illustrated office meeting scene and a four-point list layout. Each segment is color-coded with accompanying icons, making it ideal for presenting corporate strategies, team roles, or process workflows. Designed for clarity and visual appeal, this slide is perfect for business reports, training decks, or client briefings. Easily customizable in PowerPoint, Keynote, and Google Slides.


5 diapositivas
Business Organizational Structure Presentation
Showcase your Business Organizational Structure with this modern and professional infographic template. Designed to visually represent company hierarchy, this slide enhances clarity in roles, team relationships, and reporting structures. Fully customizable in PowerPoint, Keynote, and Google Slides, making it perfect for corporate strategy presentations, HR reports, and leadership meetings.


22 diapositivas
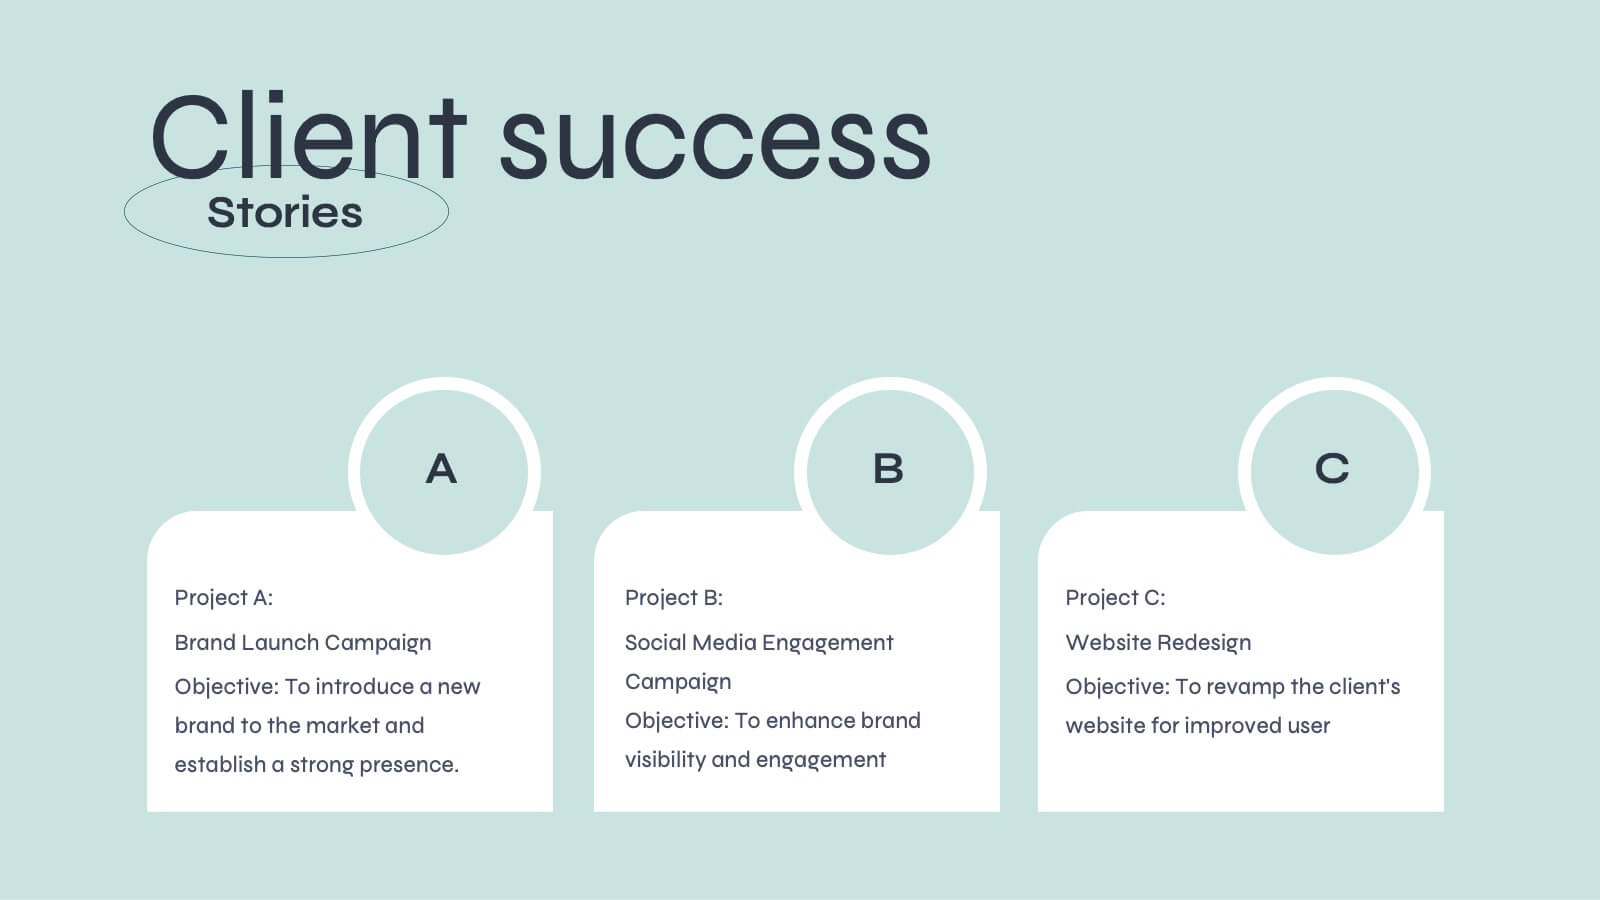
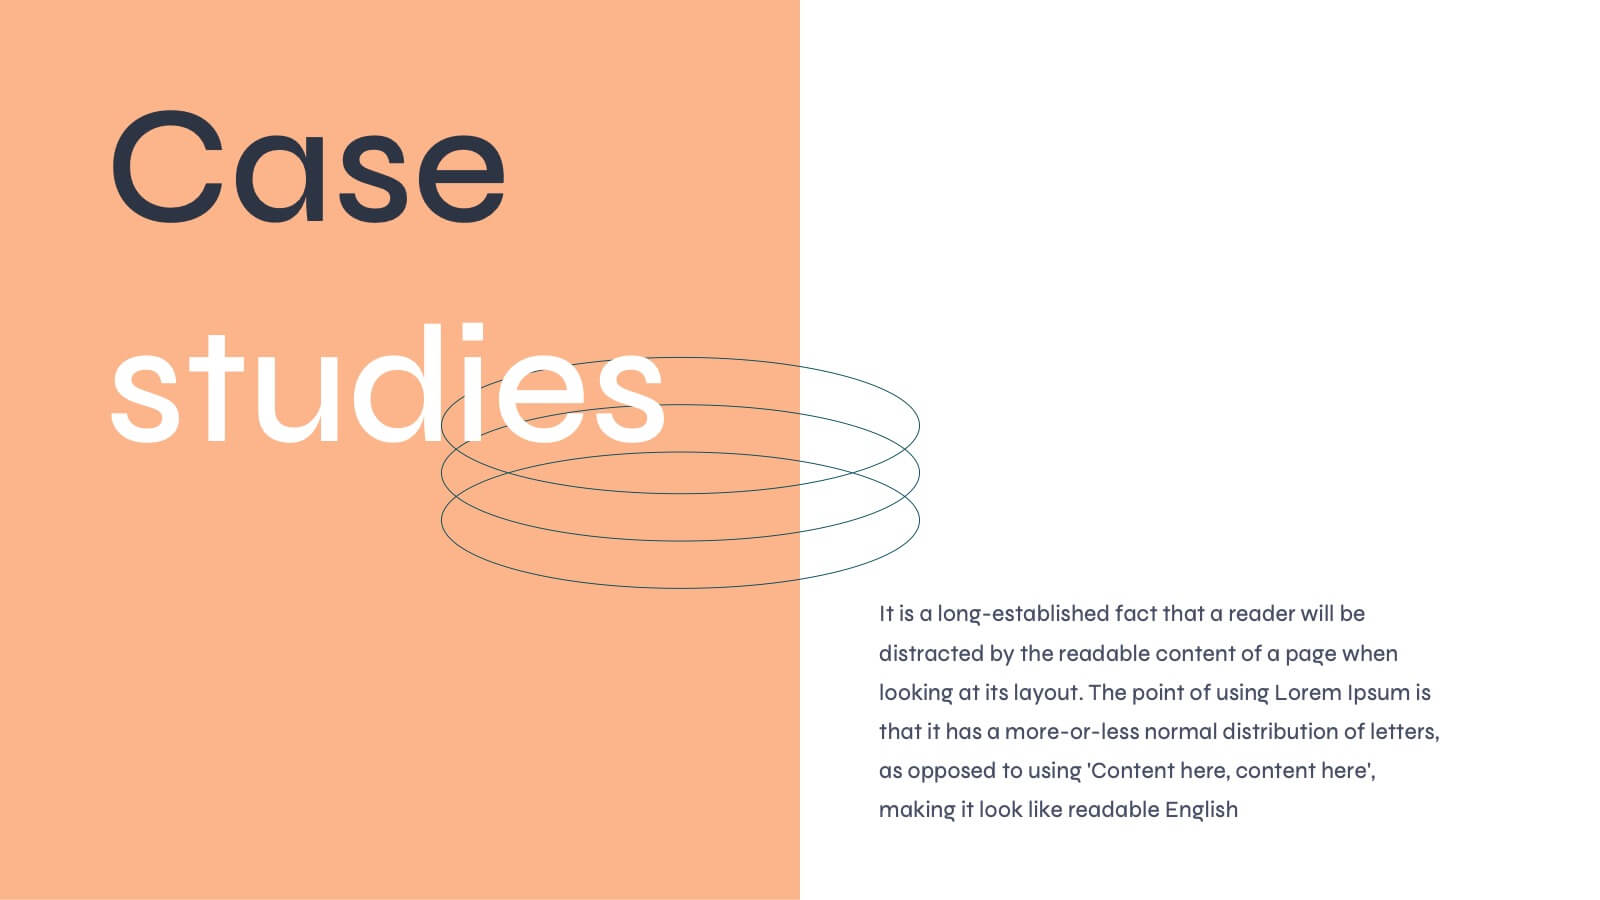
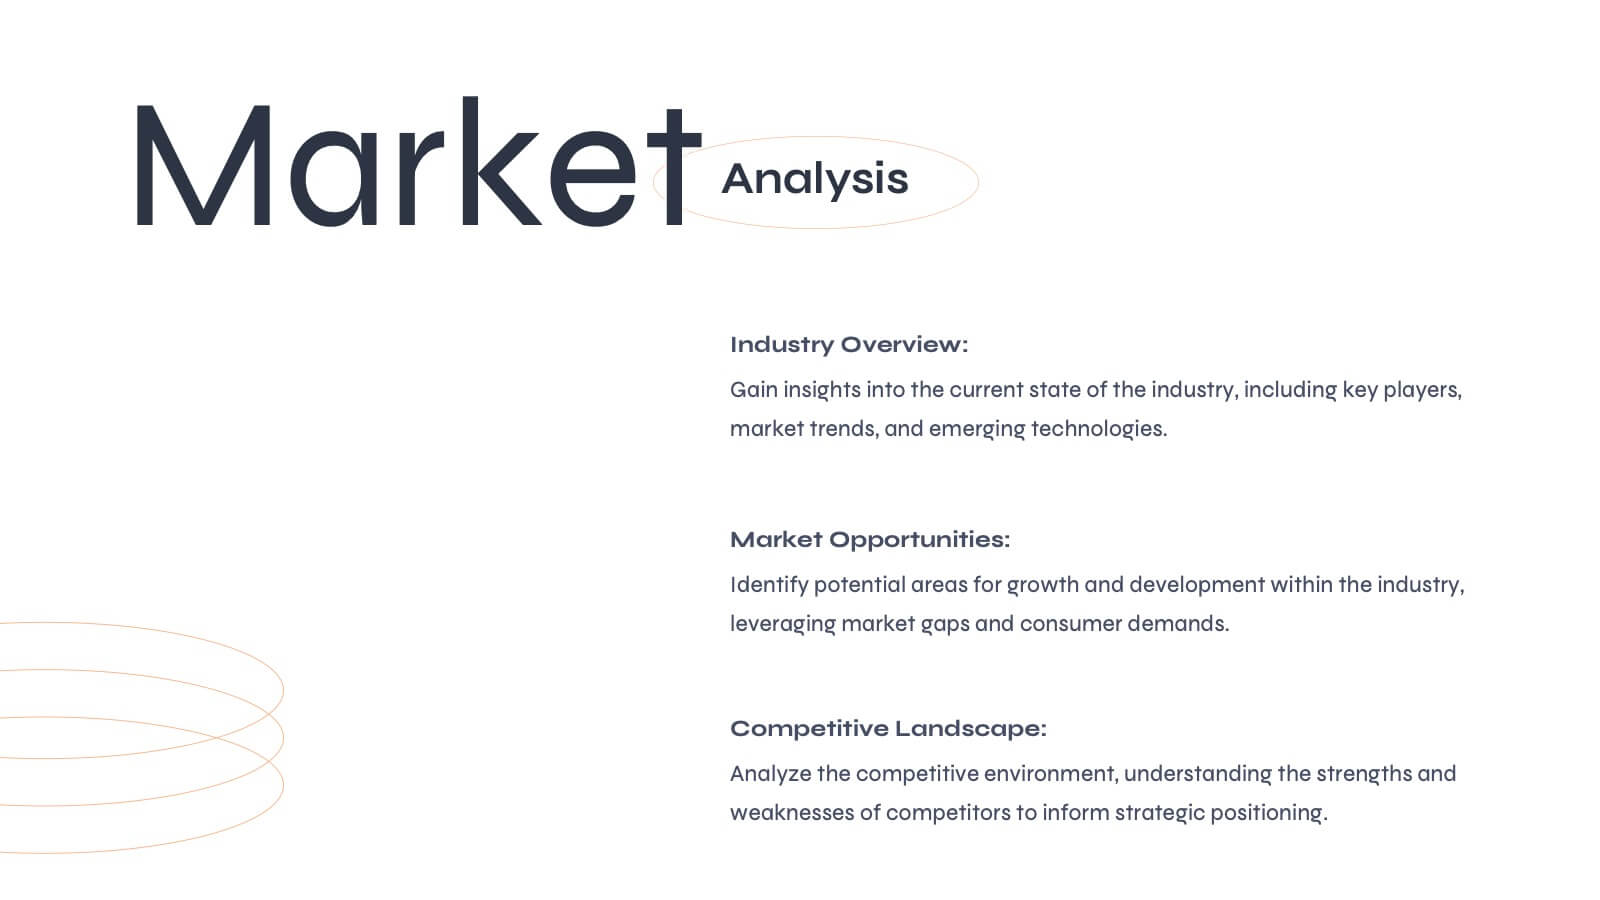
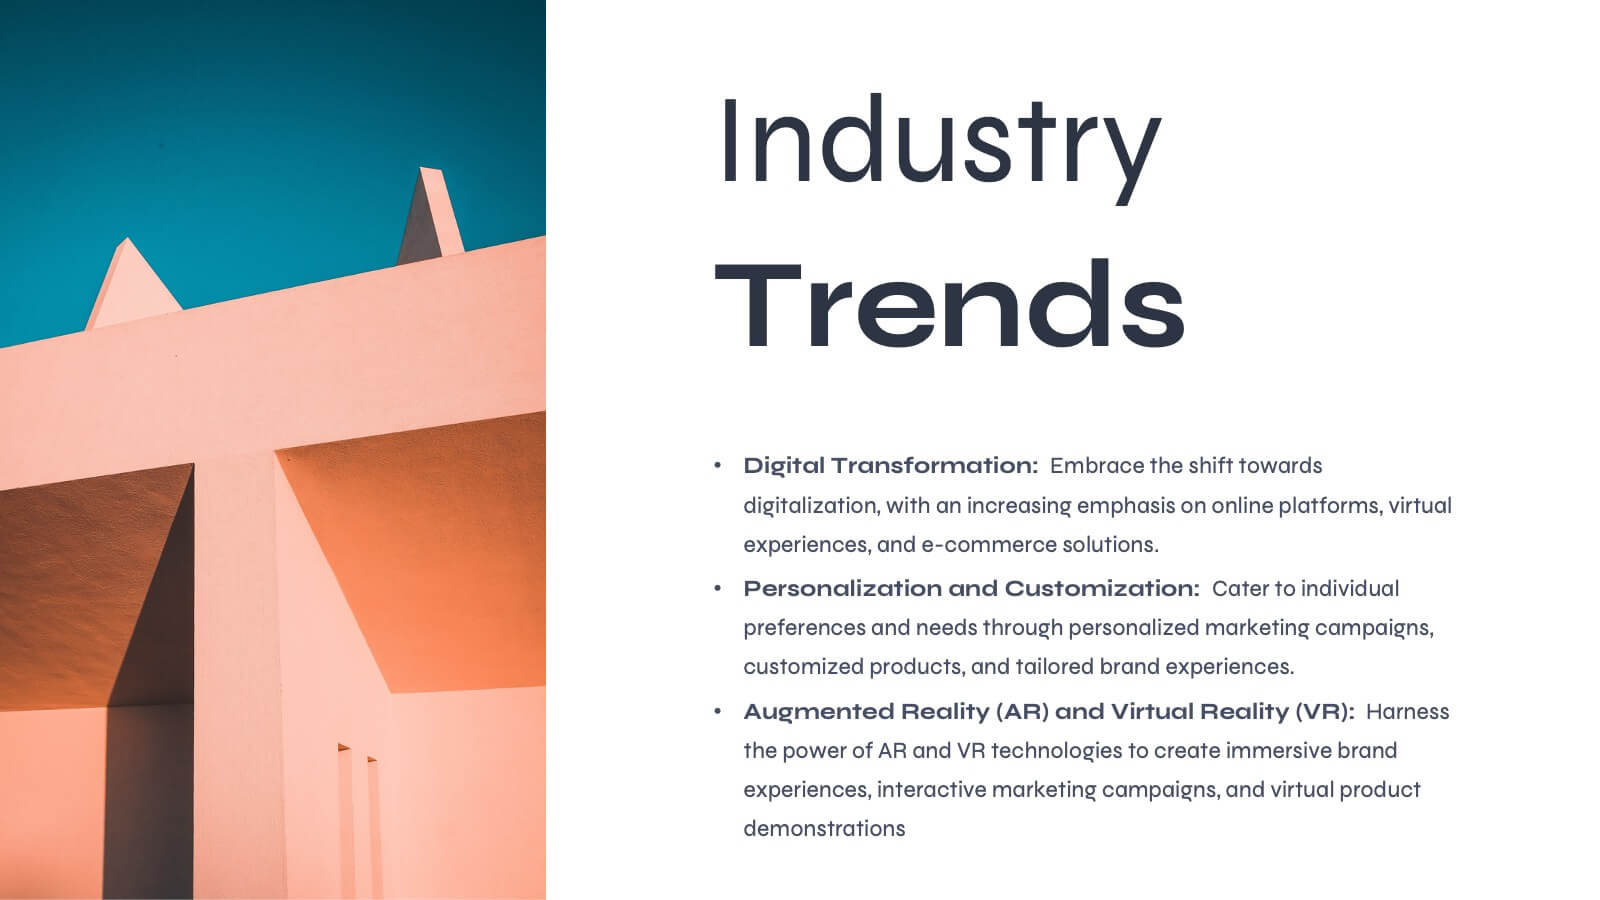
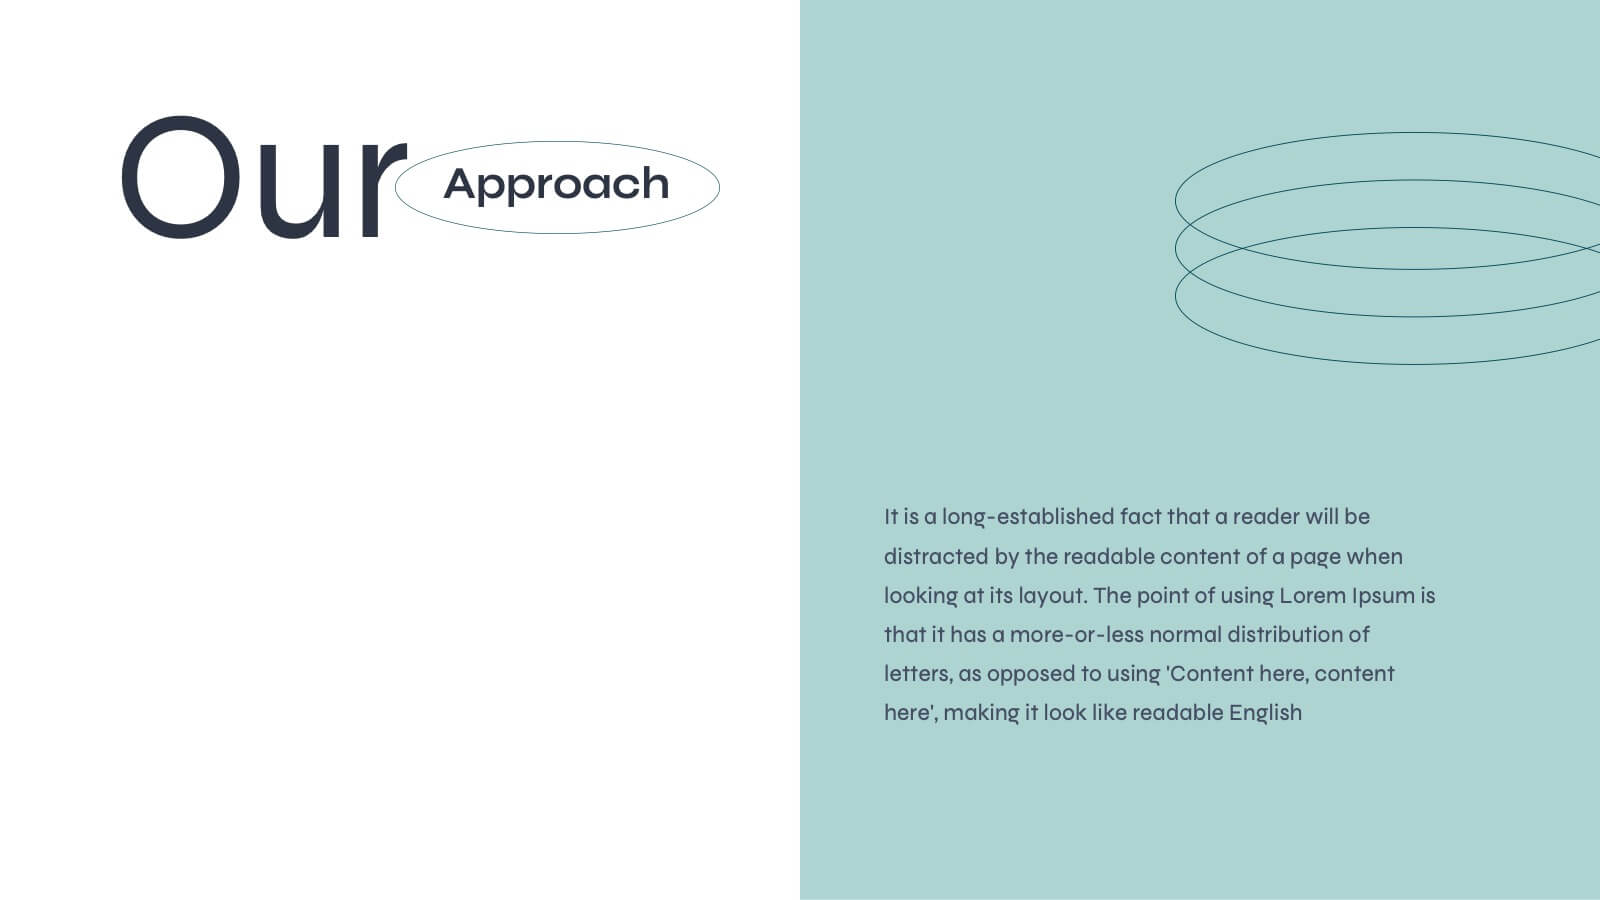
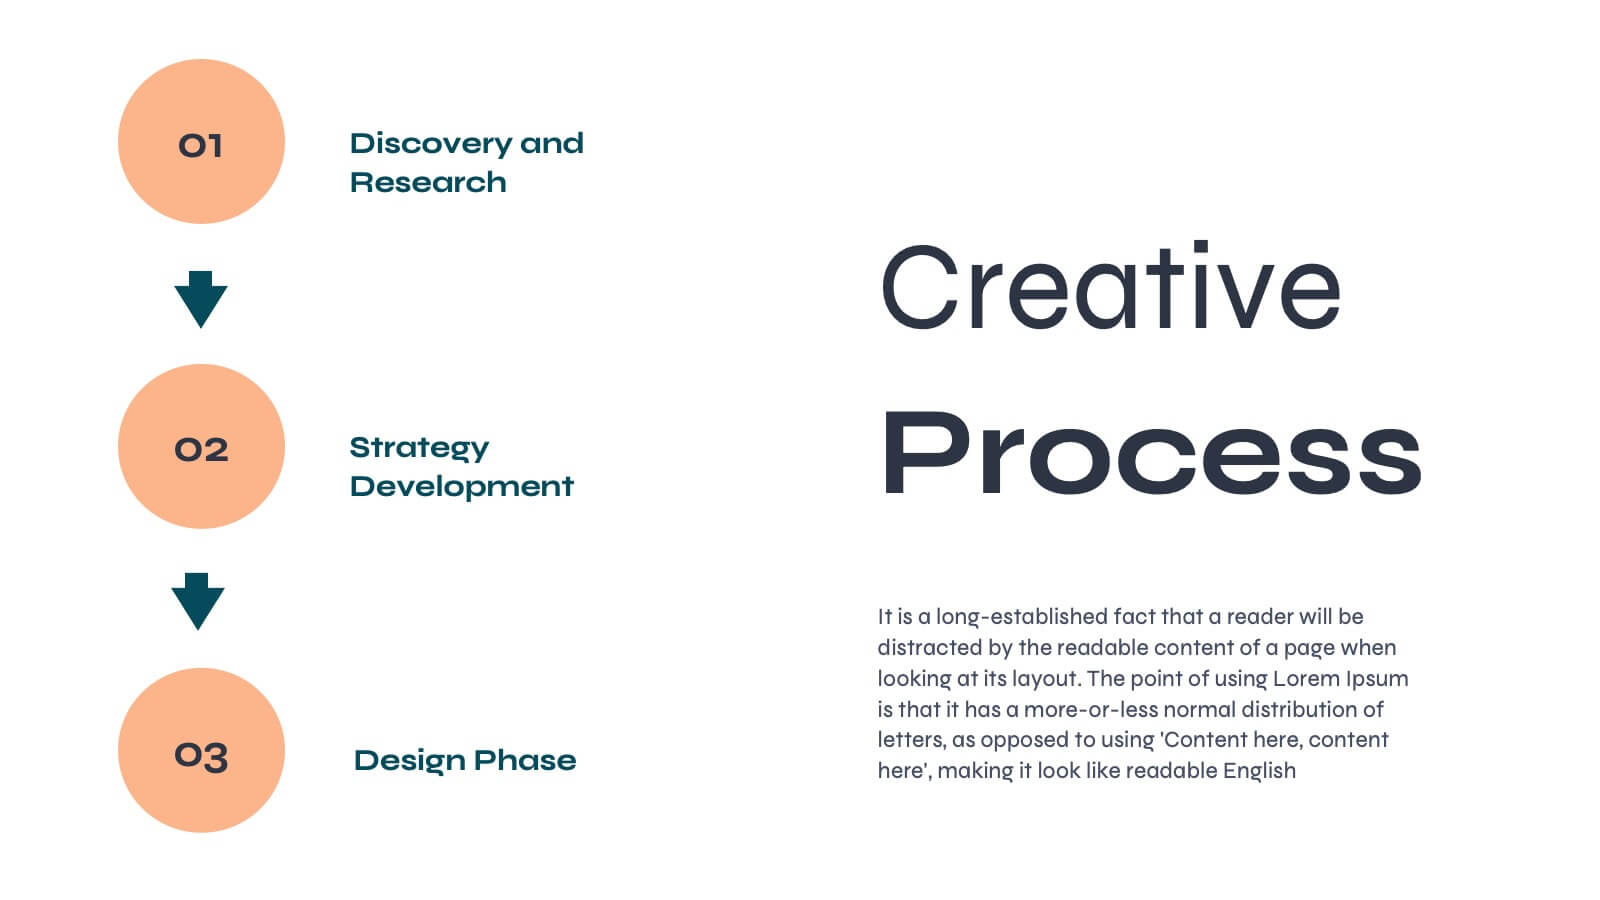
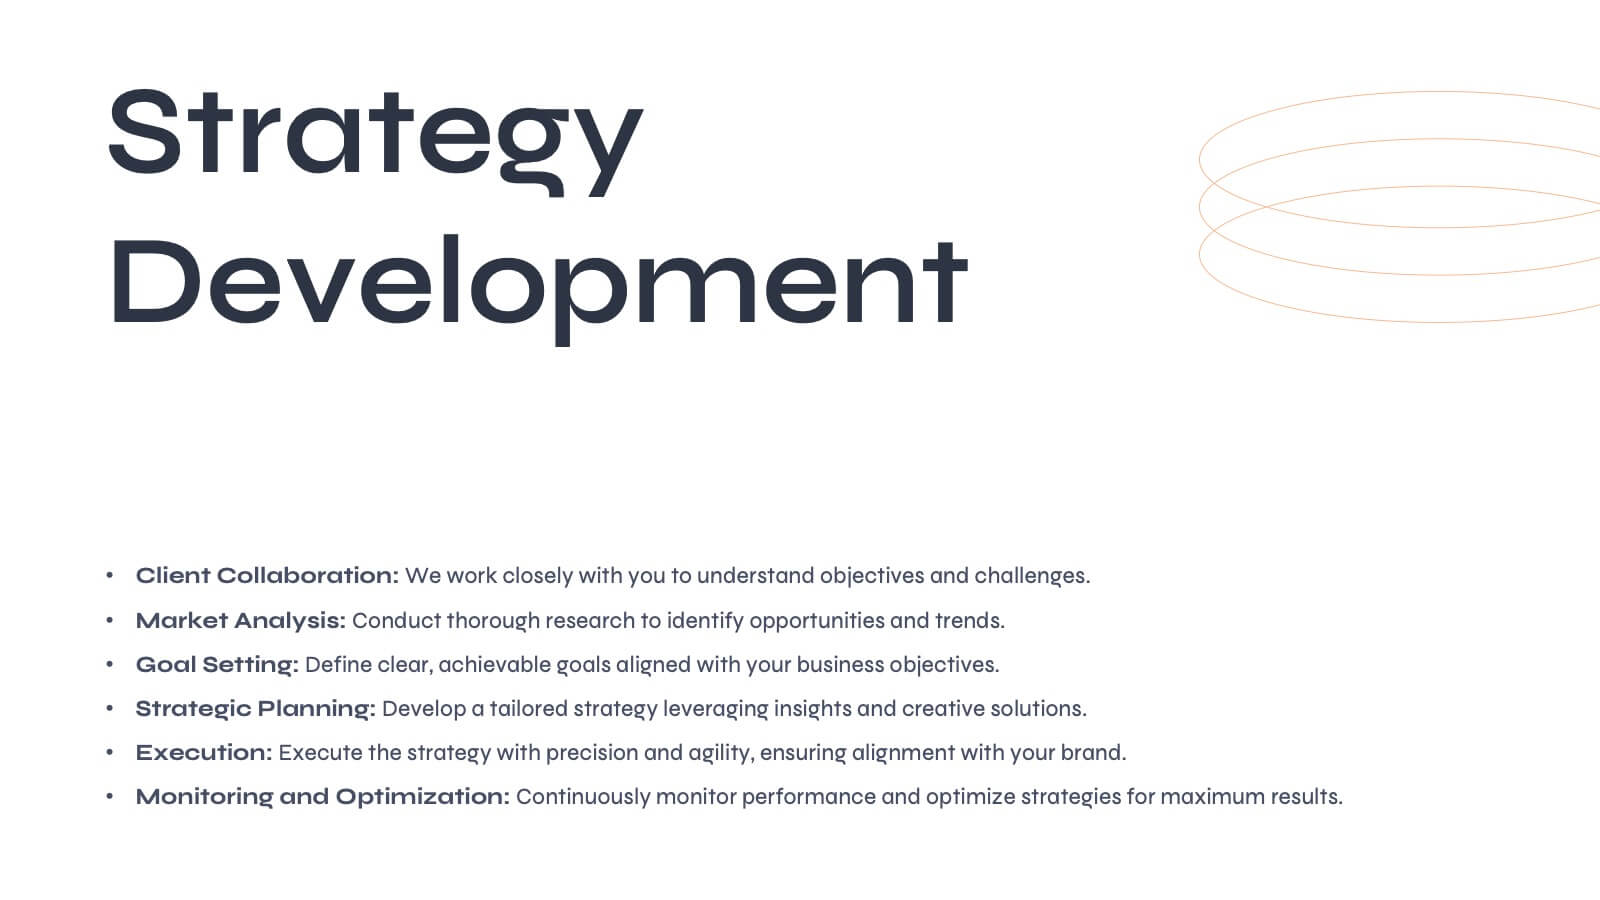
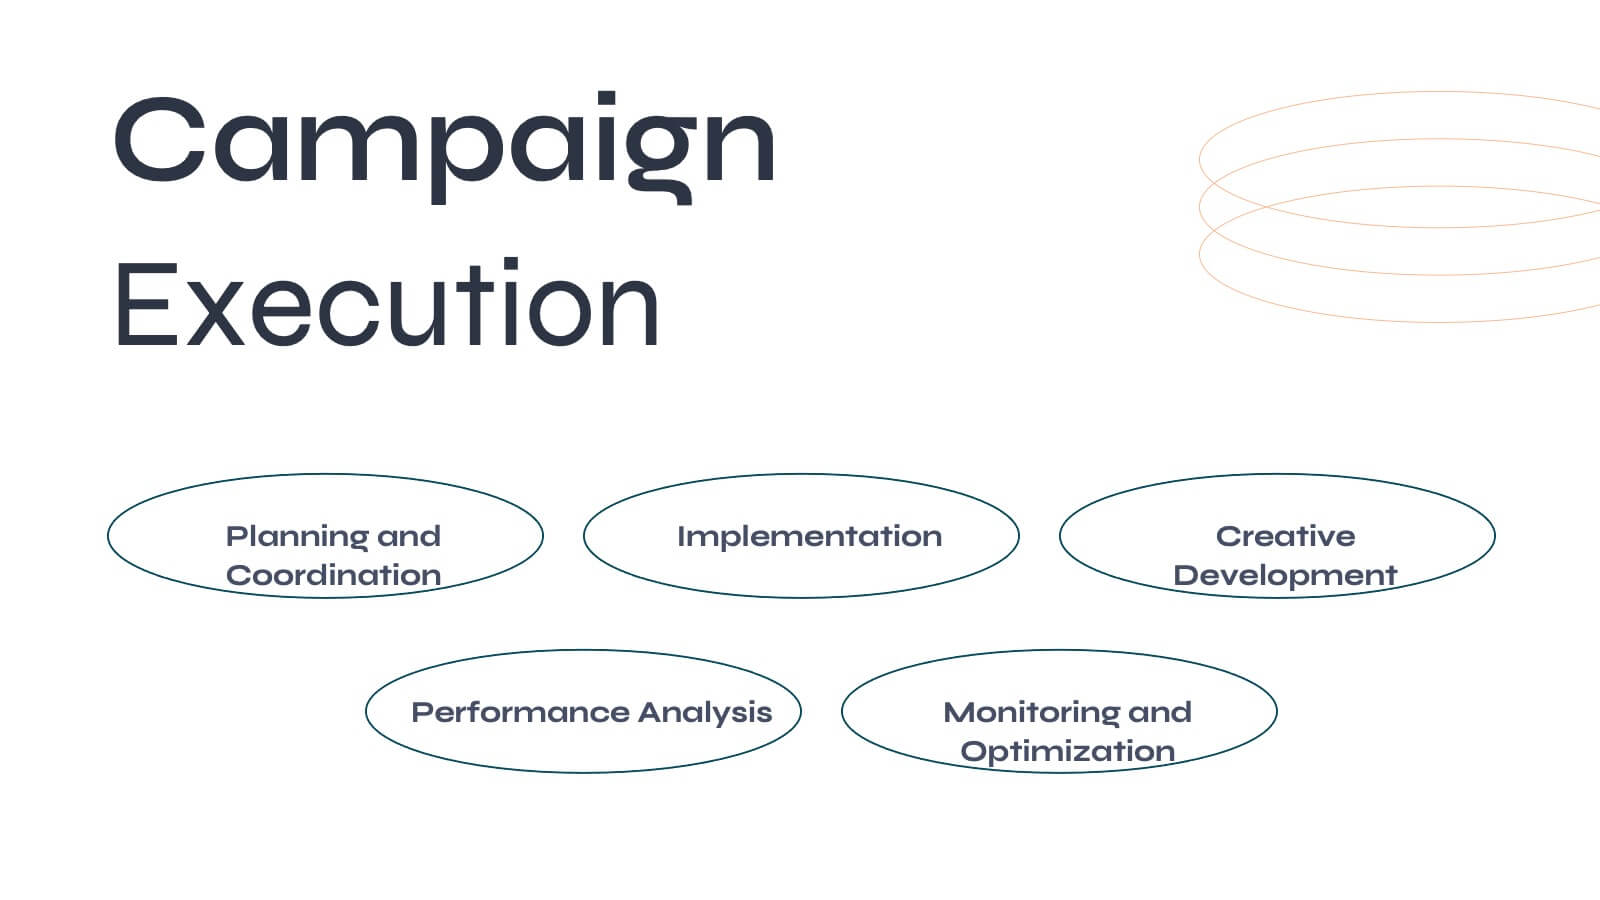
Aurora Agency Portfolio Presentation
Showcase your agency's strengths with this polished, modern presentation template. Perfect for presenting market analysis, client success stories, and creative processes, it features a clean and professional design. Highlight your team's expertise and strategic approach to impress potential clients. Compatible with PowerPoint, Keynote, and Google Slides, it ensures seamless presentations on any platform.


5 diapositivas
Visible vs Hidden Factors Iceberg Chart Presentation
Bring your ideas to life with a visual that instantly reveals the difference between what’s seen and what’s truly shaping the outcome. This presentation helps you break down visible elements and deeper hidden factors using a modern iceberg graphic. Perfect for strategy, analysis, and insights. Compatible with PowerPoint, Keynote, and Google Slides.


26 diapositivas
Competitive Market Analysis Professional Presentation
Navigate the complex landscape of market competition with this comprehensive presentation template, designed to illustrate competitive market analysis with clarity and impact. The sleek slides are steeped in a modern color palette, artfully combining cool purples and warm corals to capture attention and highlight key insights. Strategic use of infographics brings data to life, from SWOT analyses to market segmentation, ensuring the delivery of information is both visually appealing and easily digestible. It's a template that offers professionals and students alike the ability to dissect and present competitive dynamics with precision, whether it’s for a business plan, academic project, or strategic meeting. Each slide is a blueprint for understanding market forces, customer segmentation, and competitive positioning. This template is fully compatible with PowerPoint, Keynote, and Google Slides, making it a versatile and indispensable tool for those seeking to make informed decisions and craft compelling market narratives.


6 diapositivas
Staff Integration and Onboarding Journey Presentation
Streamline your onboarding process with the Staff Integration and Onboarding Journey Presentation. This clean, step-by-step layout uses human icons to represent each phase of a new hire's journey—from orientation to full integration. Ideal for HR professionals, it’s fully editable in Canva, PowerPoint, Keynote, or Google Slides for easy customization.


28 diapositivas
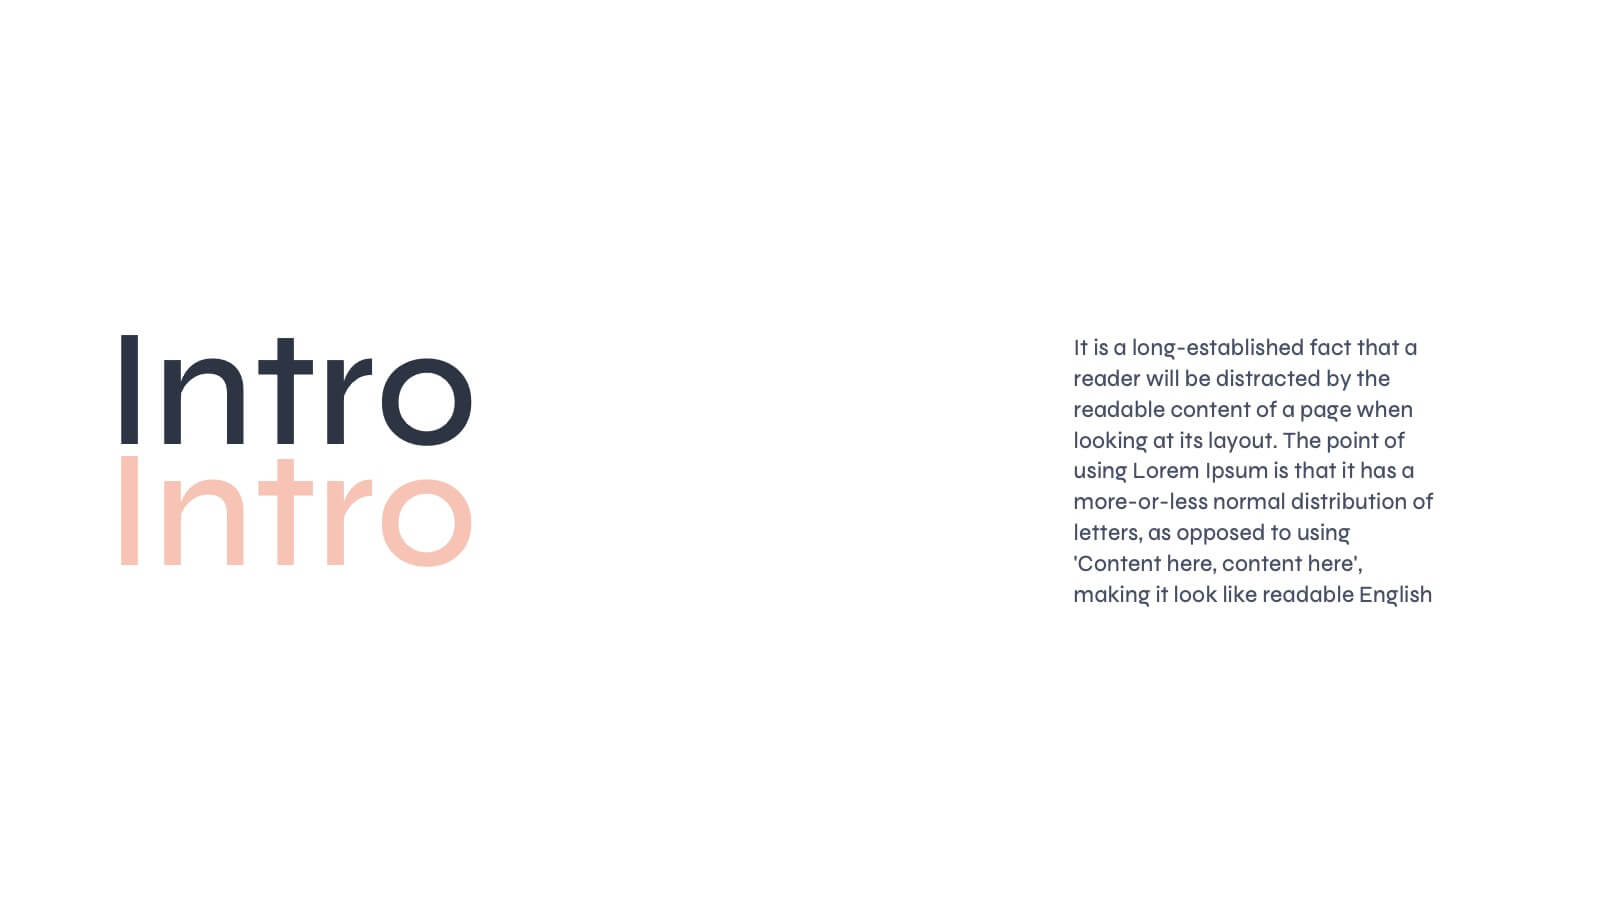
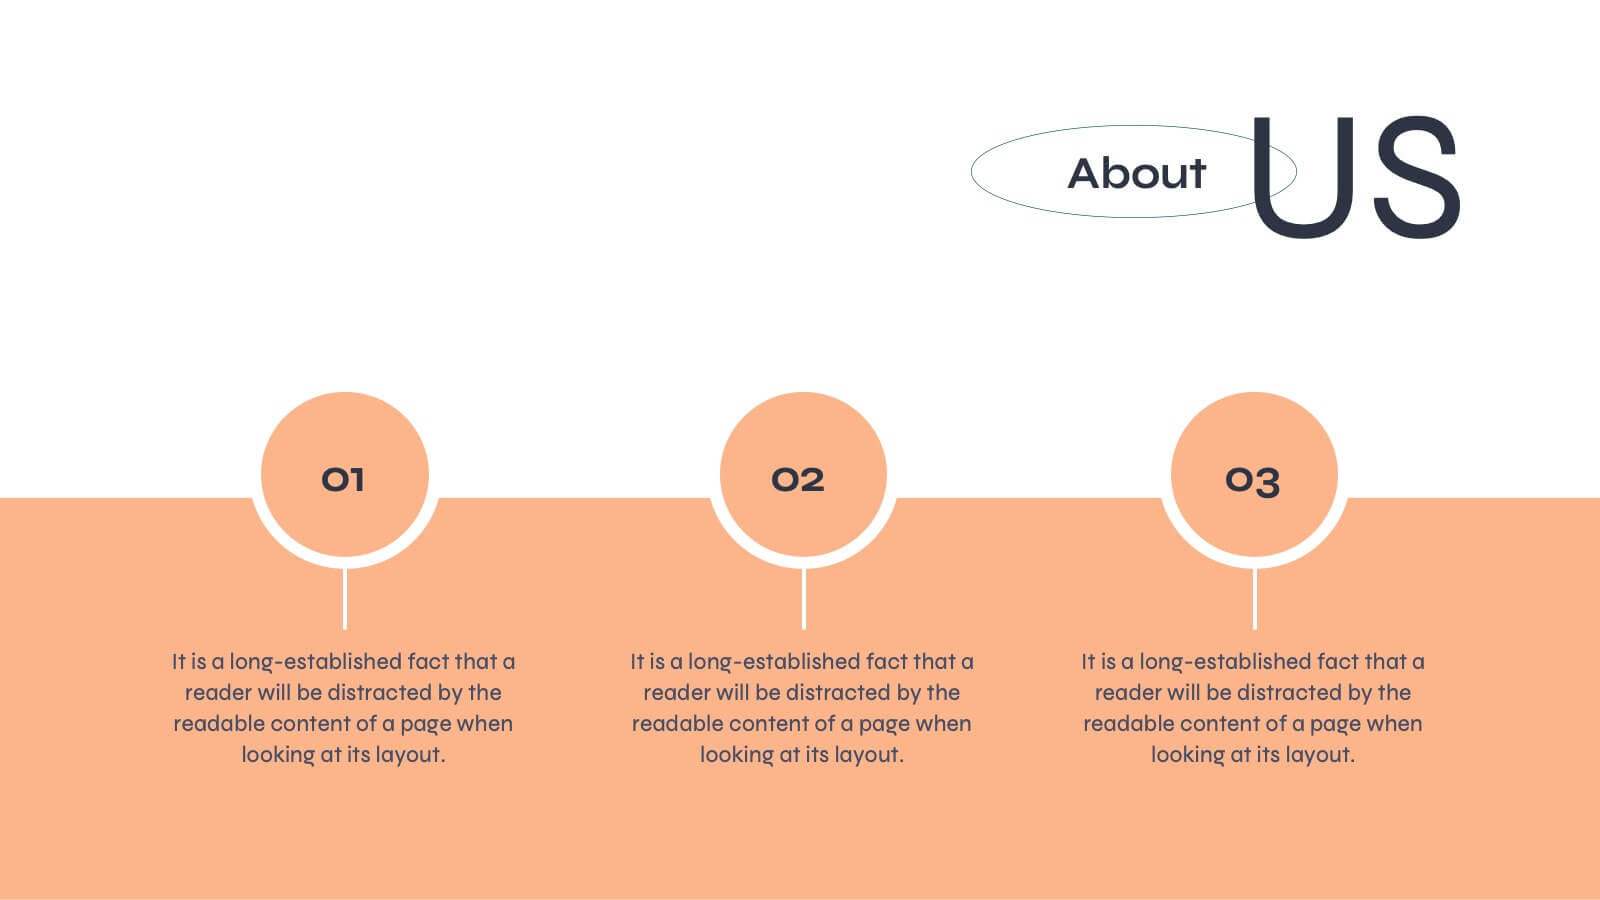
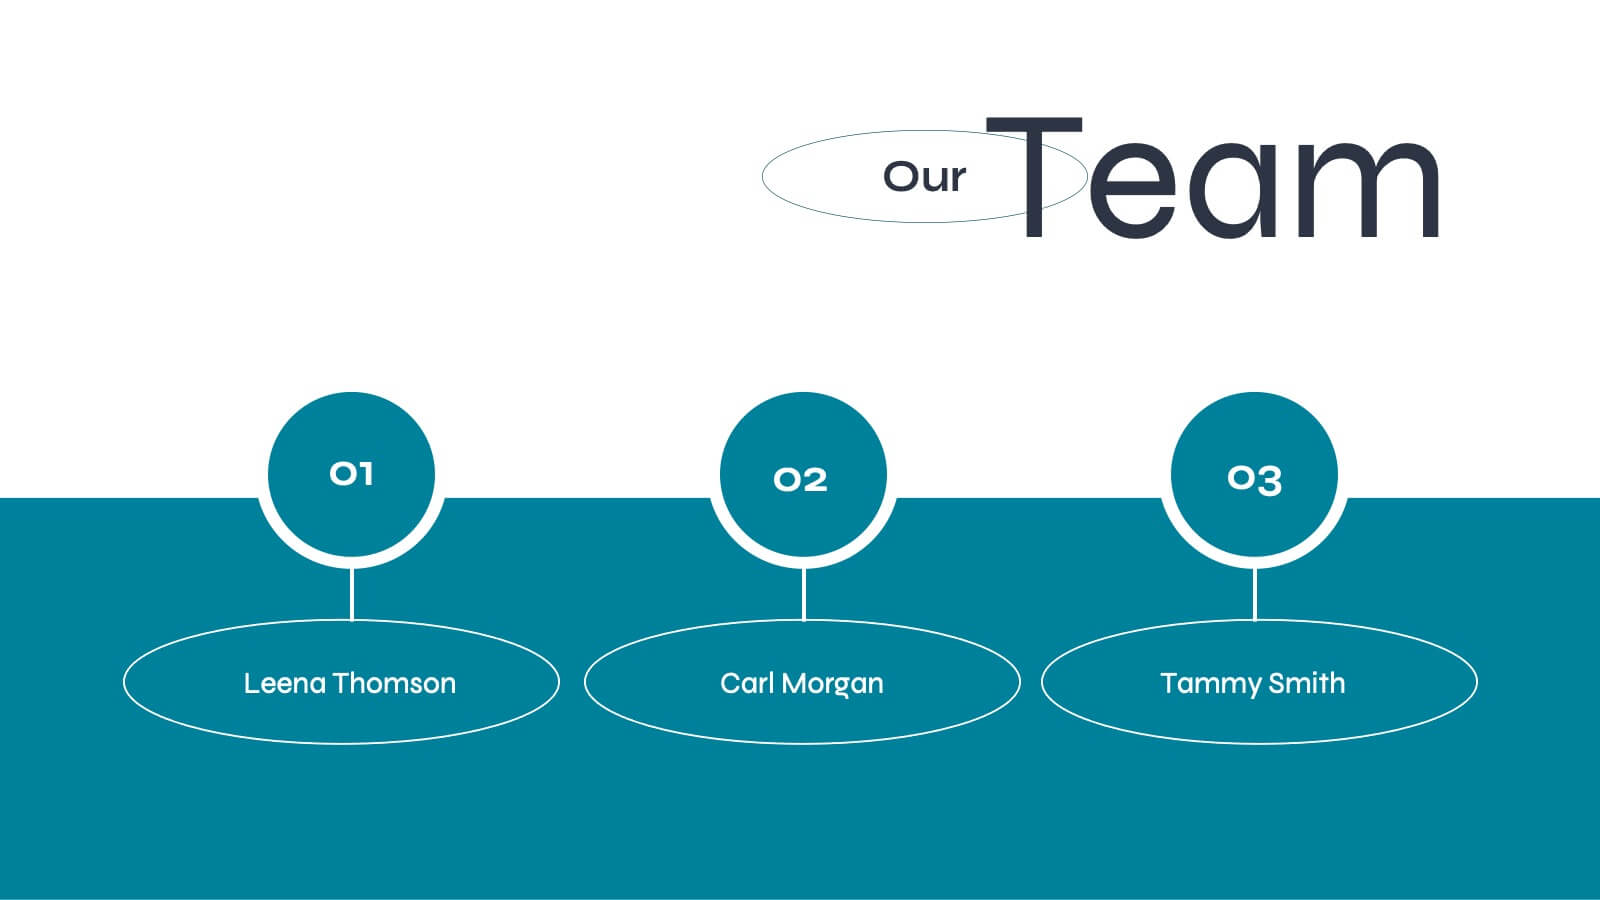
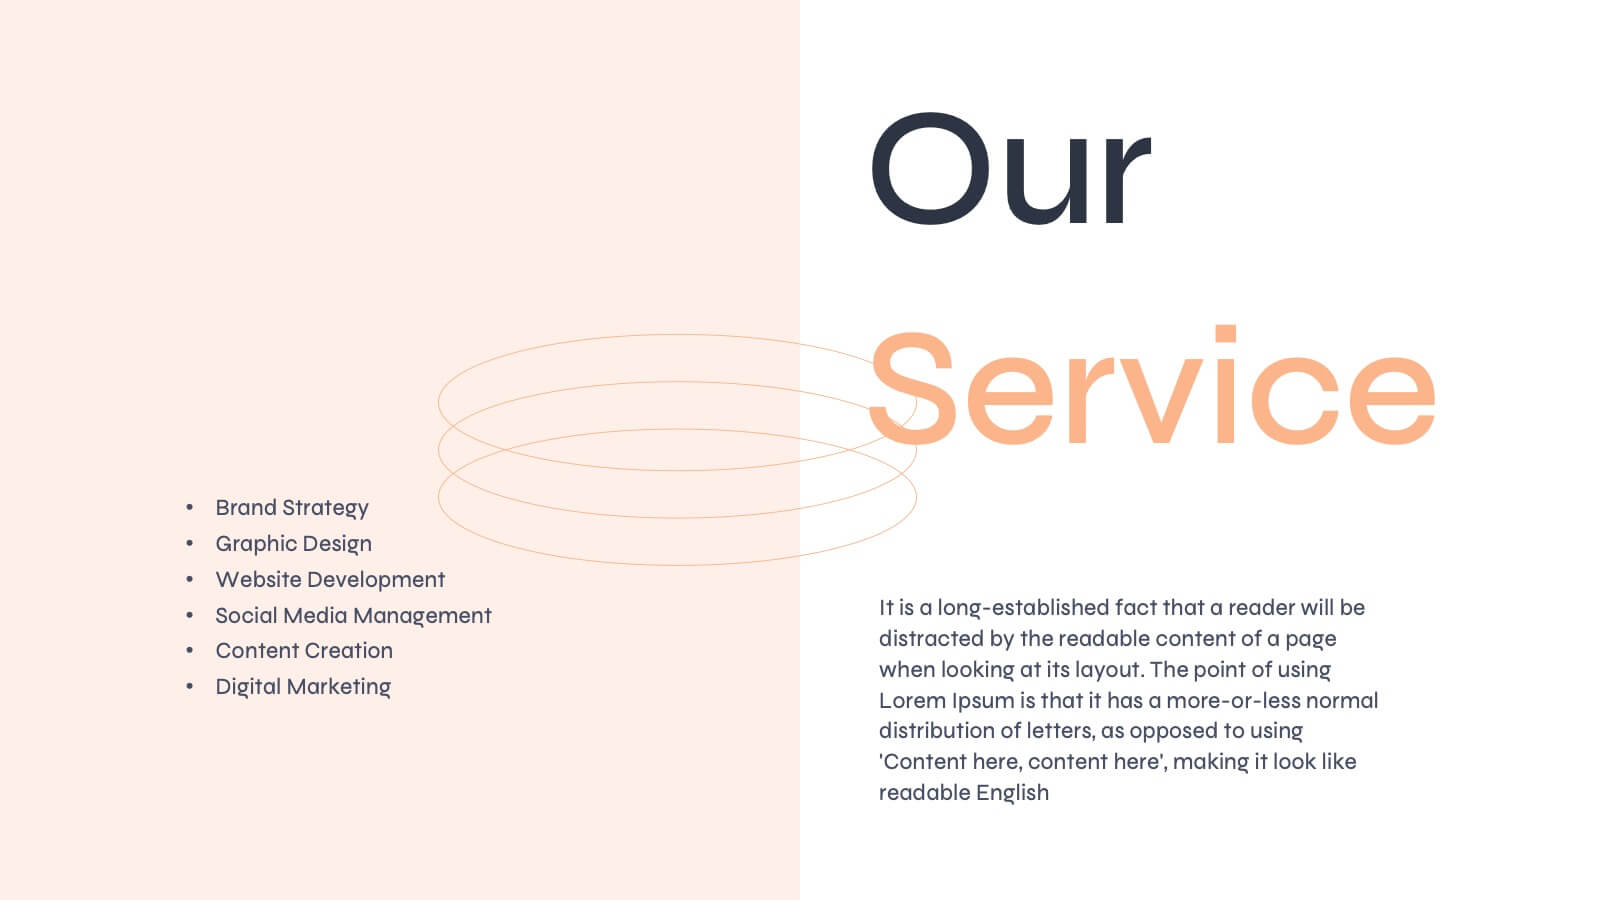
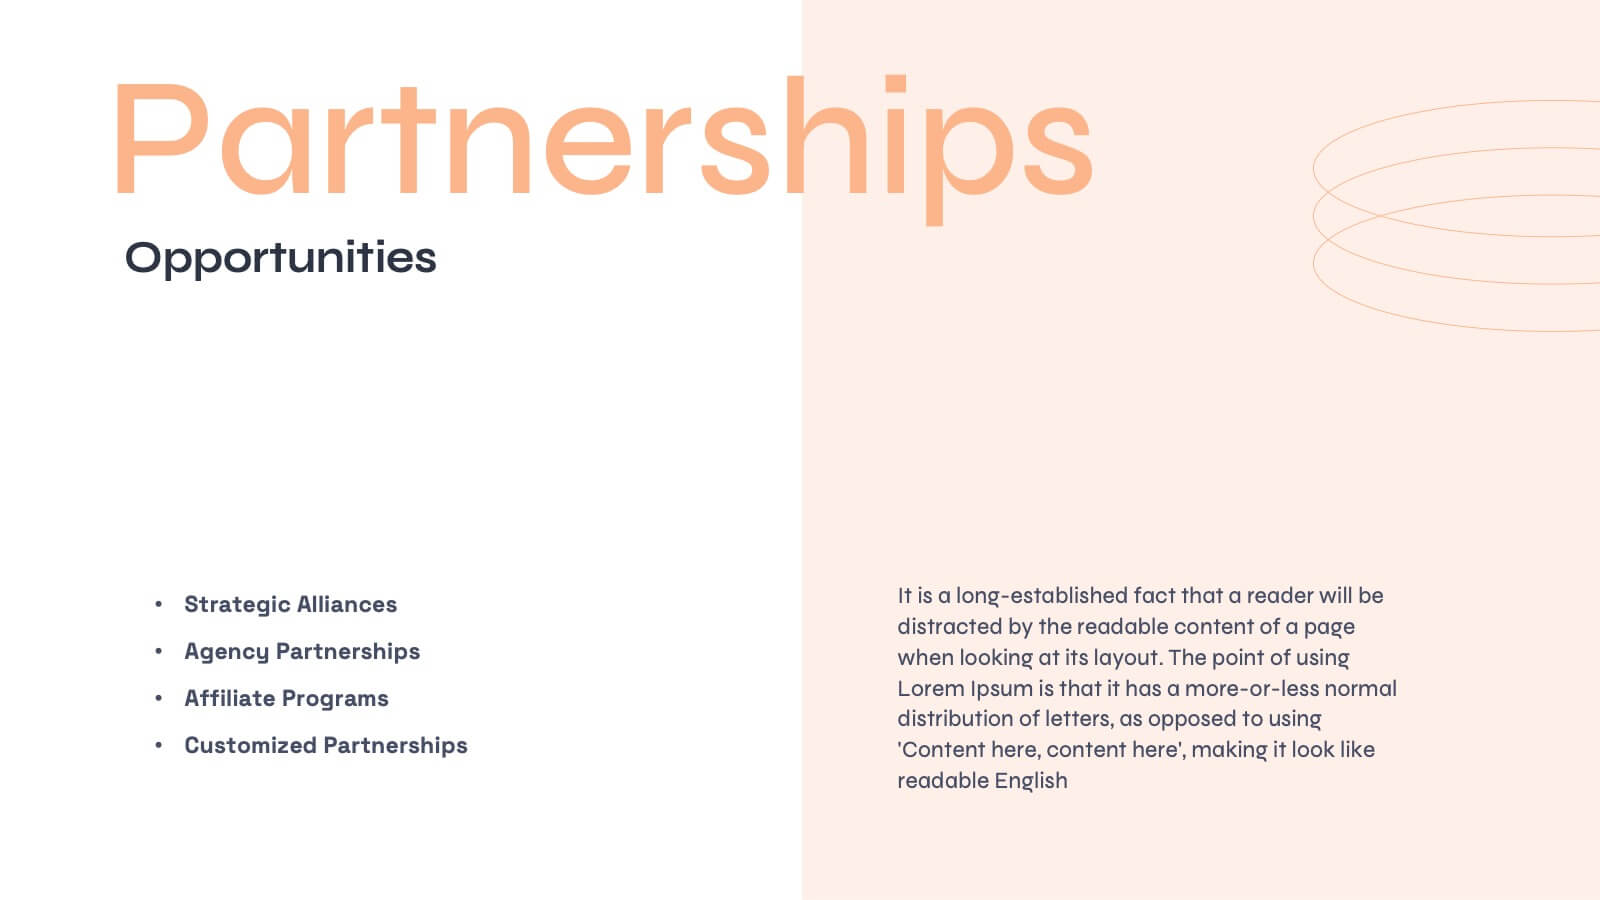
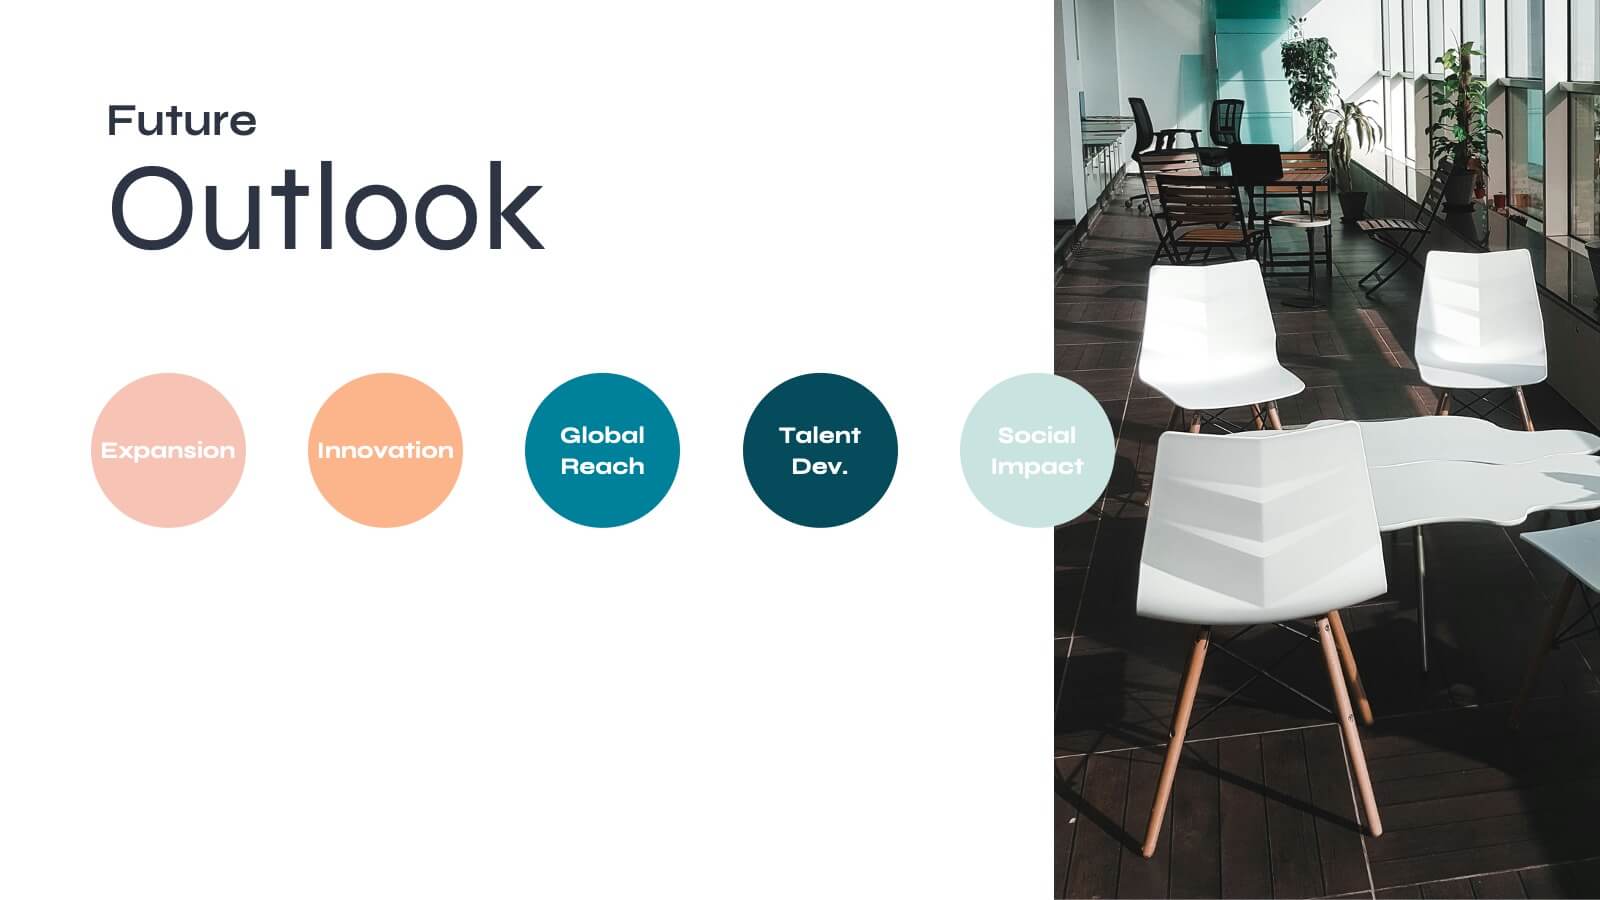
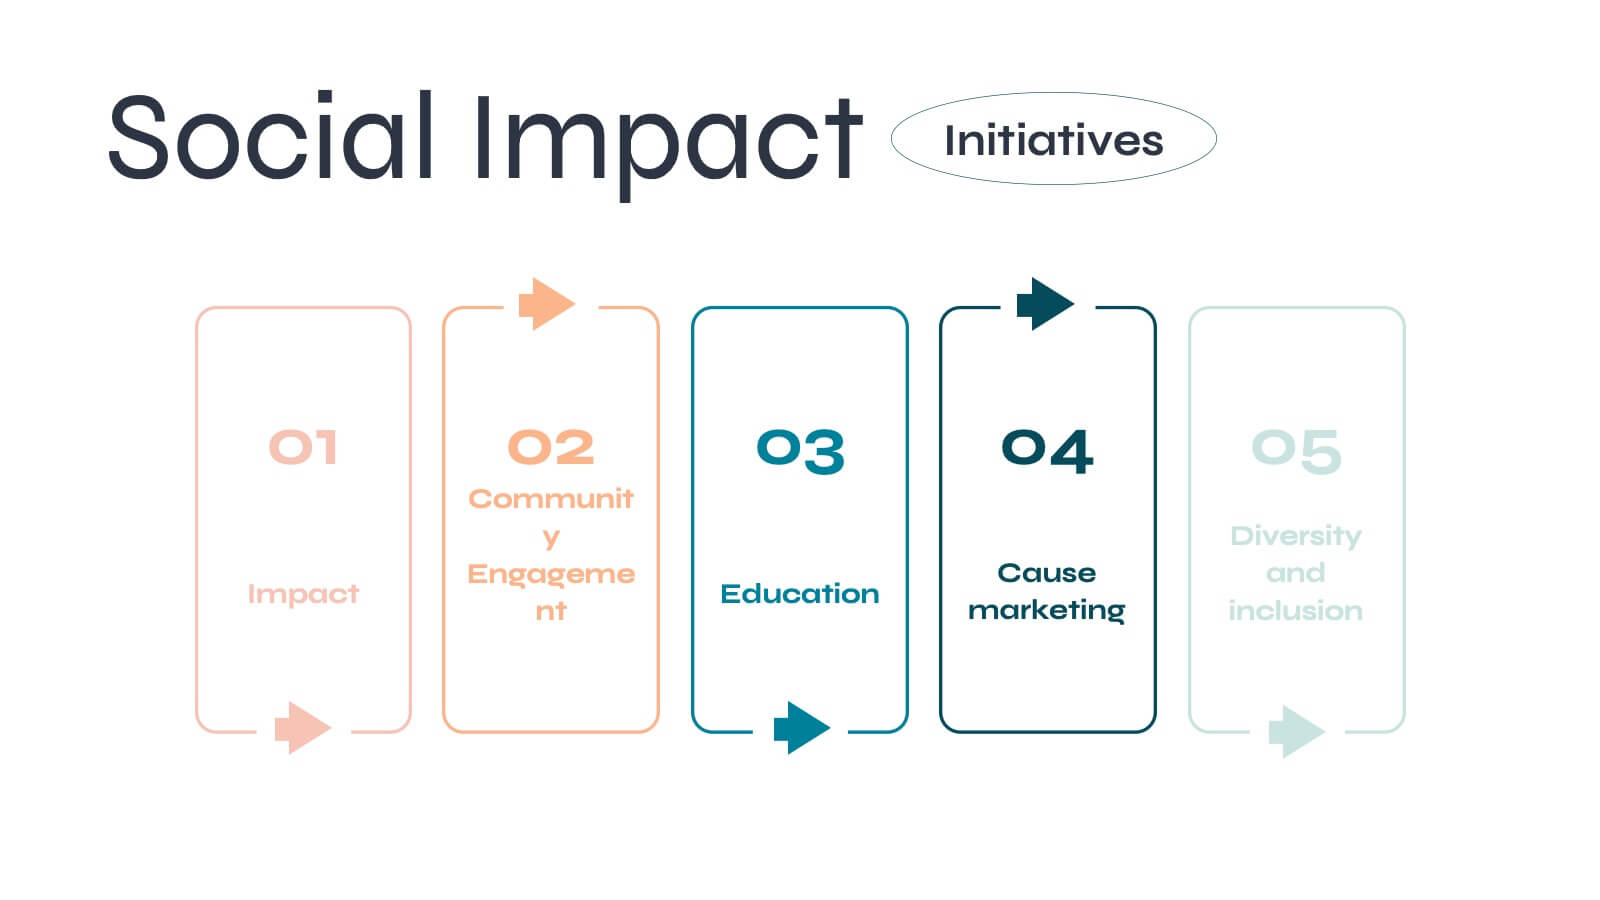
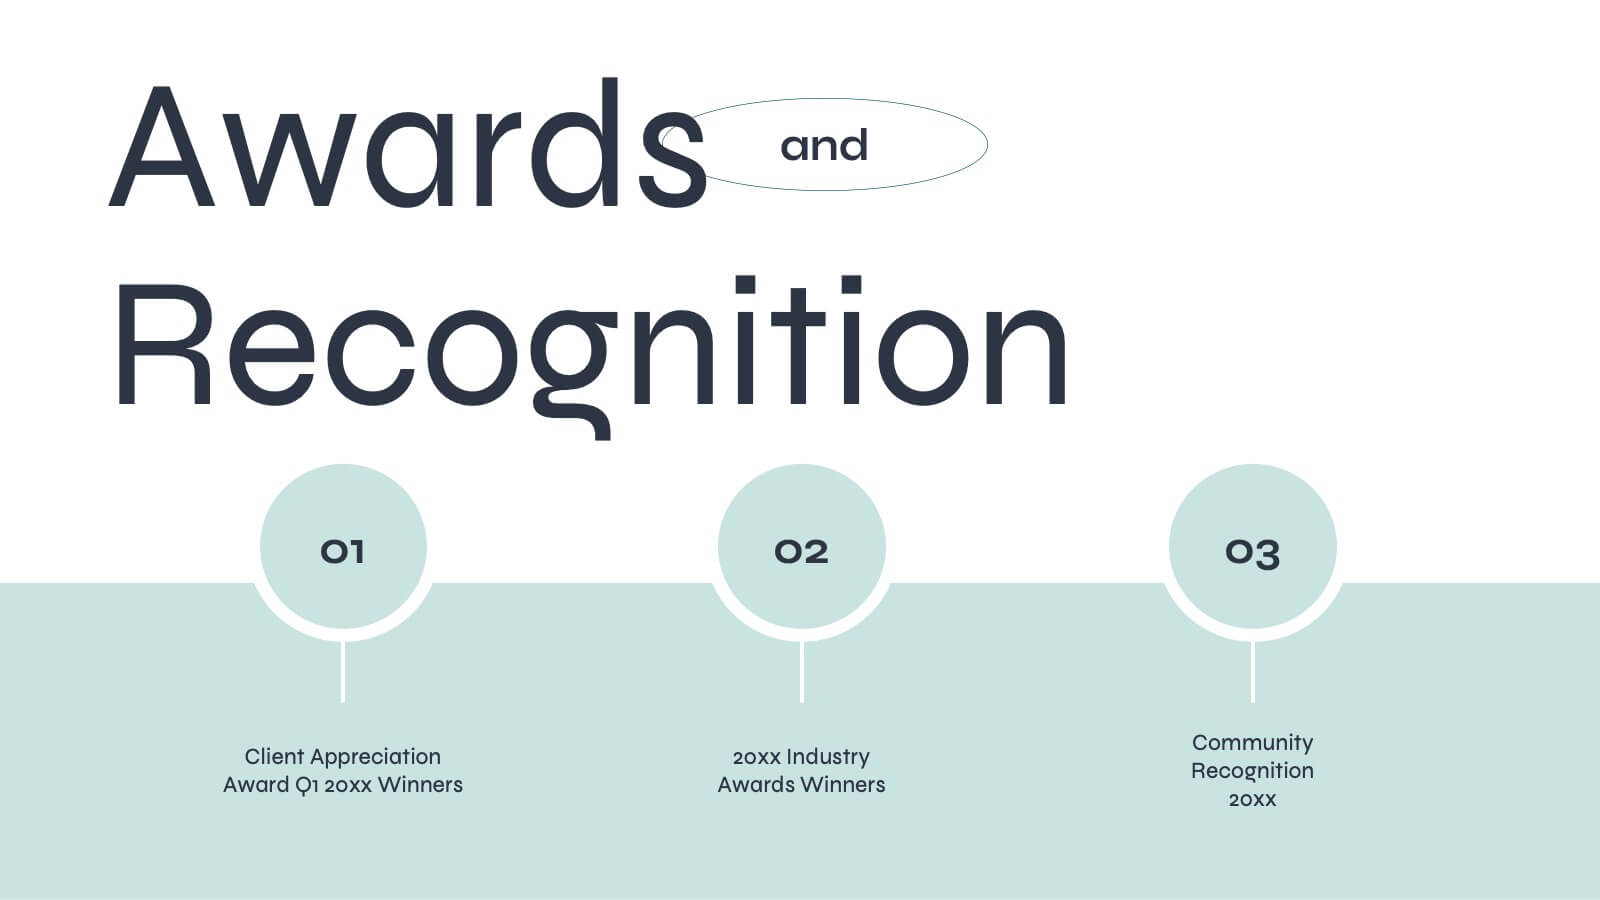
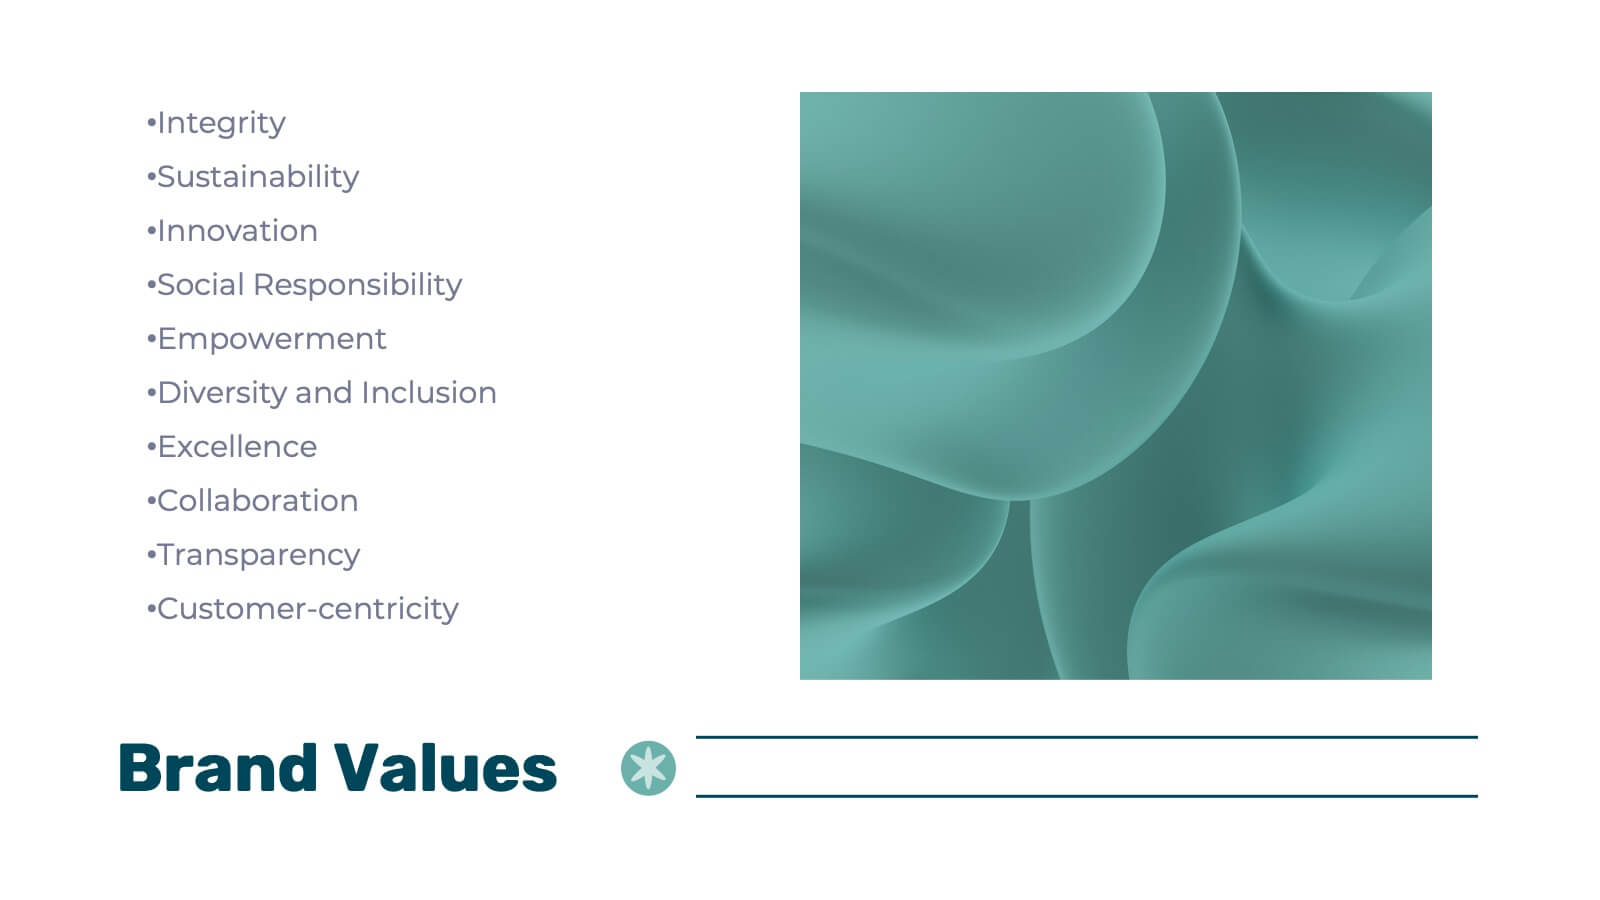
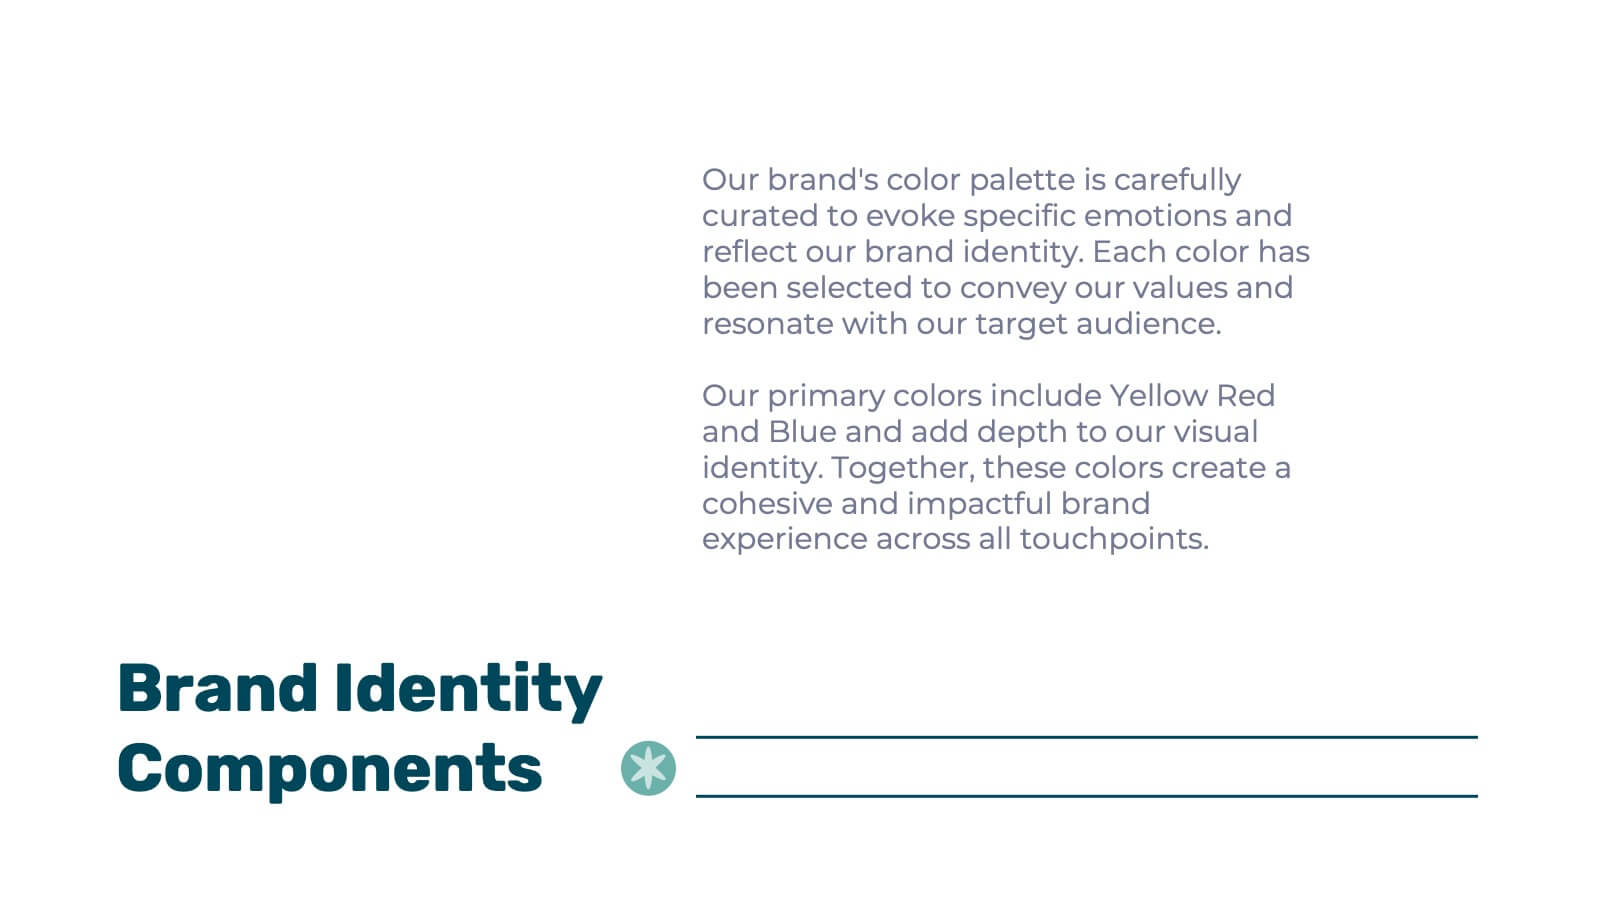
Hawking Brand Strategy Report Presentation
Introduce your brand's vision with this polished and professional strategy report presentation template. Designed for businesses, marketers, and branding agencies, it features comprehensive sections for communicating your brand identity, goals, and market positioning. This template highlights areas such as brand philosophy, target audience insights, competitive analysis, and visual identity systems. Showcase your brand’s unique selling proposition with engaging slides dedicated to colors, typography, logos, and packaging. With layouts tailored for presenting data, strategies, and case studies, you’ll ensure every aspect of your brand resonates clearly. Compatible with PowerPoint, Google Slides, and Keynote, this template is fully customizable to match your style and branding needs. Its clean, modern design and easy-to-edit structure make it a versatile choice for strategy reports, pitches, or team presentations. Elevate your branding efforts and communicate your story with confidence and clarity.


6 diapositivas
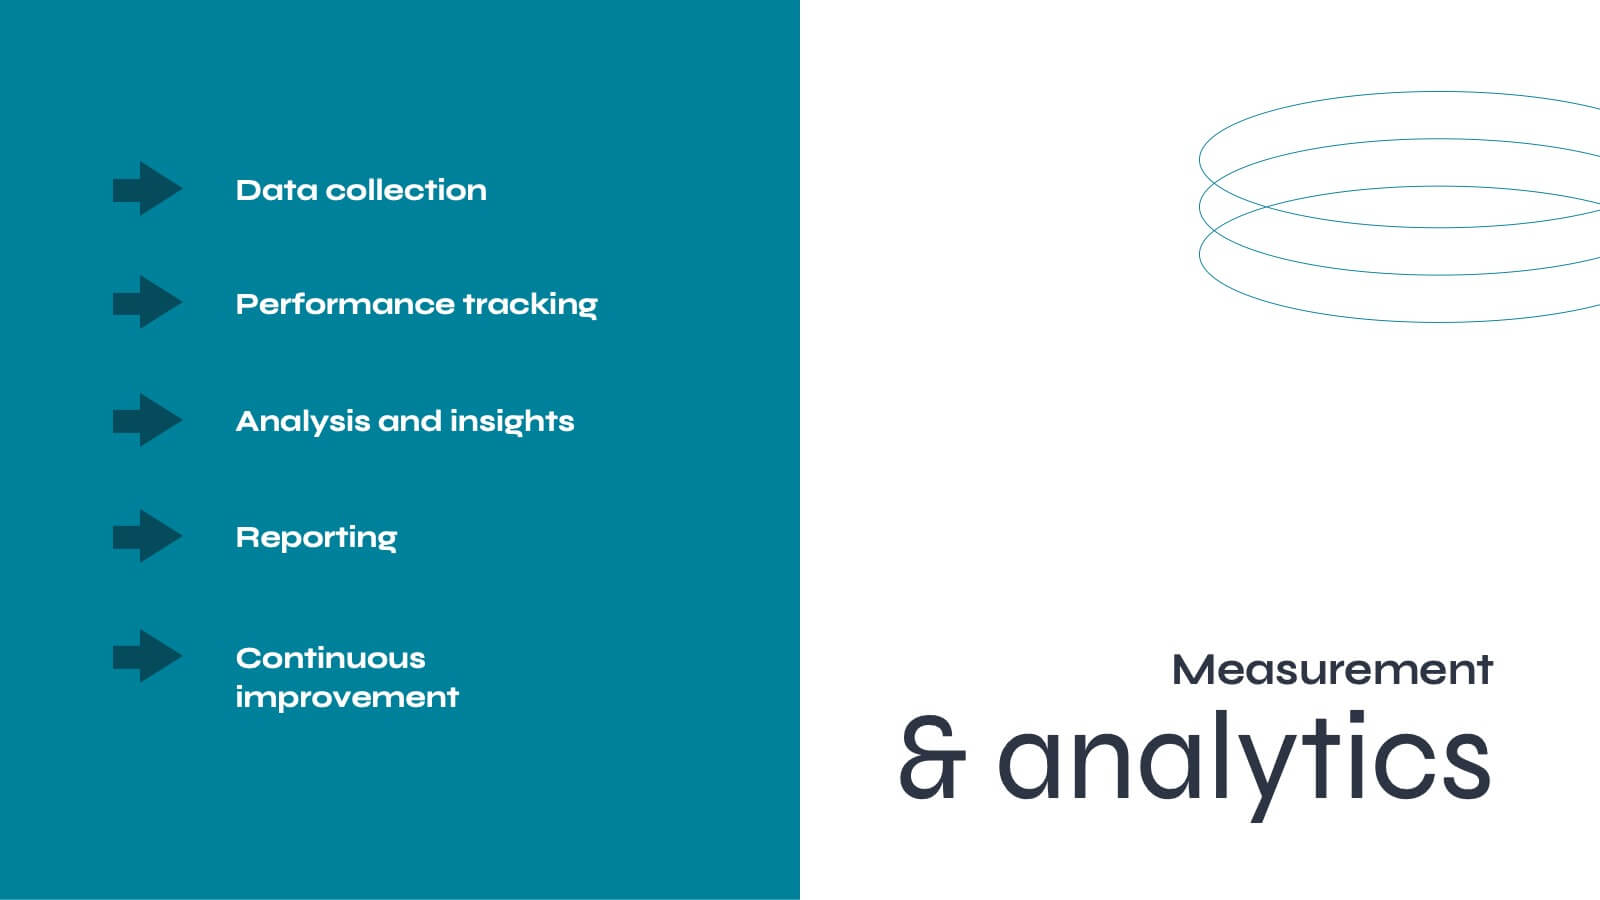
Business Framework Strategy Presentation
Dive into strategic planning with our Business Framework Strategy presentation template. This design brilliantly visualizes the essentials of business frameworks, guiding users through critical insights with a visually appealing, color-coded process. Ideal for strategists and planners, it offers a streamlined way to present complex information effectively. Compatible with PowerPoint, Keynote, and Google Slides, this template is a versatile tool for delivering impactful business strategies.


10 diapositivas
Business Data Charts Presentation
Visualize insights with precision using this Business Data Charts Presentation Template. Featuring clean, colorful doughnut charts and clearly labeled segments, it’s ideal for showcasing survey results, KPI breakdowns, or performance metrics. Designed for professionals who want sleek data visuals, and fully customizable in PowerPoint, Keynote, and Google Slides.


7 diapositivas
Customer Profile Marketing Infographic
Illuminate your marketing strategy with our finely-tuned customer profile marketing infographic. Bathed in the clarity of white, the trust of blue, the optimism of yellow, and the zest of orange, our template provides a vibrant palette to showcase diverse customer personas. Detailed with insightful infographics, expressive icons, and adaptable image placeholders, it deciphers intricate customer data into an actionable marketing narrative. Exquisitely designed for Powerpoint, Keynote, or Google Slides. A must-have tool for marketers, sales strategists, and businesses looking to tailor their approach to different customer segments. Engage effectively; let every slide refine your audience understanding.


21 diapositivas
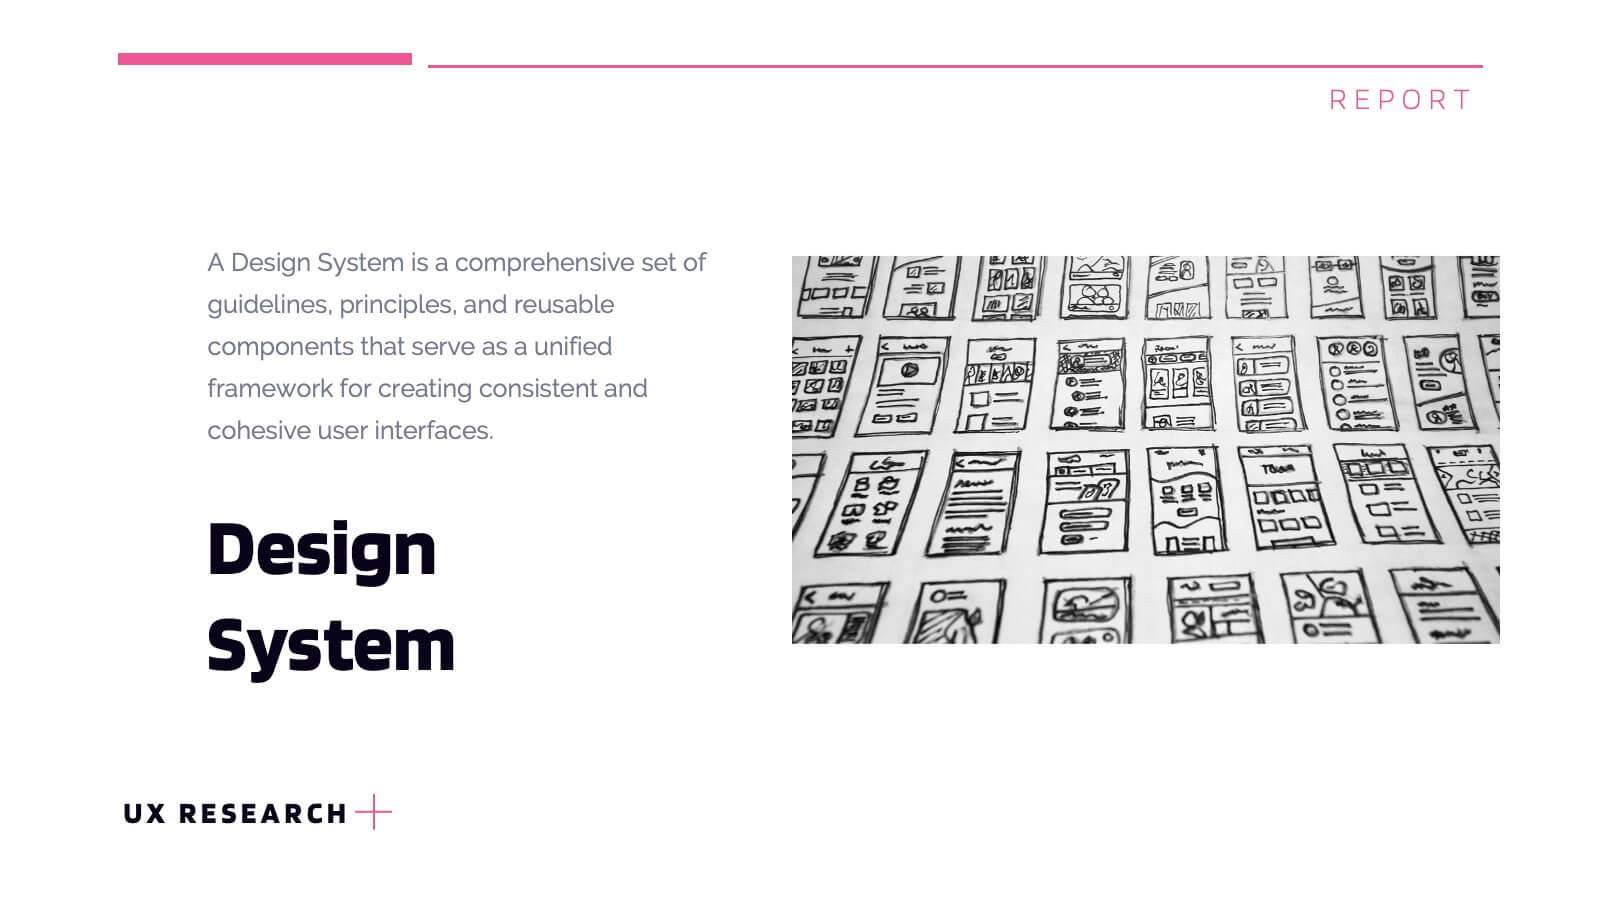
Lumascend UX Research Report Presentation
Present your UX research findings with clarity using this engaging and organized template! Covering key areas like user personas, wireframes, testing, and interaction design, it ensures all aspects of your design process are communicated effectively. Perfect for UX teams, stakeholders, or client presentations, this template works seamlessly with PowerPoint, Keynote, and Google Slides.


7 diapositivas
Mockup Infographic
Elevate your presentation game with this versatile collection of mockup templates, designed to showcase your digital projects in a sleek, professional manner. Each template features a clean and modern design, highlighting your work on various digital devices including smartphones, tablets, and computer screens. With a focus on simplicity and visual appeal, these mockups provide the perfect canvas for demonstrating websites, apps, and other digital products. The well-organized layouts allow for easy customization, letting you quickly insert your own images and text to match your project’s needs. Ideal for professionals in web development, app design, or digital marketing, this collection helps convey the functionality and aesthetics of your digital creations effectively. Utilize these mockups in client presentations, marketing materials, or portfolio showcases to give your audience a realistic preview of your digital solutions.


10 diapositivas
Results-Oriented Strategy Solutions Presentation
Drive your message home with the Results-Oriented Strategy Solutions Presentation. This layout features a presenter and chart graphic to emphasize goal tracking, performance analysis, and strategic actions. Perfect for business updates, KPIs, or coaching sessions. Fully customizable for PowerPoint, Keynote, and Google Slides.


6 diapositivas
Historical Events Timeline Presentation
Chronicle significant moments with the Historical Events Timeline Diagram. This visually engaging template allows you to map key milestones, highlight crucial dates, and present historical progressions with clarity. Ideal for educators, researchers, and business professionals, this timeline ensures a structured and impactful storytelling experience. Fully customizable and compatible with PowerPoint, Keynote, and Google Slides.


6 diapositivas
Creative Hexagon Process Flow Presentation
Bring order and creativity together with a sleek, geometric layout that turns complex processes into clear visual stories. This presentation helps you map workflows, stages, or milestones with a modern, connected hexagon flow. Fully editable and compatible with PowerPoint, Keynote, and Google Slides for effortless customization and presentation.


20 diapositivas
Vivid Product Development Plan Presentation
Develop your product with confidence using this detailed product development plan template! Perfect for outlining features, market analysis, and competitive advantages. Ideal for product managers and teams. Compatible with PowerPoint, Keynote, and Google Slides, this template ensures your plan is clear, professional, and comprehensive. Achieve product success today!


5 diapositivas
Behavioral Psychology Insights Presentation
Dive deep into the human mind with our 'Behavioral Psychology Insights' presentation template. Perfect for educators and professionals, this template offers a structured way to present complex psychological concepts visually. Ideal for delivering engaging presentations on human behavior, it is compatible with PowerPoint, Keynote, and Google Slides.