


Características


¿Tienes alguna pregunta?
Recomendar


28 diapositivas
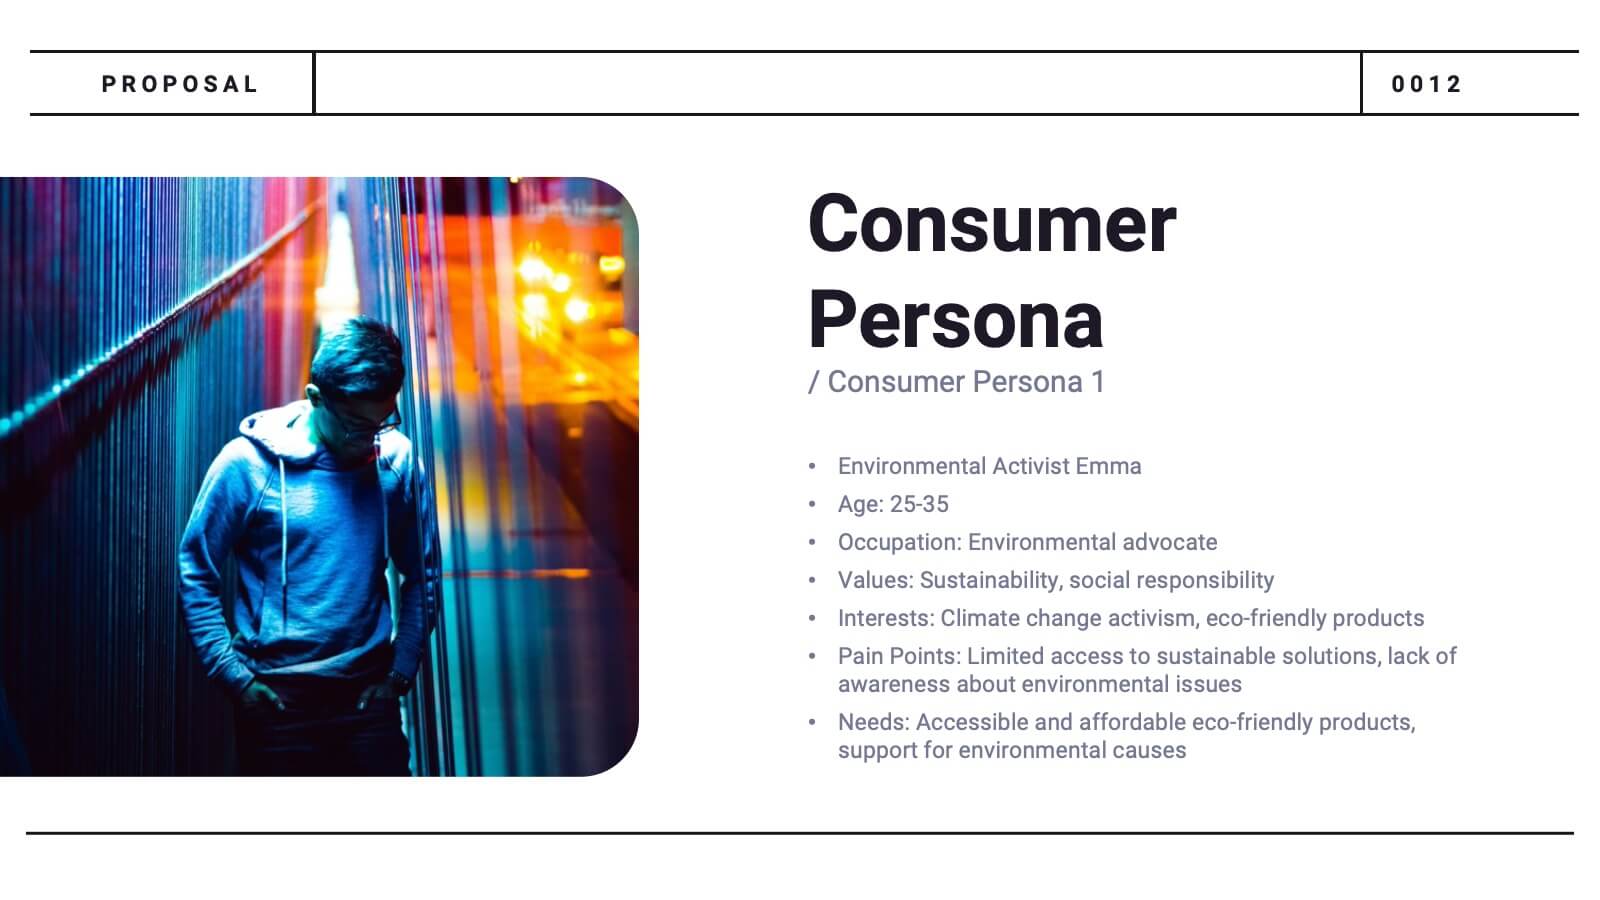
Glowspire Brand Guidelines Proposal Presentation
This brand identity template covers essential components: logo, imagery, color, typography, and voice & tone. It includes slides for consumer persona, market analysis, USP, brand positioning, and strategy. Ideal for establishing a cohesive brand, it highlights brand touchpoints across digital, print, packaging, and advertising mediums. Customizable for various platforms.


8 diapositivas
Air Travel Safety and Operations Presentation
Capture your audience’s attention with this aviation window-inspired layout, designed to visualize safety protocols or operational steps in air travel. Featuring four distinct segments arranged like a view through a plane window, it’s ideal for airline safety briefings, operational workflows, or compliance overviews. Fully editable in PowerPoint, Keynote, and Google Slides.


21 diapositivas
Mythspire Market Research Presentation
This market research template offers a clean design for presenting objectives, data collection, analysis, and findings. Perfect for showcasing research methodologies, visualizations, and actionable recommendations. Fully customizable and ideal for business or academic presentations. Compatible with PowerPoint, Keynote, and Google Slides.


6 diapositivas
Personal Skills Gap Infographics
Bridge the Personal Skills Gap effectively with our customizable infographic template. This template is fully compatible with popular presentation software such as PowerPoint, Keynote, and Google Slides, enabling you to easily tailor it to address specific skills gaps and development strategies. The Personal Skills Gap infographic template provides a visually appealing platform for identifying and closing gaps in your skillset, whether personal or professional. Whether you're a career-minded individual, a manager, or an educator, this template offers a user-friendly canvas to create informative presentations and self-improvement plans. Boost your personal and professional growth with this SEO-optimized Personal Skills Gap infographic template, thoughtfully designed for clarity and ease of use. Customize it to pinpoint skills in demand, set goals, and outline actionable steps to bridge the gap, ensuring your continuous development and success. Start crafting your personalized infographic today to thrive in a rapidly evolving world.


6 diapositivas
Data Table Format Presentation
Bring clarity to your data with a clean, modern layout that helps your audience compare details at a glance. This presentation is perfect for pricing, feature breakdowns, or structured business insights, keeping information organized and easy to read. Fully compatible with PowerPoint, Keynote, and Google Slides.


6 diapositivas
3D Shapes Infographic
3D shapes, also known as three-dimensional shapes or solids, are geometric figures that have three dimensions: length, width, and height (or depth). This Infographic visually explains various three-dimensional geometric shapes, their properties, and real-world applications. With this template you can summarize the benefits of the 3D Shapes in simplifying the understanding of complex shapes and encouraging practical applications in various fields. This infographic is the perfect study aid for students preparing for geometry exams. This is fully customizable and compatible with Powerpoint, Keynote, and Google Slides.


7 diapositivas
Editable List Slide Presentation
Organize your ideas with style and simplicity using this clean, structured layout designed for clarity and impact. Ideal for summarizing key points, checklists, or action plans, it keeps your content professional and easy to follow. Fully customizable and compatible with PowerPoint, Keynote, and Google Slides for seamless presentation design.


6 diapositivas
Smile Book Rating Infographics
Discover the captivating world of book ratings with Smile! This infographic is your gateway to understanding how to assess and rate books, offering insights into why and how to share your opinions effectively. Delve into the process of rating books with Smile, grasping the importance of thoughtful and honest ratings. Learn how your ratings contribute to helping fellow readers find their next favorite book and provide valuable support to authors. Explore the art of crafting detailed and constructive book reviews. Dive into the elements of a compelling review, covering aspects like plot, characters, and the moments that brought a smile (or provoked other emotions) while reading. Equip yourself with the skills to articulate your thoughts effectively. With this engaging infographic, compatible with PowerPoint, Keynote, and Google Slides, sharing your book ratings and reviews is a breeze. Empower yourself with the knowledge to become an influential book reviewer. Immerse yourself in the world of book ratings with Smile, embarking on a journey of literary exploration and appreciation.


6 diapositivas
Engaging Opening Introduction
Start strong with this visually engaging slide layout, perfect for setting the tone in professional meetings or pitches. Highlight key themes or concepts alongside image placeholders that bring your message to life. Fully customizable in PowerPoint, Keynote, and Google Slides.


4 diapositivas
Interlocking Puzzle Chart Design Presentation
Unlock big ideas with a visual design that clicks your concepts together like a seamless 3D puzzle. This presentation makes it easy to explain connected processes, relationships, or strategic components in a clean, engaging way. Perfect for business, planning, and team alignment. Fully compatible with PowerPoint, Keynote, and Google Slides.


4 diapositivas
Social and Professional Networking
Visualize global connections and collaborative ecosystems with this Social and Professional Networking presentation. Ideal for HR teams, marketers, or networking strategists, it showcases relationship-building and engagement across key hubs. Fully customizable in PowerPoint, Keynote, and Google Slides for maximum flexibility in any professional setting.


20 diapositivas
Novelix Graphic Design Project Plan Presentation
Elevate your design projects with this modern and stylish presentation template. Covering key areas such as concept development, design elements, prototypes, and project timelines, it provides a structured approach to presenting creative work. Perfect for designers and agencies alike. Compatible with PowerPoint, Keynote, and Google Slides for effortless customization.


6 diapositivas
Quarterly Sales Overview Presentation
Bring your numbers to life with a clear, colorful layout that makes quarterly progress instantly easy to understand. This presentation helps you break down trends, compare performance across quarters, and highlight key insights with simple bar visuals. Perfect for reports and meetings, and fully compatible with PowerPoint, Keynote, and Google Slides.


6 diapositivas
Lean Business Canvas Framework
Simplify your business strategy with the Lean Business Canvas Framework Presentation. This slide offers a structured layout to map out key elements like partners, activities, value propositions, customer segments, and revenue streams—all in one view. Ideal for startups, business plans, or internal strategy sessions. Fully editable in PowerPoint, Keynote, and Google Slides.


4 diapositivas
Corporate Governance Structure Presentation
Build transparency and leadership clarity with this clean, layered presentation layout that visualizes company hierarchies and decision-making systems. Ideal for explaining organizational roles, responsibilities, and reporting flows, it simplifies complex structures into easy visuals. Fully editable and compatible with PowerPoint, Keynote, and Google Slides for professional, flexible use.


6 diapositivas
Mission and Values Overview Presentation
Your company's purpose deserves a visually stunning story! This infographic presentation template helps you clearly outline core values and mission statements with an engaging, structured design. Ideal for business strategy meetings, corporate presentations, and branding discussions, it keeps your content professional and impactful. Fully customizable and compatible with PowerPoint, Keynote, and Google Slides.


4 diapositivas
OKRs Alignment for Performance Goals Presentation
Visualize and align your objectives with precision using the OKRs Alignment for Performance Goals Presentation. This template illustrates how Objectives, Key Activities, and Results converge toward a shared target, helping you communicate goals clearly to teams and stakeholders. Perfect for quarterly planning, team alignment, and executive reviews. Fully editable in Canva, PowerPoint, Keynote, and Google Slides.