


Características


¿Tienes alguna pregunta?
Recomendar


6 diapositivas
Next-Gen Wireless Solutions Overview Presentation
Give your wireless solutions pitch a sleek, professional edge with this futuristic globe-style layout. Perfect for tech-driven topics, this infographic highlights six key areas in a clear, visually engaging format. Fully customizable and easy to use in PowerPoint, Keynote, and Google Slides—ideal for product overviews, innovation briefings, or strategy updates.


6 diapositivas
30 60 90 Day Plan for Executives Infographics
Develop a strategic plan for executives with our customizable 30, 60, and 90 Day Plan for Executives infographic template. This template is fully compatible with popular presentation software like PowerPoint, Keynote, and Google Slides, allowing you to easily customize it to outline the key objectives and priorities for executives over these timeframes. The 30, 60, and 90 Day Plan for Executives infographic template offers a visually engaging platform to structure and communicate short-term goals, milestones, and initiatives for executive leaders. Whether you're an executive, manager, or HR professional, this template provides a user-friendly canvas to create informative presentations and strategic plans. Optimize executive performance and alignment with this SEO-optimized 30, 60, and 90 Day Plan for Executives infographic template, thoughtfully designed for clarity and ease of use. Customize it to showcase specific objectives, key projects, performance metrics, and alignment with broader organizational goals, ensuring that executives have a clear roadmap for success. Start crafting your personalized infographic today to help executives drive strategic impact in their roles.


5 diapositivas
Marketing Wheel Strategy Presentation
Enhance your marketing presentations with our "Marketing Wheel Strategy Presentation" template. This infographic is designed to visually represent the interconnected components of a marketing strategy, organized in a wheel format for clarity. Each segment, color-coded for distinction, covers different aspects such as planning, execution, analysis, and optimization, demonstrating their interdependence. This layout is perfect for illustrating how each part contributes to the overall effectiveness of a marketing plan. Ideal for marketing professionals and strategists, it facilitates detailed strategy discussions and comprehensive planning sessions. Fully compatible with PowerPoint, Keynote, and Google Slides, this template is essential for delivering clear and effective marketing presentations.


5 diapositivas
End-to-End Process Flow Framework Presentation
Visualize your operations from start to finish with the End-to-End Process Flow Framework Presentation. This clean, arrow-based layout is perfect for outlining workflows, project stages, or business processes step by step. Fully customizable in Canva, PowerPoint, and Google Slides to suit any team or strategic need.


7 diapositivas
Feedback Management Infographic
Boost your presentation's impact with our Feedback Management infographic, optimized for Powerpoint, Keynote, and Google Slides. This infographic is an essential asset for professionals looking to present feedback data compellingly and concisely. Designed to convey customer satisfaction metrics and responses effectively, it's perfect for market researchers, customer service managers, and business analysts. The Feedback Management infographic is constructed to visually communicate the importance of customer insights and how they drive business improvements. It transforms complex data into an easy-to-understand format, which is crucial for making informed decisions based on customer feedback. The infographic's structured design assists audiences in comprehending the collected feedback at a glance, highlighting key figures and trends. Whether you're reporting on survey results or showcasing customer reviews, this infographic ensures your data is presented clearly. Compatible with leading presentation software, it allows for smooth integration into your slides, ensuring your feedback analysis stands out. Incorporate this infographic into your presentations to effectively display feedback management data and make a lasting impression.


20 diapositivas
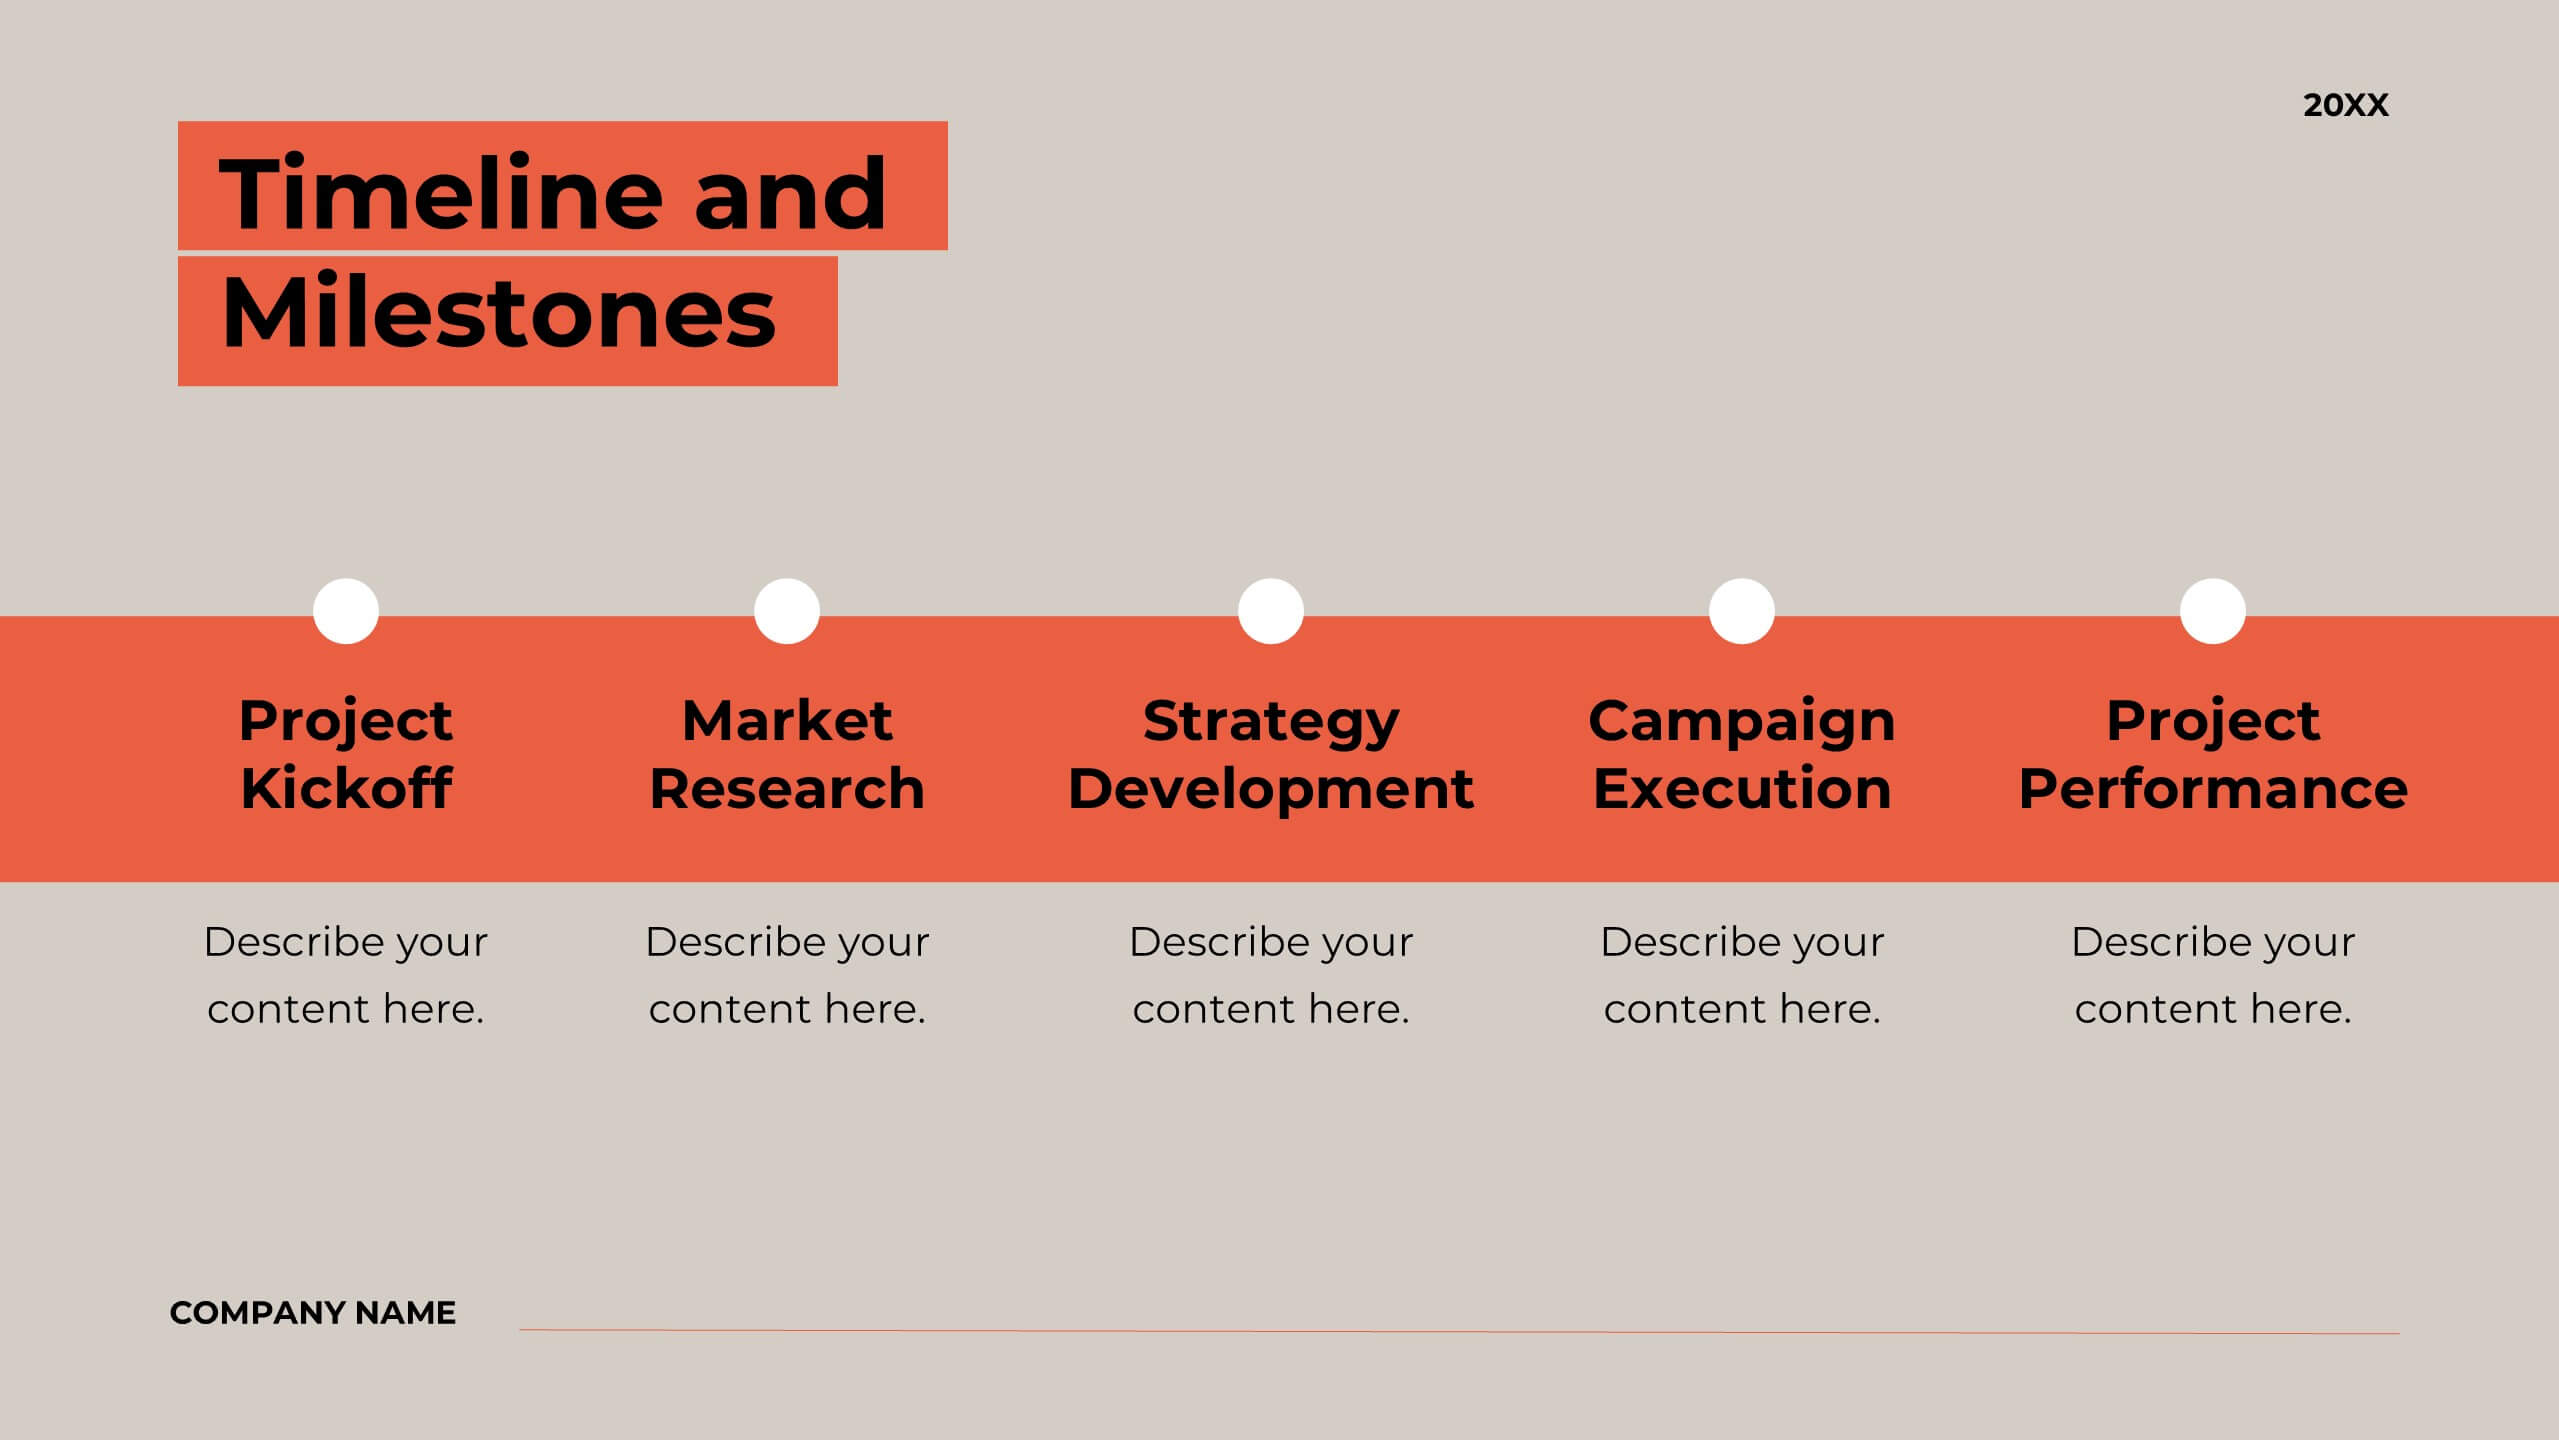
Bentom Marketing Proposal Presentation
This marketing proposal template is crafted to communicate your strategy with impact. With sections covering company overview, project summary, objectives, methodology, budget breakdown, and deliverables, it provides a professional layout for presenting key details to clients. Tailor it to fit your needs, and present confidently using PowerPoint, Keynote, or Google Slides.


7 diapositivas
Communication Styles Infographic
Dive into the diverse world of communication with our communication styles infographic. Set against a palette of blue, yellow, and white, this template offers a visual exploration of different communication methods and their nuances. Whether it's assertive, passive, aggressive, or passive-aggressive, understanding these styles is vital in both personal and professional settings. Ideal for corporate trainers, educators, students, or anyone aiming to improve their interpersonal skills. Crafted for clarity and compatibility, this infographic is an excellent addition to PowerPoint, Keynote, and Google Slides, ensuring your presentations resonate with both substance and style.


2 diapositivas
Business Briefing Executive Summary Presentation
Summarize your strategy with impact using this Business Briefing Executive Summary Presentation. Featuring modern layout options, photo placeholders, and bold typography, this cover slide is ideal for team updates, pitch decks, or project reports. Fully editable in PowerPoint, Google Slides, Keynote, and Canva.


4 diapositivas
Athlete Training and Strategy Presentation
Present training performance and strategy benchmarks with this Athlete Training and Strategy slide. Featuring a sleek runner silhouette and gradient-colored progress bars, this layout lets you showcase four training pillars with accompanying metrics or KPIs. Ideal for coaching sessions, sports science reviews, or athlete development plans. Fully editable in PowerPoint, Keynote, and Google Slides.


20 diapositivas
Mythion Business Idea Pitch Deck Presentation
Communicate your business vision with clarity and impact using this comprehensive pitch deck presentation template. Perfect for entrepreneurs, startups, and innovators, this template is designed to help you effectively present your idea to investors, stakeholders, or partners. Cover every essential aspect of your business journey with slides dedicated to the problem statement, solutions, market overview, and target audience. Showcase your business model, revenue projections, and unique selling proposition with visually appealing layouts. Highlight your marketing strategy, growth projections, and funding requirements to build a strong, persuasive case. Fully customizable and compatible with PowerPoint, Google Slides, and Keynote, this template allows you to tailor each slide to suit your business identity and goals. Whether you're pitching a new idea or seeking investment, this template ensures you present with professionalism and confidence.


23 diapositivas
Zenith Product Launch Pitch Deck Presentation
Launch your product successfully with this compelling pitch deck! Perfect for presenting company overview, problem statements, and market opportunities. Ideal for startups and entrepreneurs aiming to attract investors and stakeholders. Compatible with PowerPoint, Keynote, and Google Slides, this template ensures your pitch is clear, persuasive, and professional. Secure your product's success today!


24 diapositivas
Catalyst Strategic Planning Report Presentation
Unleash your strategic vision with the Catalyst Strategic Planning Report template! This vibrant and dynamic layout is designed to make your strategic planning presentations not only effective but also visually captivating. The template’s playful yet professional design elements, including bold color blocks and creative graphics, draw attention to key points, ensuring your message resonates with your audience. From SWOT analysis to market trends, and resource allocation to action plans, every slide is crafted to communicate your strategic objectives clearly and compellingly. Perfect for business reviews, strategic meetings, or investor presentations, this template allows you to present data-driven insights and actionable steps in an engaging manner. It’s fully customizable, making it easy to adapt to your brand’s colors and style. Whether you’re presenting to a team or stakeholders, the Catalyst template provides the perfect platform to articulate your vision. Compatible with PowerPoint, Keynote, and Google Slides, it’s your go-to tool for impactful strategic presentations!


4 diapositivas
Europe Market Expansion Visualization Presentation
Showcase your European growth strategy with the Europe Market Expansion Visualization Presentation. This map-based slide design allows you to clearly highlight regional opportunities, new market entries, and key expansion zones using icons and color-coded country markers. Ideal for strategic planning, investor updates, and sales overviews. Fully editable in PowerPoint, Keynote, Google Slides, and Canva.


6 diapositivas
Framework Diagram Layout Presentation
Bring structure to your ideas with this sleek and modern presentation layout designed for clarity and flow. Perfect for visualizing systems, workflows, and strategic processes, it helps audiences grasp relationships between concepts effortlessly. Fully editable and compatible with PowerPoint, Keynote, and Google Slides for smooth customization and professional results.


6 diapositivas
Project Gantt Chart Presentation
This Project Gantt Chart Presentation helps visualize your project timeline with clarity. Featuring six tasks, weekly progress bars, and colorful icons, it’s ideal for tracking milestones. Fully customizable and easy to edit, this slide works seamlessly in PowerPoint, Keynote, and Google Slides for organized, professional project management presentations.


6 diapositivas
Agriculture Jobs Infographic
Agriculture jobs encompass a wide range of career opportunities that involve the cultivation, production, processing, and distribution of crops, livestock, and other agricultural products. This infographic template showcases the diversity of jobs within the agriculture industry, highlighting the roles, required skills, and potential career growth. This infographic can be organized into different categories of agriculture jobs, such as Farming and Crop Production, Livestock Management, Agricultural Engineering, and Agricultural Research. This template is compatible with Powerpoint, Keynote, and Google Slides.


7 diapositivas
Business Structure Infographic
Understanding a business's organizational structure is pivotal for effective operations, strategy, and growth. Our business structure infographic, colored in shades of blue, white, green, and yellow, lays out these intricacies in a visually compelling manner. Whether you're showcasing hierarchies, operational roles, or departmental divides, this infographic captures it all. Tailored for business students, entrepreneurs, and corporate trainers, this tool simplifies complex concepts. Seamlessly integrated with PowerPoint, Keynote, and Google Slides, it provides a dynamic aid to ensure your presentations are both enlightening and engaging.