


Características


¿Tienes alguna pregunta?
Recomendar


4 diapositivas
Fixed and Variable Cost Balance Presentation
Visualize cost distribution using a balanced scale metaphor. This presentation helps compare fixed and variable costs with editable sections for data input. Ideal for financial planning, budgeting, or cost control analysis. Fully customizable in PowerPoint, Keynote, and Google Slides to match any brand or business presentation style.


4 diapositivas
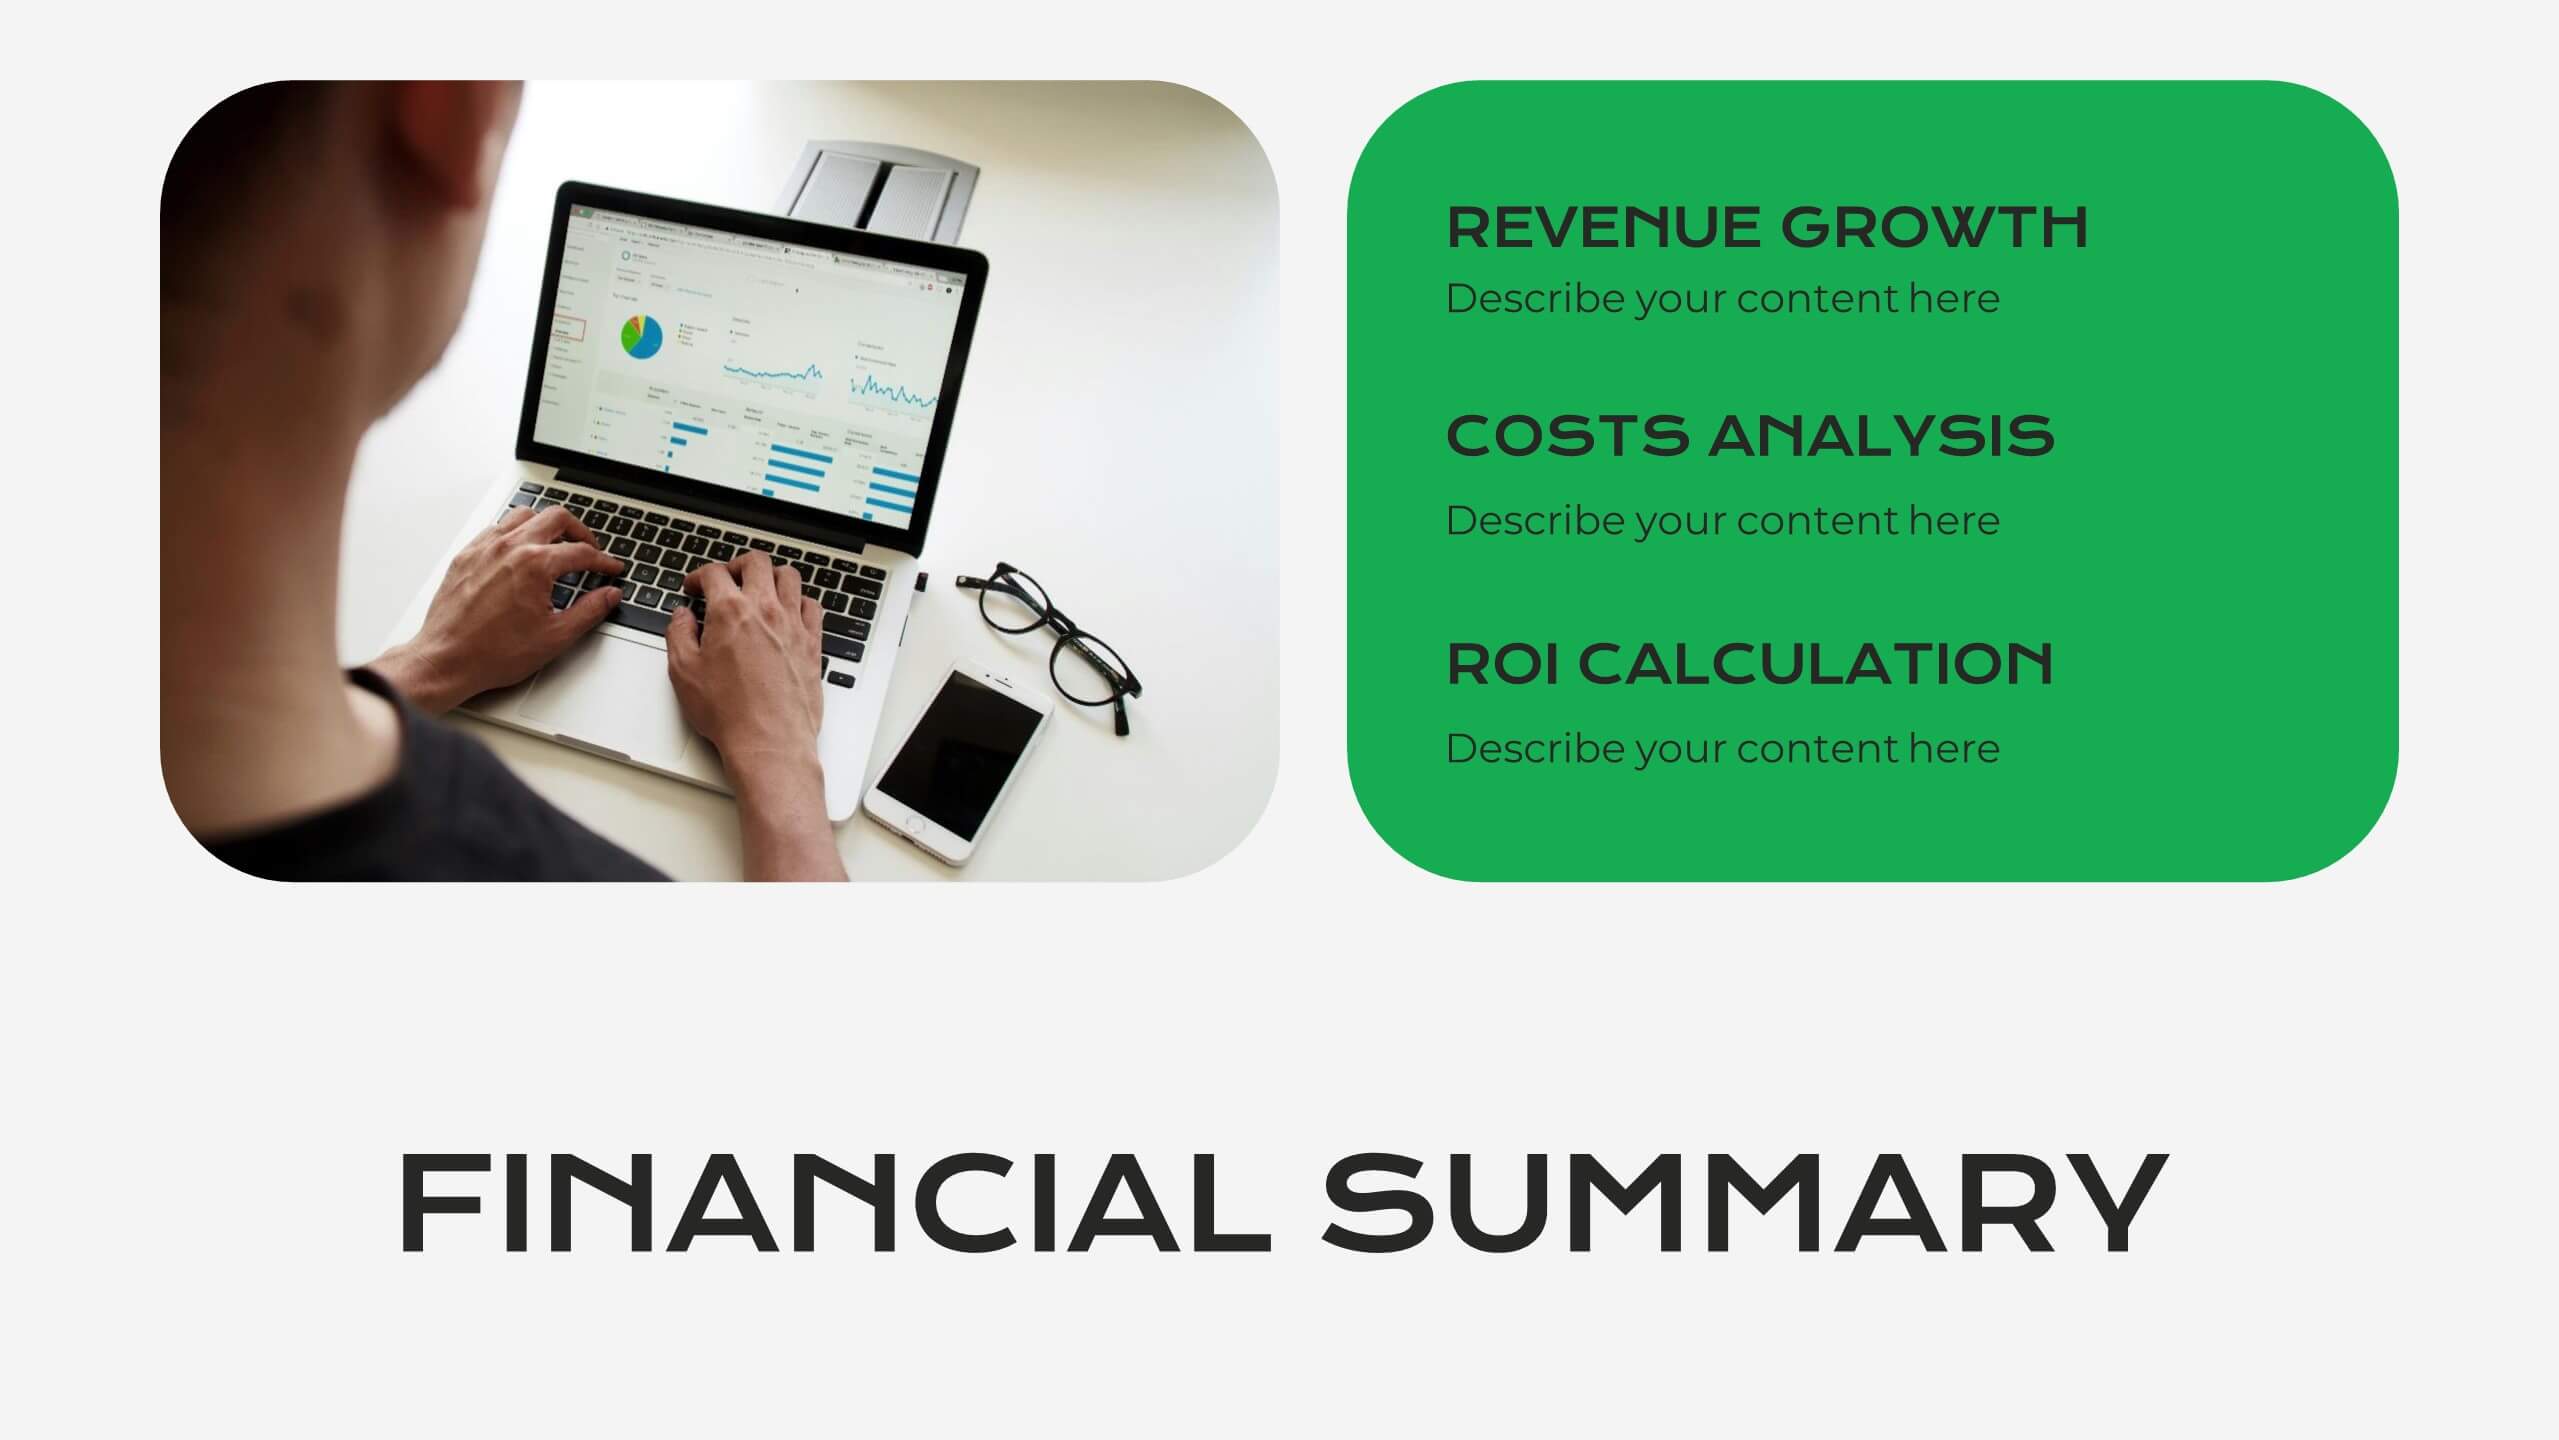
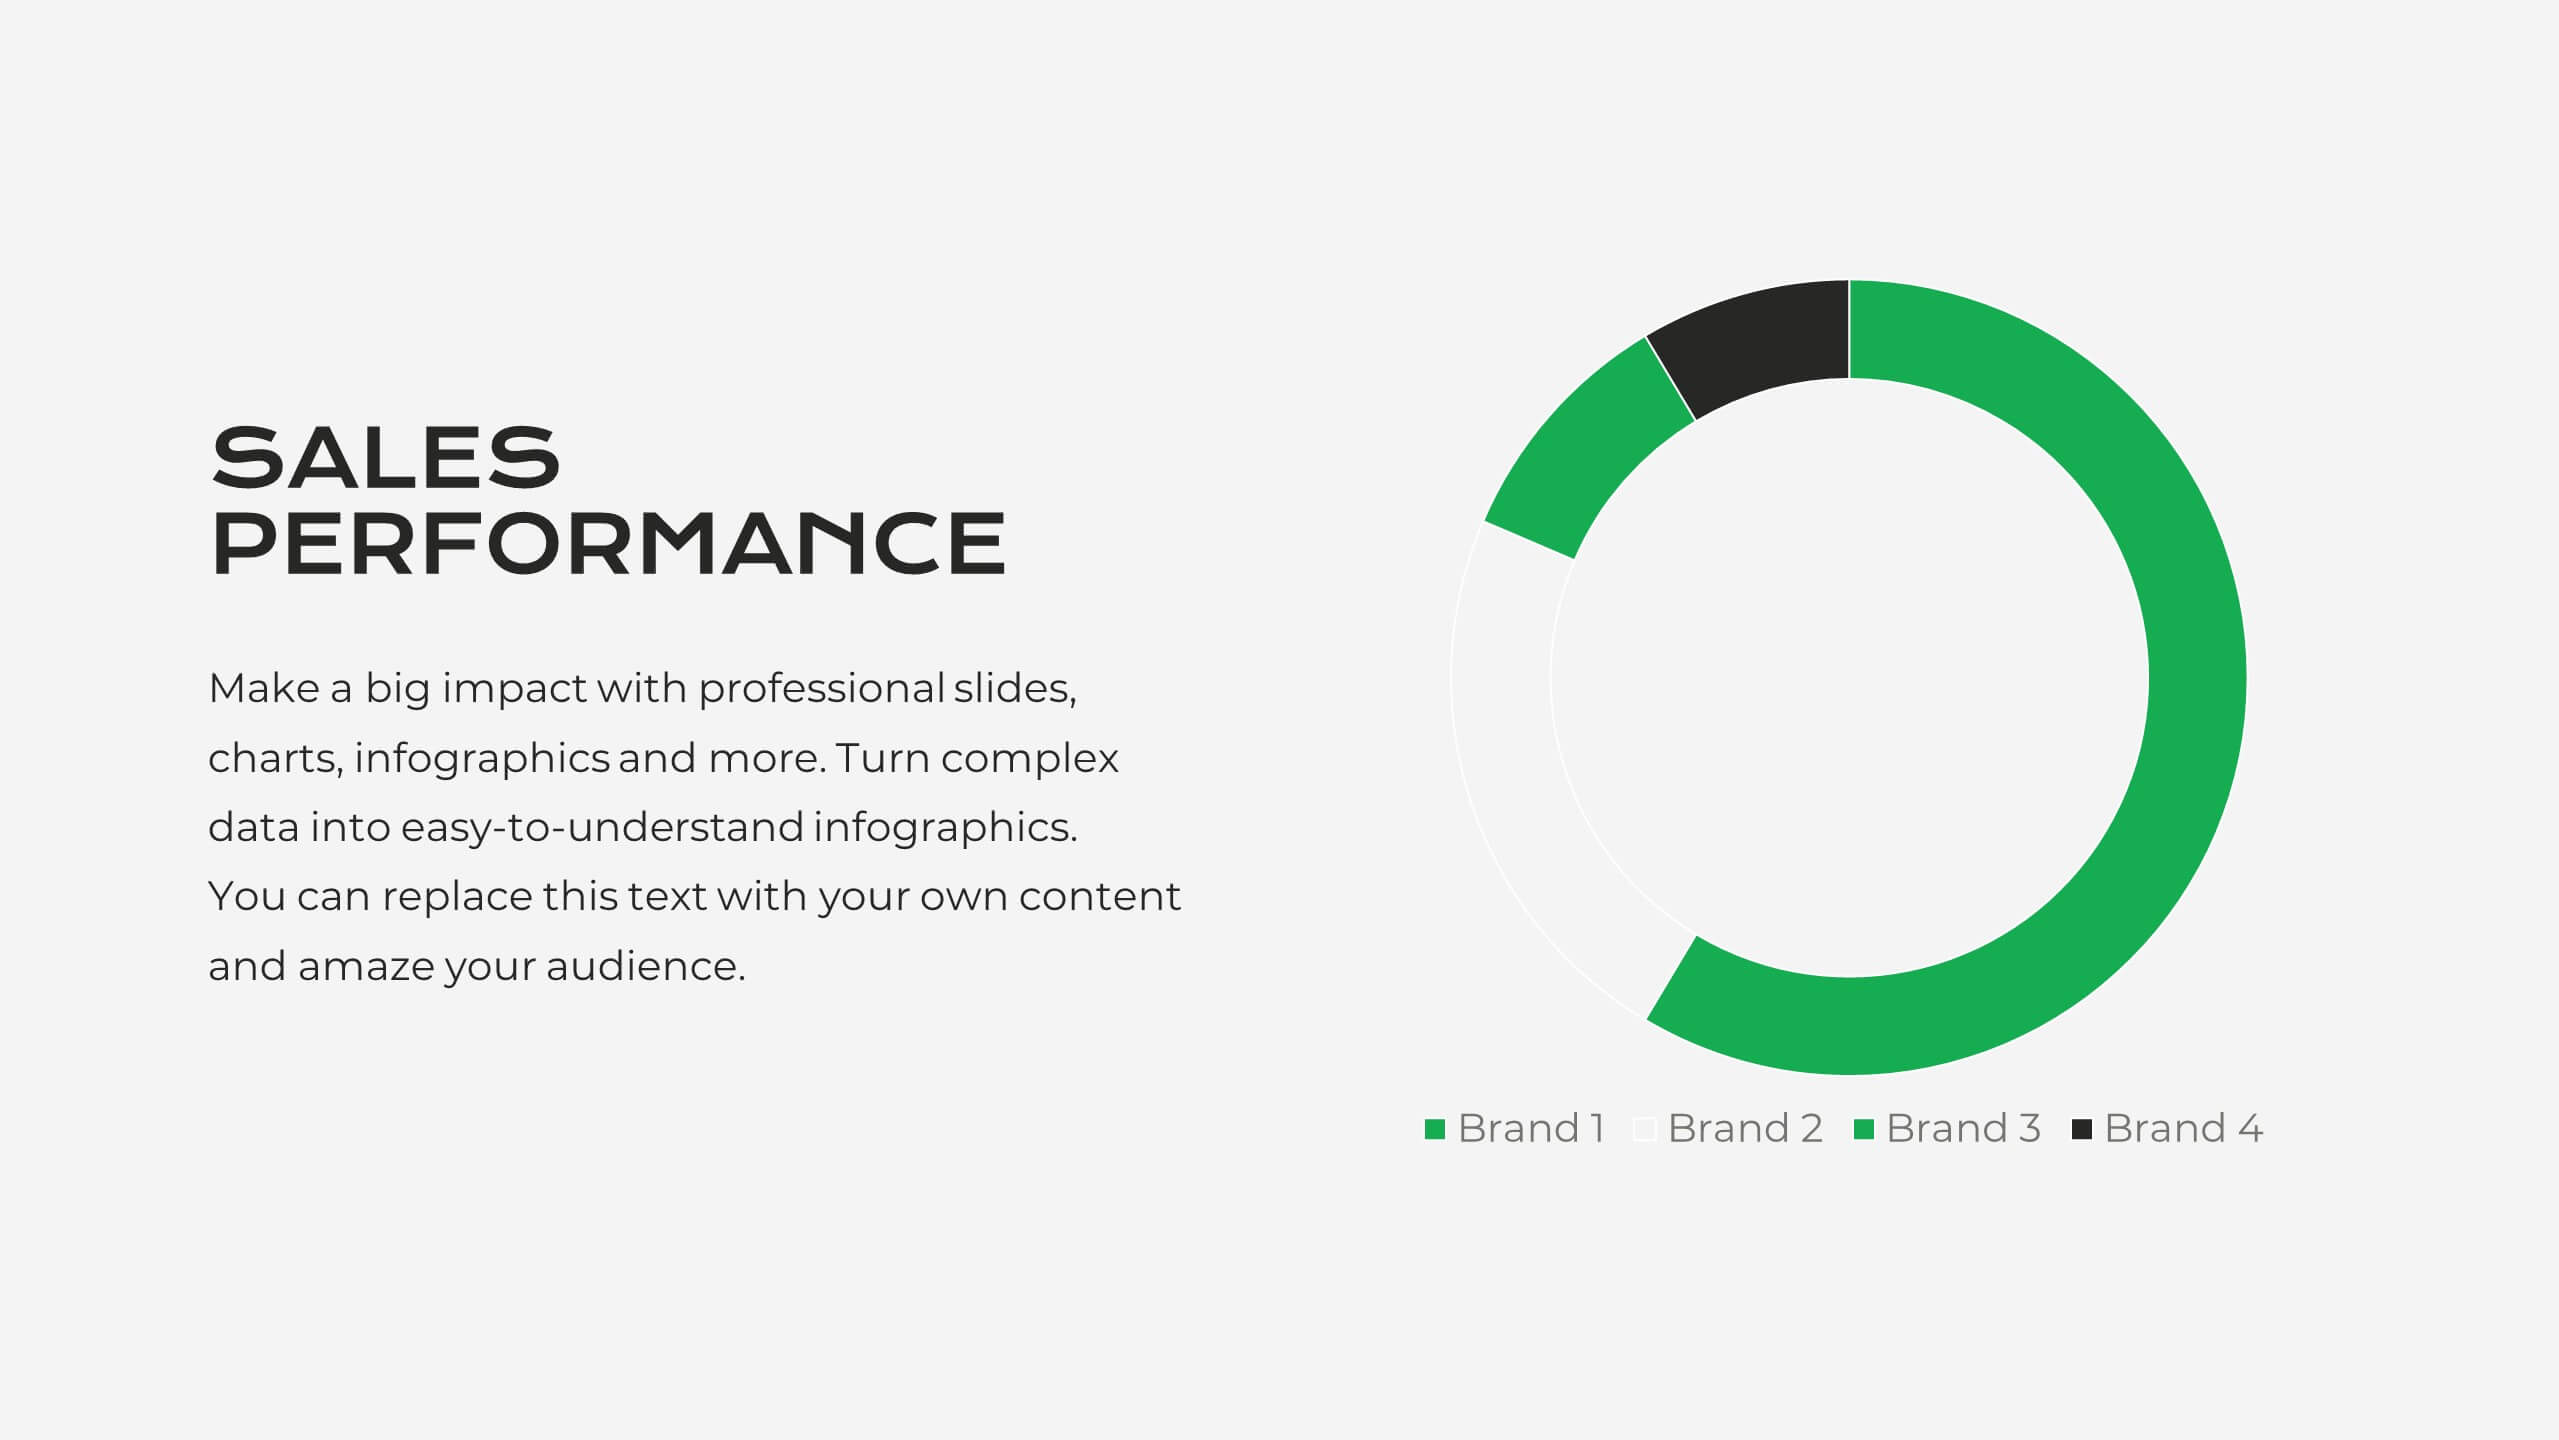
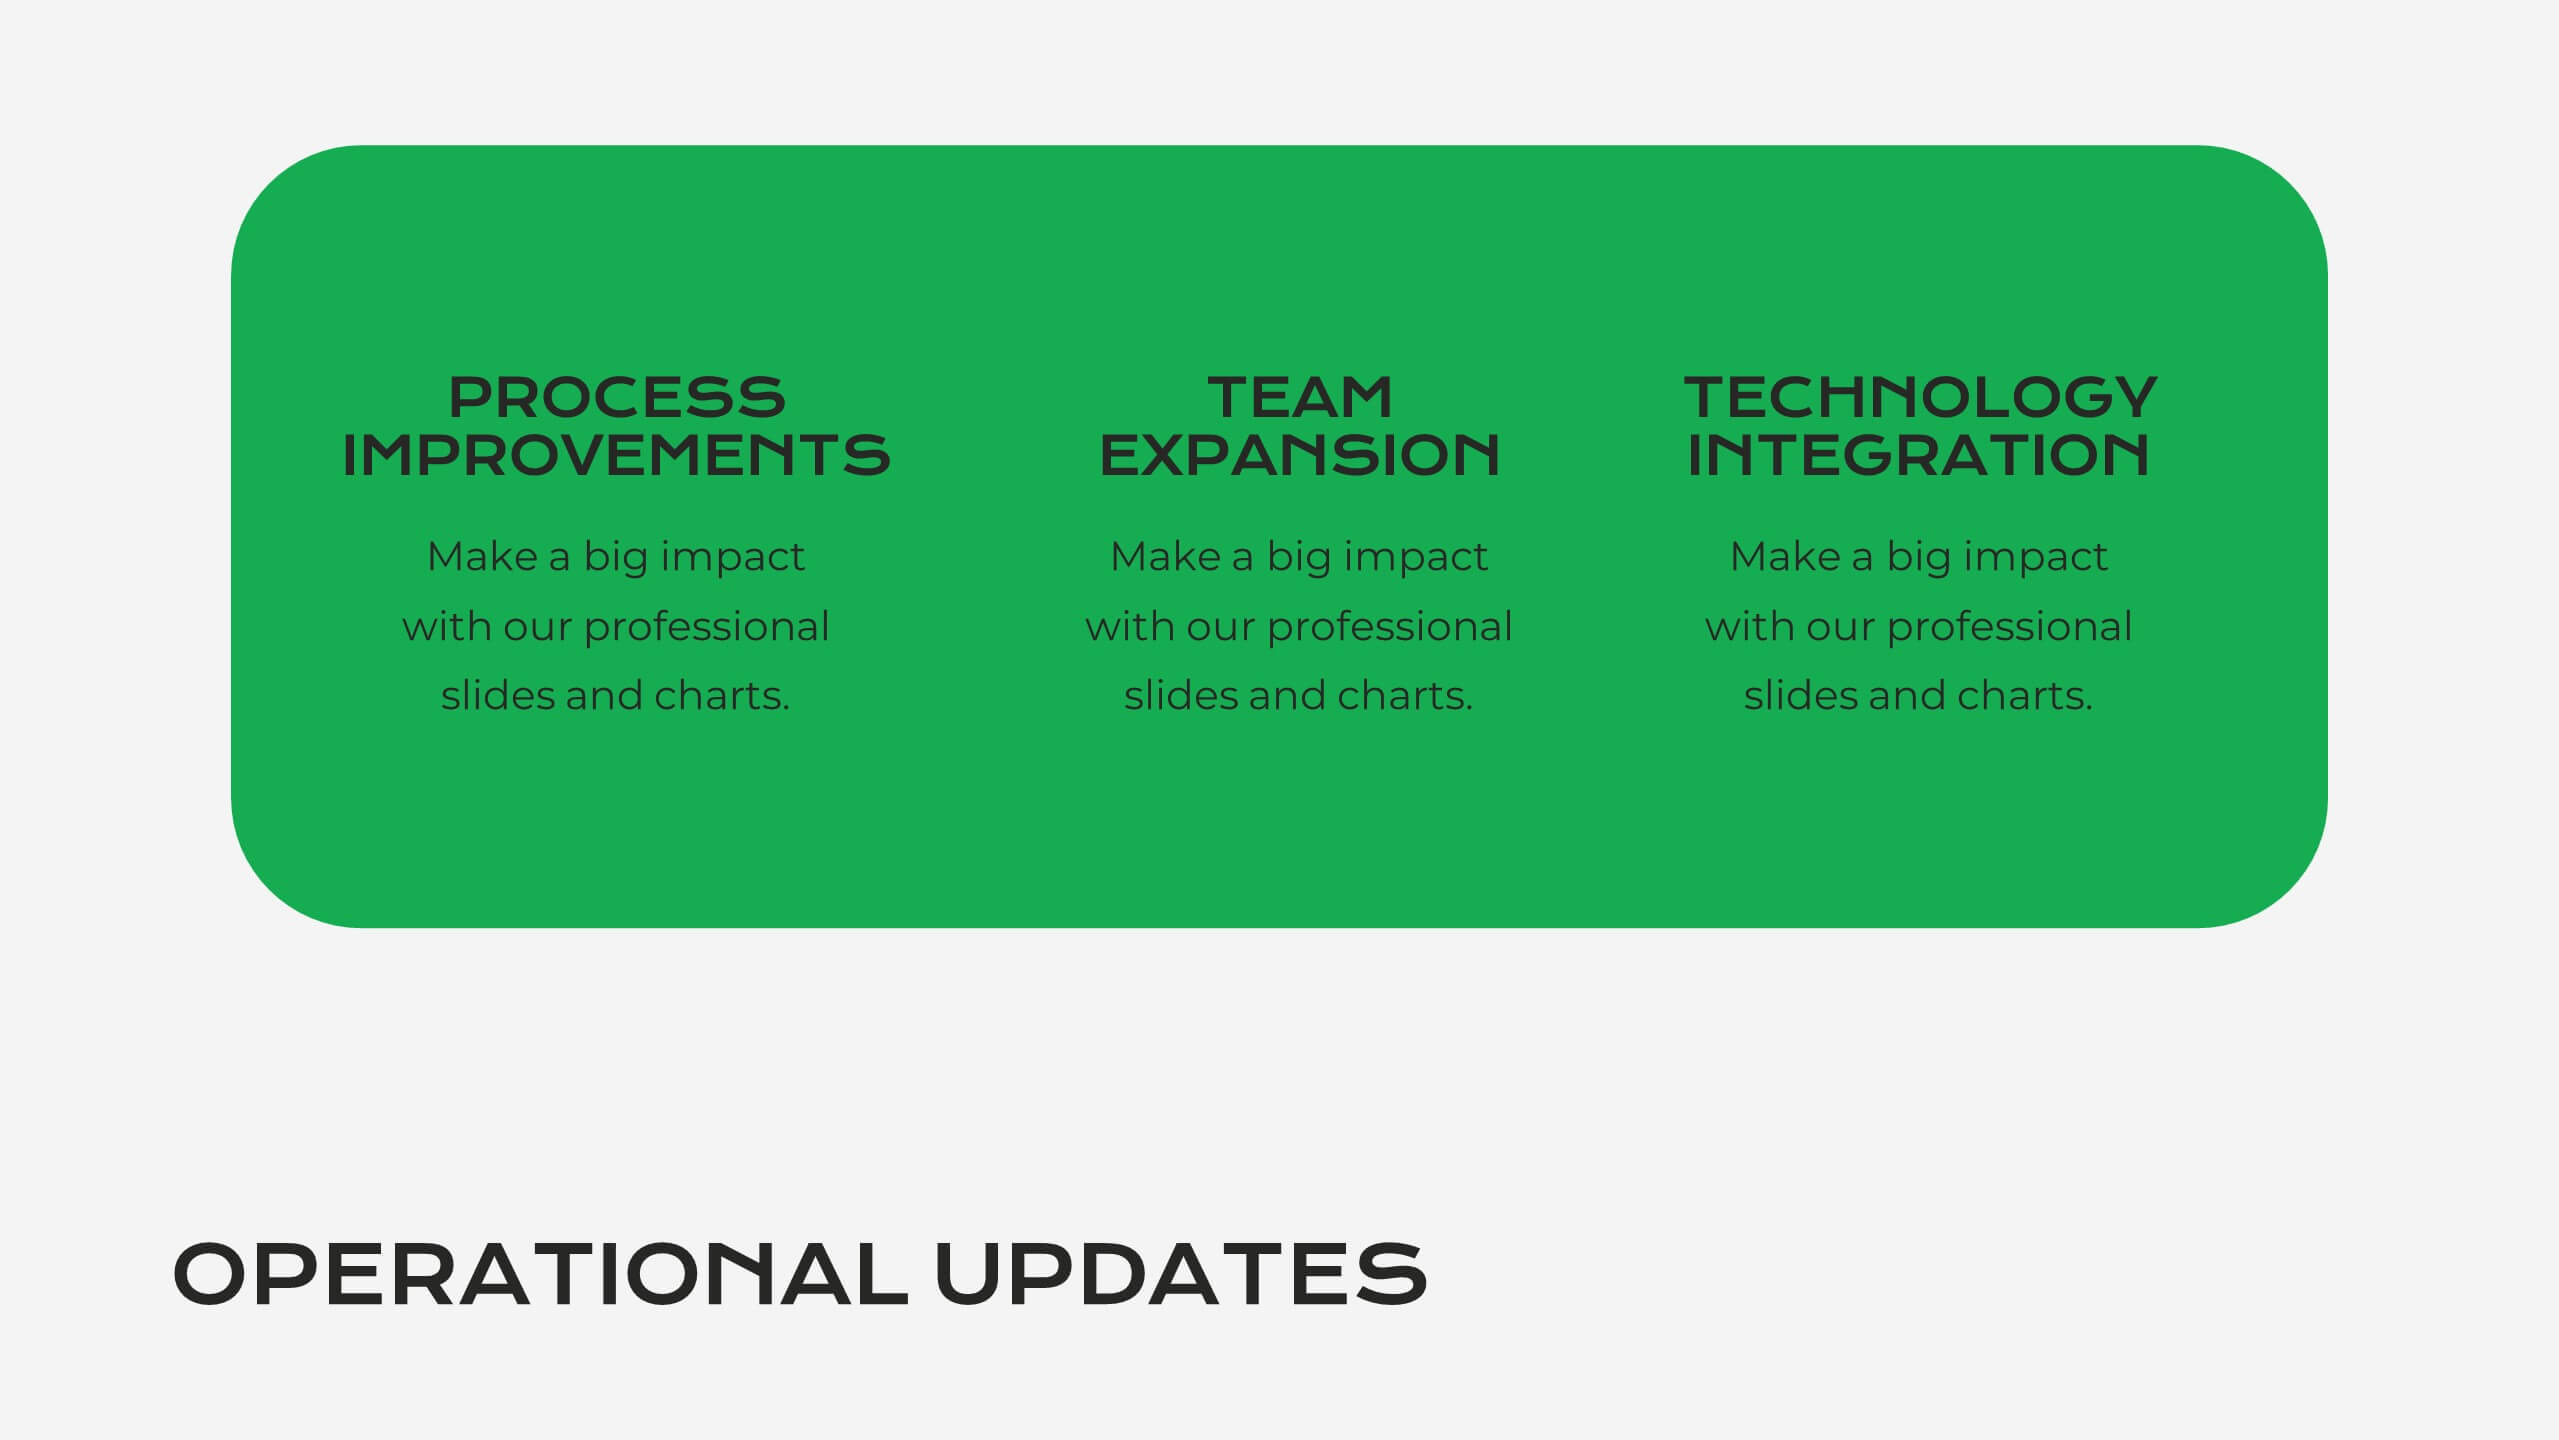
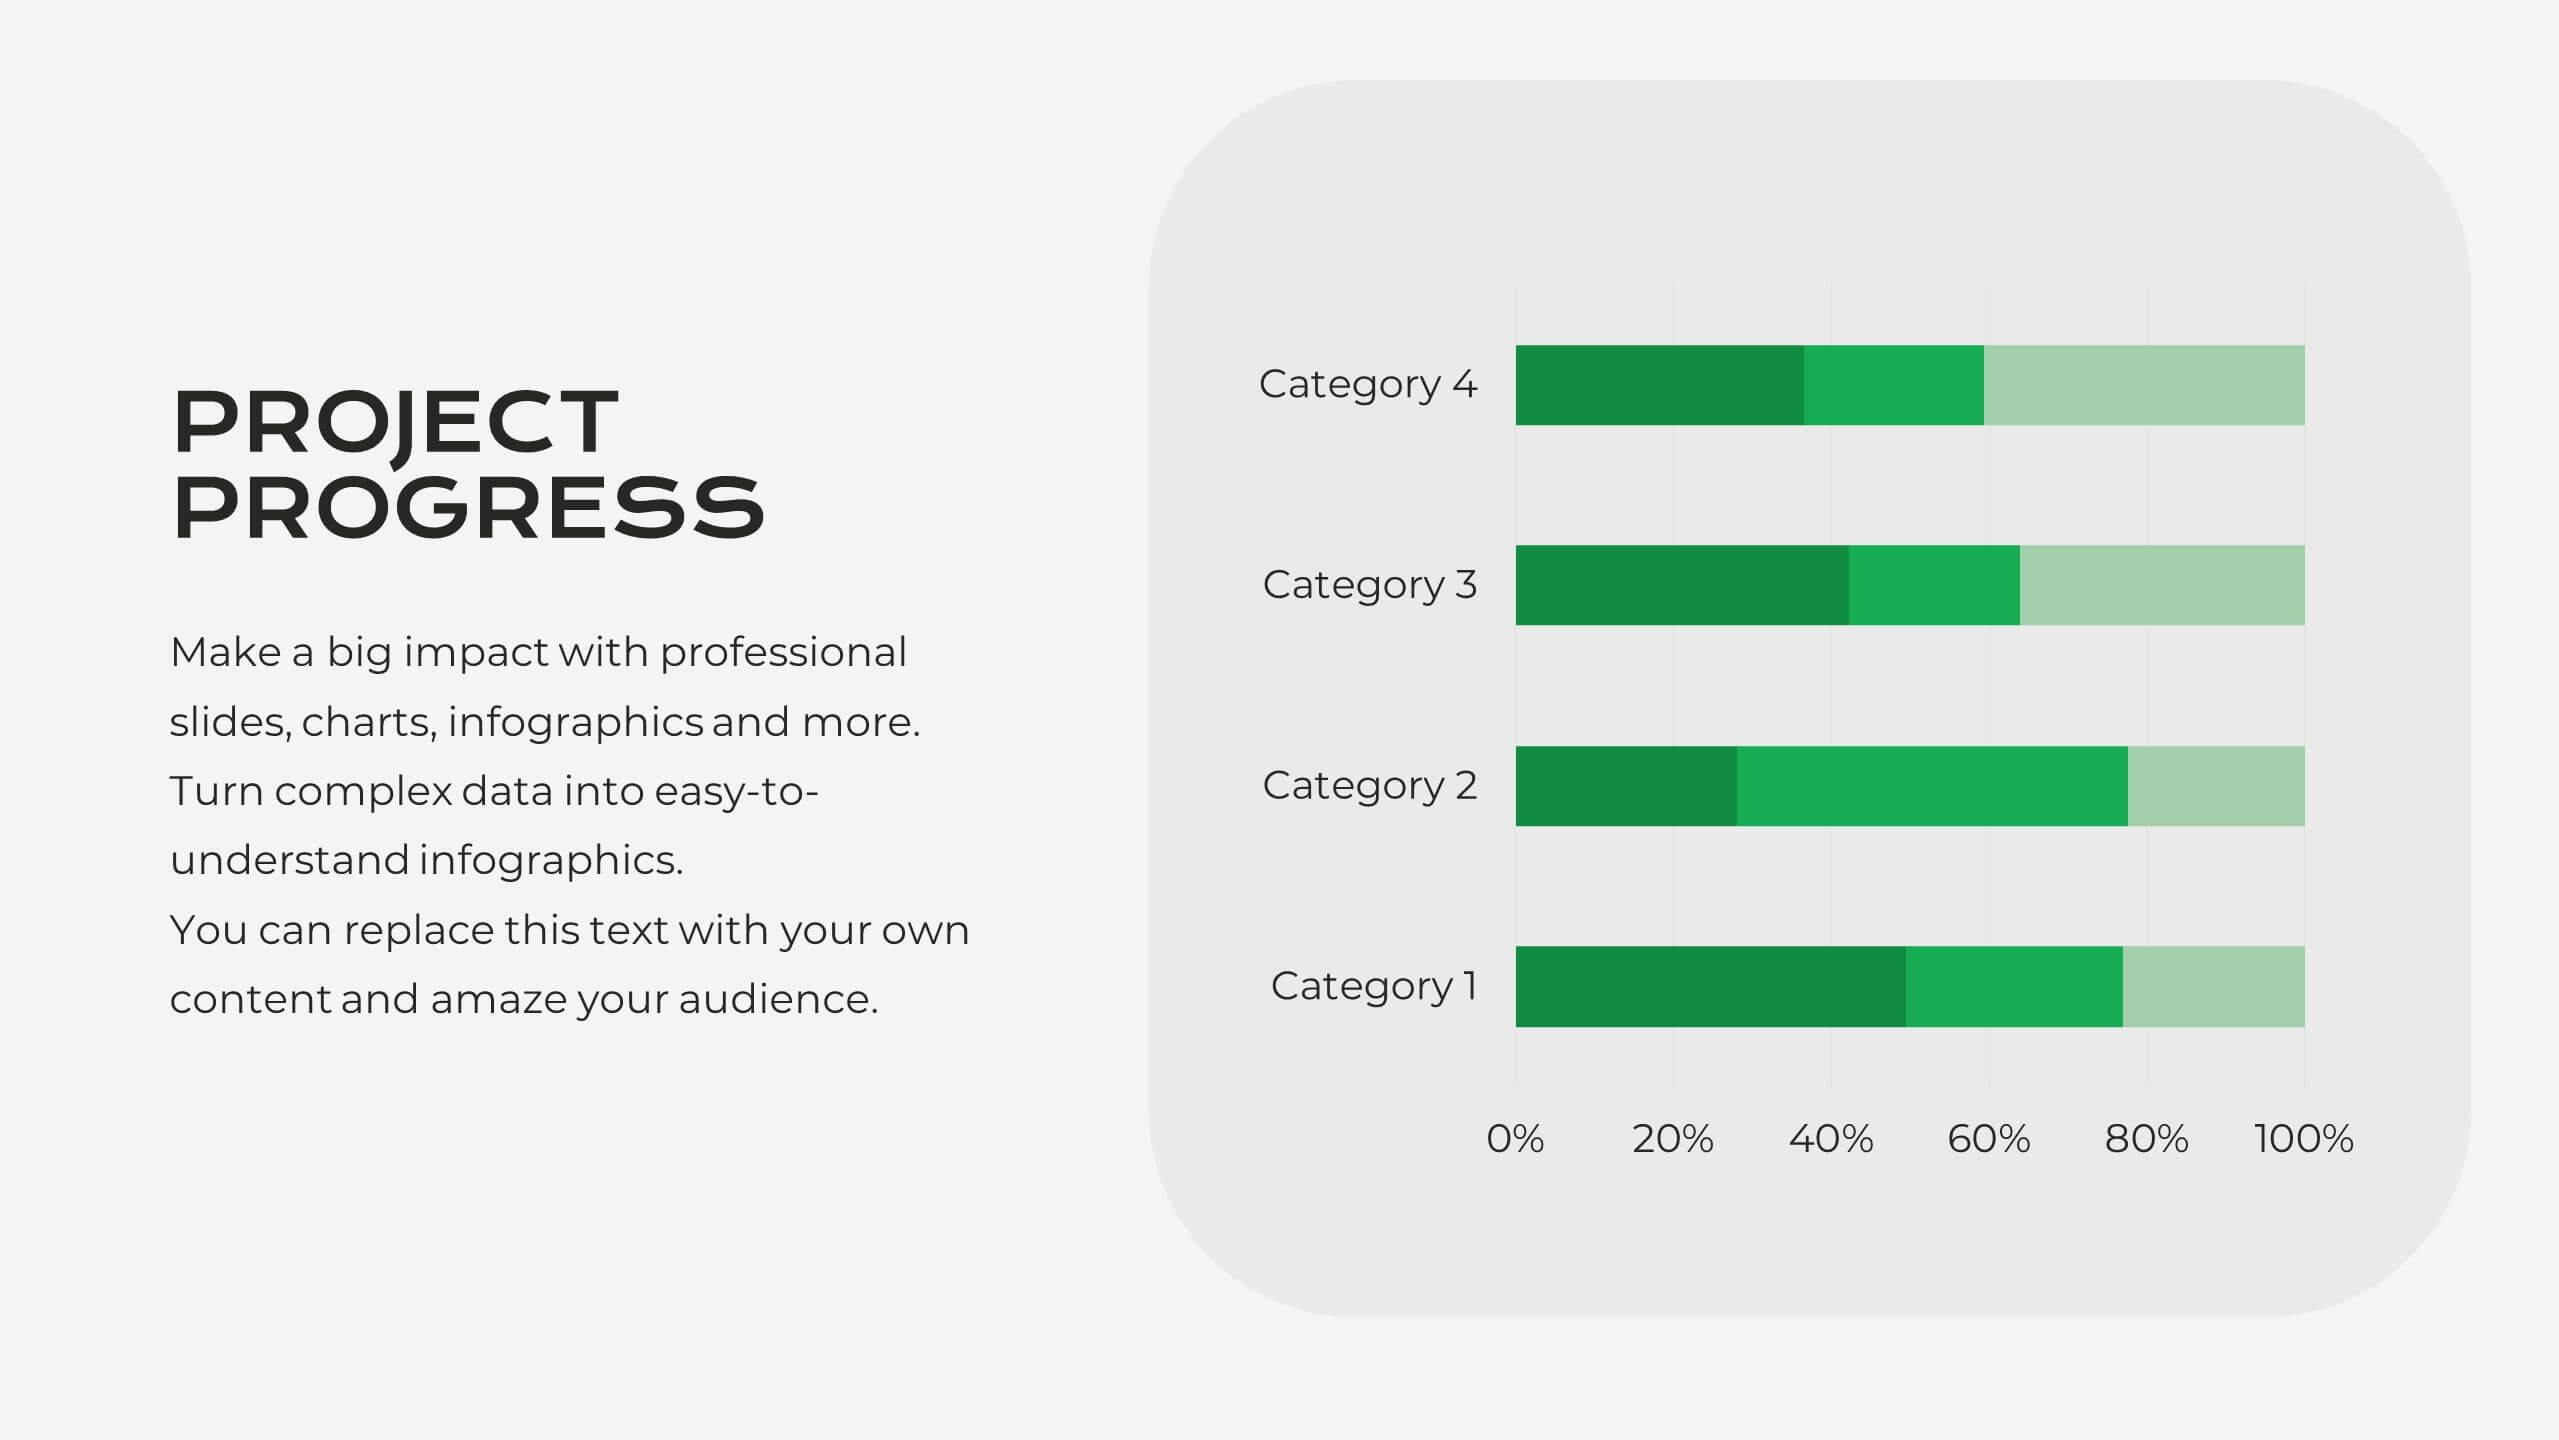
Device Mockup Display Slide Presentation
Showcase your digital products with this device mockup slide. Ideal for highlighting landing pages, dashboards, or app interfaces, the layout includes clean typography and vibrant shapes for visual balance. Fully editable in PowerPoint, Keynote, and Google Slides—customize text, colors, and images to fit your tech brand or presentation style.


6 diapositivas
Top Benefits Breakdown Presentation
Showcase your strongest advantages with a clean, structured layout that highlights each benefit clearly and effectively. This modern design is perfect for presenting key selling points, service features, or strategic highlights in a professional way. Fully customizable and compatible with PowerPoint, Keynote, and Google Slides for seamless editing and presentation.


4 diapositivas
Sustainability Report Slide Deck Presentation
Bring your sustainability story to life with a bright, modern layout that turns complex environmental data into a clear visual narrative. This presentation helps you outline key initiatives, performance metrics, and long-term goals in a clean, structured format. Fully editable and compatible with PowerPoint, Keynote, and Google Slides.


6 diapositivas
Remote Learning and Virtual Classrooms Presentation
Visualize the modern classroom experience with this six-step layout centered around a laptop graphic. Each point is displayed in a colorful speech bubble, making it perfect for showcasing online learning tools, virtual engagement strategies, or course delivery methods. Ideal for educators, trainers, and e-learning professionals, this slide is fully editable and works seamlessly in PowerPoint, Keynote, and Google Slides.


7 diapositivas
AIDA Model Infographic Presentation Template
The AIDA model is the most commonly used marketing communication formula. It describes how people are influenced by advertising, and how brands can use this to their advantage. The AIDA model of marketing is a well-known strategy for organizations to use when presenting products and services. With this template you will be sure you have every element of the AIDA model covered in your presentation. This template will provide you with a perfect and easy way to create your ideal AIDA model presentation. This includes a comprehensive overview of the AIDA marketing funnel and how it works.


5 diapositivas
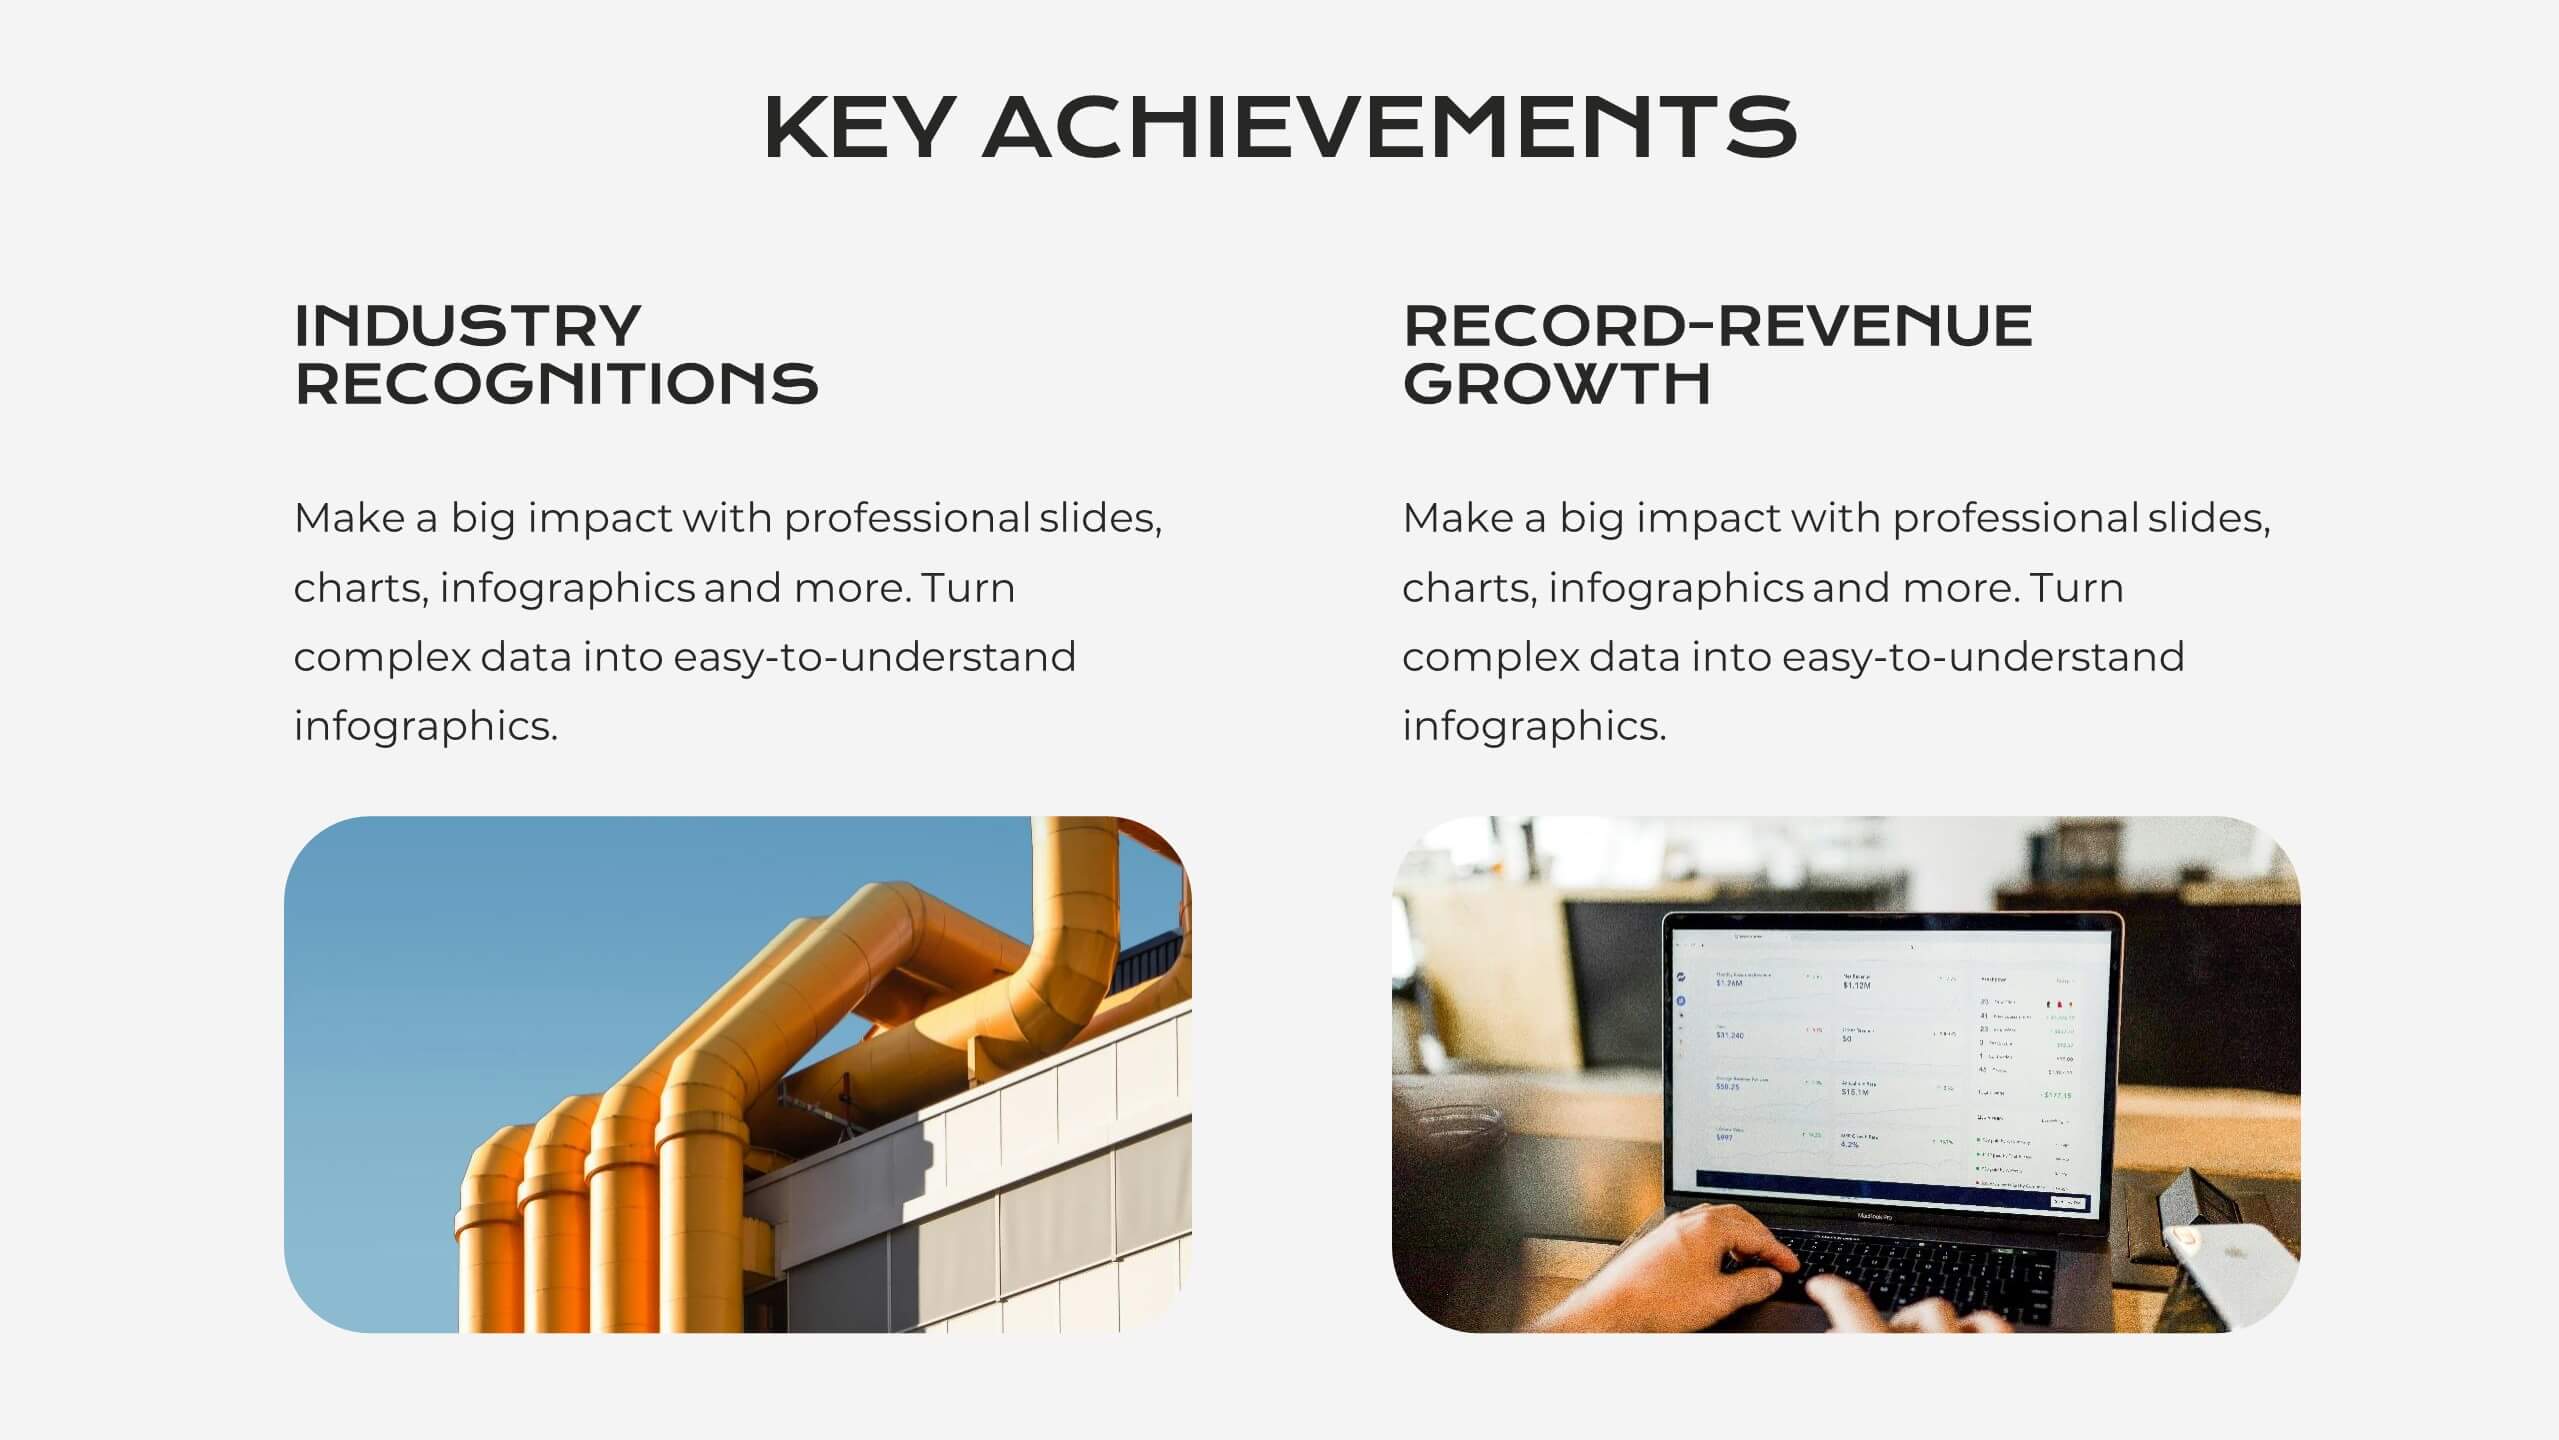
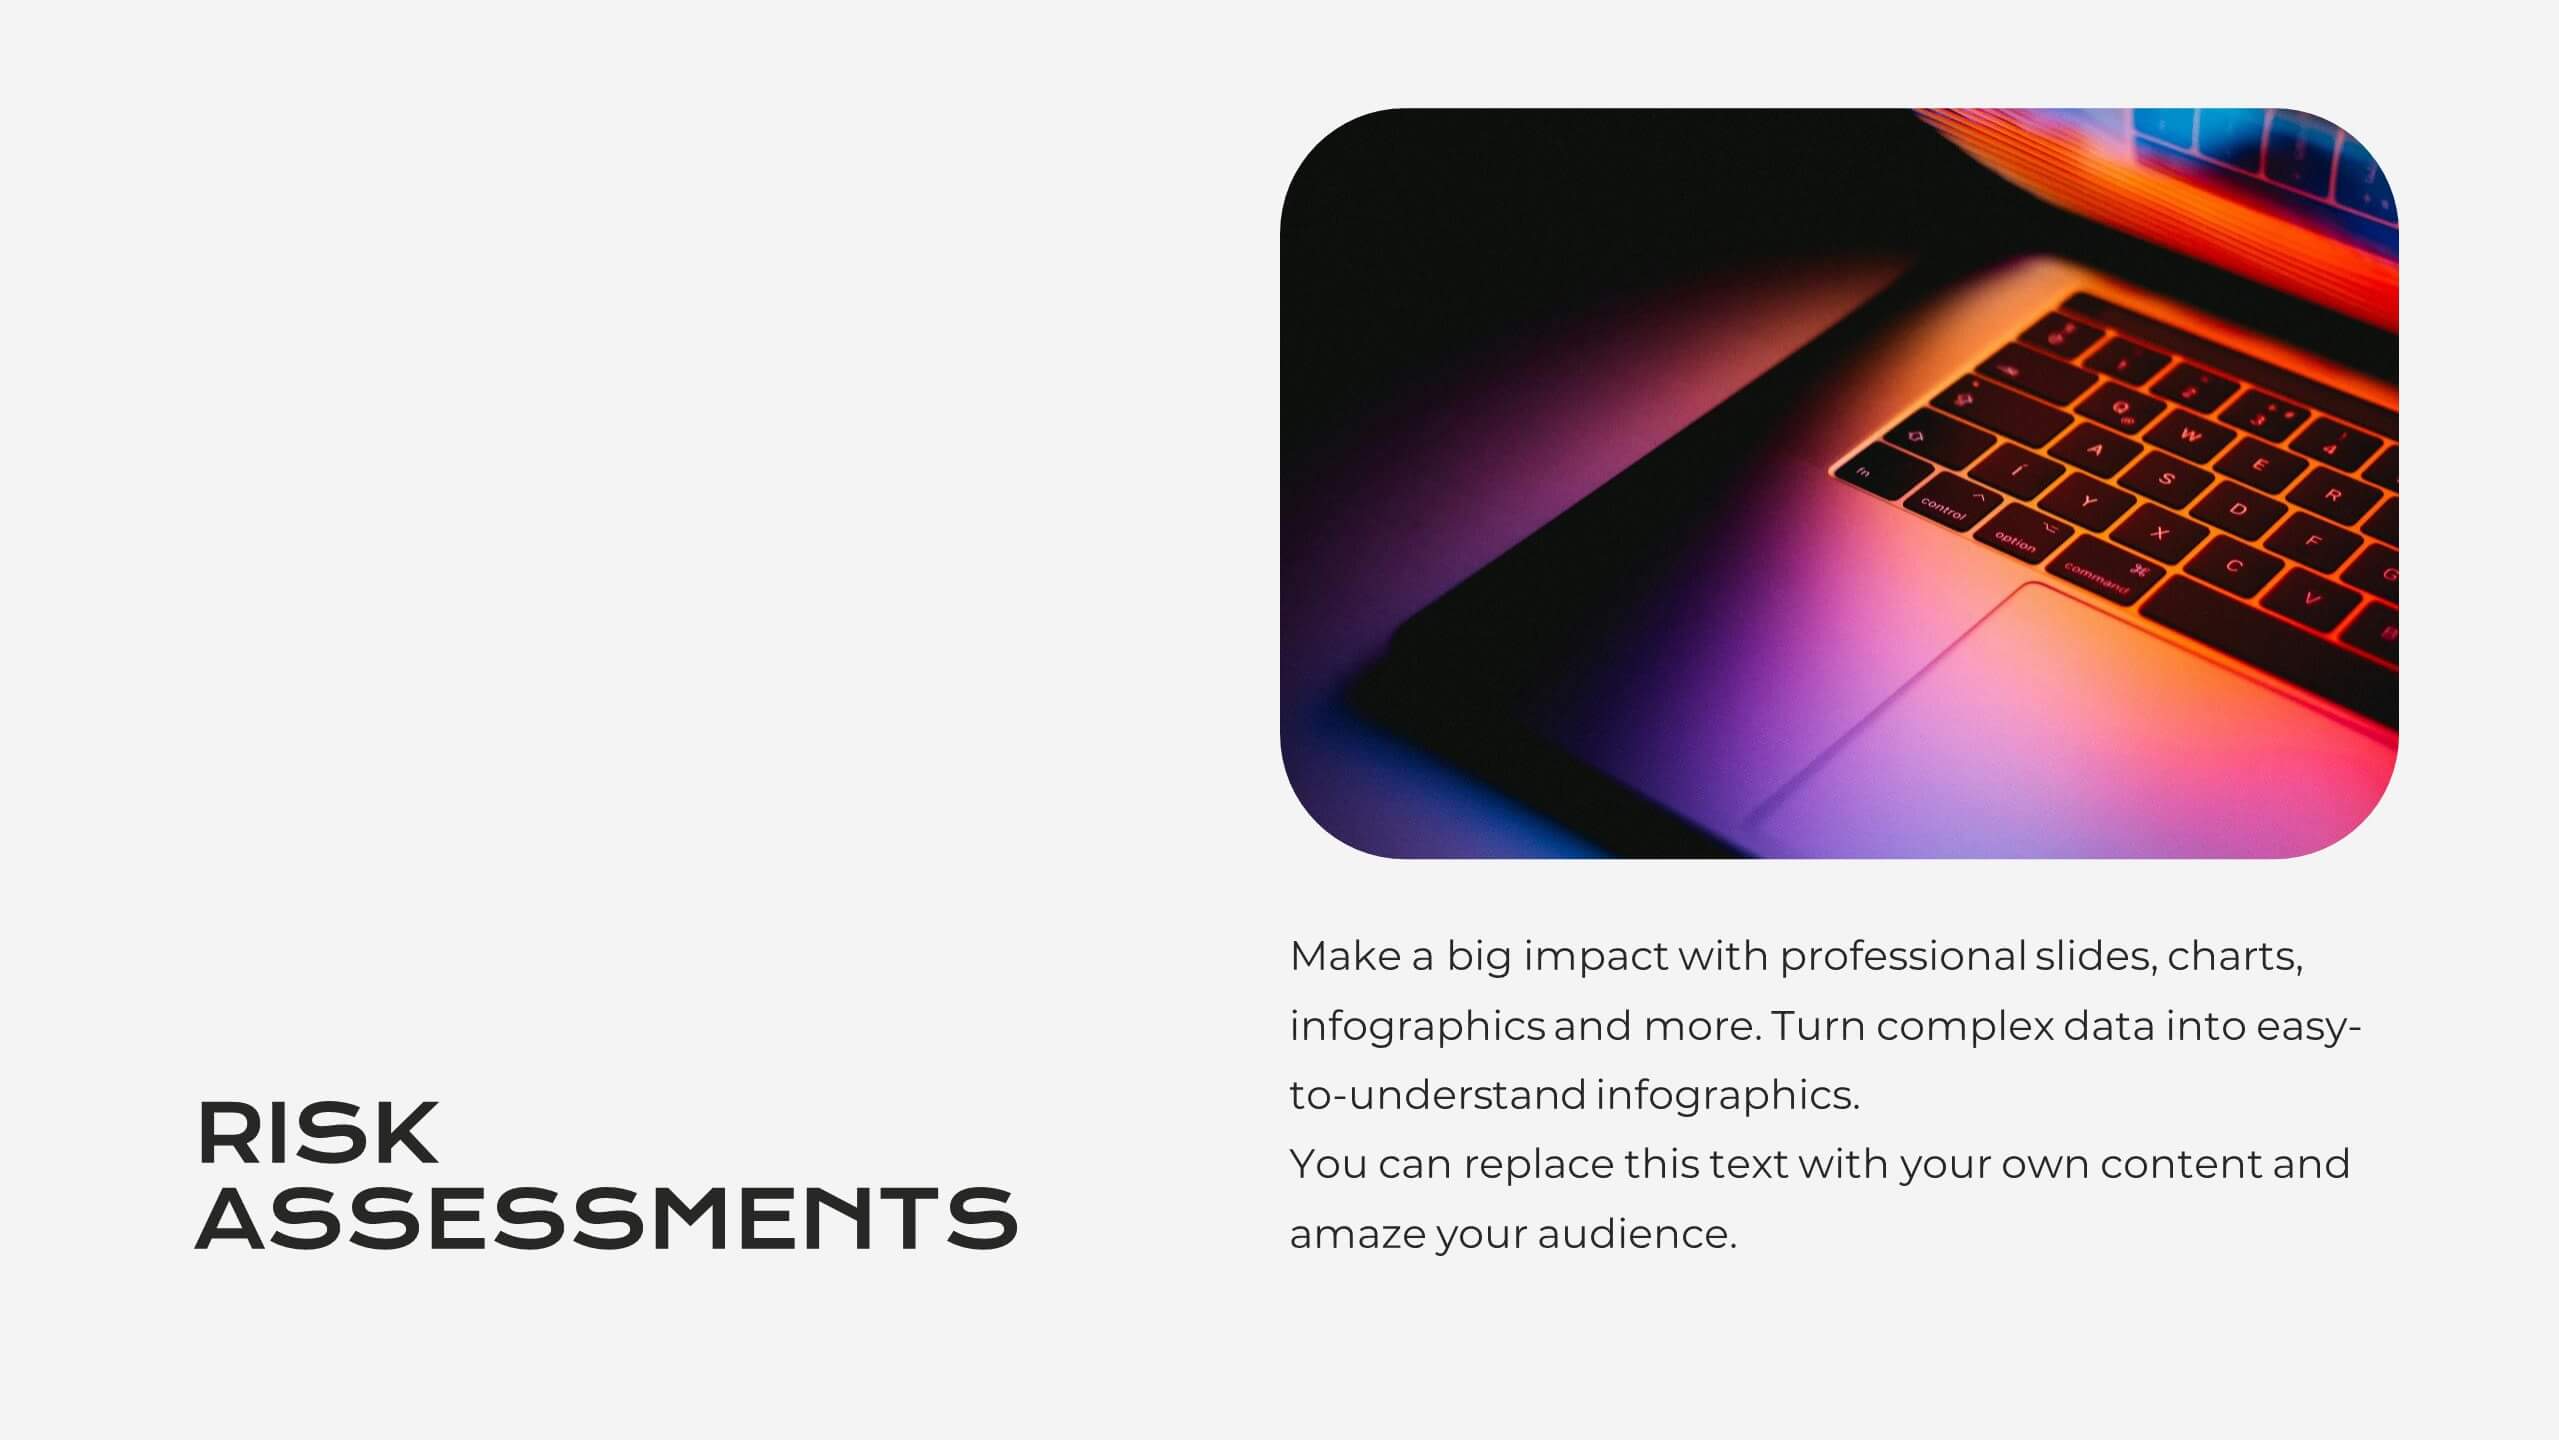
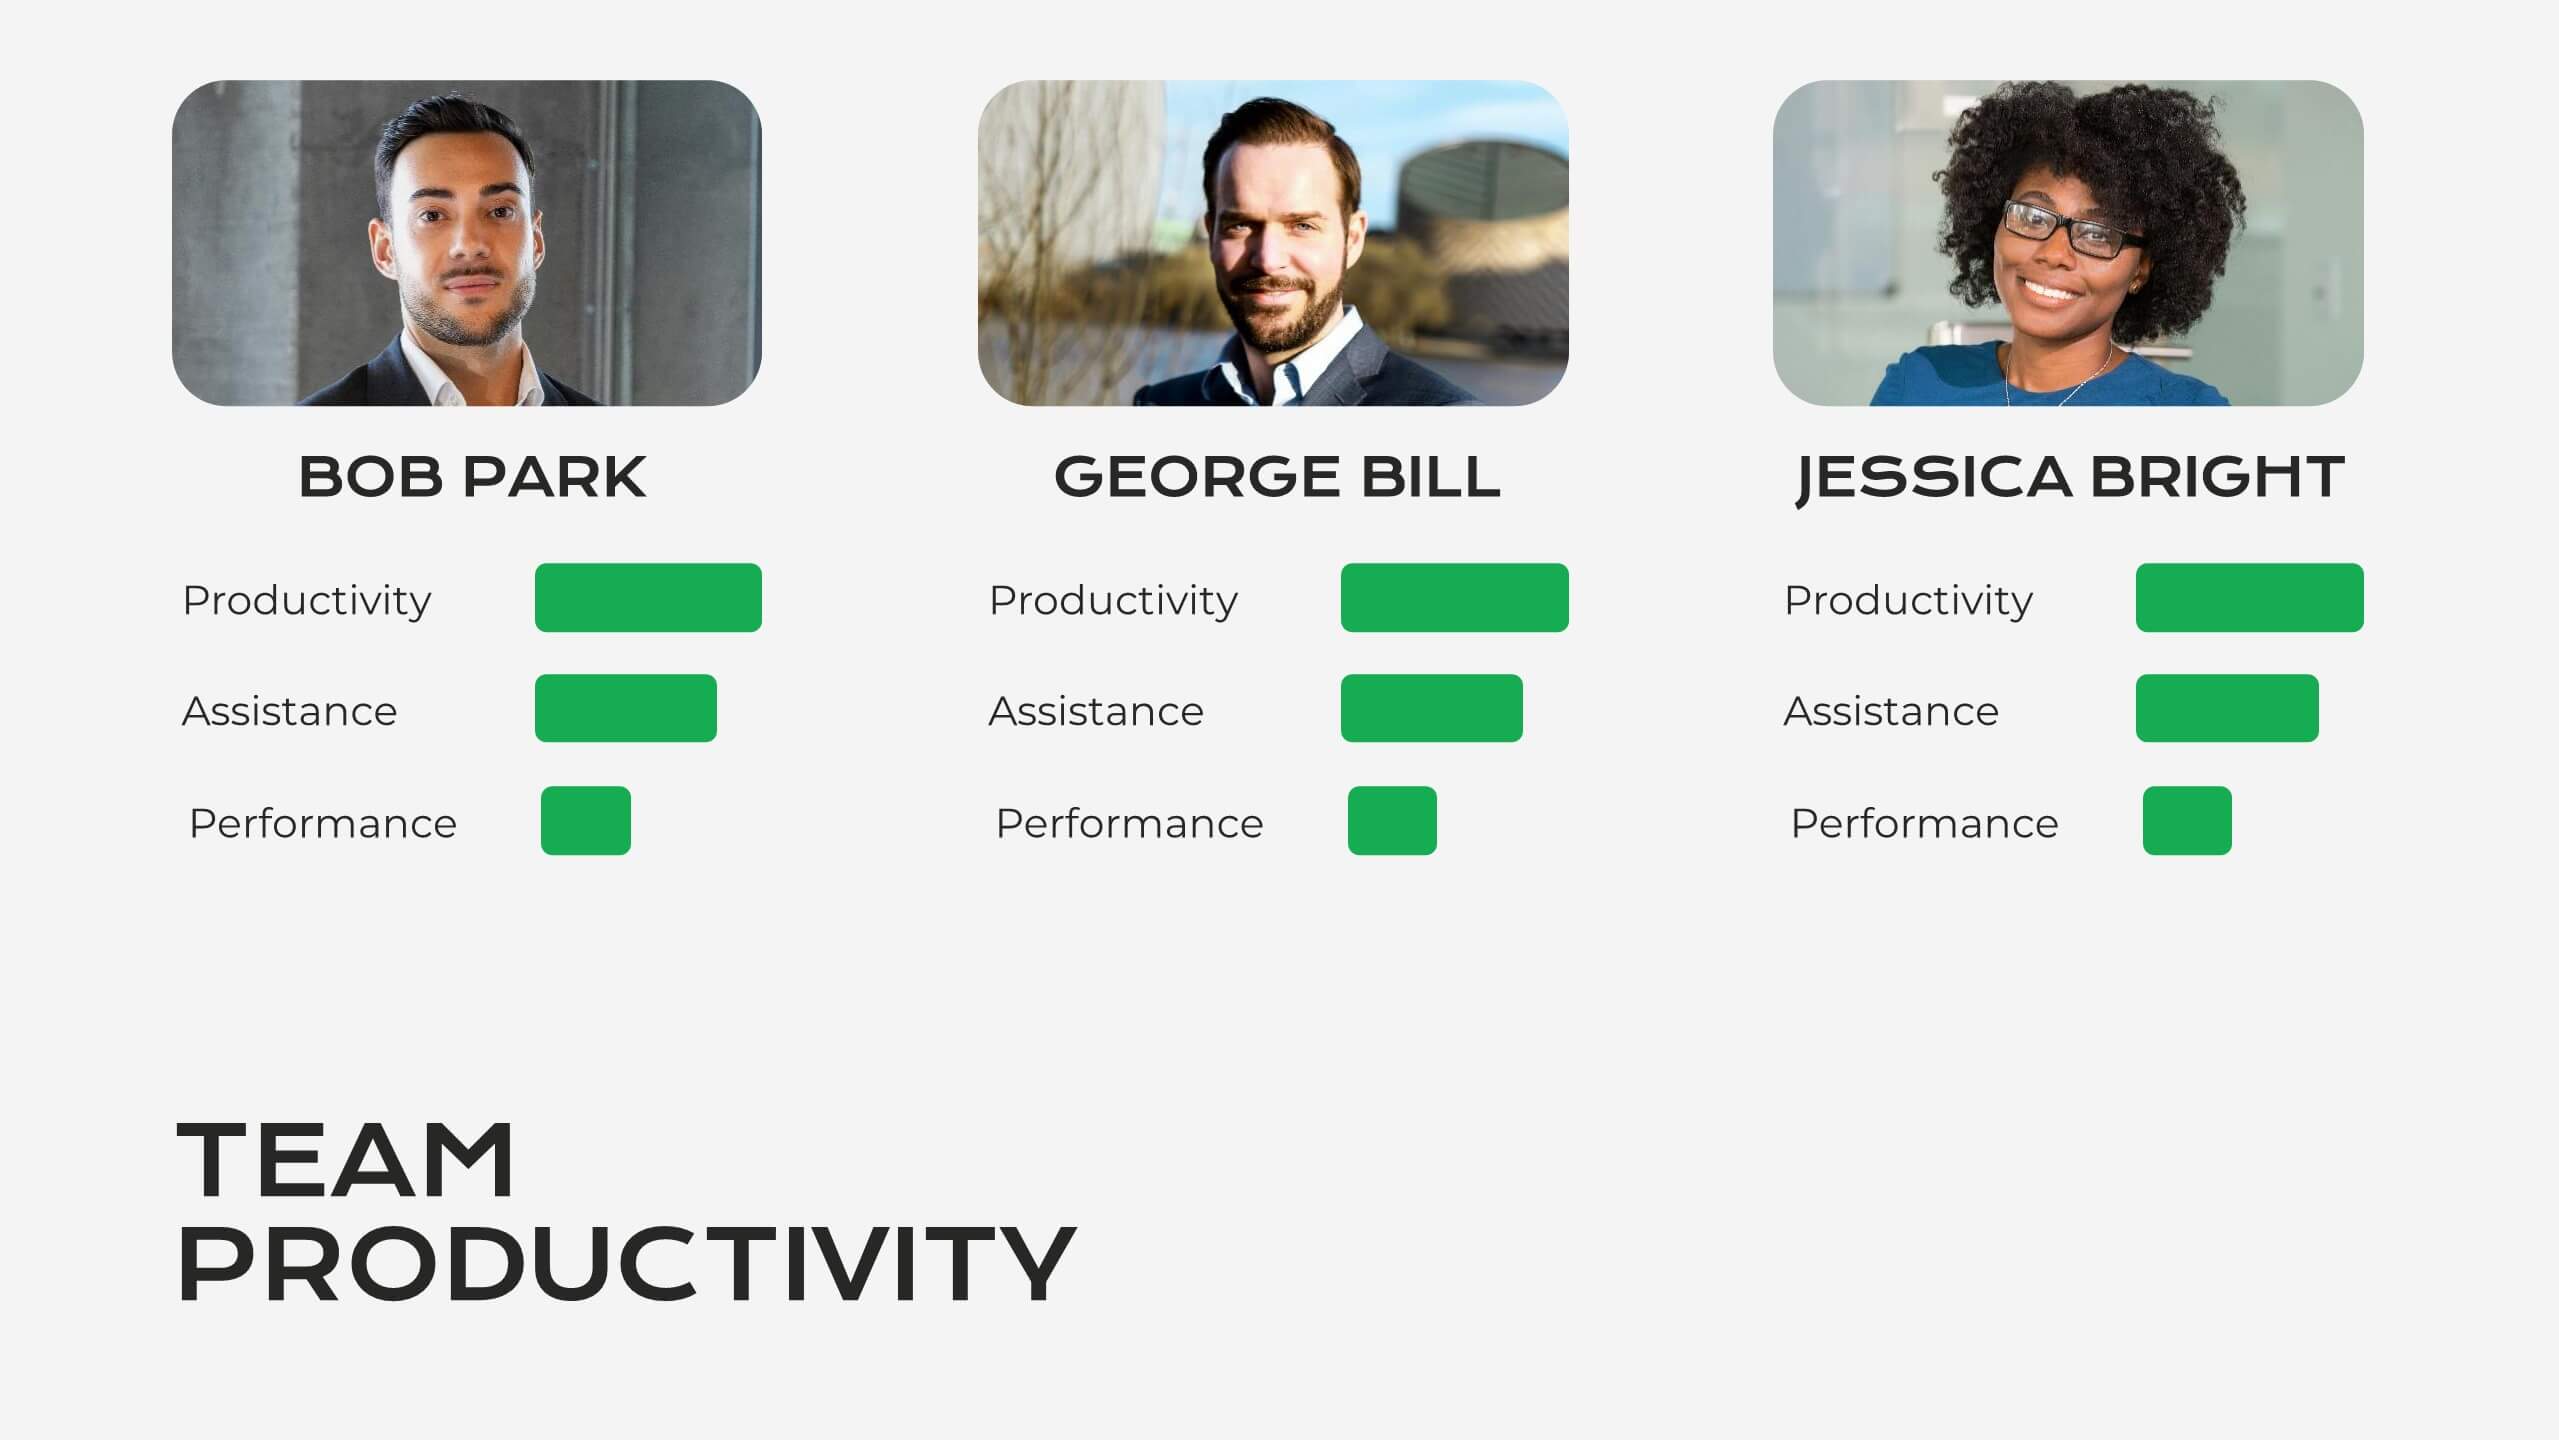
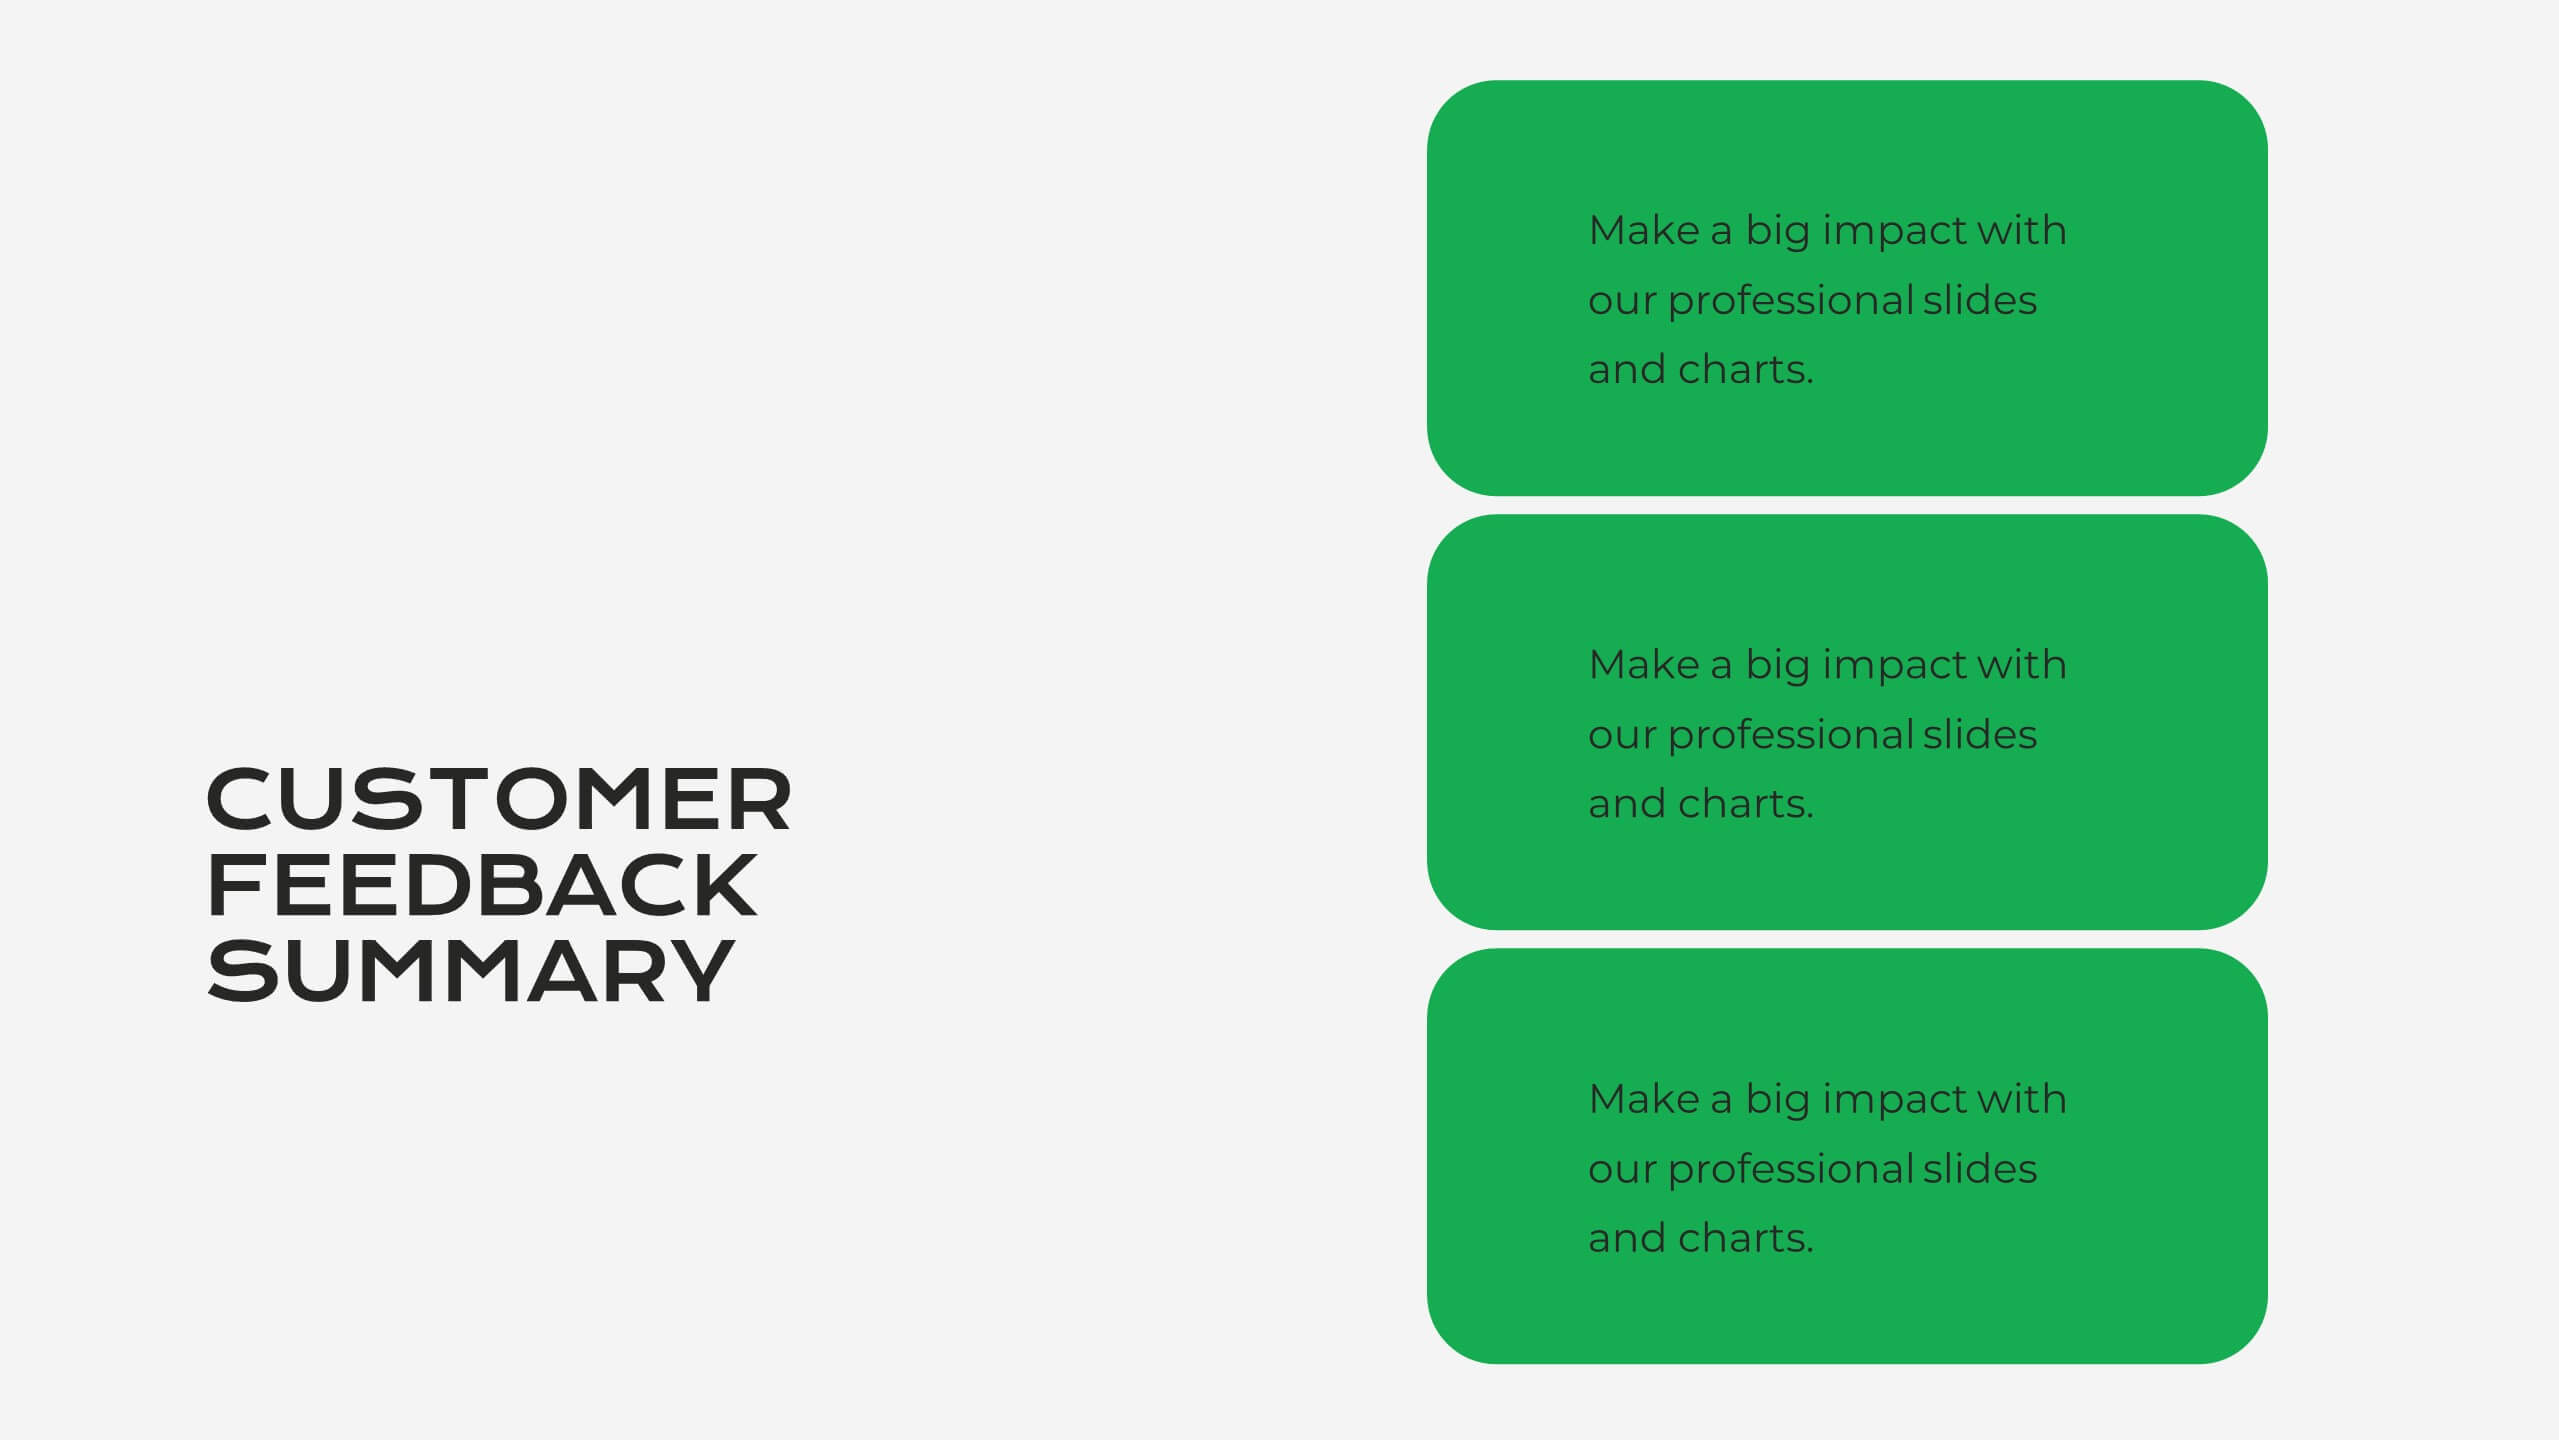
Corporate Risk Assessment Slide Presentation
Streamline complex evaluations with a clean, step-by-step visual that guides your audience through key business risks and mitigation strategies. Ideal for planning sessions or executive reports, this modern design helps simplify communication and enhance decision-making. Fully compatible with PowerPoint, Keynote, and Google Slides for seamless editing and presentation.

21 diapositivas
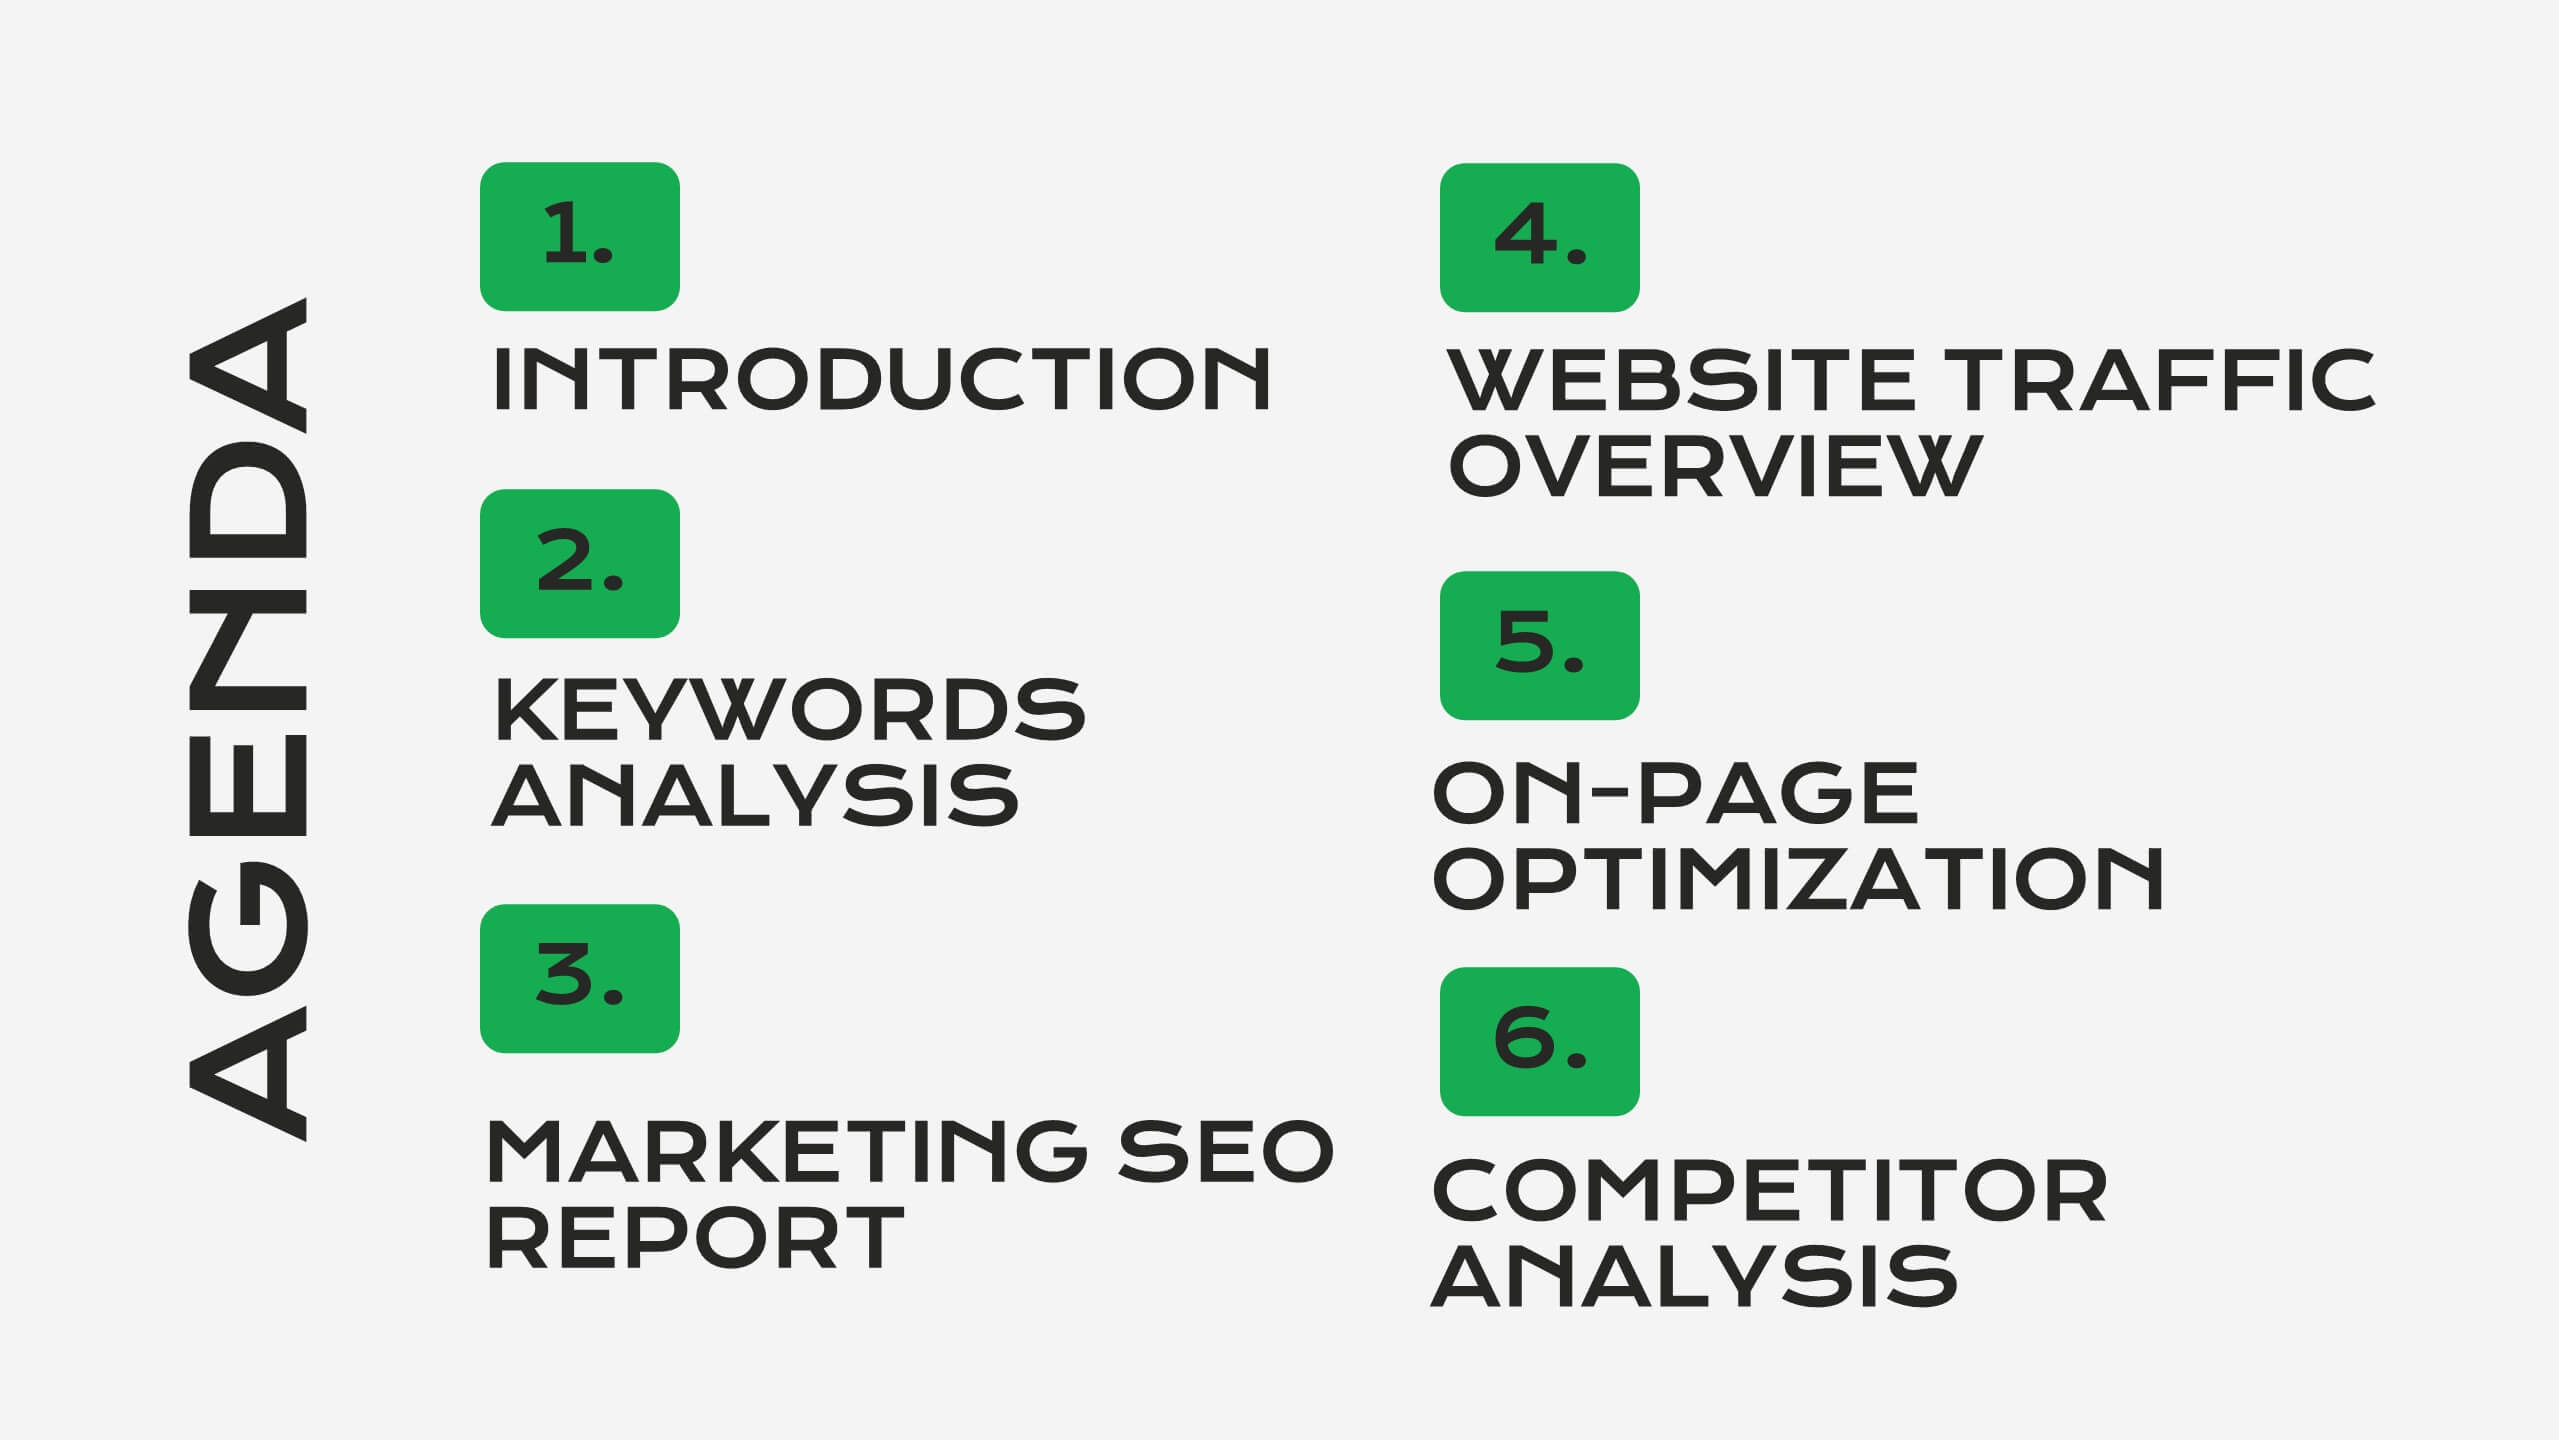
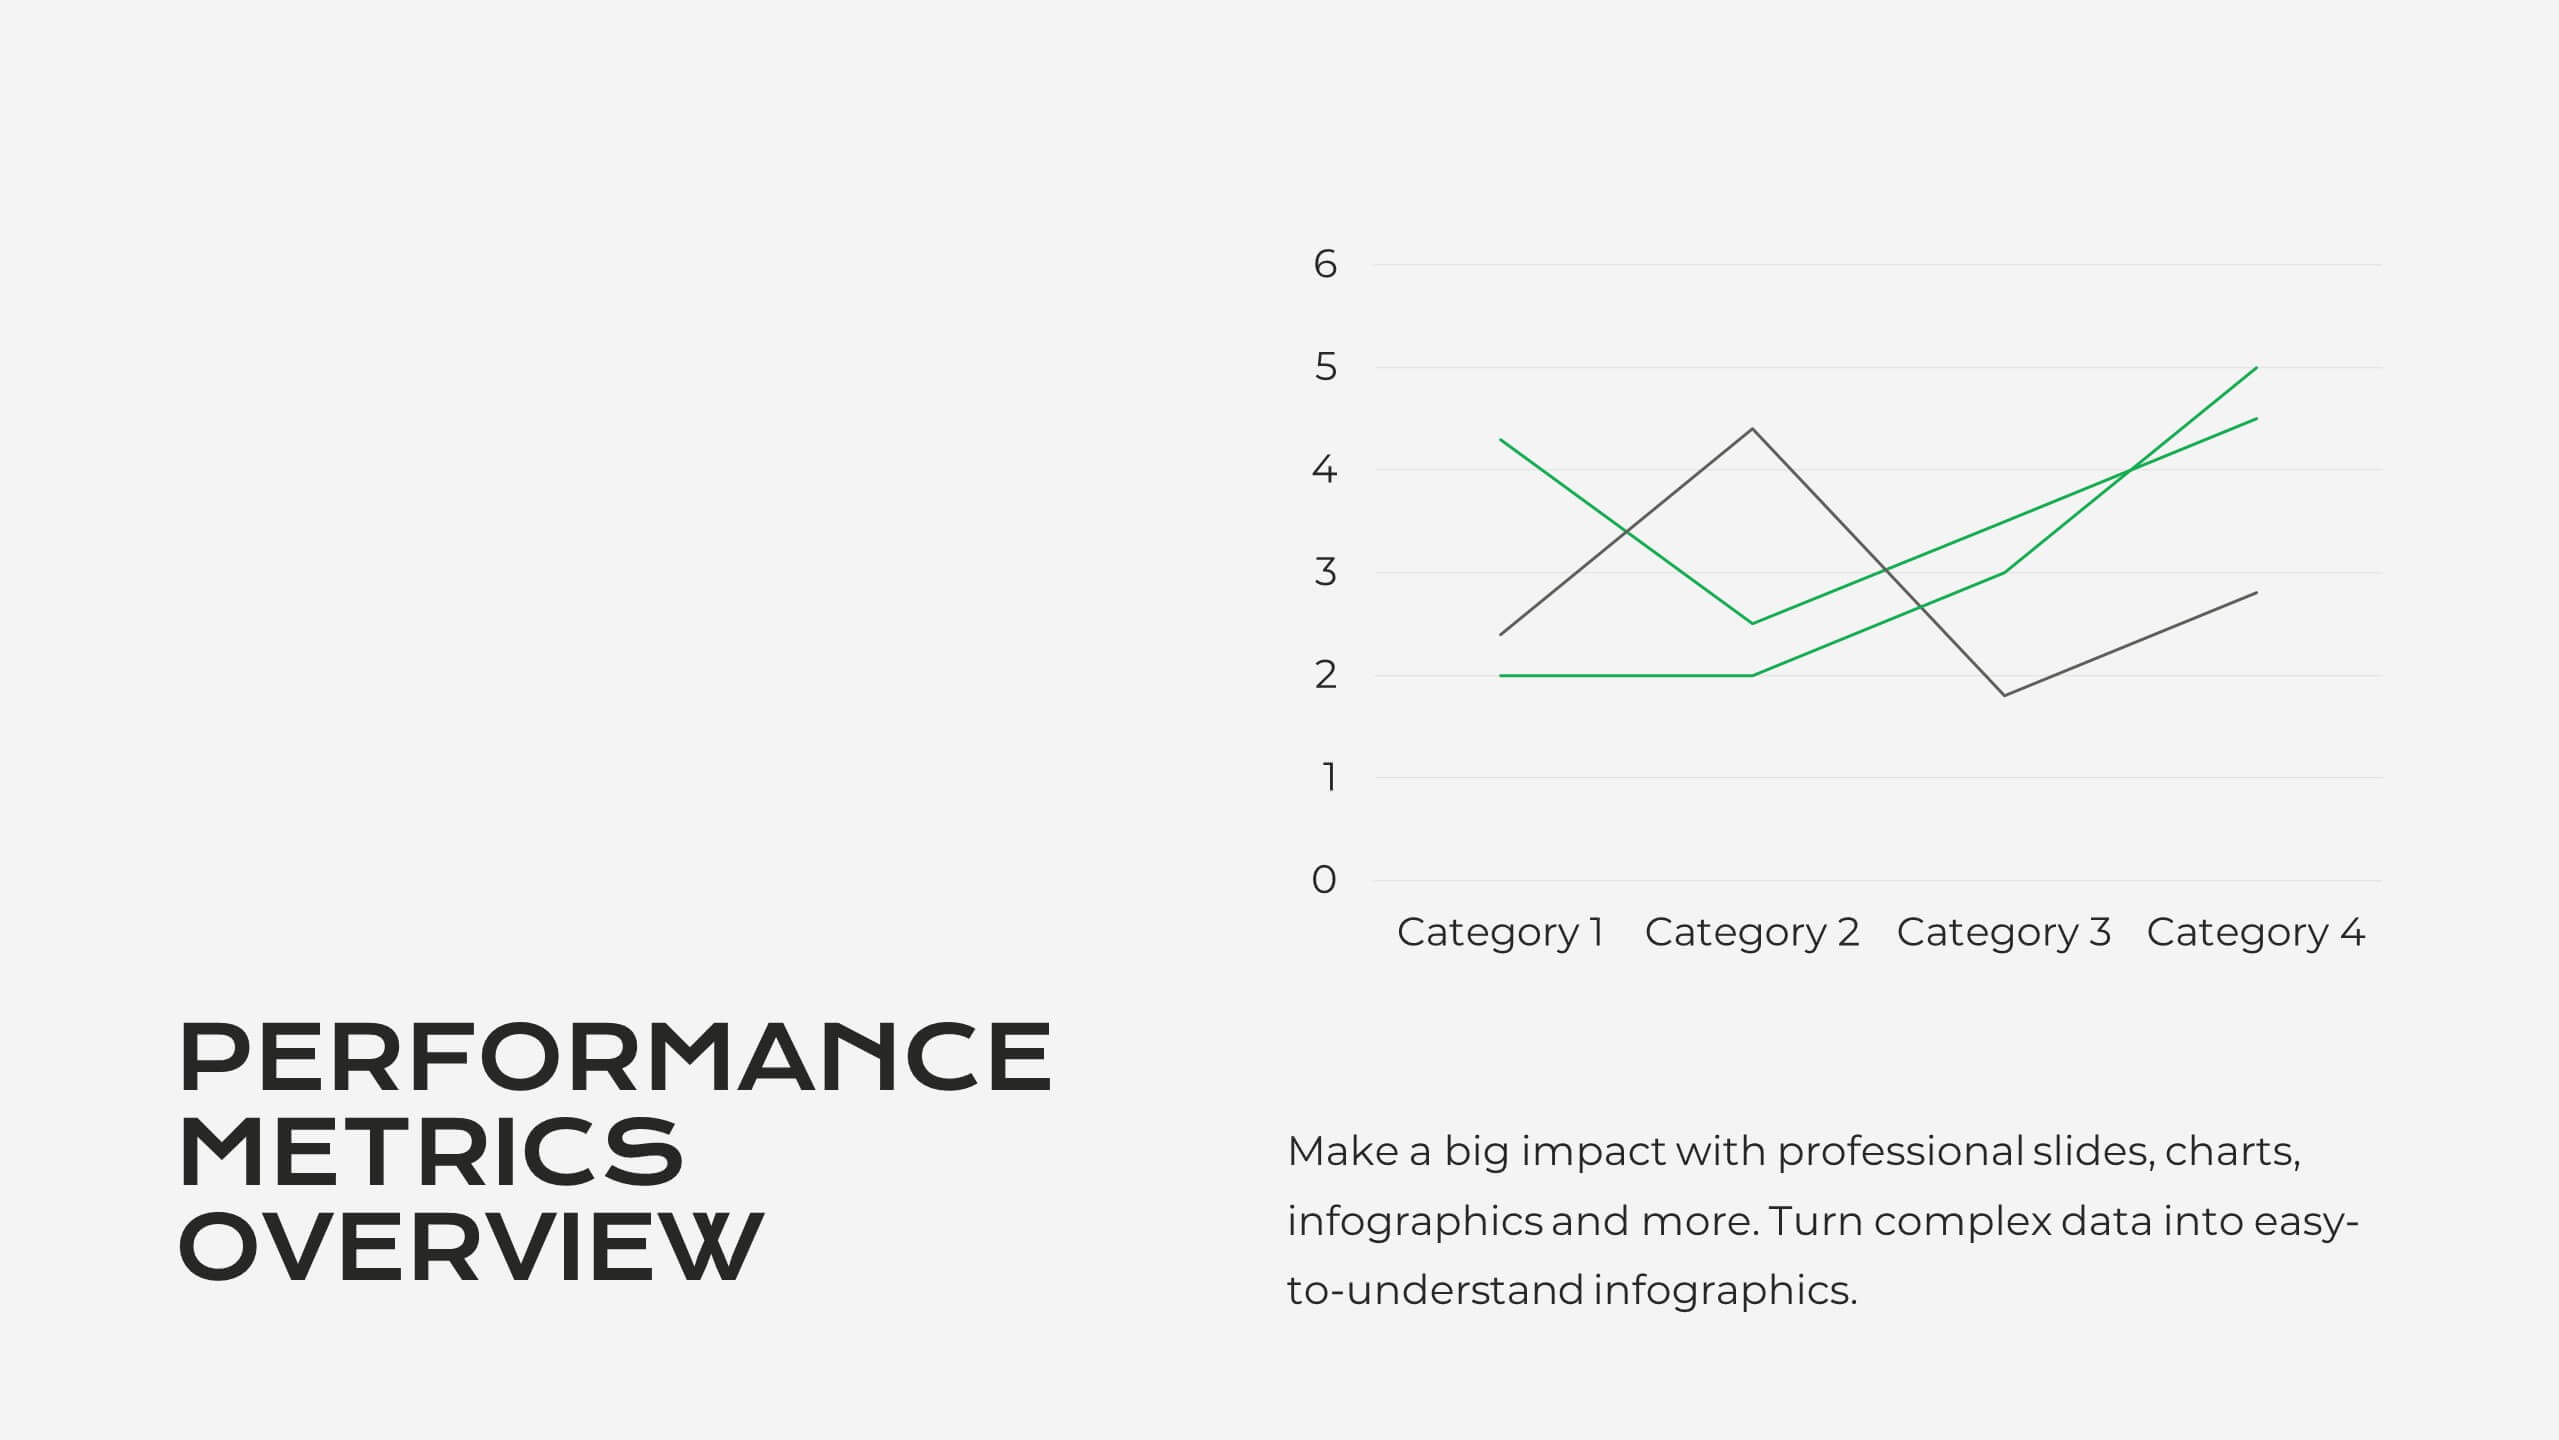
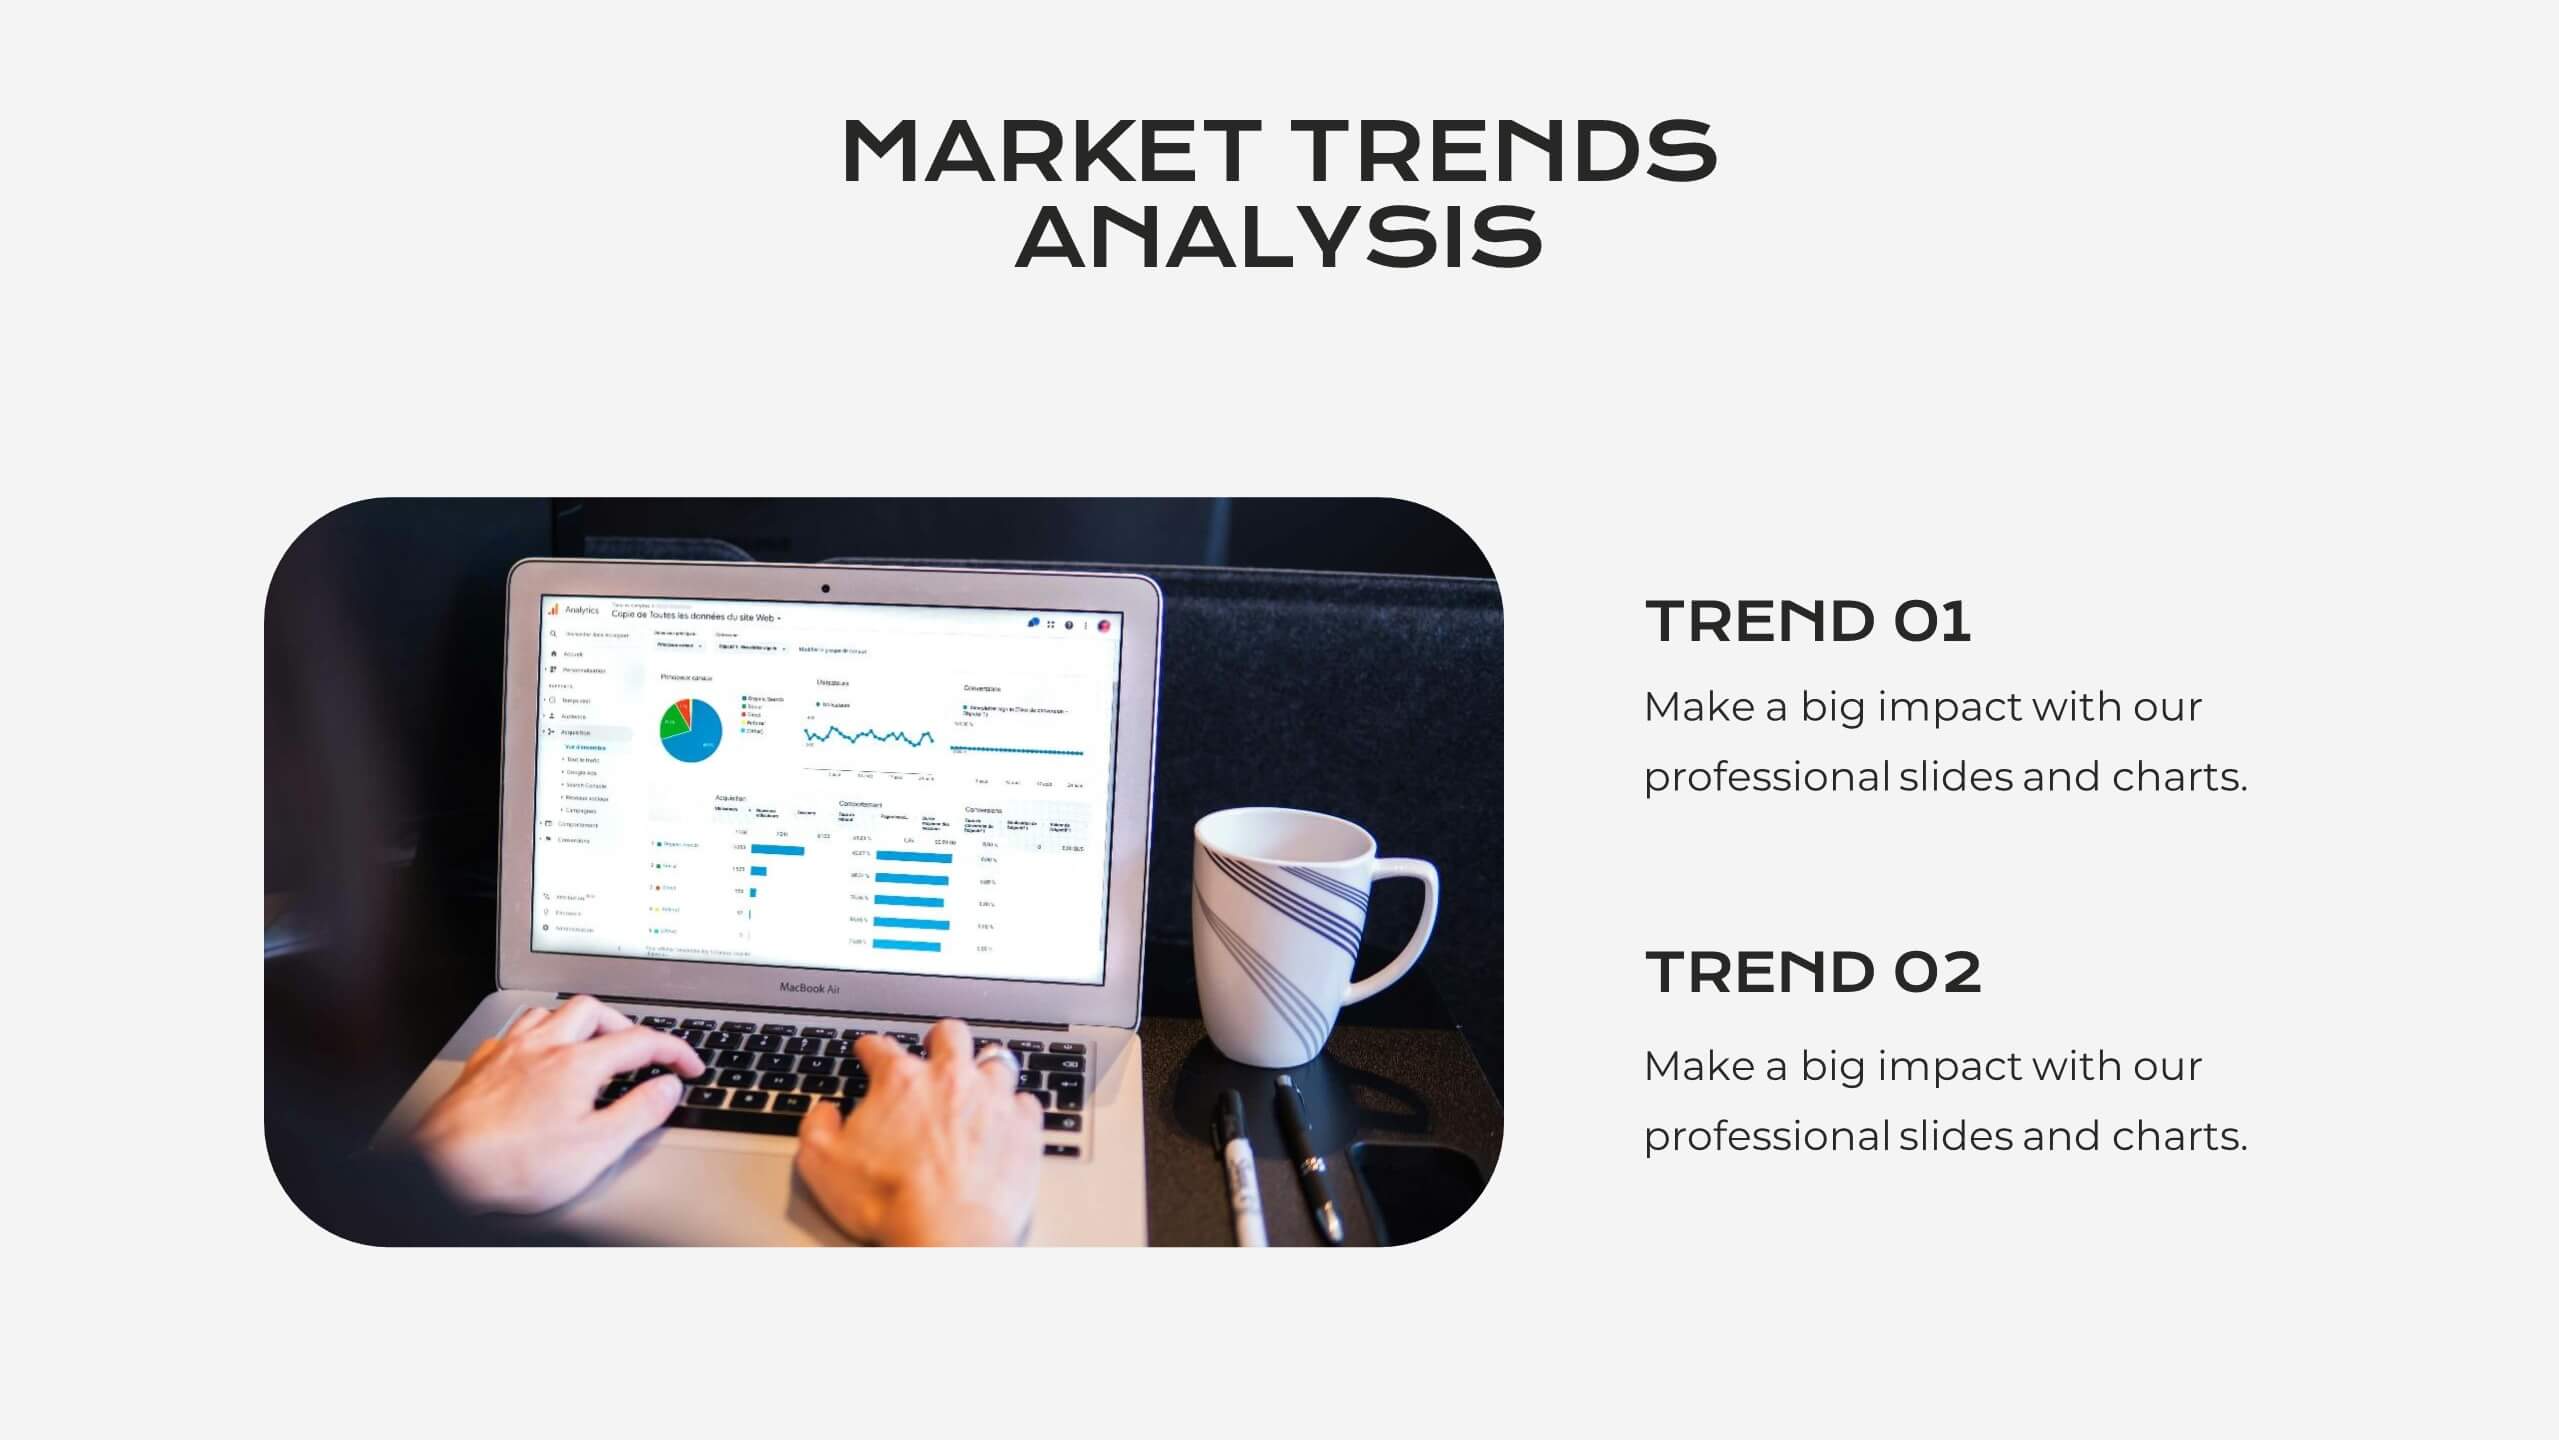
Serene Market Analysis Report Presentation
This modern and clean Market Analysis Report template is designed to help you present key data and insights with clarity and impact. Ideal for business professionals and analysts, it includes slides for key highlights, performance metrics, financial summaries, competitor insights, and strategic initiatives. The template's sleek layout ensures that your data is easy to understand and visually appealing, making it perfect for internal reports or client presentations. Customize it effortlessly in PowerPoint, Keynote, or Google Slides, and impress your audience with a polished and professional report.


26 diapositivas
Soren Presentation Template
Soren is a cool, clean, simple easy to use template. This beautiful template is great for all types of businesses and creative projects. The colors are bold and simple to capture the audience needs. Soren is a multipurpose theme that can be used to capture the attention of your clients in a friendly, unique way. This template is a minimalistic design to attract your customers. The simple text, charts and tables make it easy to customize this template to match your brand. Whether you’re in need of a business presentation, newsletter or even social media posts – Soren is the perfect fit for you.


8 diapositivas
Africa Development & Market Potential Presentation
Showcase regional opportunities with the Africa Development & Market Potential Presentation. This professional slide highlights four key countries across the continent using vibrant map markers and icons, ideal for data comparison, investment potential, or development tracking. Cleanly structured and easy to edit in PowerPoint, Keynote, Google Slides, and Canva.


6 diapositivas
Process Direction Flow Mapping
Showcase linear progress with clarity using the Process Direction Flow Mapping Presentation. This layout features a clean, step-by-step directional flow with five stages, ideal for outlining project phases, business workflows, or timeline milestones. Each stage is color-coded with editable text areas, making it easy to customize and adapt for PowerPoint, Keynote, or Google Slides.


6 diapositivas
5-Stage Sales Funnel Presentation
Visualize your sales process effortlessly with this 5-Stage Sales Funnel template. Ideal for showcasing lead conversion, customer journey, and sales strategies, this design is fully customizable. Adjust colors, text, and icons to fit your needs. Compatible with PowerPoint, Keynote, and Google Slides for seamless integration into your presentations.


7 diapositivas
Budget Forecasting Spreadsheet Infographic
Step into the strategic realm of budget forecasting with our detailed infographic. Cast in the reliability of blue, the vibrancy of orange, and the optimism of yellow, our template is a beacon of financial foresight. Equipped with precise infographics, intuitive icons, and adaptable image placeholders, it transforms financial data into a predictive narrative. Flawlessly tailored for Powerpoint, Keynote, or Google Slides. An essential tool for financial analysts, business strategists, accountants, or any professional navigating the future financial terrains of their organization. Forecast with confidence; let every slide be a roadmap to financial prudence.


21 diapositivas
Starchime UX Case Study Presentation
Showcase your UX design process with this case study template, covering research, user journey mapping, wireframes, and usability testing. Ideal for presenting design insights and outcomes. Compatible with PowerPoint, Keynote, and Google Slides, it’s perfect for a clear, professional, and impactful UX design presentation.


10 diapositivas
Pharmaceutical Industry Report Presentation
Turn complex medical data into clear insights with this sleek, capsule-themed presentation. Ideal for pharmaceutical companies, healthcare professionals, and research analysts, it simplifies industry reports, drug data, and market trends with a clean, professional design. Fully editable and compatible with PowerPoint, Keynote, and Google Slides for easy customization.


7 diapositivas
Criminal Law Infographic
The Criminal Law Infographic presents an engaging and informative visual breakdown of key components within the field of criminal law. Each segment highlights different aspects such as crime rates, judicial processes, or enforcement statistics. This template is designed to be user-friendly, making it an ideal choice for legal professionals, or students who need to present complex legal information. Compatible with PowerPoint, Google Slides, and Keynote, it offers a versatile way to communicate legal concepts and data in both educational and professional settings. Its clear structure ensures that viewers can easily follow and comprehend the critical elements of criminal law.


26 diapositivas
Market Growth Tactics Presentation
Chart a path to success with our Market Growth Tactics presentation template, designed for seamless use in PowerPoint, Keynote, and Google Slides. This template is a vital asset for business strategists, marketing professionals, and consultants who aim to drive growth and capture market share. Our Market Growth Tactics template lays out a strategic framework for identifying and leveraging growth opportunities. It provides a comprehensive array of slides to showcase market analysis, competitive landscape, growth strategies, and execution plans. With customizable elements, you can tailor your presentation to reflect specific market insights and growth targets relevant to your audience. The template is crafted to facilitate clear communication of complex growth strategies, breaking them down into actionable steps with the aid of charts, graphs, and infographics. This helps to convey your message effectively, ensuring that your audience can visualize the growth journey and understand the tactics involved. Elevate your market growth presentations and become an authoritative voice in your industry with our SEO-optimized template, designed to engage, inform, and inspire action towards market expansion.