


Características


¿Tienes alguna pregunta?
Recomendar


26 diapositivas
Managing Work-Life Balance Presentation
Find harmony between career and personal life with this insightful presentation on managing work-life balance. Covering key strategies like time management, stress reduction, remote work efficiency, and self-care practices, this template helps promote productivity and well-being. Fully customizable and compatible with PowerPoint, Keynote, and Google Slides for a seamless and engaging presentation experience.


7 diapositivas
Mind Map Process Infographic
A Mind Map Process Infographic is a visual representation that illustrates a process or a series of steps using the structure and principles of a mind map. This template diagram is a dynamic visual guide to help individuals and teams harness the true potential of mind mapping. This is used to visually organize information in a hierarchical and interconnected manner, often starting with a central concept or theme and branching out into related ideas or subtopics. Mind maps are the ultimate tool for brainstorming, planning, and innovating, and this template is your gateway to unlocking their full potential.


5 diapositivas
AIDA Steps Infographics
AIDA is a marketing model that is widely used in advertising and promotion. It stands for Awareness, Interest, Desire, and Action. It is a four-stage model that describes the process that a potential customer goes through before making a purchase. This Infographic can help you better understand how you can move your customers through these four stages. This consists of four sections that correspond to each stage of the model. Each section allows you to include a brief explanation of what the stage is, and how it relates to the overall purchase process. With these unique infographics, create an effective marketing strategy that successfully moves your customers through each stage of the AIDA model.

1 diapositiva
Professional Presentation Cover Slide Presentation
Make a bold first impression with this sleek and modern cover slide designed to introduce your presentation with confidence. Its clean layout and striking geometric shapes create a polished look while giving viewers a clear sense of professionalism. Perfect for business, marketing, or project presentations, and fully compatible with PowerPoint, Keynote, and Google Slides.


5 diapositivas
Beer Industry Infographics
The beer industry refers to the production, distribution, and sale of beer, which is a popular alcoholic beverage consumed worldwide. These vertical infographics provide key insights into the beer industry. They are designed to present data, facts, and trends in a visually engaging format, making it easy for viewers to understand and retain the information. The infographics feature a captivating design with beer-themed visuals, vibrant colors, and appealing typography. The visuals are carefully chosen to represent different aspects of the beer industry and create a cohesive and visually appealing infographic.


5 diapositivas
Logistics Flow Diagram Presentation
Turn complex processes into a clear visual journey with this dynamic presentation design. Ideal for illustrating workflows, delivery systems, or operational stages, it helps simplify how goods or data move from start to finish. Fully editable and compatible with PowerPoint, Keynote, and Google Slides for seamless customization and presentation.


5 diapositivas
History Timeline Infographics
A History Timeline is a visual representation of events and their chronological order over a specific period of time. These infographic templates are designed to help you organize and understand historical events by presenting them in a sequential manner. It offers a visually engaging way to present the information and create a clear understanding of the sequence and significance of events. They showcases the chronological sequence of historical events, developments, or milestones. Using this template will help your audience grasp the sequence of events and the context of historical periods, facilitating a deeper understanding and appreciation of history.


4 diapositivas
Neuroscience-Inspired Concept Mapping Presentation
Visualize abstract ideas with clarity using the Neuroscience-Inspired Concept Mapping Presentation. Featuring a head silhouette and four labeled concept nodes, this layout is perfect for connecting ideas, frameworks, or steps in a thought process. Fully editable in PowerPoint, Canva, and Google Slides for seamless customization and presentation.


19 diapositivas
Dynamo Product Roadmap Presentation
Introduce your product roadmap with this professional template! Showcase customer pain points, demonstrate how your product solves problems, and provide a detailed product overview. Highlight your competitive analysis, marketing and sales strategy, and distribution channels. Perfect for presenting support information and engaging in Q&A sessions. Compatible with PowerPoint, Keynote, and Google Slides for versatile presentations.


4 diapositivas
Project Proposal Executive Summary Presentation
Optimize your project presentations with the 'Project Proposal Executive Summary' template. Crafted to clearly showcase your project’s most crucial elements, this template uses visuals and concise text to highlight objectives and deliverables effectively. Ideal for professionals preparing proposals in PowerPoint, Keynote, or Google Slides.


6 diapositivas
5G Network Infographic
5G, short for fifth-generation wireless technology, is the latest generation of mobile network technology designed to provide faster, more reliable, and higher capacity wireless communication. This infographic template is designed to educate viewers about the key features, benefits, and impact of 5G technology on various aspects of our lives. This template aims to provide a comprehensive and easy-to-understand overview of the transformative capabilities of 5G technology. It serves as a valuable resource for individuals, businesses, and organizations seeking to understand the potential impact and benefits of 5G on various aspects of our lives and the broader technological landscape.


6 diapositivas
Business People Partner Infographics
Our "Business People Partner" infographic template is a modern and dynamic tool designed for PowerPoint, Keynote, and Google Slides. This template is particularly useful for HR professionals, business consultants, and team leaders who are involved in fostering effective business partnerships. The template highlights essential elements such as organizational roles, partnership strategies, and communication channels. Its layout is thoughtfully designed to help users articulate the intricacies of business partnerships and the roles of various stakeholders in a clear and concise manner. This makes it an invaluable resource for presentations focusing on collaborative efforts and strategic alliances in the business world. Featuring a bright and inviting color scheme, the design of this template is both contemporary and engaging. It reflects the dynamic and collaborative nature of business partnerships, making your presentation not just informative but also visually appealing. Whether you're presenting to executives, partners, or team members, this template ensures your message is delivered with clarity and impact.


4 diapositivas
Sports Metrics and Training Goals Presentation
Track, analyze, and present athletic performance with the Sports Metrics and Training Goals template. Featuring bar charts and a sports court graphic, this design is ideal for visualizing statistics, strategies, and progress. Fully customizable in Canva, PowerPoint, and Google Slides to align with your team’s branding and performance objectives.


7 diapositivas
Fishbone Diagram Infographic Presentation Template
A Fishbone diagram, also called a cause-and-effect diagram, is a tool used to identify and analyze the potential causes of a particular problem or issue. It is named for its shape, which looks like a fish skeleton with the problem or effect as the head and the various causes as the bones. This template includes a variety of different fishbone diagrams, which are representations of fish skeletons that help show you the different causes of a problem. This template is easy to use and you can add your own information to make it look just how you want, and show how different causes are connected.


5 diapositivas
Country Highlight Asia Map Presentation
Showcase your regional insights with a clean and modern map that brings focus to key countries across Asia. Ideal for displaying market reach, growth metrics, or strategic locations, this visual layout makes data storytelling simple and effective. Fully compatible with PowerPoint, Keynote, and Google Slides for easy customization.


8 diapositivas
Organizational Maturity and Scaling Model Presentation
Visualize growth with the Organizational Maturity and Scaling Model Presentation. This slide design illustrates progress across four strategic phases using vertical bars and icons—ideal for showcasing business development, capability building, or team evolution. Clean, professional, and fully editable in PowerPoint, Keynote, Google Slides, and Canva.


20 diapositivas
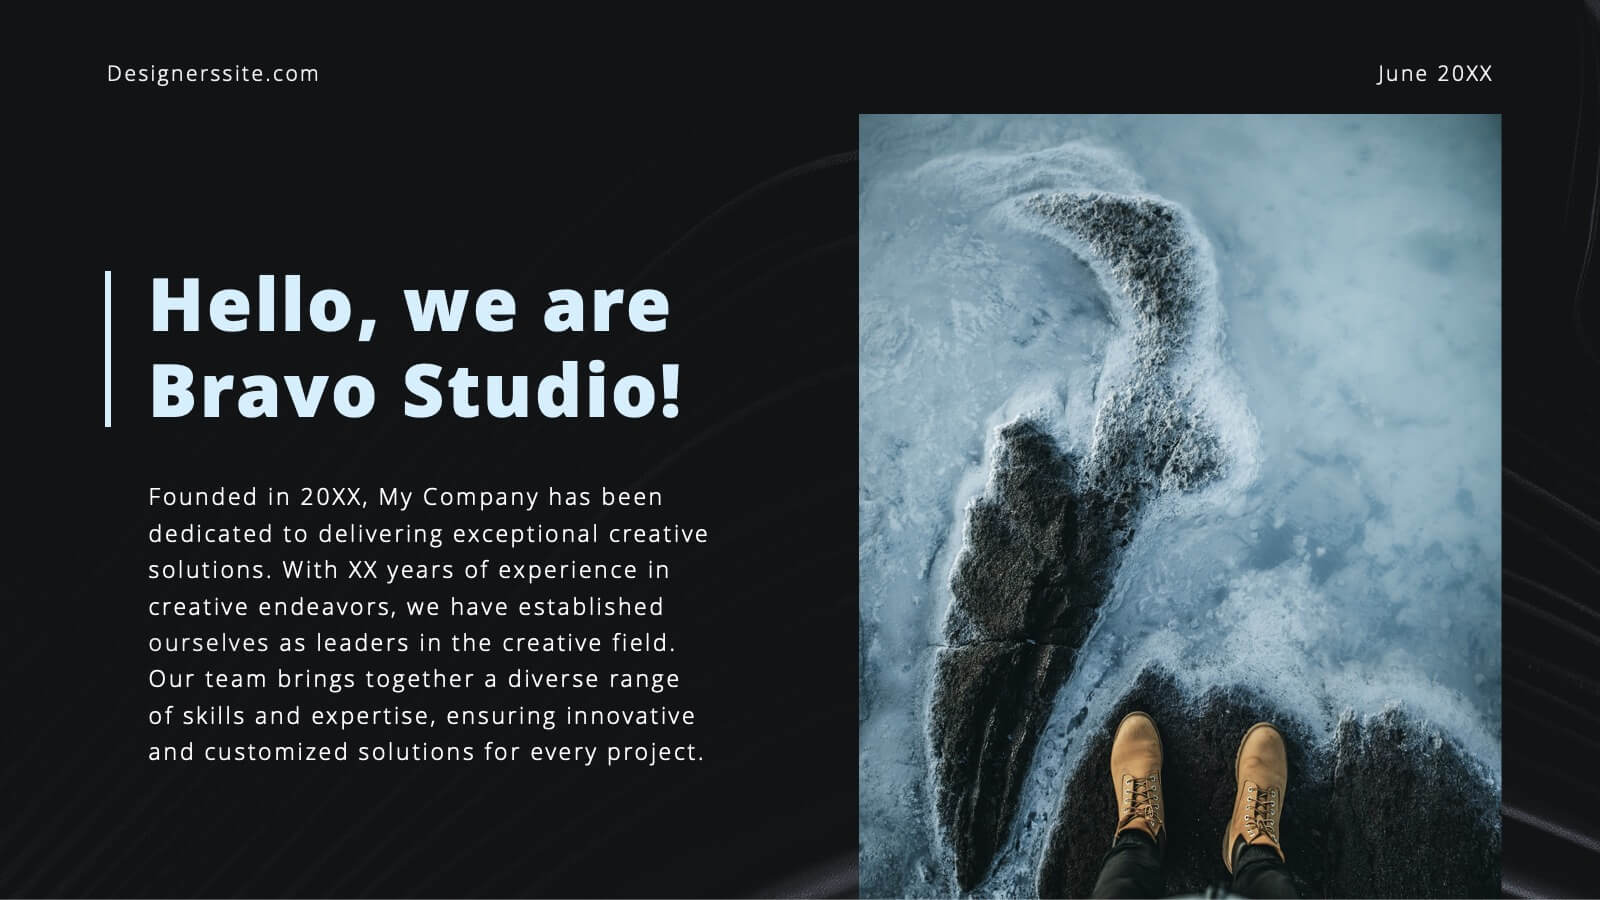
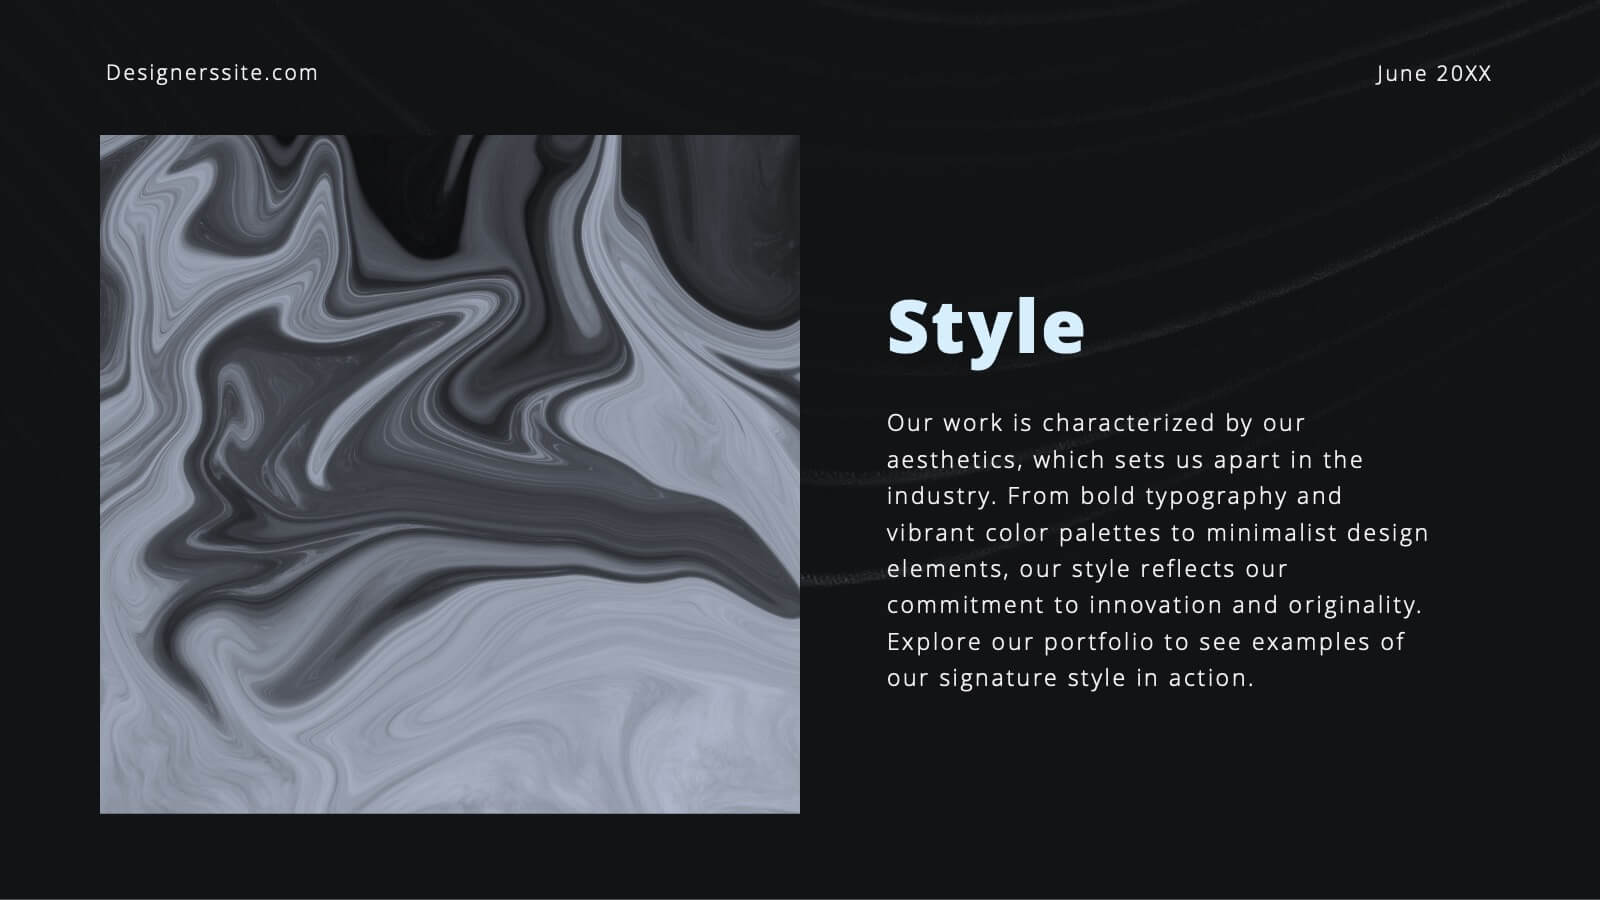
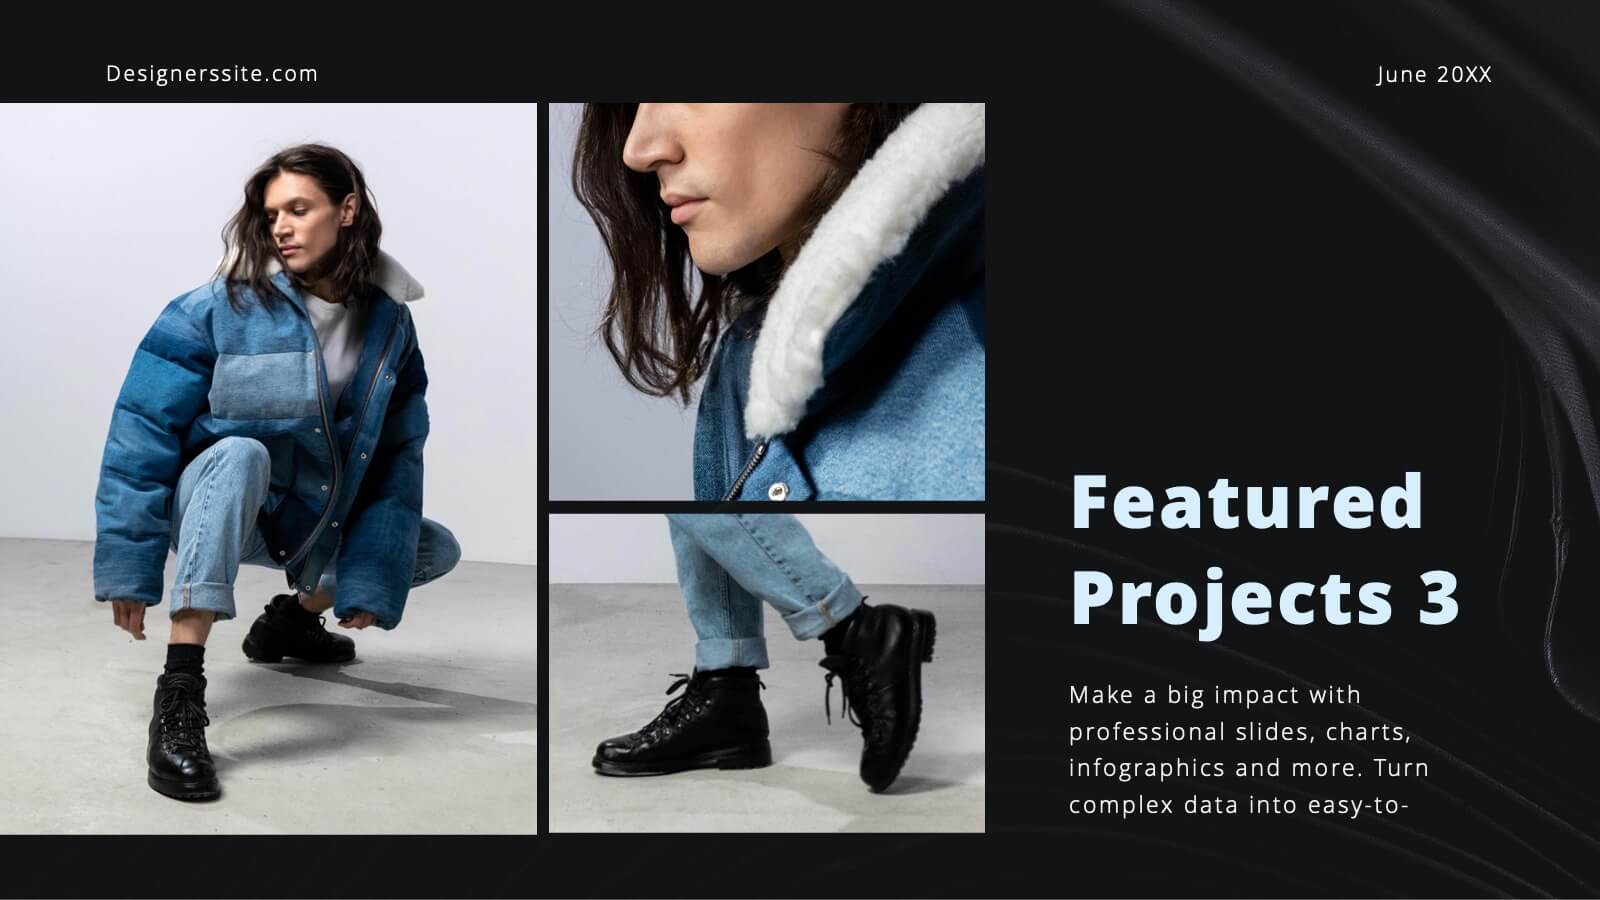
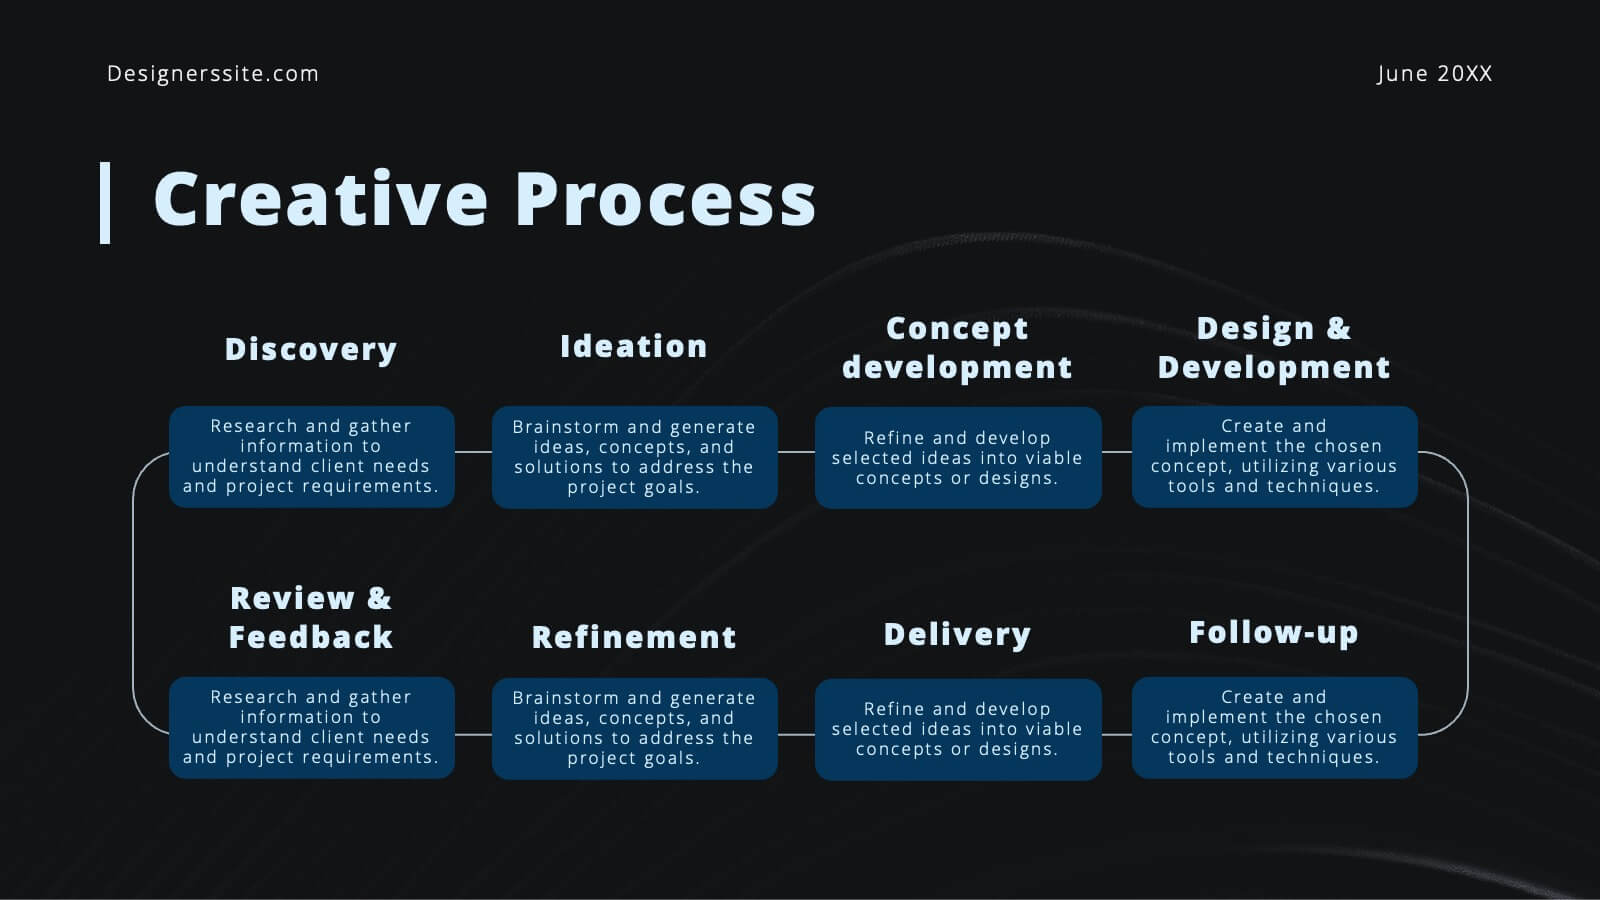
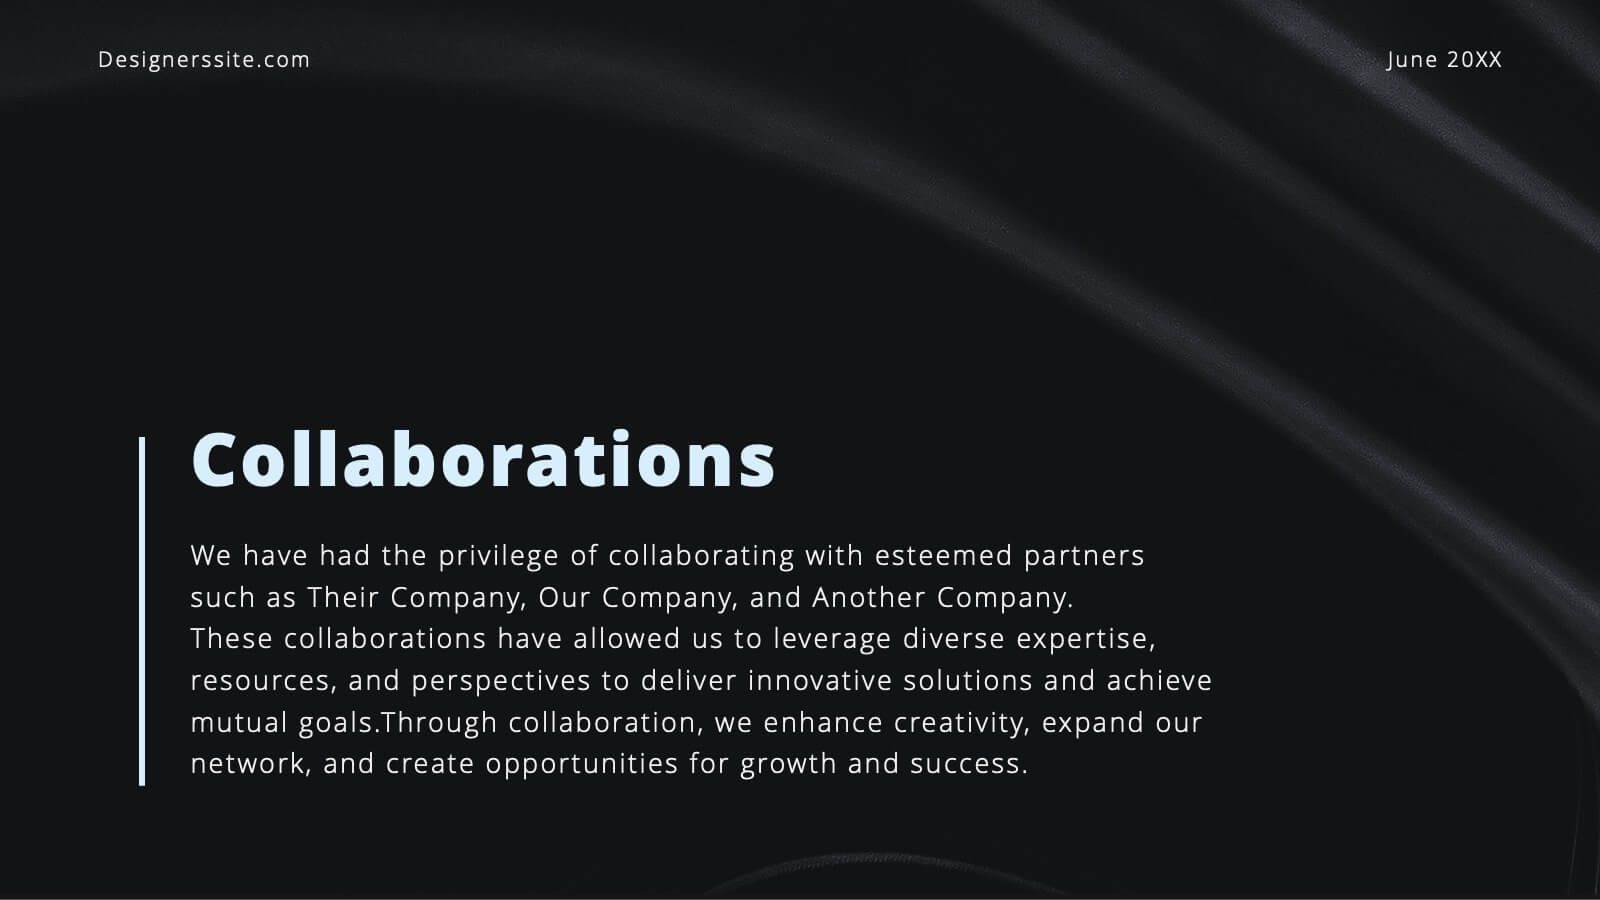
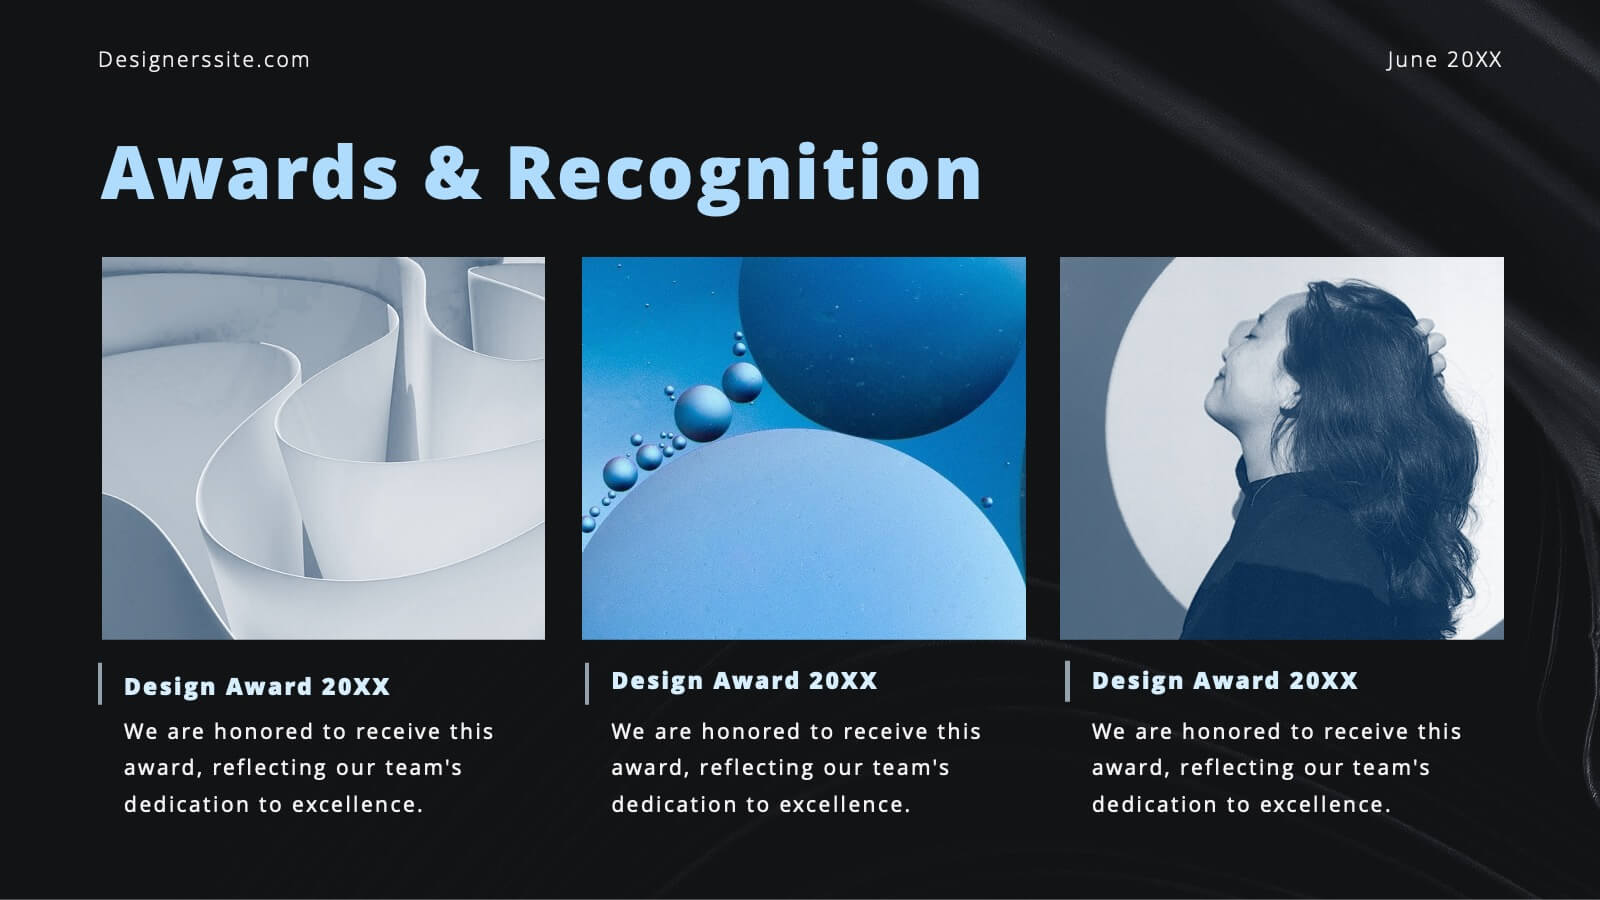
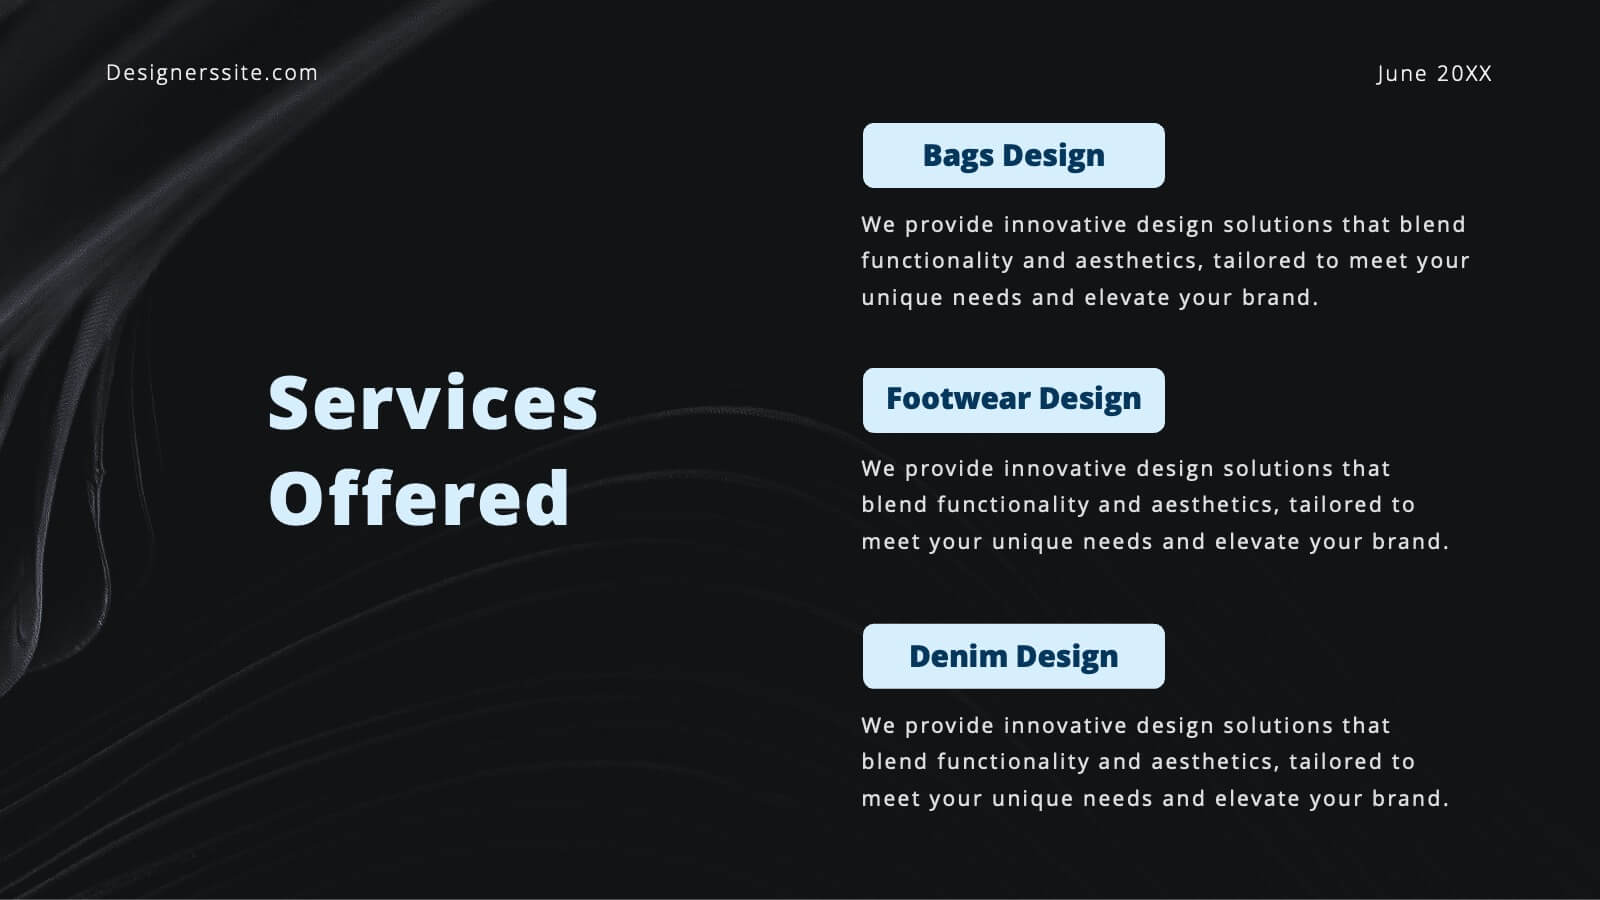
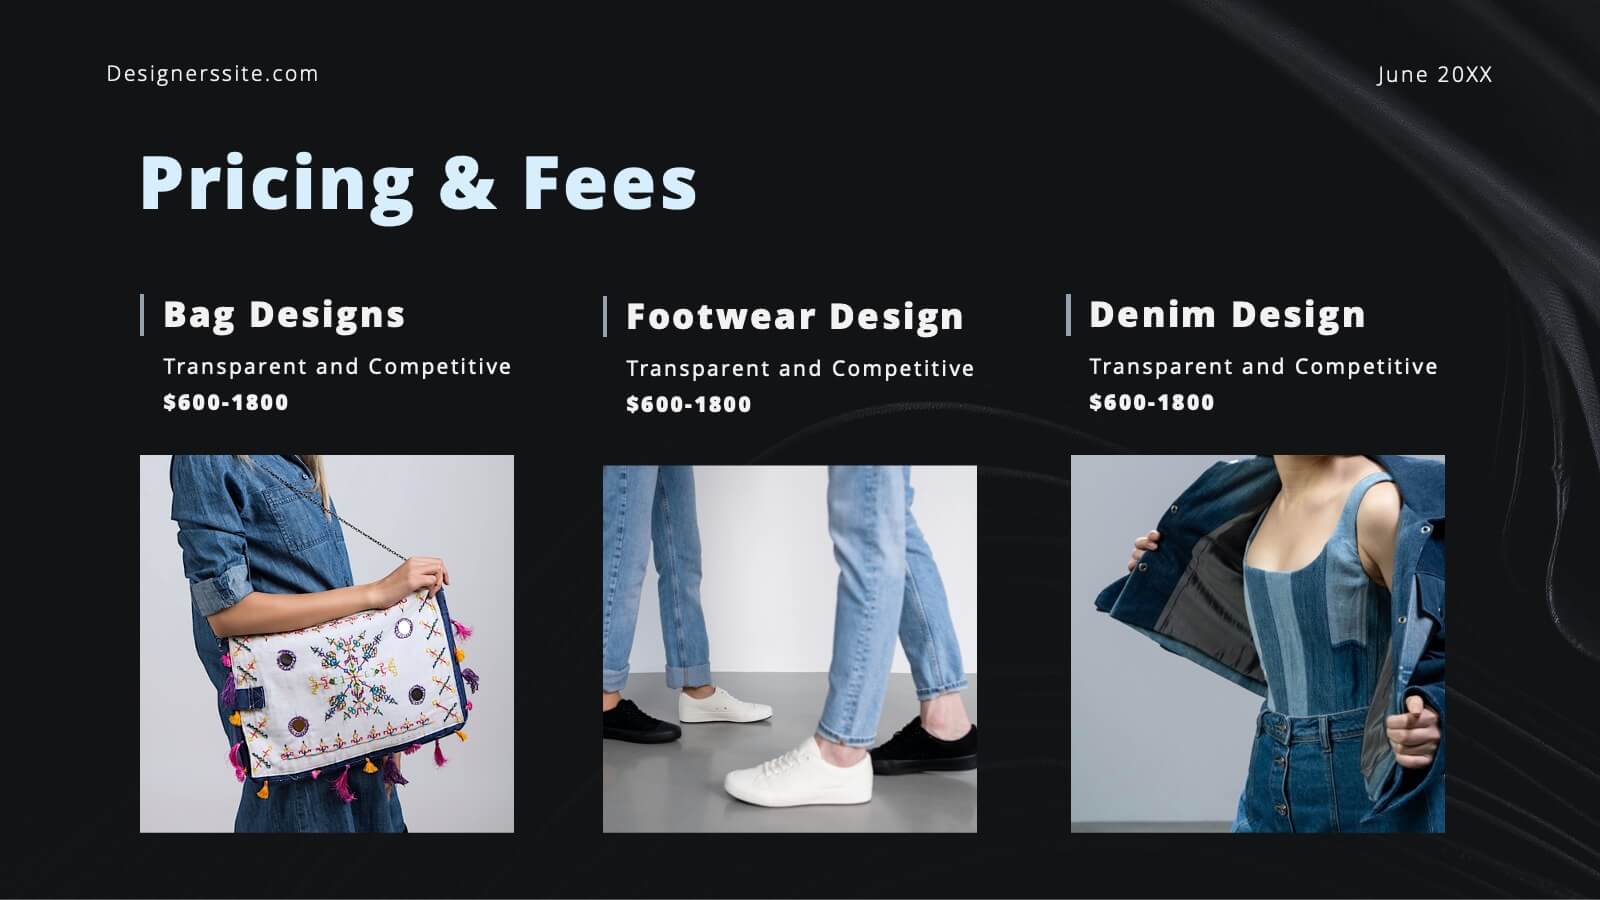
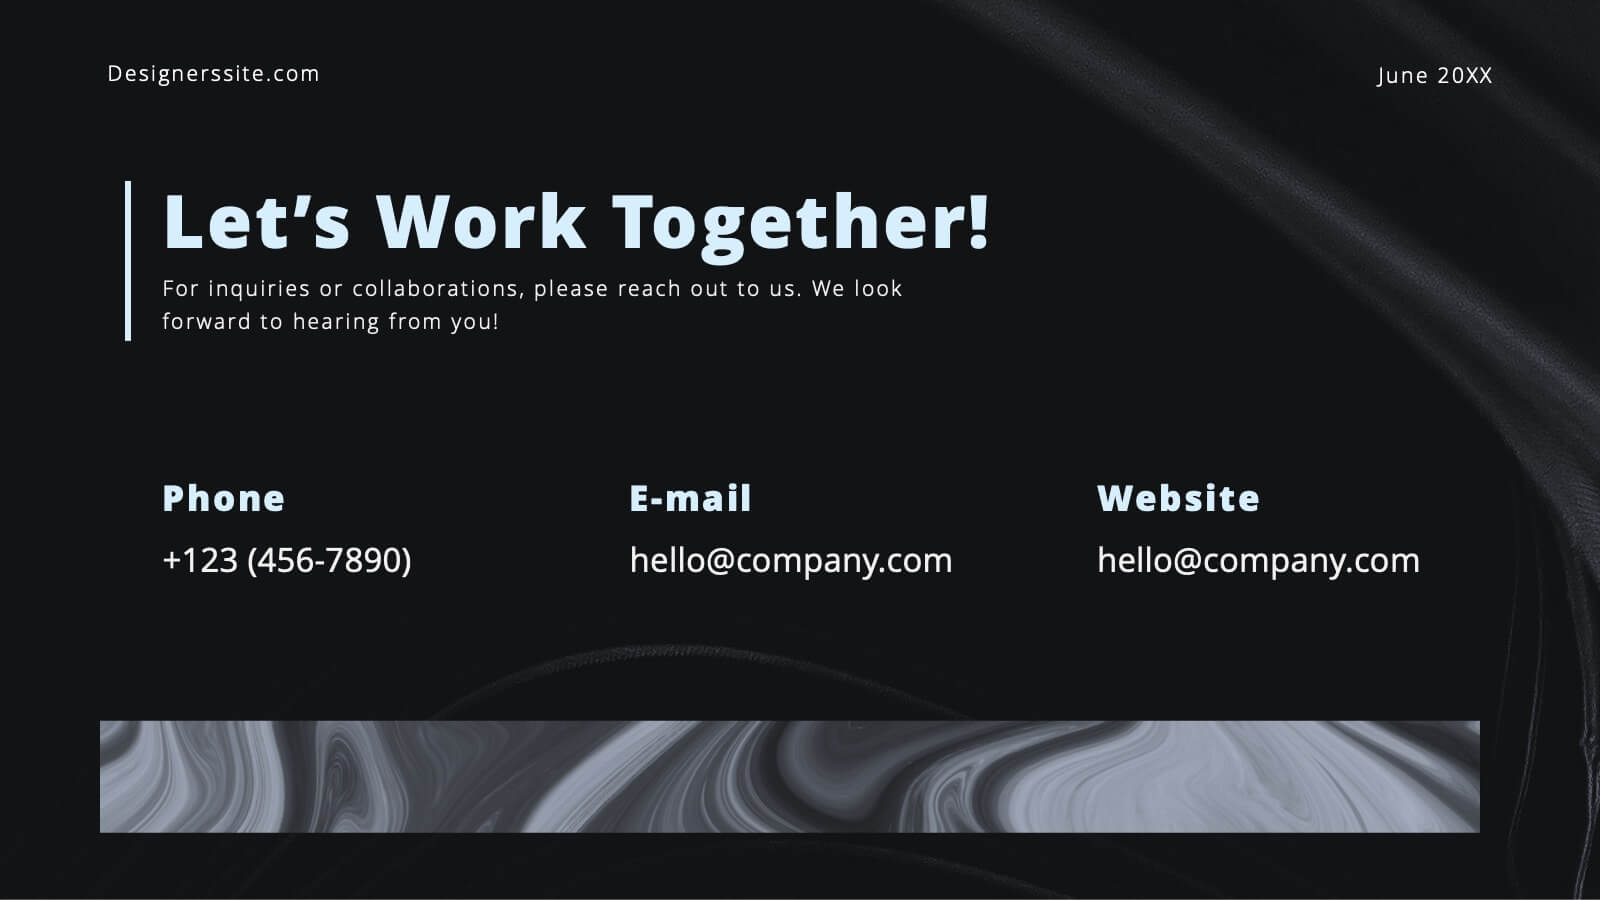
Bravo Creative Portfolio Presentation
Showcase your creative prowess with this sleek, modern portfolio presentation template. Perfect for highlighting featured projects, client testimonials, and your creative process, this template ensures your work shines. Its stylish design and professional layout make it ideal for impressing potential clients and collaborators. Compatible with PowerPoint, Keynote, and Google Slides, it's versatile for any platform.