


Características


¿Tienes alguna pregunta?
Recomendar


5 diapositivas
Editable Mind Mapping Presentation
Clarify complex thoughts with the Editable Mind Mapping Presentation. This sleek template features a central profile design with five branching points to visualize ideas, processes, or strategies. It's perfect for brainstorming sessions, team collaboration, or project planning. Fully customizable and compatible with PowerPoint, Keynote, and Google Slides.


12 diapositivas
Understanding Digital Currencies Presentation
Simplify the complexity of crypto ecosystems with the Understanding Digital Currencies presentation template. Designed around a wallet-style visual, this layout highlights key features of various cryptocurrencies using six labeled touchpoints. Perfect for introducing Bitcoin, Ethereum, altcoins, and digital wallets in educational, financial, or blockchain-related presentations. Ideal for crypto educators, fintech startups, and investment analysts. Compatible with PowerPoint, Keynote, and Google Slides.


5 diapositivas
Problem-Solving and Business Solutions
Simplify complex challenges with this dynamic problem-solving and business solutions slide. Designed with a clear, step-by-step layout, this template helps outline problems, strategies, solutions, and outcomes in a visually engaging way. Ideal for workshops, strategic planning sessions, consulting proposals, and team brainstorming. Fully editable and compatible with PowerPoint, Keynote, and Google Slides.


6 diapositivas
Project Proposal Goals Infographic
Maximize the impact of your project proposals with this professional collection of templates, designed to outline your project goals and strategies with precision. Each template facilitates clear communication of project objectives, timelines, and the desired outcomes, making them essential for project managers, consultants, and business analysts. These slides are crafted with a clean, corporate design that uses a harmonious blend of blue tones, engaging charts, and concise content layouts. This ensures that key points are easily digestible and effectively conveyed to stakeholders. The structured format of these templates is ideal for detailing the scope of work, expected milestones, and resource allocation, supporting a comprehensive overview of your project plan. Customize these templates to align with your organization's branding and project specifics, enhancing your presentation and strengthening the proposal's persuasive power. Whether for internal briefings or external pitches, these slides are tailored to help you present a coherent and compelling case for your projects.


14 diapositivas
Business Expense and Cost Control Presentation
Optimize your financial strategy with the Business Expense and Cost Control Presentation template. This slide helps visualize cost management, spending efficiency, and budgeting strategies with a clear, data-driven layout. Ideal for financial planners, business analysts, and executives aiming to streamline operational expenses. Fully customizable in PowerPoint, Keynote, and Google Slides.


21 diapositivas
Ironveil Annual Report Presentation
A professional annual report template for showcasing performance metrics, key highlights, financial summaries, and strategic initiatives. Includes sections for customer feedback, competitor insights, and future priorities. Fully customizable and ideal for business reviews. Compatible with PowerPoint, Keynote, and Google Slides for seamless presentation delivery.


26 diapositivas
Creative Cryptocurrency Investment Presentation
The growth of Cryptocurrency has been significant over the past few years. It is very important to do your own research, understand the risks involved, and only invest what you can afford to lose. This template is designed with a focus on cryptocurrencies and includes customizable photo layouts, charts, a gold coin pattern and unique cryptocurrency-themed icons and illustrations. You can use this template for any topic related to Cryptocurrency or Blockchain. Create your own presentation within minutes using Powerpoint, Keynote, or Google slides, it is fully editable to suit your needs.


6 diapositivas
Fishbone Diagram
A fishbone diagram, also known as a cause-and-effect diagram or an Ishikawa diagram, is a visual tool used to identify and analyze the potential causes of a problem or an effect. This infographic template is designed to help you explore and understand the root causes of an issue by visually mapping out various contributing factors. This cause-and-effect diagram, provides a structured approach to identify and categorize the various factors contributing to a specific outcome. This template is fully customizable and compatible with Powerpoint, Keynote, and Google Slides making it easy to input your information.


20 diapositivas
Starbound Sales Proposal Presentation
Close deals with confidence using this polished and professional sales proposal presentation! It covers everything from target market analysis and pricing strategies to sales objectives, performance metrics, and future opportunities, ensuring a complete pitch. Perfect for client meetings and business proposals, this template works seamlessly with PowerPoint, Keynote, and Google Slides.


7 diapositivas
Alphabet Infographic Presentation Template
Our Alphabet Infographic features a well-designed set of icons, letters and numbers. This template is perfect for PowerPoint presentations and will allow you to enhance your business/school design. Make your data sets easily readable, attractive and concise with this template. This Alphabet Infographic template is perfect for making your pitch stand out, with a bold and catchy design. It features a modern look that captures viewer's attention, but also contains plenty of details for them to explore. The colors are bright and vibrant, so you know the message won't be forgotten easily.


5 diapositivas
Regional Economic Growth in Asia Map Presentation
Explore economic landscapes with the "Regional Economic Growth in Asia Map" template, an essential tool for visualizing economic data across Asia. Designed for business strategists and policymakers, it offers detailed insights and regional analysis to support informed decision-making. Compatible with PowerPoint and Google Slides, this template is flexible for both academic and professional uses.


5 diapositivas
Business Investment in Africa Map Presentation
Explore promising markets with the "Business Investment in Africa Map" template, designed to provide a visual overview of investment opportunities across the continent. It features a map with marked regions, each linked to specific data points about business prospects. Ideal for investors or companies looking at market penetration or expansion within Africa, this layout helps in making data-driven decisions by providing a clear, concise visual representation of key information.


5 diapositivas
Operational Process Logic Map
Visualize how every function interconnects with the Operational Process Logic Map Presentation. This template uses a radial node structure to break down workflows, responsibilities, or systems into logical clusters, showing how different units or steps interact within an operational framework. Each node is color-coded and icon-marked for clarity, ideal for explaining process flows, department roles, or system dependencies. Fully editable in PowerPoint, Keynote, and Google Slides.


6 diapositivas
Expert Tables Of Content Infographics
The "Expert Tables of Content" infographic template is a sophisticated and structured tool, designed to enhance presentations in PowerPoint, Keynote, and Google Slides. This template is ideal for authors, researchers, and professionals who need to present detailed content or reports in a clear and accessible format. This template efficiently organizes complex information into an easy-to-navigate format, showcasing chapters, sections, and key topics. It's tailored to highlight the depth and breadth of your content, making it an essential tool for academic presentations, business reports, or any comprehensive document requiring a detailed table of contents. The "Expert Tables of Content" infographic template revolutionizes the way we present complex information, perfectly crafted for PowerPoint, Keynote, and Google Slides. This template is a game-changer for authors, educators, and professionals aiming to captivate their audience with a well-structured and accessible presentation of their rich content. Designed to turn any extensive material into an engaging journey, this template masterfully organizes chapters, sections, and pivotal topics. It's an invaluable asset for transforming detailed reports, comprehensive academic papers, or sprawling creative works into a visually appealing and easily navigable format. With a design that's as striking as it is functional, the template boasts a color scheme that balances professionalism with vibrancy. T....


7 diapositivas
Business Continuity Plan Infographic Presentation
A well-written business plan helps entrepreneurs focus on their next steps, anticipate challenges and overcome them before they occur. This template will guide you through the process of writing a professional, successful and effective business plan. This template design is highly visual, vibrant and engaging with neutral colors. It uses the best parts of a business plan, such as graphs and charts, to visualize your ideas. This business plan infographic is a sharp visual aid for investors, partners, board members and anyone else who needs to know more about what you do and how you plan to grow.


21 diapositivas
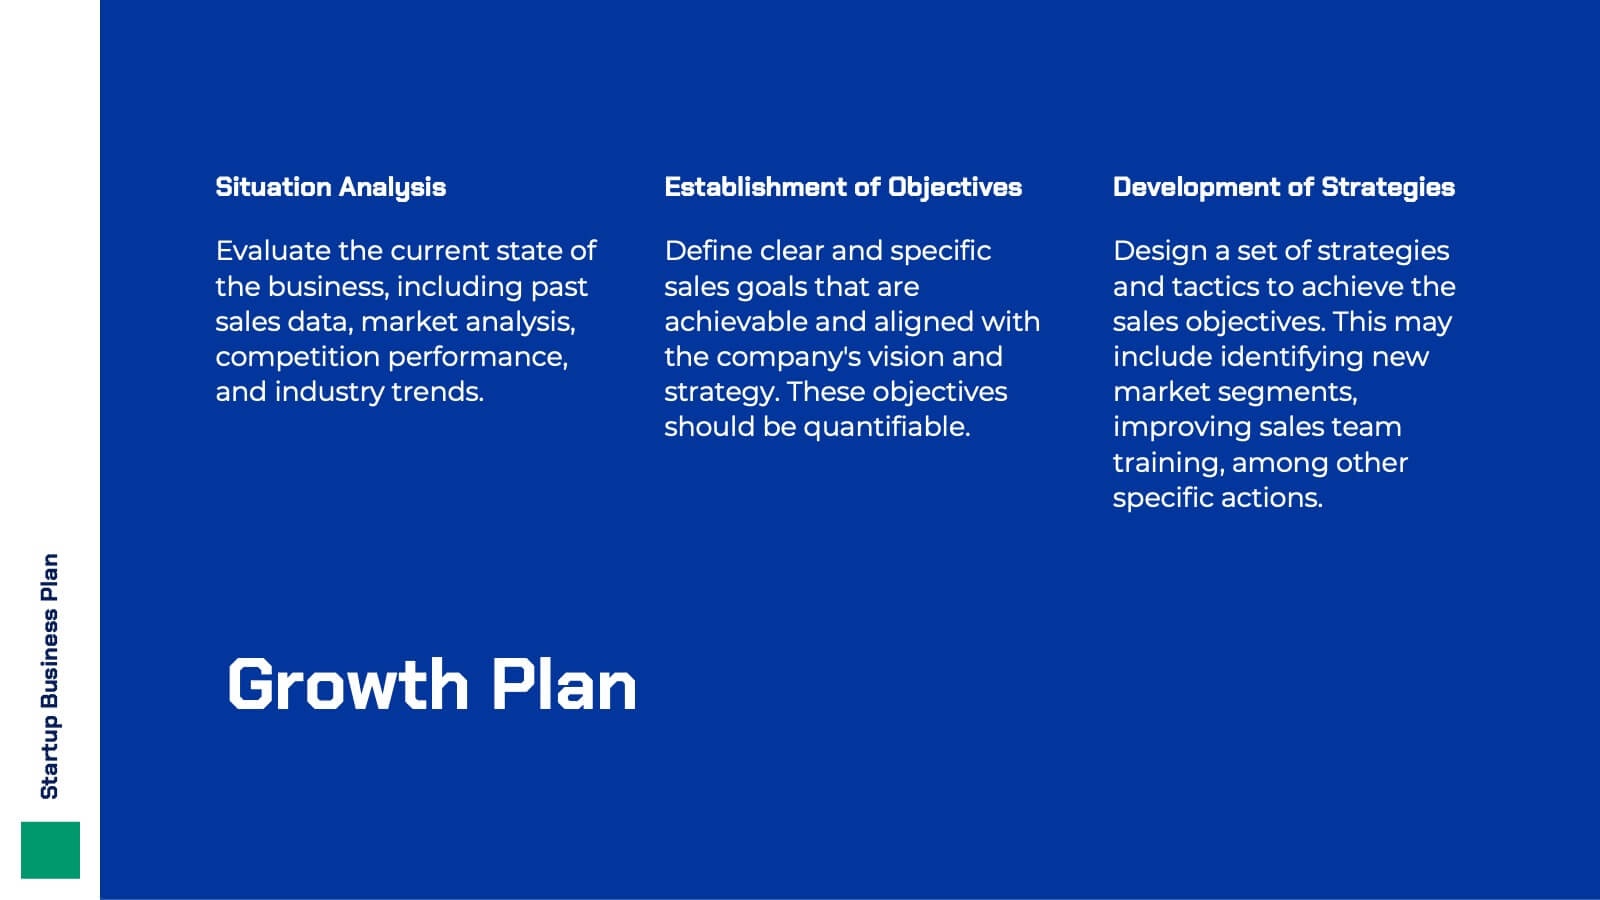
Hyperluma Startup Business Plan Presentation
Launch your vision with this startup business plan template, crafted to communicate your mission, market potential, and growth strategy with clarity and impact. Covering customer needs, unique value propositions, and financial projections, it’s ideal for entrepreneurs and founders. This template is compatible with PowerPoint, Keynote, and Google Slides, ready to fuel your startup’s journey.


5 diapositivas
Company Vision and Operations Overview Presentation
Present your company’s mission and structure with this Company Vision and Operations Overview Presentation. Designed around a central eye graphic, it highlights four strategic pillars or core values. Ideal for executive summaries, leadership decks, or internal briefings. Fully editable in Canva, PowerPoint, or Google Slides.