


Características


¿Tienes alguna pregunta?
Recomendar


26 diapositivas
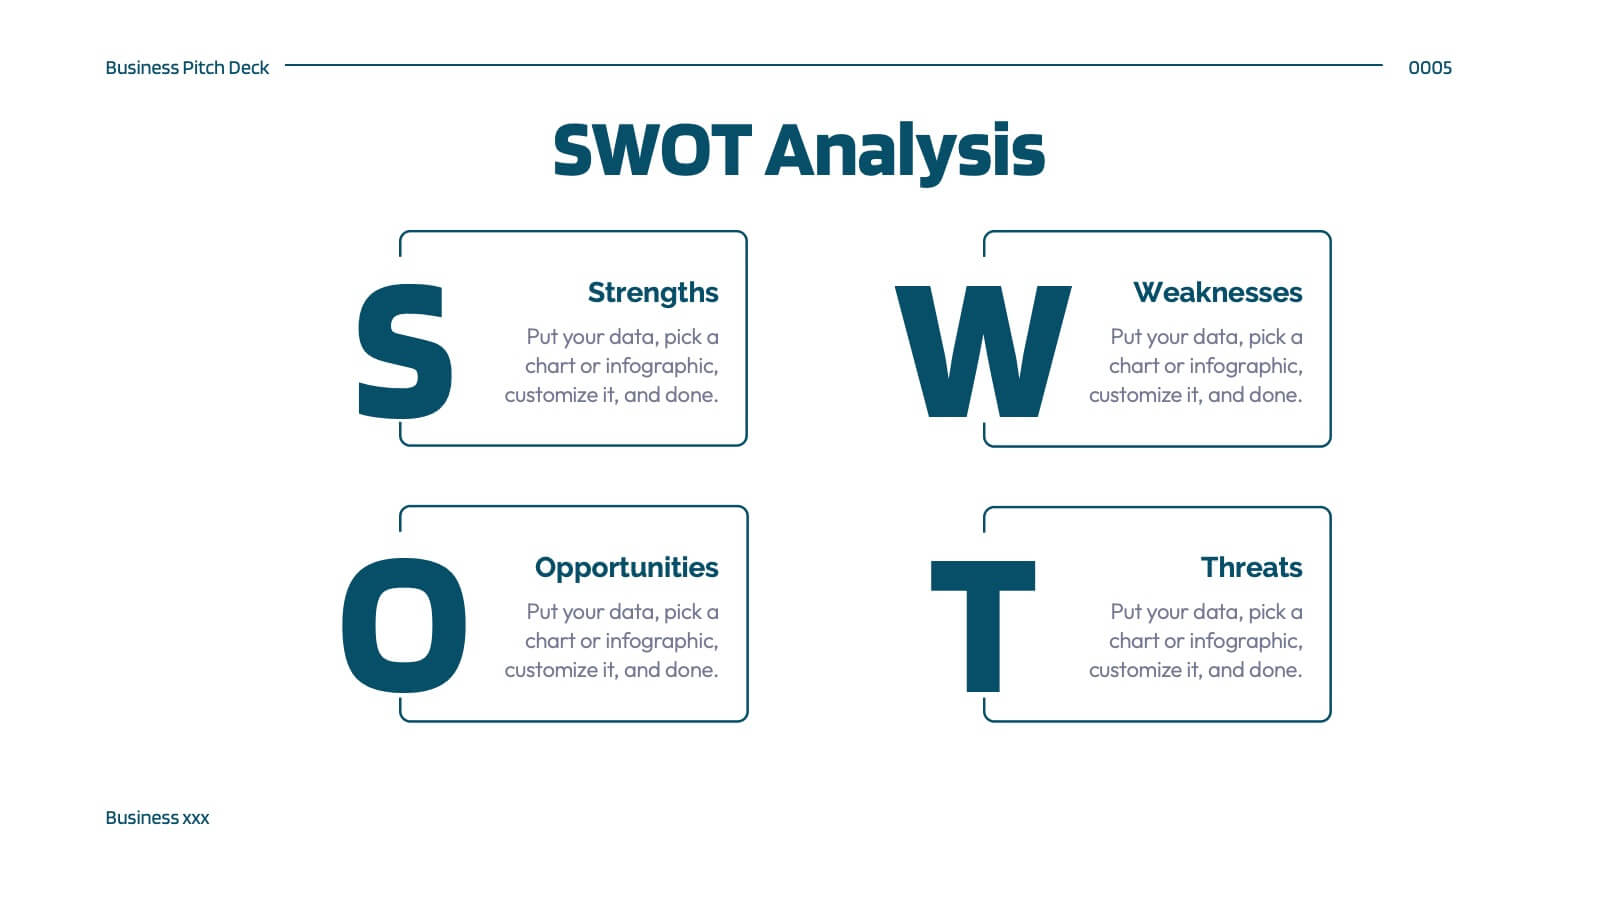
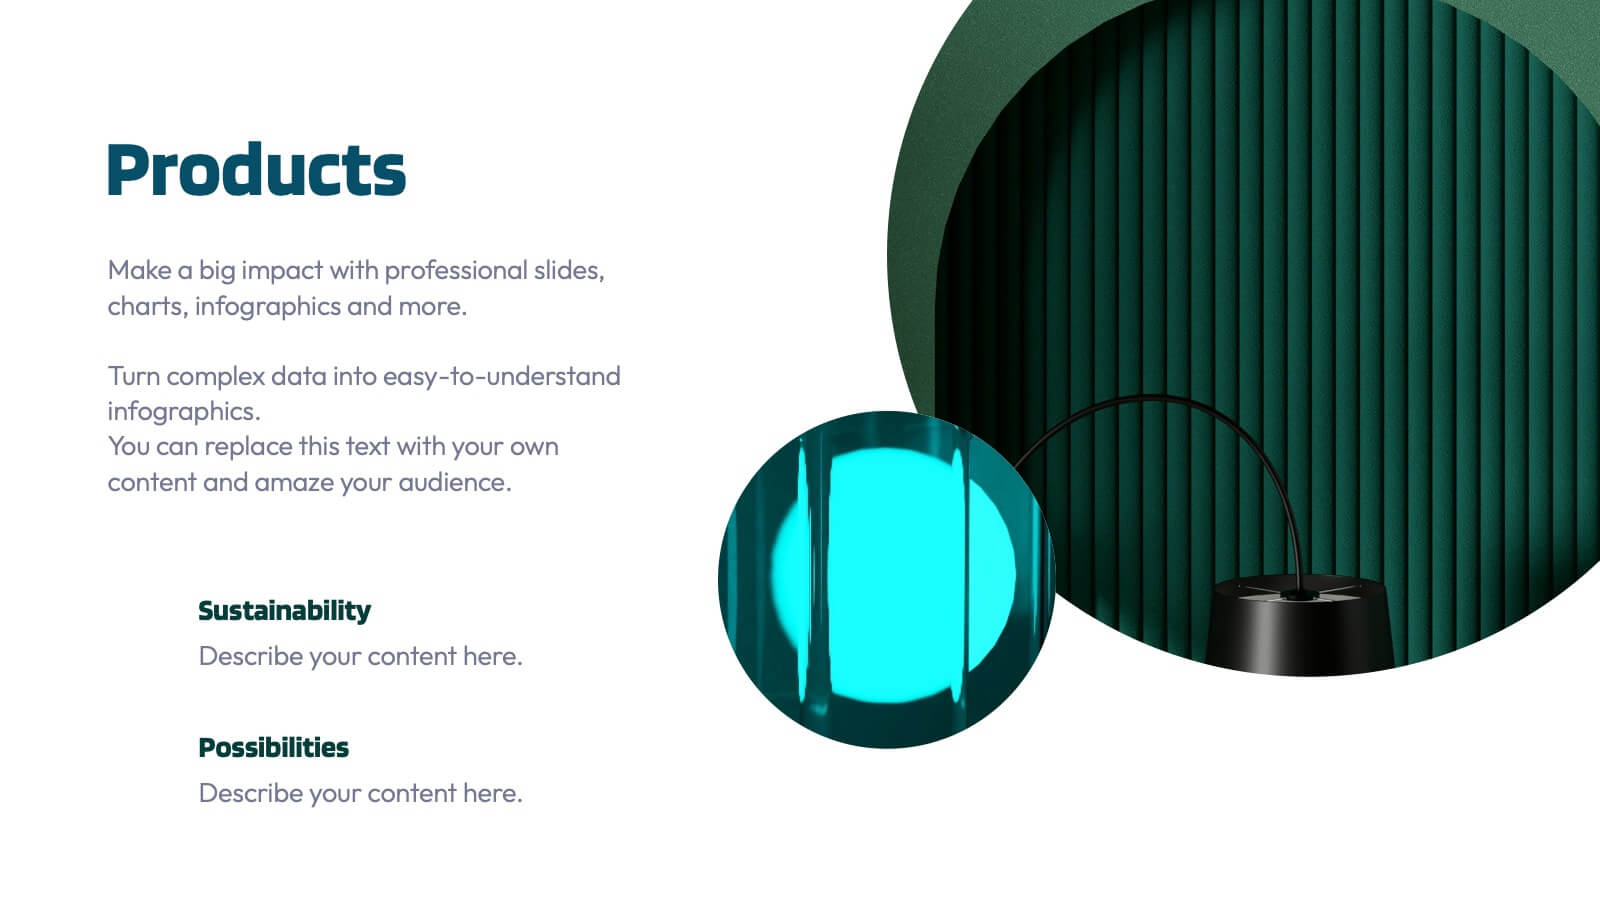
Competitive Market Analysis Professional Presentation
Navigate the complex landscape of market competition with this comprehensive presentation template, designed to illustrate competitive market analysis with clarity and impact. The sleek slides are steeped in a modern color palette, artfully combining cool purples and warm corals to capture attention and highlight key insights. Strategic use of infographics brings data to life, from SWOT analyses to market segmentation, ensuring the delivery of information is both visually appealing and easily digestible. It's a template that offers professionals and students alike the ability to dissect and present competitive dynamics with precision, whether it’s for a business plan, academic project, or strategic meeting. Each slide is a blueprint for understanding market forces, customer segmentation, and competitive positioning. This template is fully compatible with PowerPoint, Keynote, and Google Slides, making it a versatile and indispensable tool for those seeking to make informed decisions and craft compelling market narratives.


4 diapositivas
Employee and Team Performance Analysis
Visualize individual and team contributions with this clear and structured performance analysis template. Showcase key metrics, employee growth, and team achievements using easy-to-read layouts and progress indicators. Ideal for HR reports, performance reviews, and team evaluations. Fully editable in PowerPoint, Keynote, and Google Slides.


2 diapositivas
Jobs to Work From Home Illustrations
Empower your remote workforce with our jobs to work from home illustrations pack. These are designed to ignite the spark of remote work possibilities and bring a burst of energy to your presentations! Fully compatible with PowerPoint, Google Slides, and Keynote, they're easy to add to any presentation. Step into the world of remote work with these dynamic illustrations that capture the essence of modern work trends. Download the jobs to work from home illustrations today!


6 diapositivas
Customer Journey Map Infographic
A customer journey map is a visual representation of the steps and touchpoints that a customer goes through when interacting with a product, service, or brand. This infographic template is designed to illustrate the customer journey and enhance understanding of the customer's experience with a product or service. It offers a comprehensive visualization of the various touchpoints and emotions experienced by customers throughout their interaction. This template illustrates the entire end-to-end experience from the customer's perspective. Each stage is visually represented with icons and brief descriptions to provide a clear understanding of the customer's progression.


4 diapositivas
Sales Conversion with AIDA Stages Presentation
This modern presentation breaks down the AIDA model—Attention, Interest, Desire, and Action—using clean 3D cube visuals. Perfect for sales teams and marketers aiming to explain conversion funnels clearly. Fully customizable in Canva, making it easy to adapt to any brand or campaign strategy. Ideal for pitch decks and workshops.


5 diapositivas
Public Health and Wellness Strategy Presentation
Present a comprehensive Public Health and Wellness Strategy with this visually engaging template. Designed with a segmented circular diagram, it effectively outlines key areas such as healthcare infrastructure, mental well-being, preventive care, and emergency response. Ideal for health professionals, policy-makers, and organizations aiming to communicate community health initiatives and strategies. Fully customizable and compatible with PowerPoint, Keynote, and Google Slides.


5 diapositivas
Pricing Structure and Cost Allocation Presentation
Show stakeholders how every dollar works with this colorful arc-style financial slide. Explain product tiers, service fees, or project budgets in clear segments that highlight what matters most. Ideal for finance updates, sales decks, or board reviews, and fully compatible with PowerPoint, Keynote, and Google Slides for seamless team collaboration.


8 diapositivas
3D Infographic Design Presentation
Make your data pop—literally—with a stacked design that brings depth and clarity to your message. This 3D infographic template helps break down layered concepts, step-by-step processes, or hierarchical data in a visually striking way. It’s fully customizable and compatible with PowerPoint, Keynote, and Google Slides for easy presentation building.


5 diapositivas
Corporate Teamwork Presentation
The "Corporate Teamwork" presentation template visually captures the interconnectivity of team roles and tasks. Each slide features a circular flow diagram with icons representing different aspects of business teamwork. The dynamic arrangement of the icons around the central circle helps illustrate the cyclical nature of team processes and collaboration. This template allows for customization with text and color coding, making it easy to adapt to specific corporate environments or team structures. It's a great tool for presentations aimed at enhancing teamwork strategies or demonstrating the flow of tasks within team settings.


22 diapositivas
Hellenic Small Business Pitch Deck Presentation
Unleash the spirit of entrepreneurship with this captivating Hellenic-themed presentation! Designed specifically for small business pitches, this template allows you to showcase your business concept, market analysis, and financial plans with elegance and clarity. Its vibrant visuals will engage your audience and leave a lasting impression. Compatible with PowerPoint, Keynote, and Google Slides.


5 diapositivas
Crypto Investment Trends and Insights Presentation
Stay ahead of the digital asset curve with the Crypto Investment Trends and Insights presentation template. This slide features a visually compelling mining cart illustration filled with cryptocurrency symbols, perfect for presenting market data, blockchain innovations, or digital asset strategies. Highlight three core insights using customizable text areas and icons. Ideal for crypto analysts, fintech professionals, and investment briefings. Fully editable in PowerPoint, Keynote, and Google Slides.


6 diapositivas
Market Challenges and Resilience Strategy Presentation
Tackle volatility with clarity using the Market Challenges and Resilience Strategy presentation. This slide features a modern smartphone graphic surrounded by six key strategy zones, each with its own icon and text area—ideal for outlining market pressures, competitive moves, or adaptive responses. Use it to communicate resilience frameworks, digital transformation steps, or scenario planning. Fully customizable in PowerPoint, Keynote, and Google Slides.


6 diapositivas
Market Differentiation with Blue Ocean Strategy
Position your brand uniquely with this Market Differentiation slide based on Blue Ocean Strategy principles. Featuring a clean, strategic layout with a blend of visuals and text, this template is ideal for competitive analysis, innovation roadmaps, and strategic marketing plans. Fully customizable in PowerPoint, Keynote, and Google Slides.


27 diapositivas
Dusk Rebranding Project Plan Presentation
Revolutionize your brand identity with this vibrant rebranding presentation template! Perfect for showcasing your logo, color palette, and market analysis, it includes slides for brand strategy, competitive landscape, and performance metrics. Engage your audience with stunning visuals and comprehensive content. Compatible with PowerPoint, Keynote, and Google Slides for seamless presentations on any platform.


5 diapositivas
Agriculture in The United States Infographics
Agriculture has been a crucial sector in the United States since its founding, with a rich history of innovation and productivity. These Infographics are visual representation of the agricultural industry in the US, covering statistics, trends, and insights about the sector. Use these to include information about the top crops grown in the country as well as the states with the highest agricultural output. The design incorporates nature-inspired icons and a customizable color palette that reflects the natural elements associated with agriculture such as green and brown hues. The vertical layout also allows for easy scrolling and viewing on digital platforms.


22 diapositivas
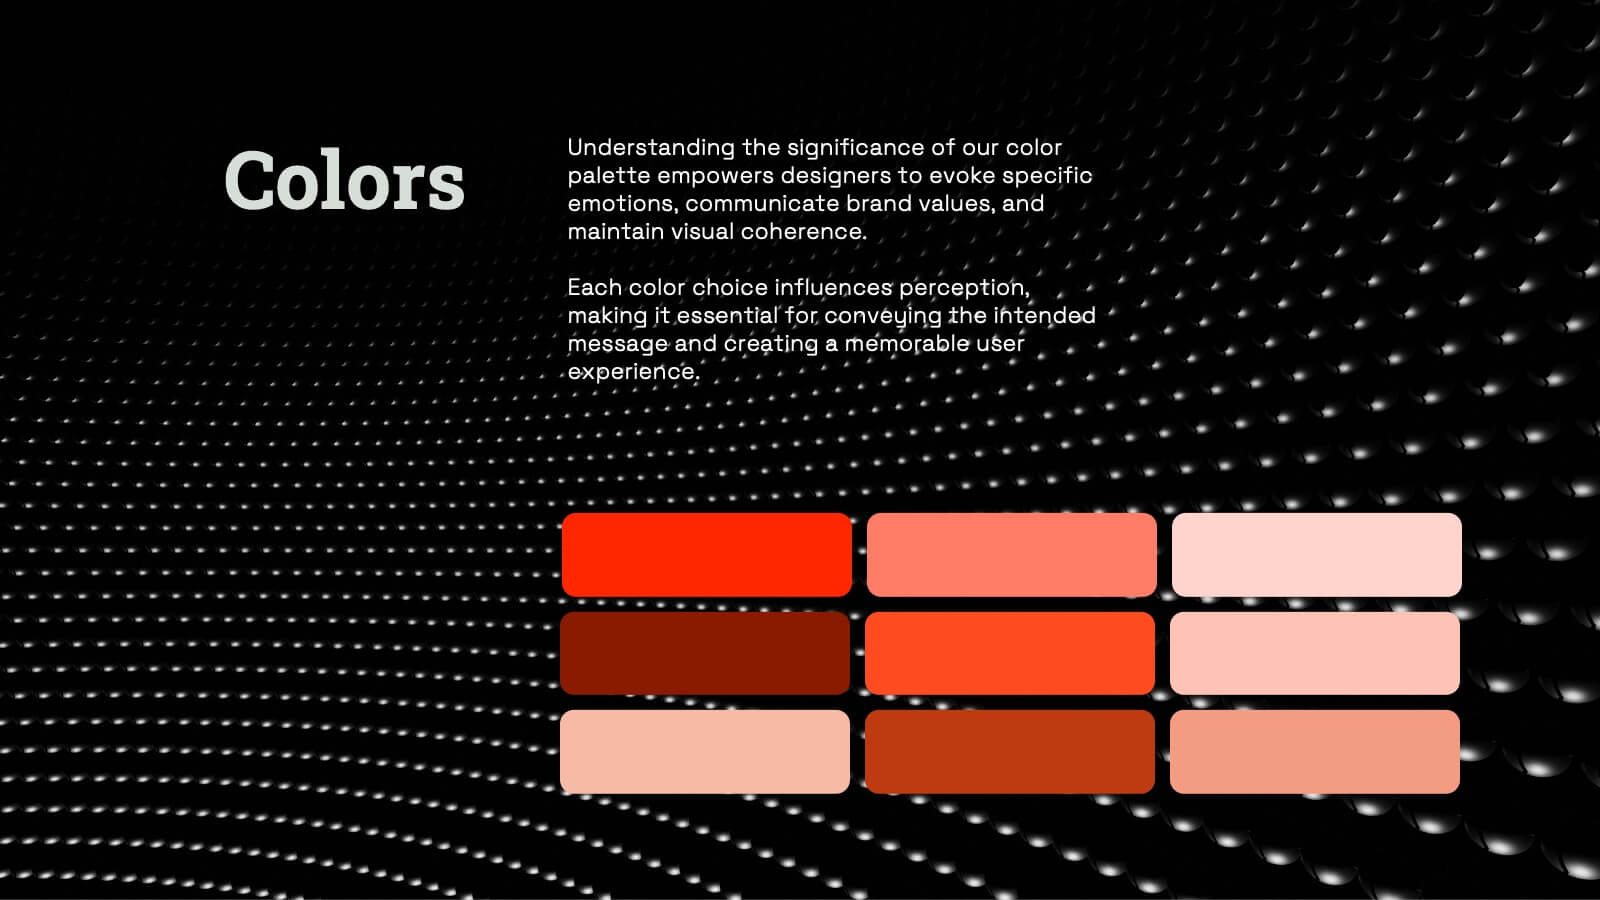
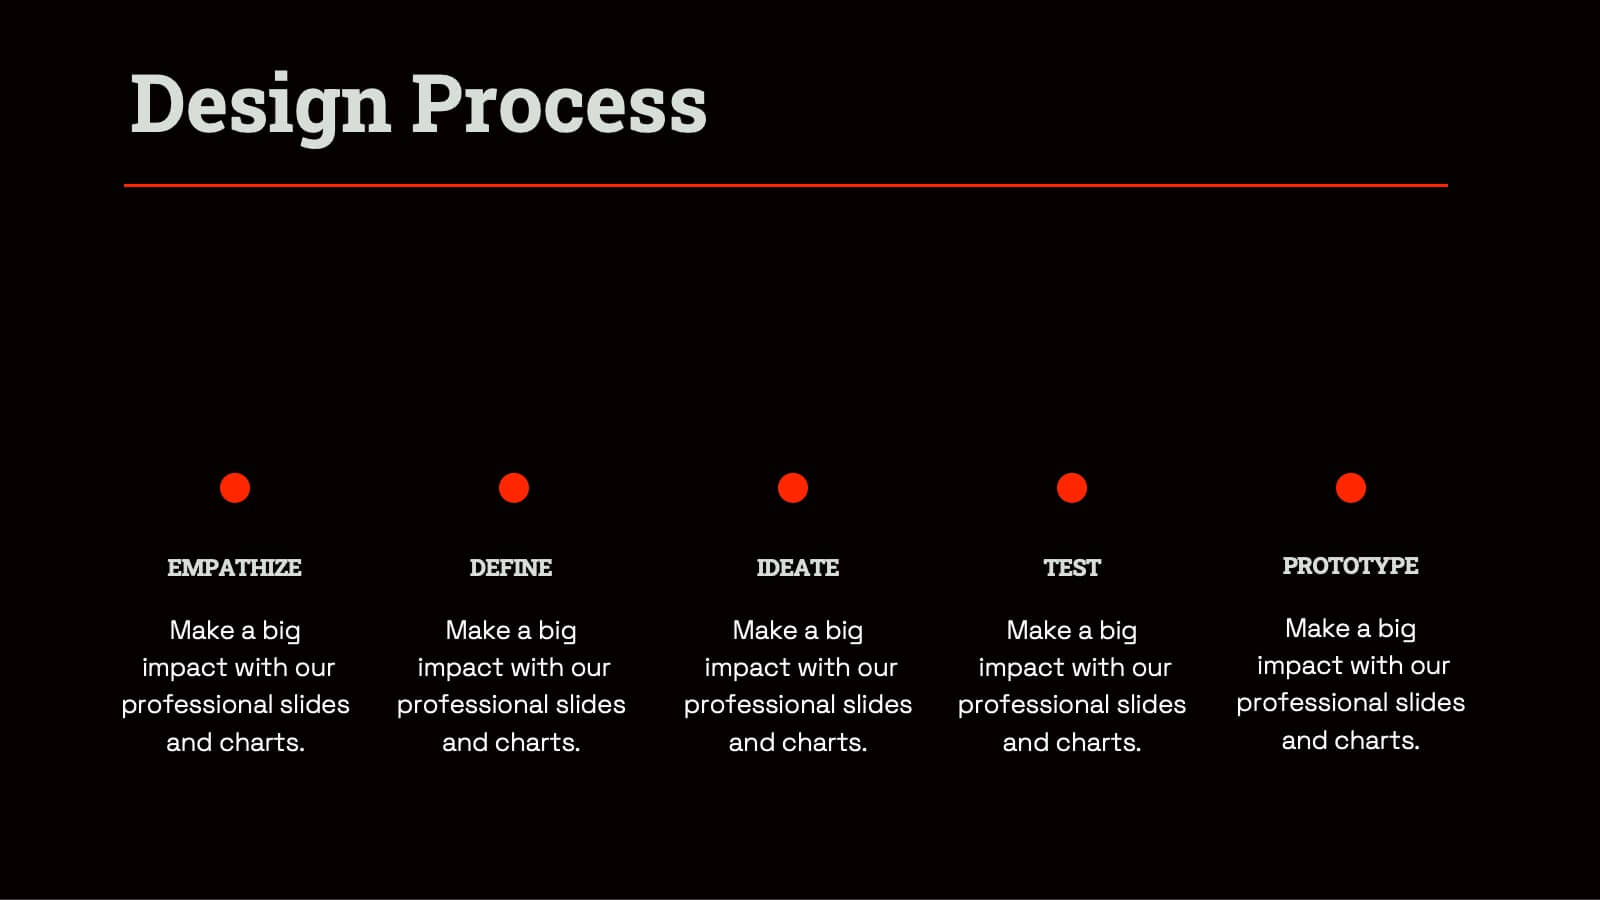
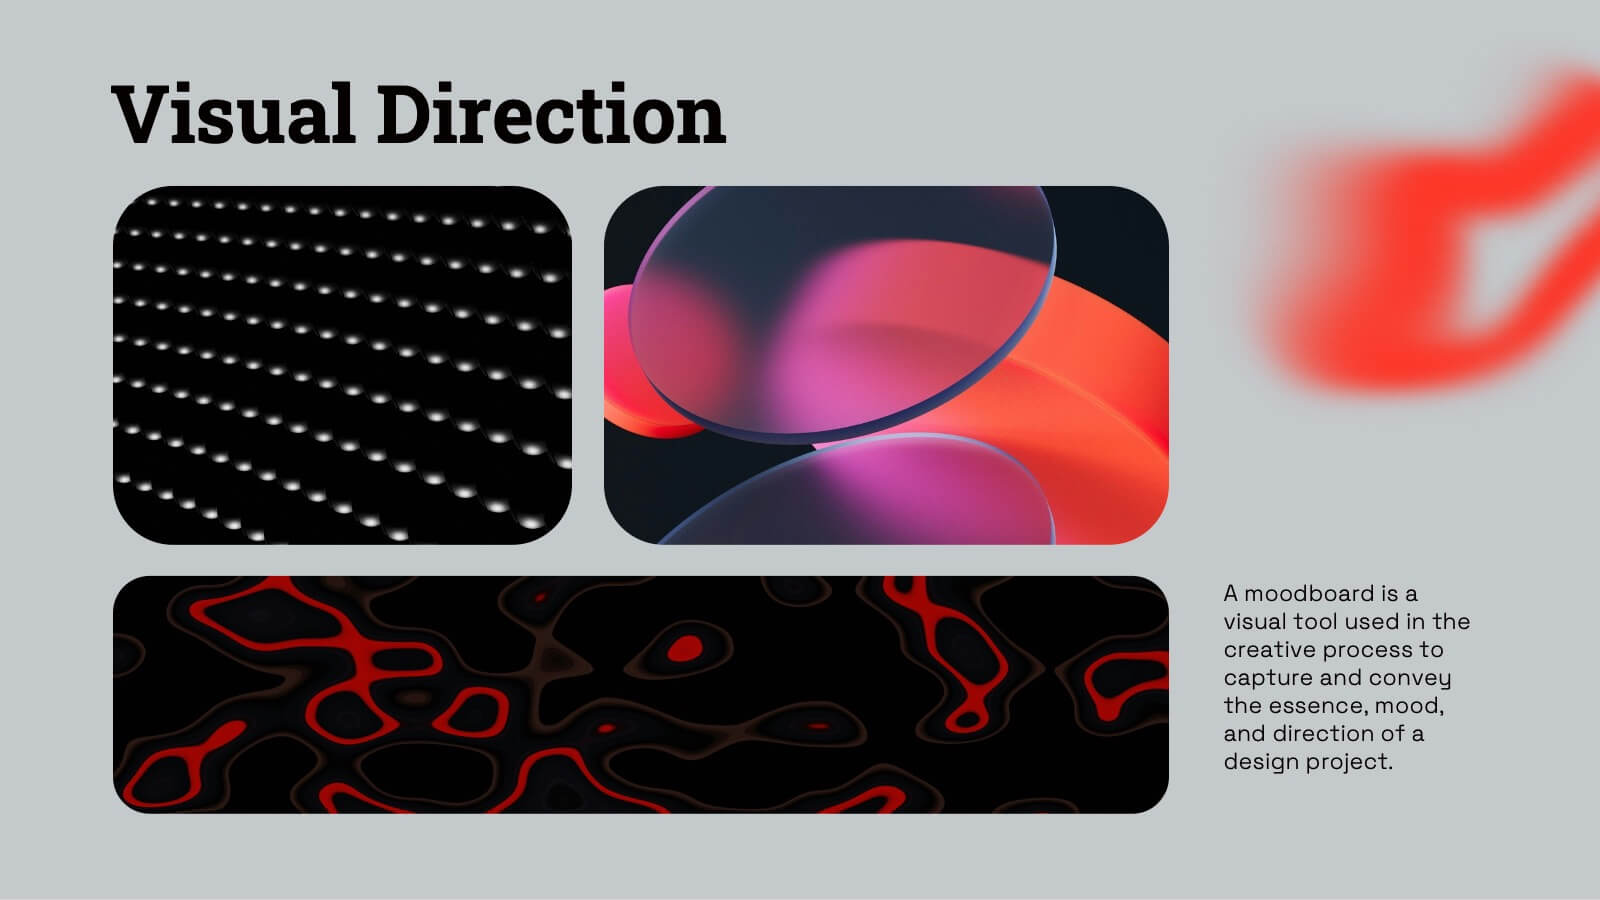
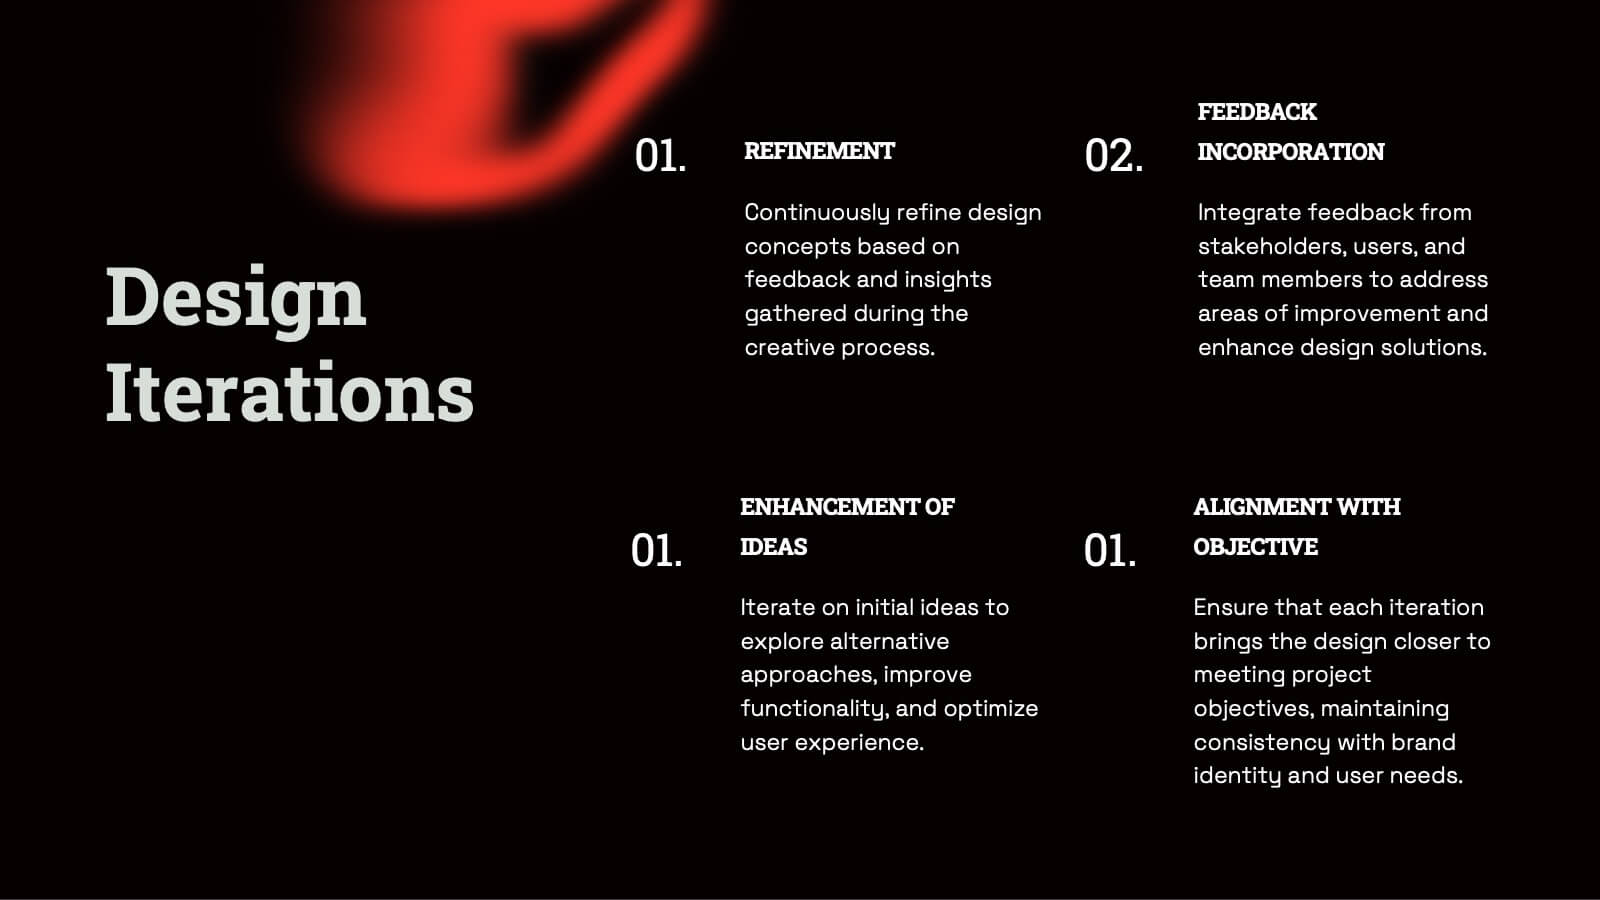
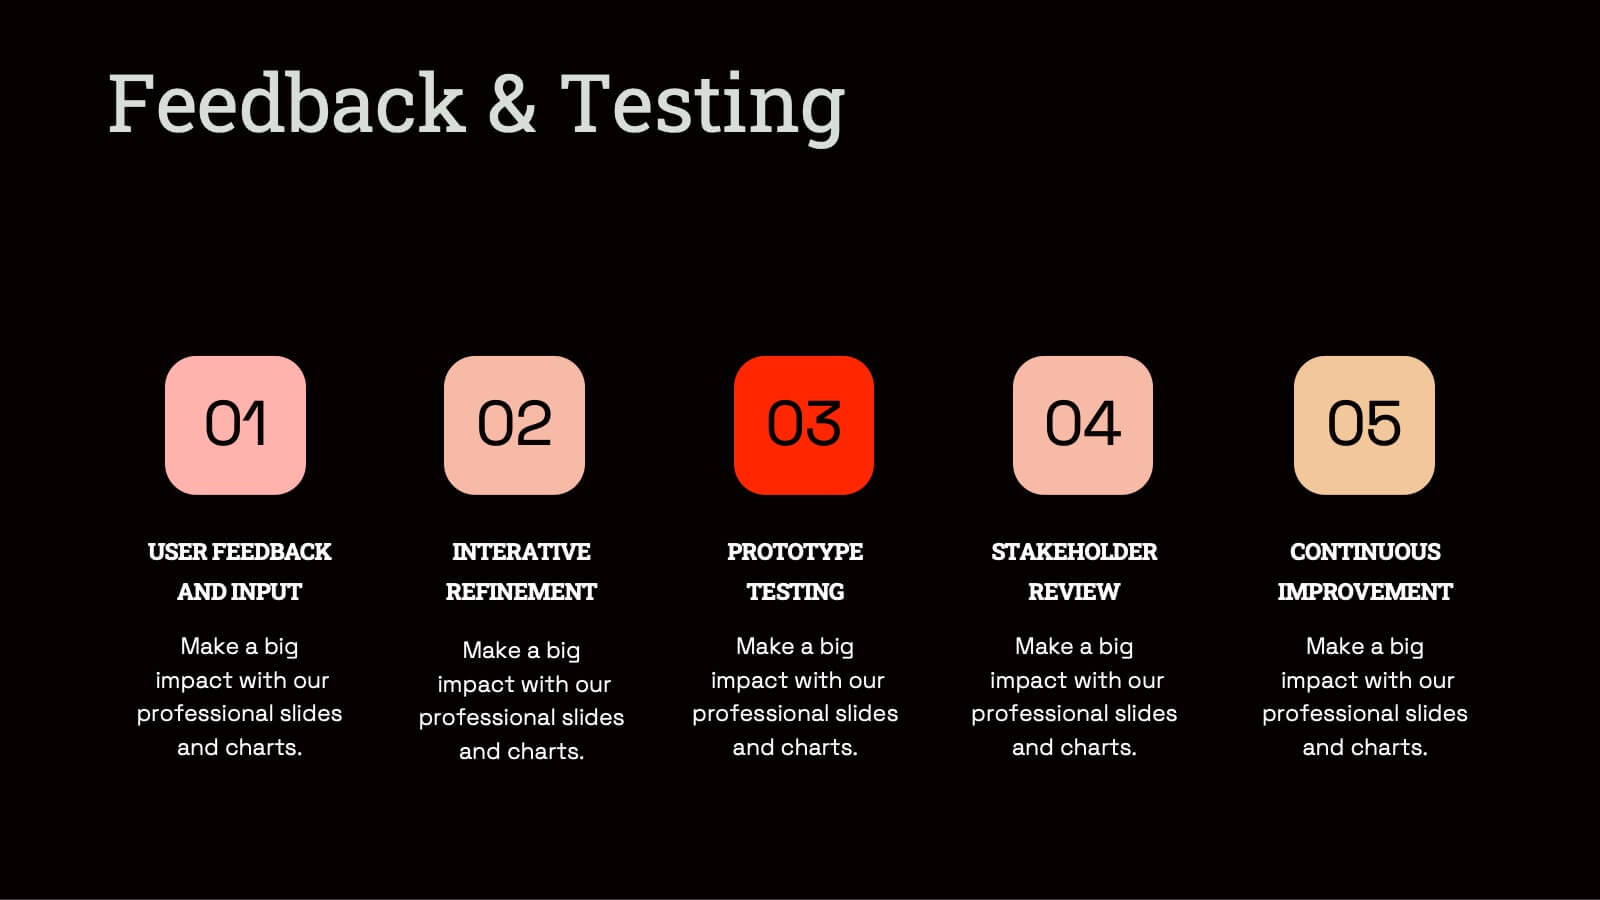
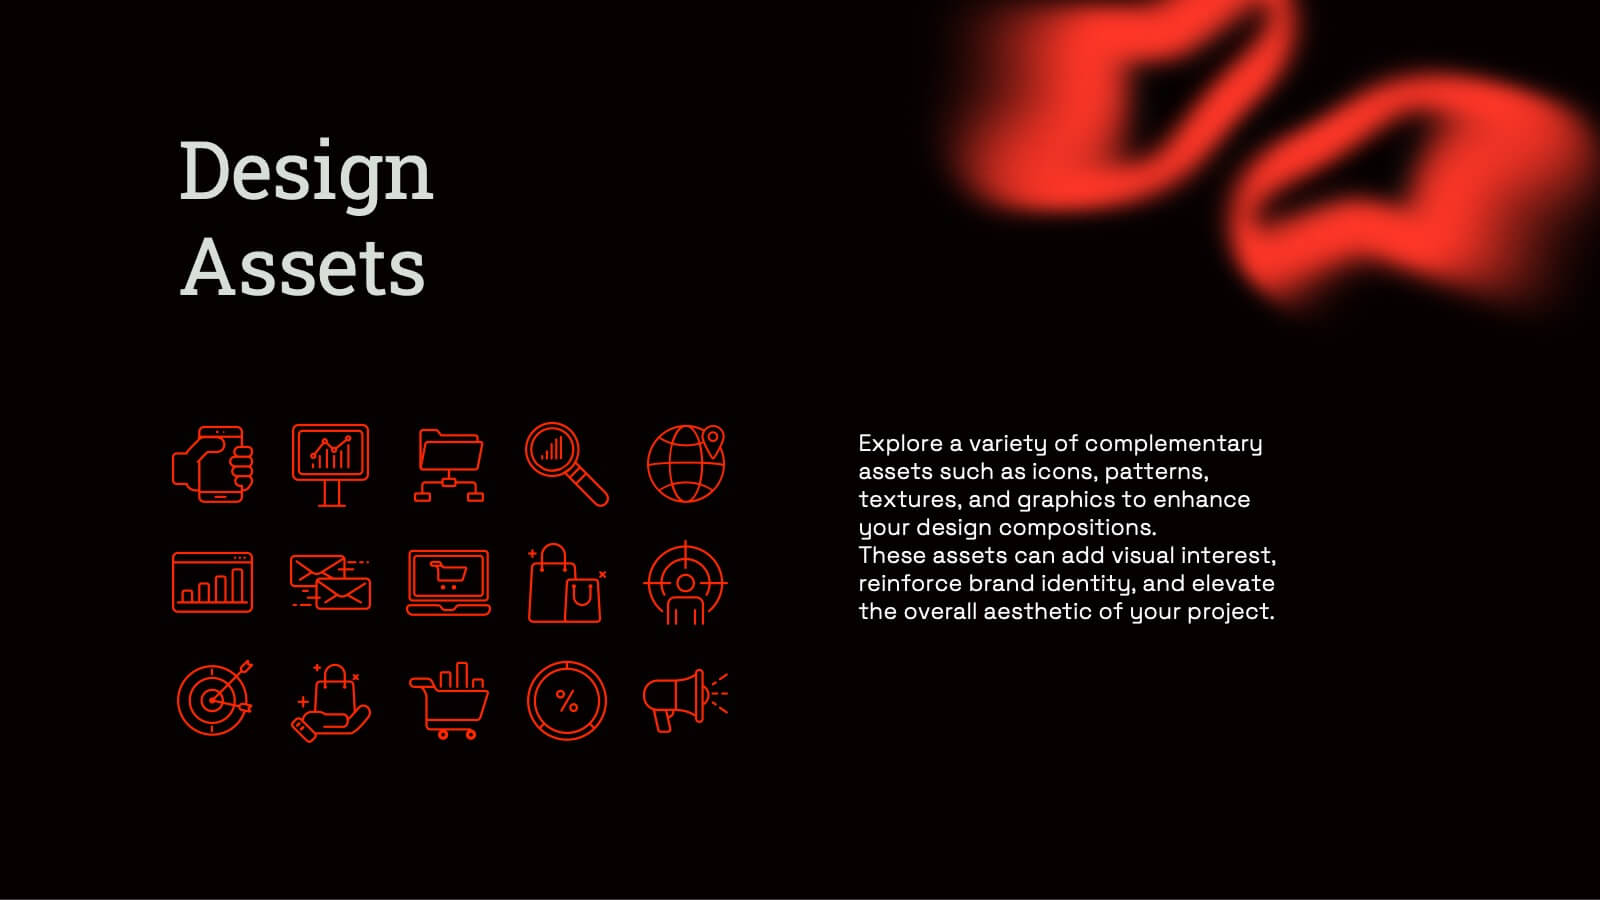
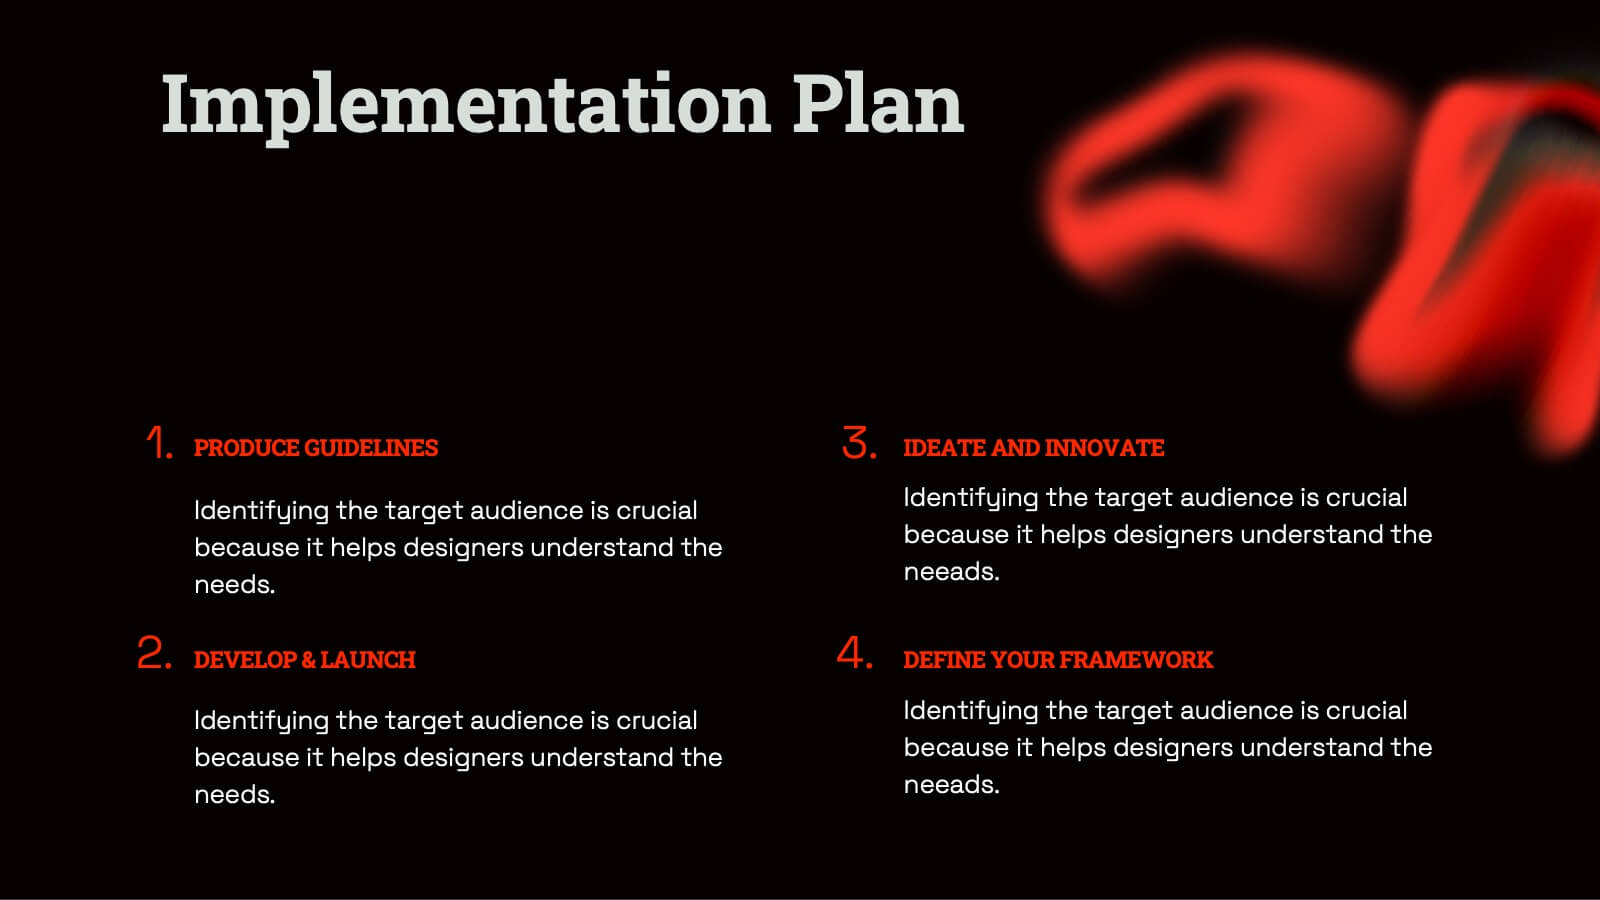
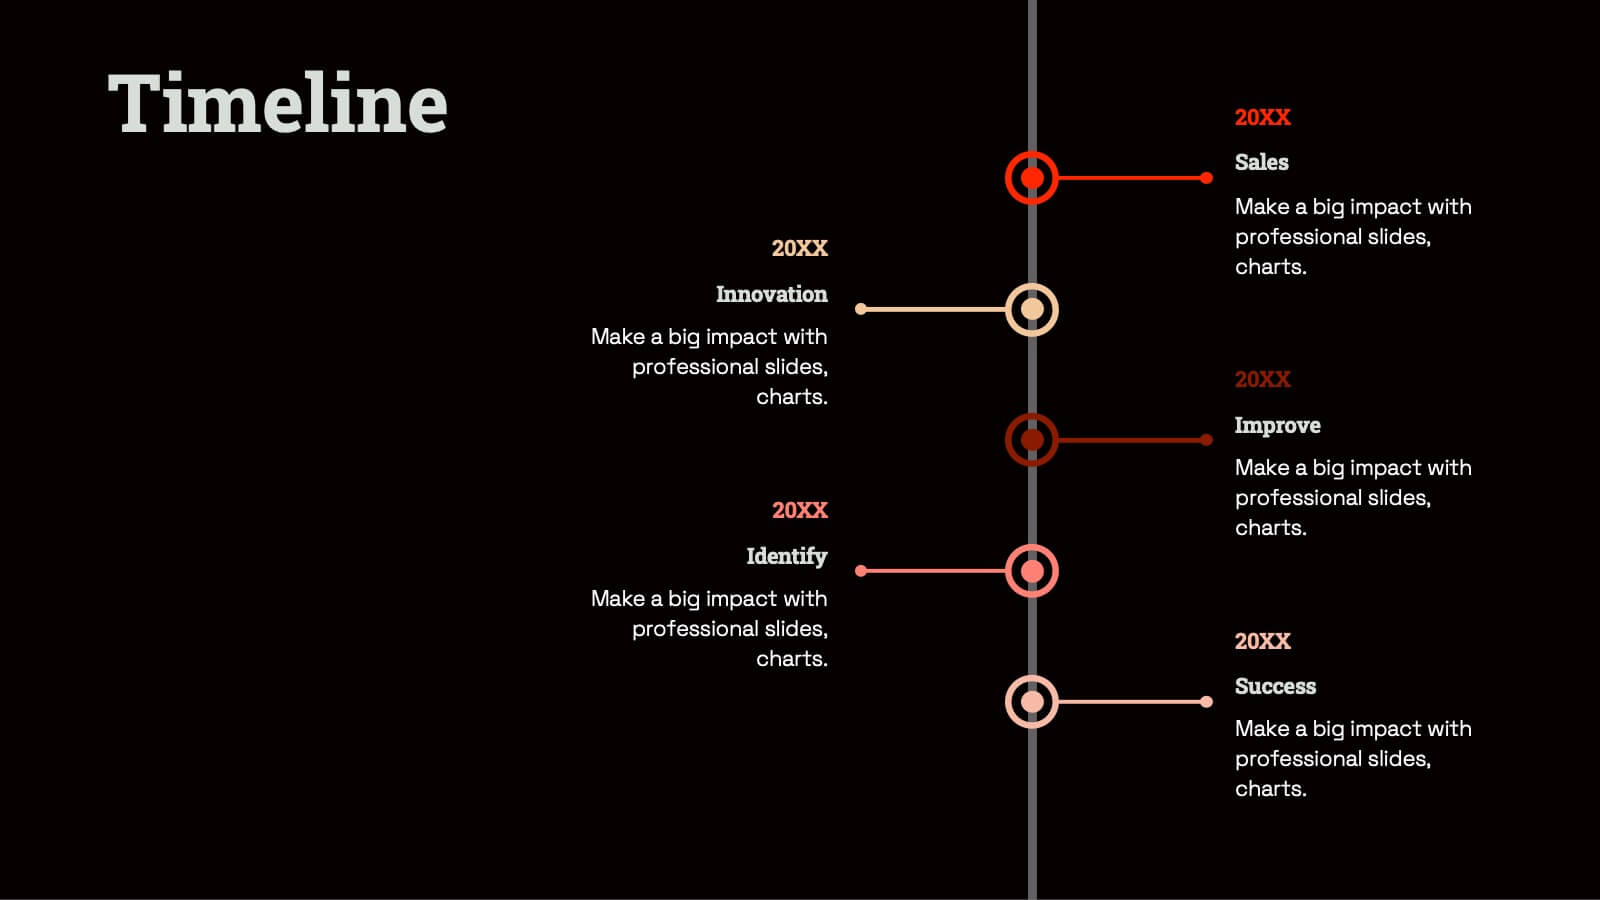
Radiant Graphic Design Project Plan Presentation
Unleash your creativity with this bold and dynamic graphic design project plan template! Perfect for showcasing design elements, textures, and typography, this template guides you through every phase, from concept development and prototyping to feedback and final presentations. Ideal for visual direction and design asset management, it’s fully compatible with PowerPoint, Keynote, and Google Slides for seamless use.


7 diapositivas
Modern Food Menu Presentation
Bring your ideas to the table with a clean and modern layout that turns any food-related content into an easy, visually appealing story. This presentation helps you showcase dishes, categories, or menu insights with clarity and style, making information simple to follow. Fully compatible with PowerPoint, Keynote, and Google Slides.