


Características


¿Tienes alguna pregunta?
Recomendar


3 diapositivas
Decision-Making Bowtie Framework Presentation
Break down complex decisions with clarity using the Decision-Making Bowtie Framework Presentation. This template lets you visually weigh options, outcomes, and impacts from both sides of a decision point, making it ideal for strategic planning, risk assessment, and executive reporting. Compatible with PowerPoint, Keynote, and Google Slides.


6 diapositivas
Detailed Scope Definition and Planning Presentation
Lay out each project stage with the Detailed Scope Definition and Planning Presentation. Featuring a labeled A–E progression with circular milestone visuals, this template helps communicate scope clarity and step-by-step planning. Ideal for strategic presentations, it supports PowerPoint, Keynote, and Google Slides for full compatibility.


5 diapositivas
Multiphase Planning with Strategy Wheel Presentation
Visualize your project’s lifecycle with this five-part strategy wheel layout. Each labeled segment highlights a phase in your planning process, ideal for showcasing sequential steps or stages. Fully editable in PowerPoint, Keynote, and Google Slides, this template simplifies complex workflows while maintaining a clean, professional design for strategic presentations.


19 diapositivas
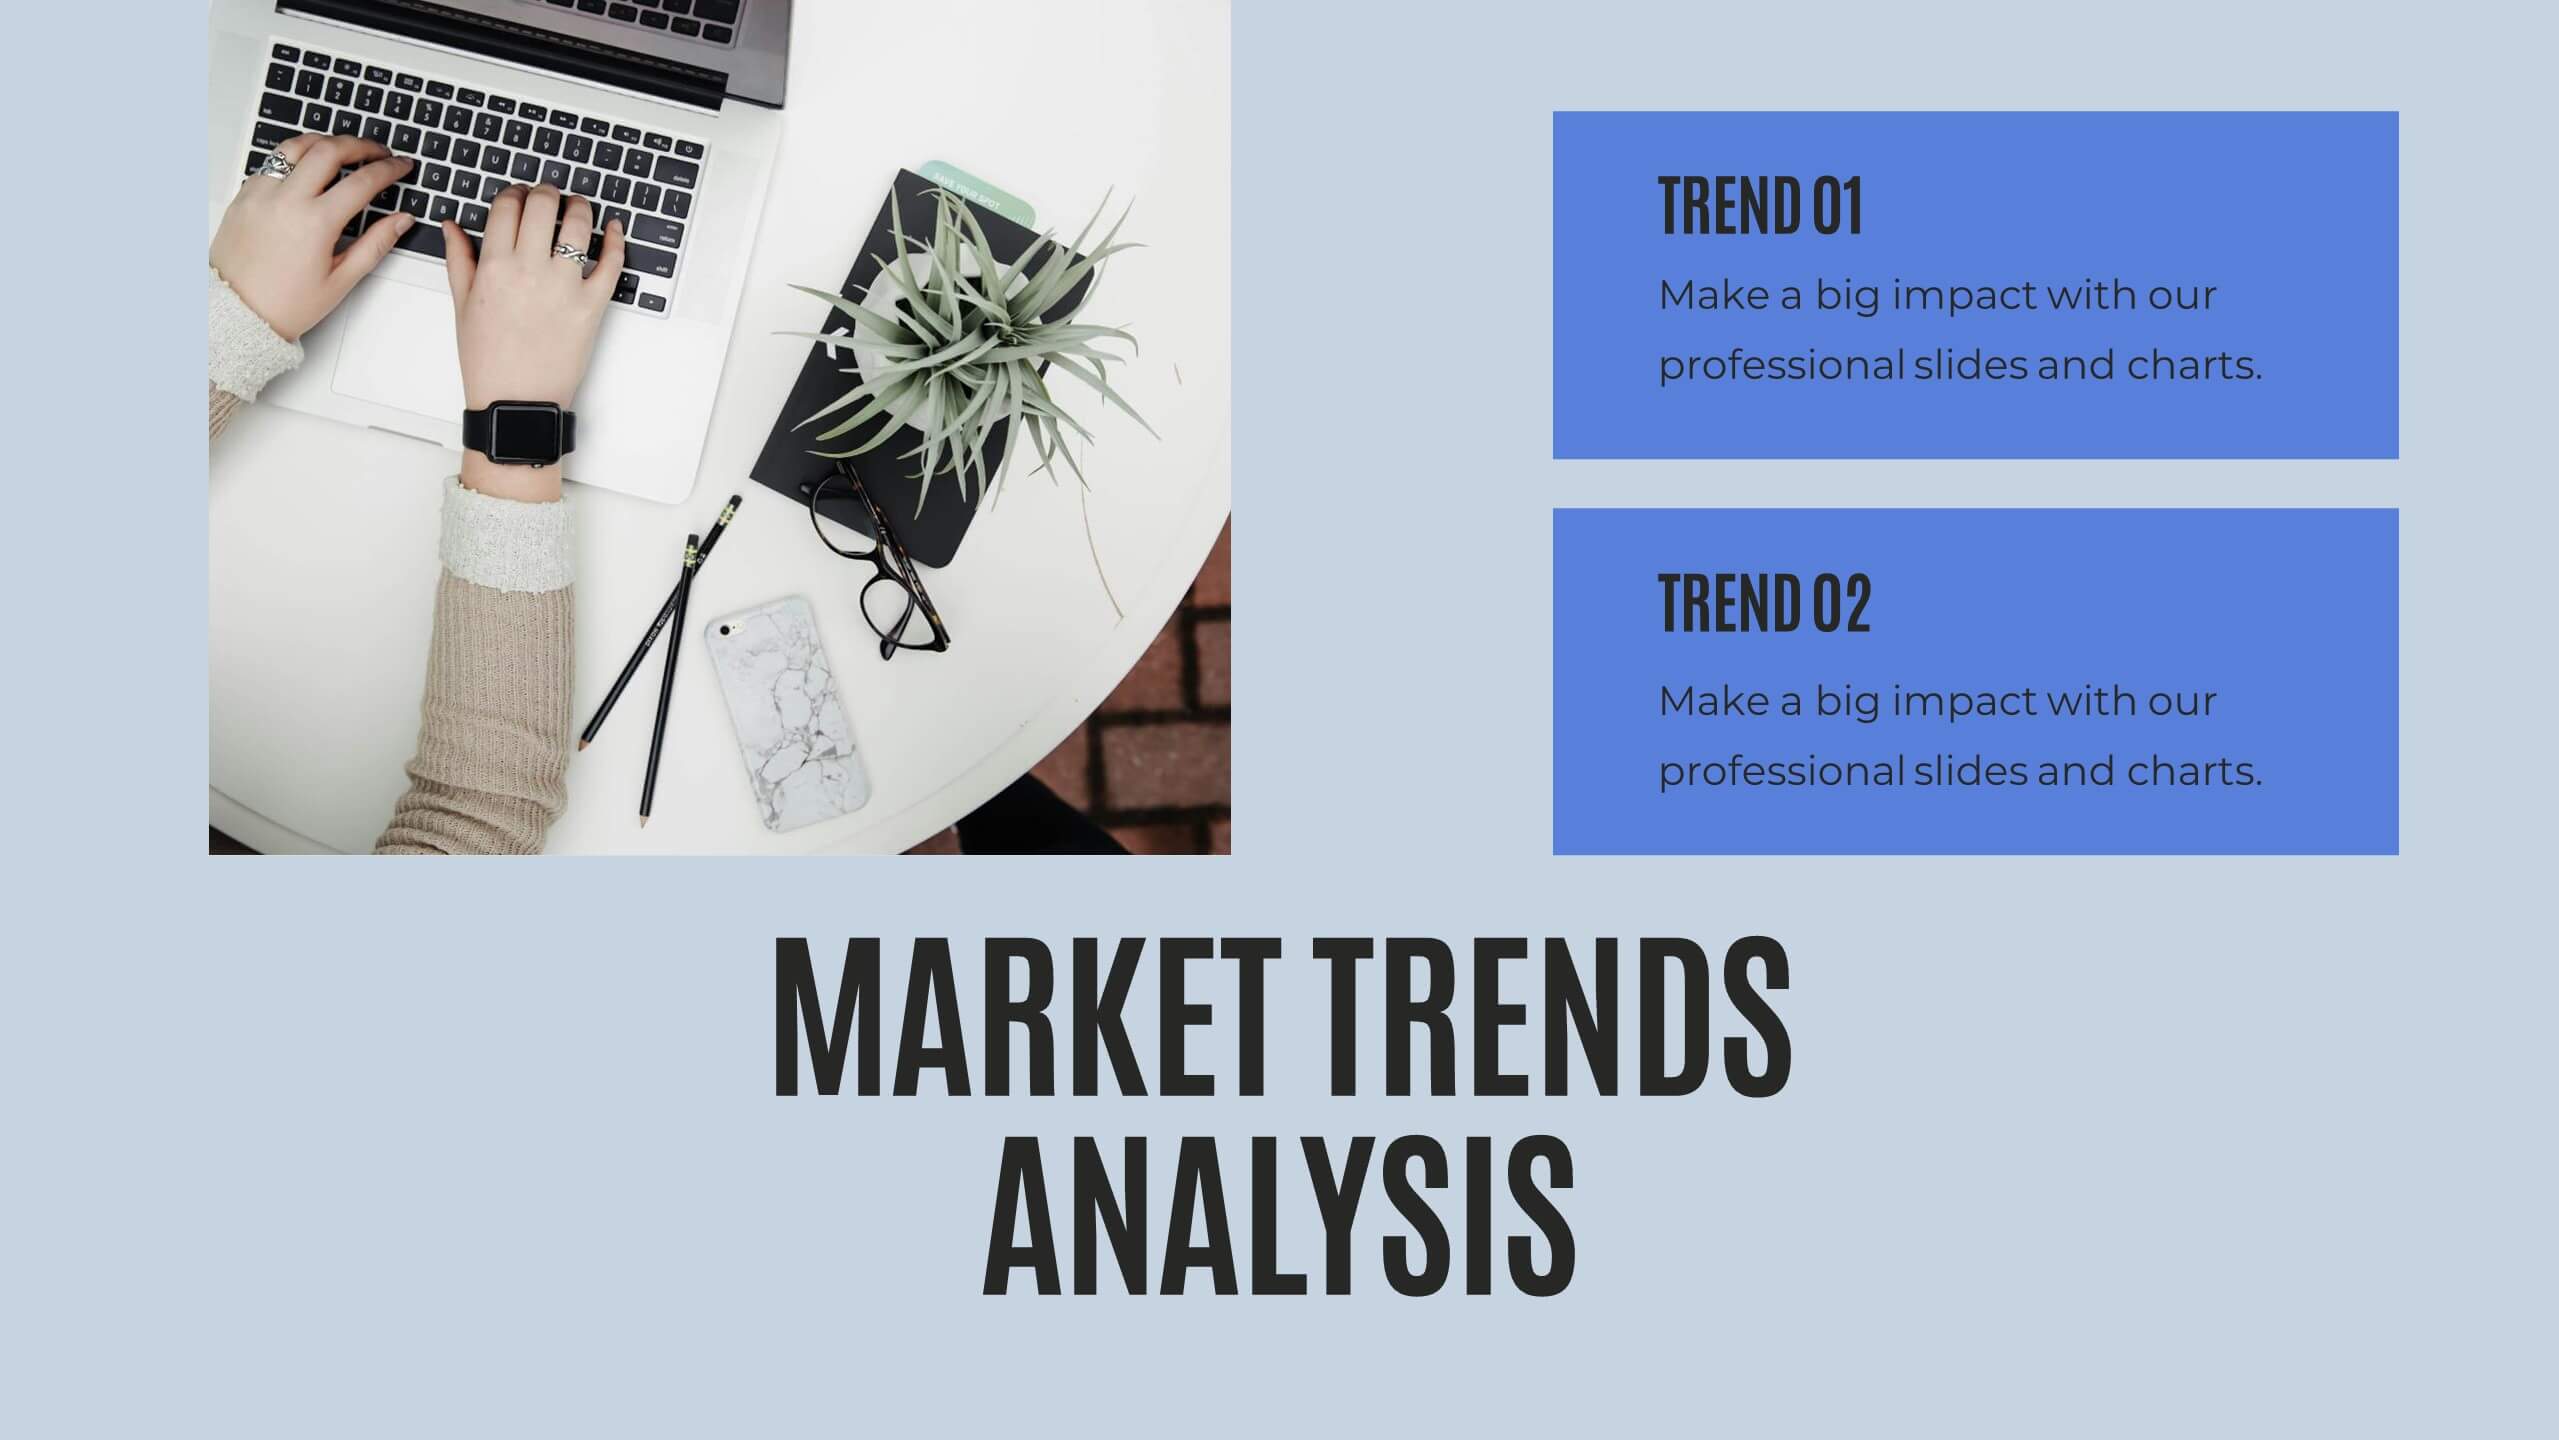
Fableia Marketing Research Report Presentation
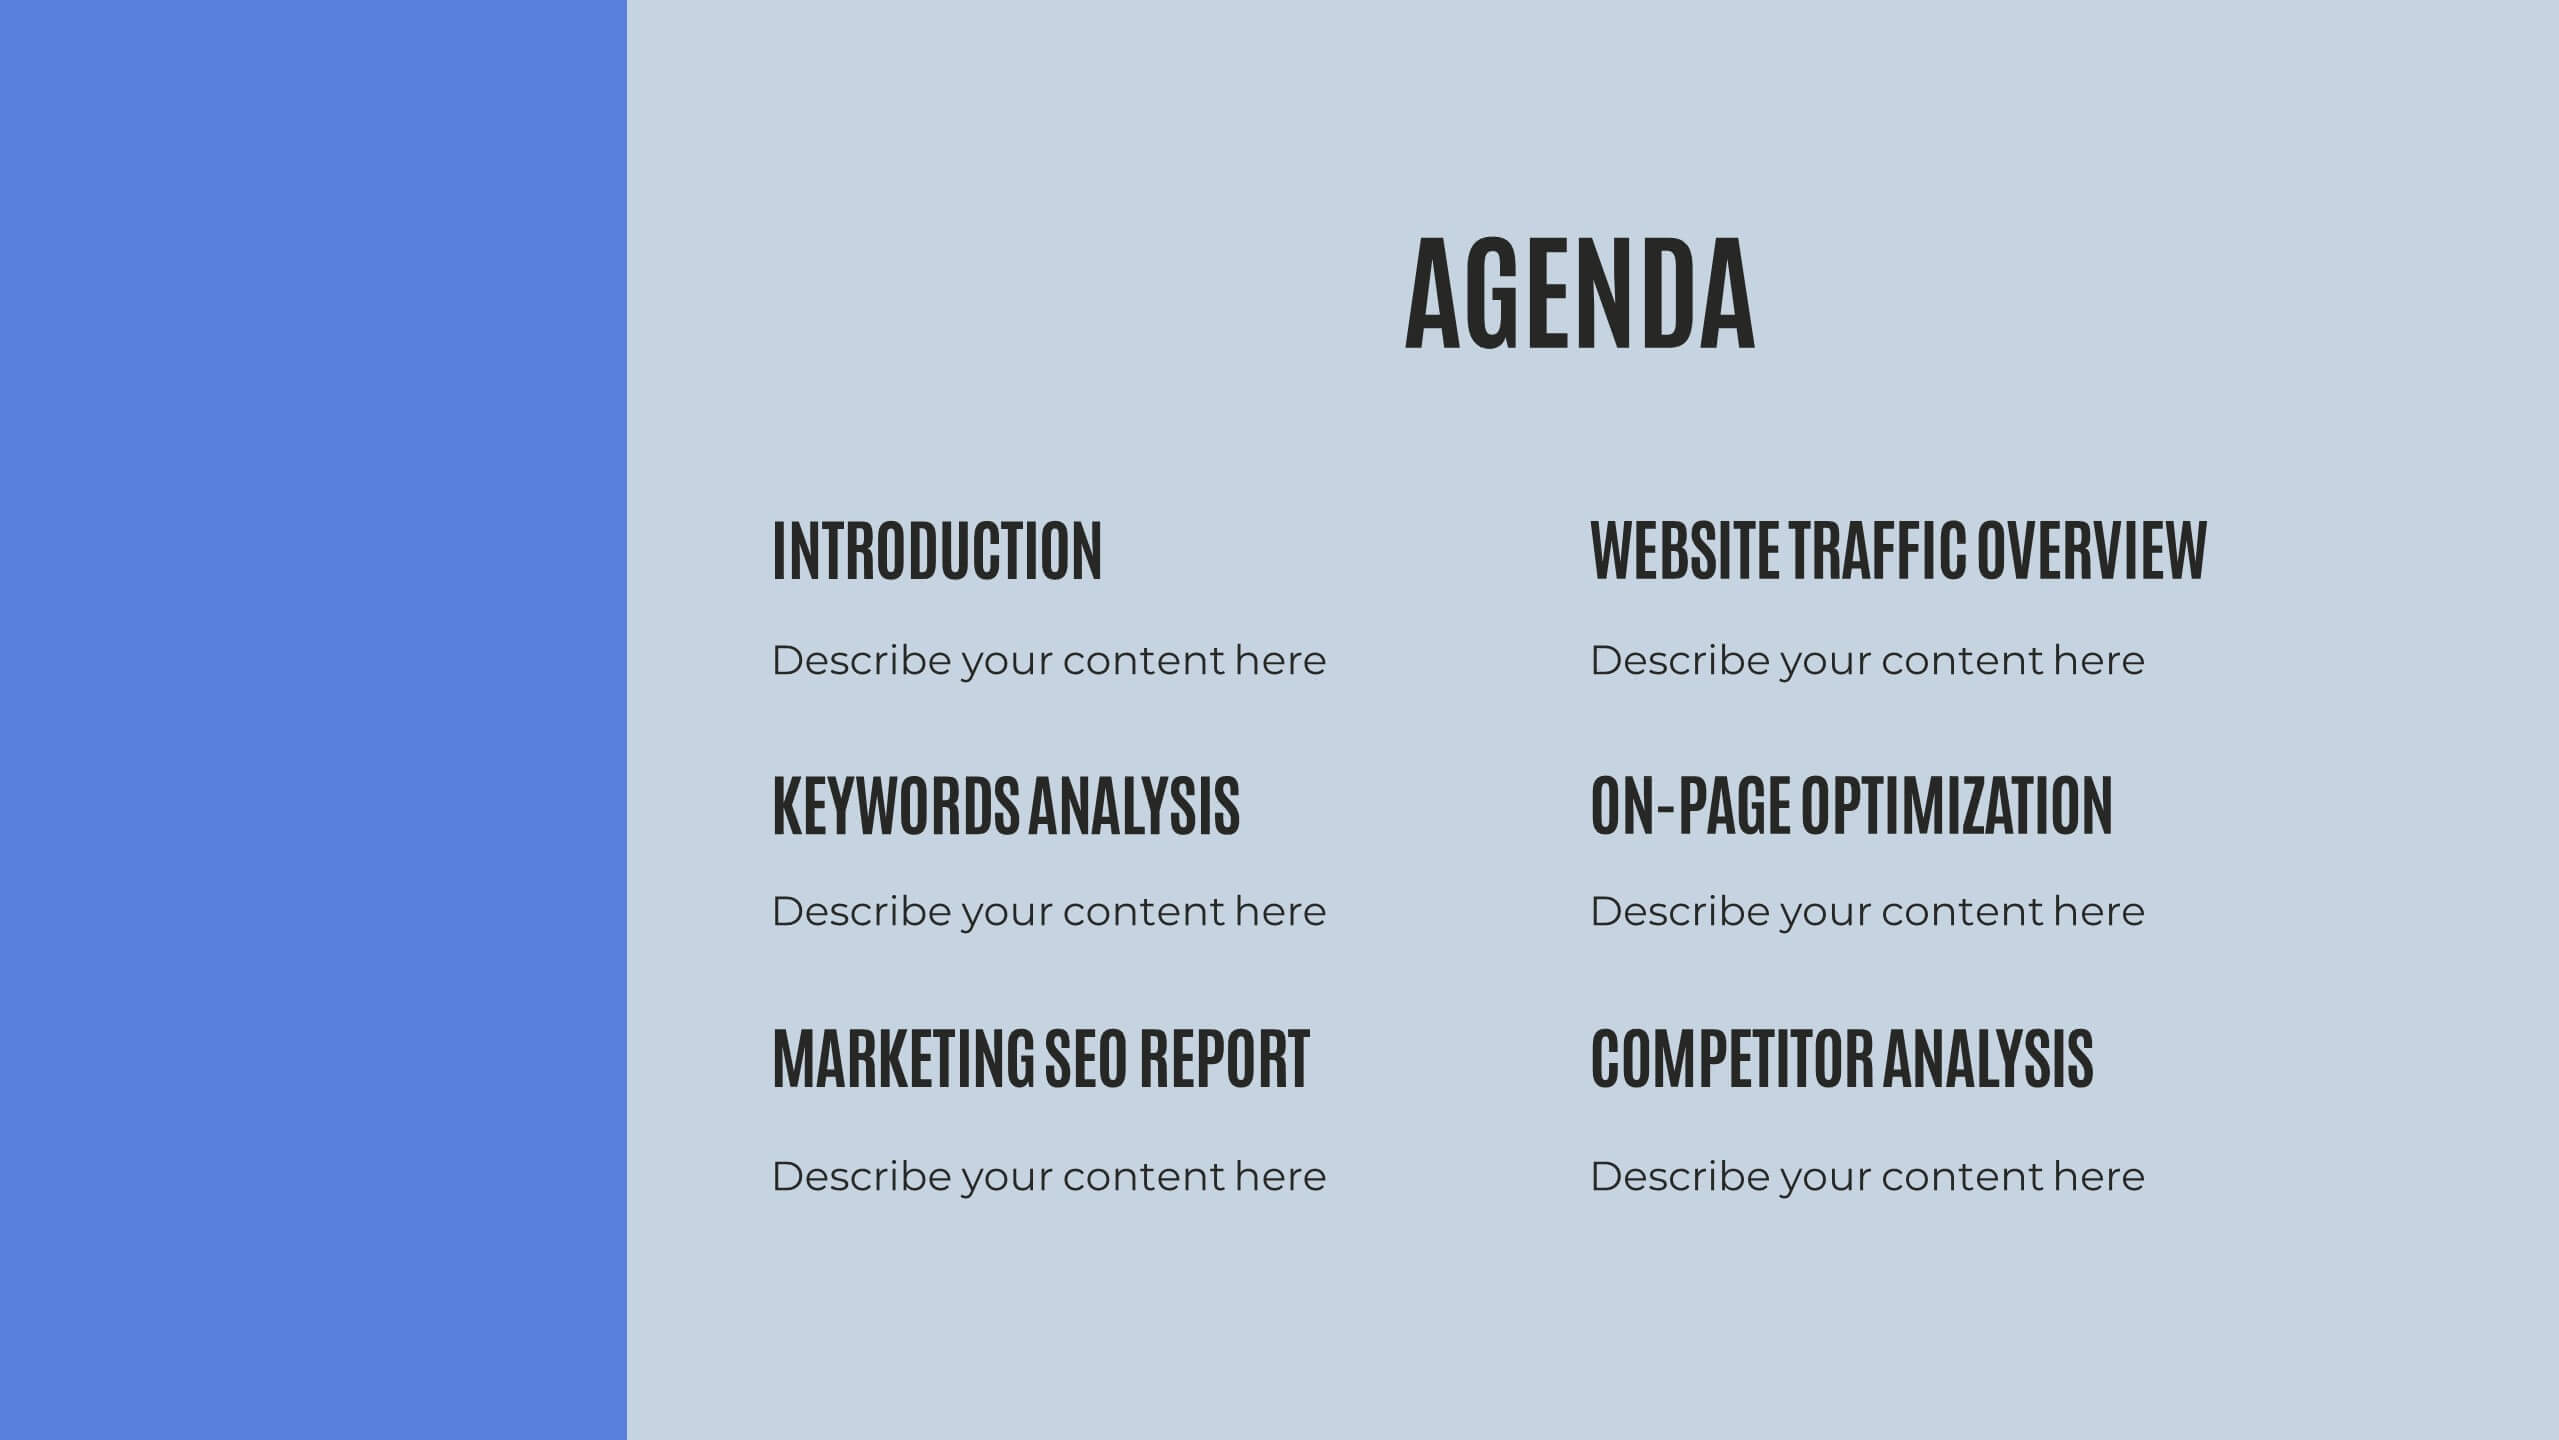
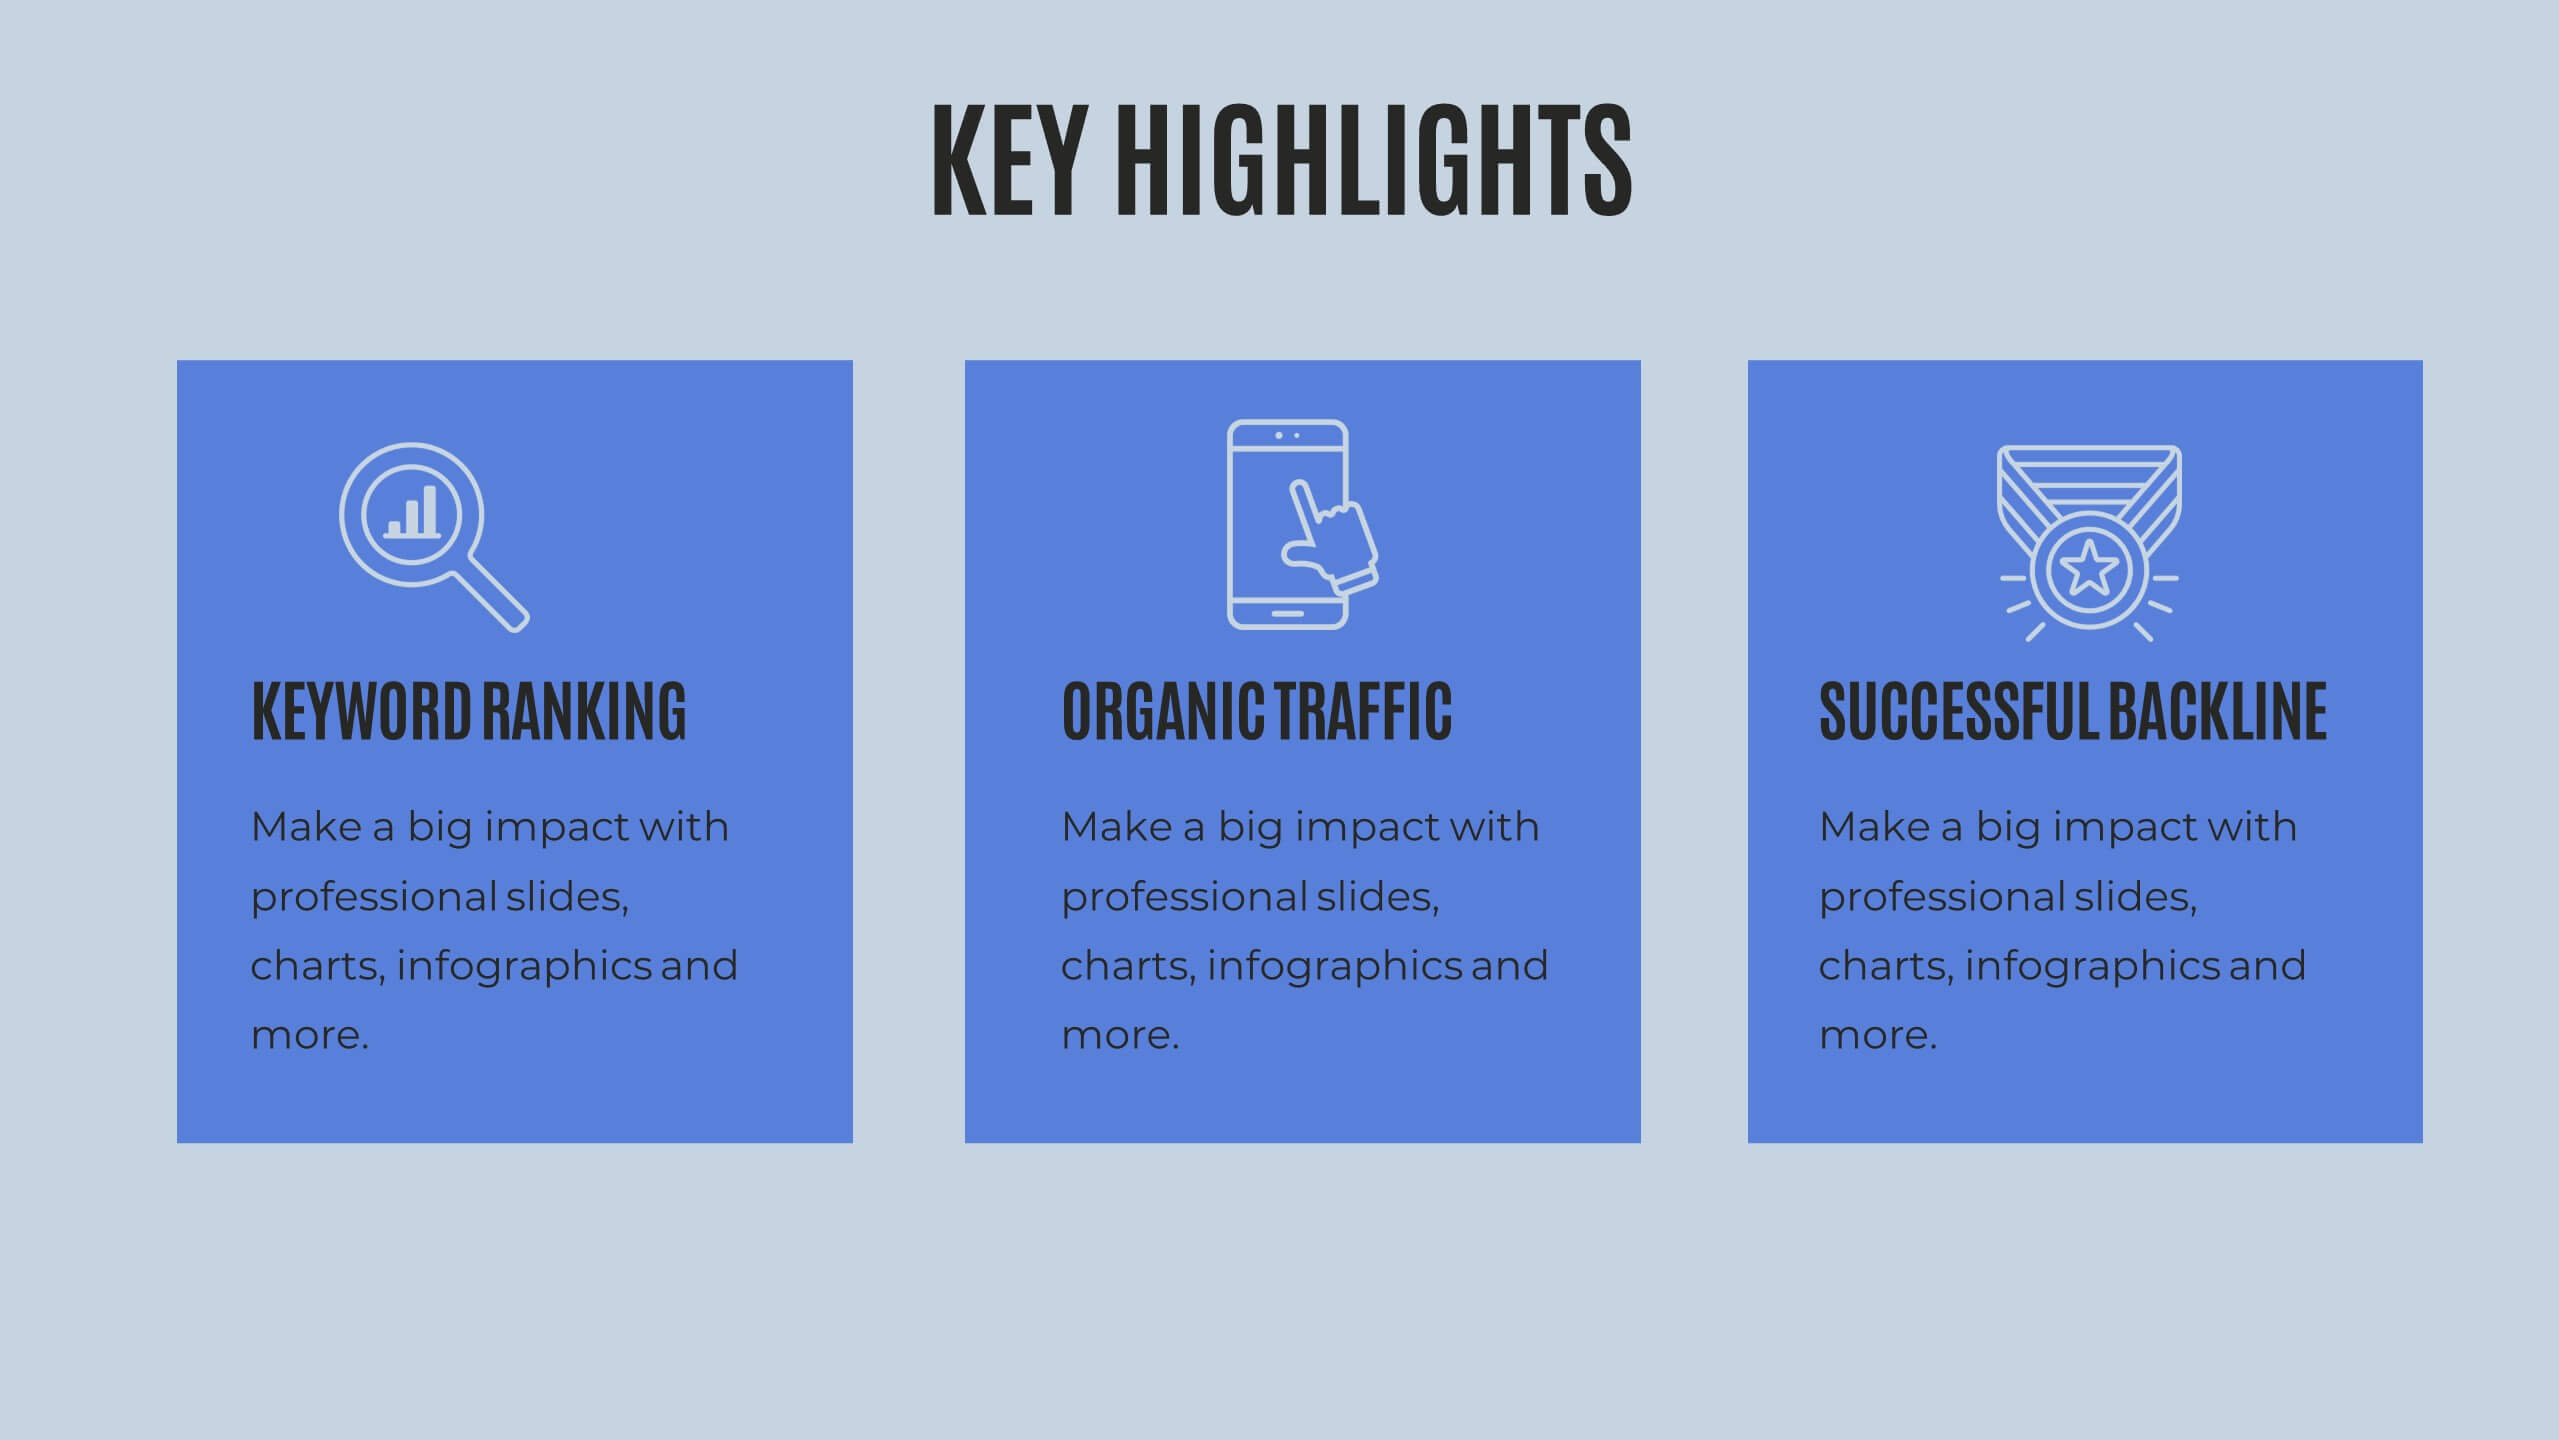
Deliver data-driven insights with a professional and visually engaging marketing research report presentation. This template is tailored for marketing professionals, agencies, and businesses looking to showcase research findings with precision and clarity. Highlight key sections such as market trends, consumer behavior analysis, and campaign performance using dynamic visuals and well-structured layouts. Share your insights on emerging technologies, social media strategies, and customer targeting with easy-to-edit graphs, charts, and infographics. Use dedicated slides for SEO analytics, value propositions, and recommendations to present actionable strategies that resonate with your audience. This template is fully customizable and works seamlessly with PowerPoint, Google Slides, and Keynote, ensuring you can adapt it to your unique needs. Present your research with confidence and leave a lasting impact on stakeholders and decision-makers.


3 diapositivas
Key Stats and Market Figures Slide Presentation
Communicate comparisons clearly with the Key Stats and Market Figures Slide presentation. This template uses a balanced scale graphic to visually contrast two data sets—ideal for weighing pros and cons, competitor benchmarks, or before-and-after scenarios. Fully customizable in PowerPoint, Keynote, and Google Slides.


7 diapositivas
SCRUM Infographic Presentation Template
A SCRUM infographic is an Agile methodology for software development. The goal of this infographic template is to provide a clear and easy-to-understand overview of the key principles and practices of scrum, such as the roles, events, and artifacts used in the process. This template can be used as a reference for team members, as a teaching tool for new scrum practitioners, or as a way to communicate scrum to stakeholders. Our well-designed scrum infographic can help you and your audience quickly understand the basics of the framework, as well as its benefits, applications, and best practices.
22 diapositivas
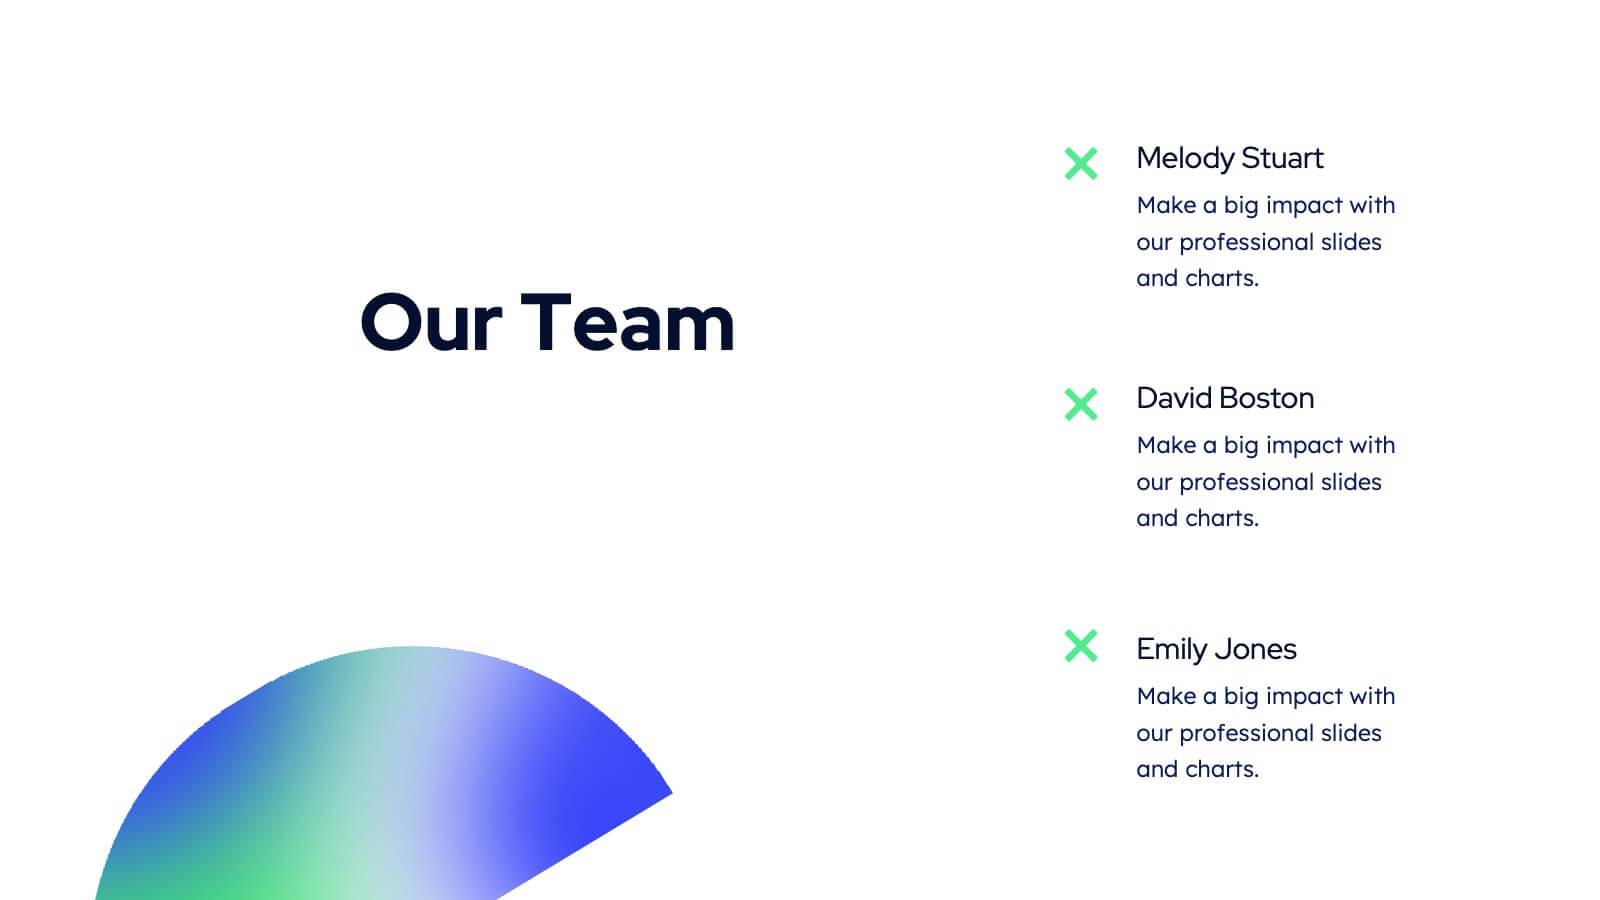
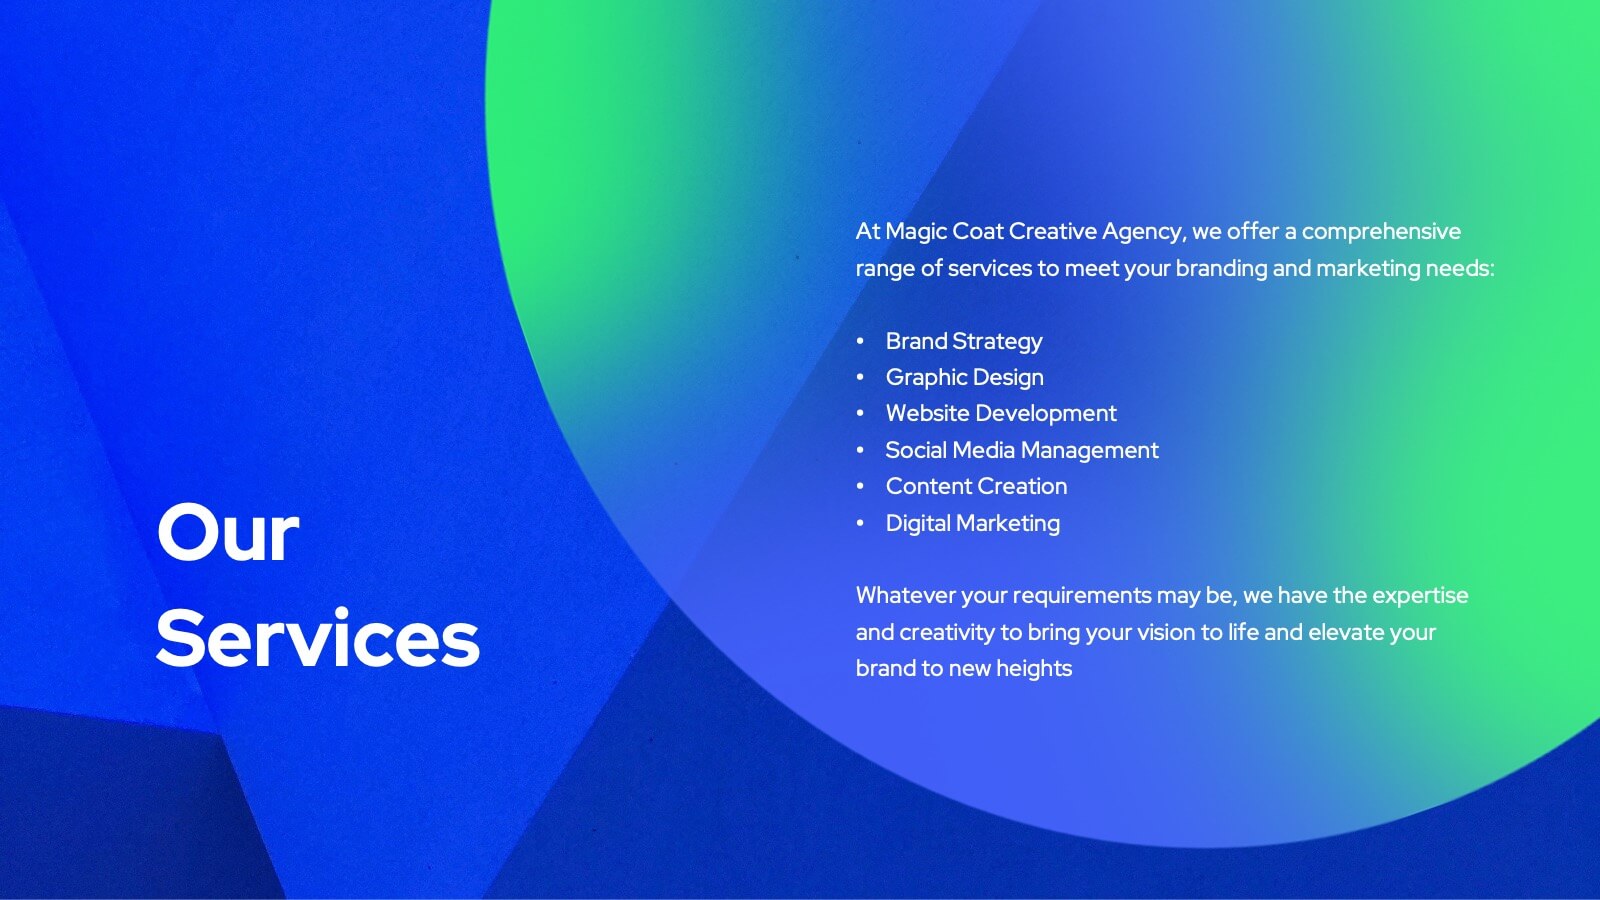
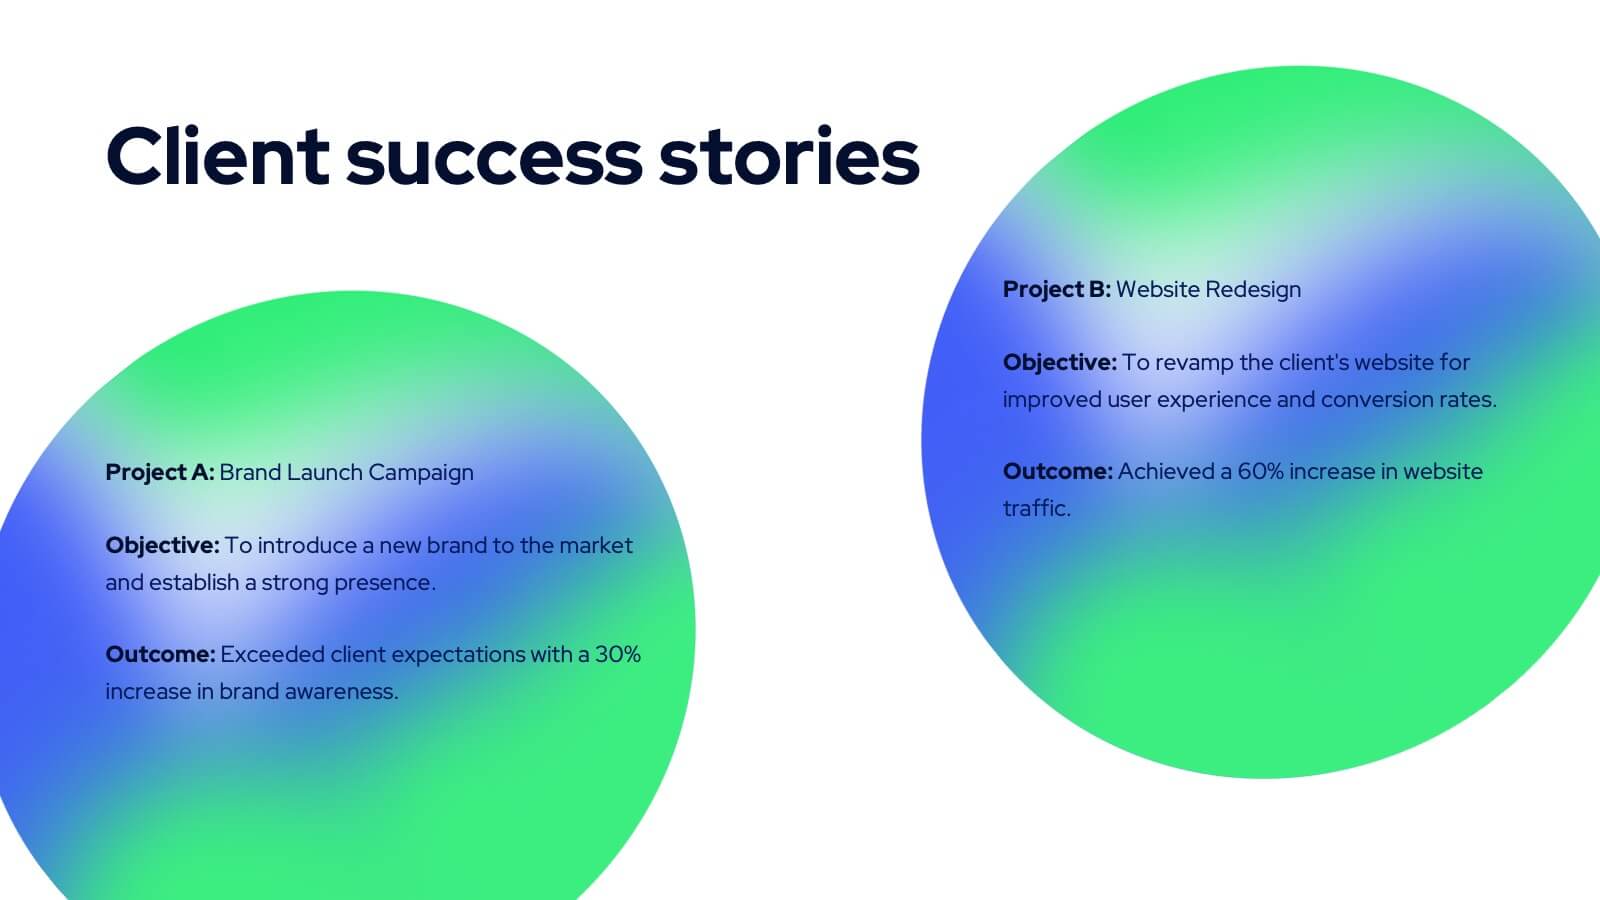
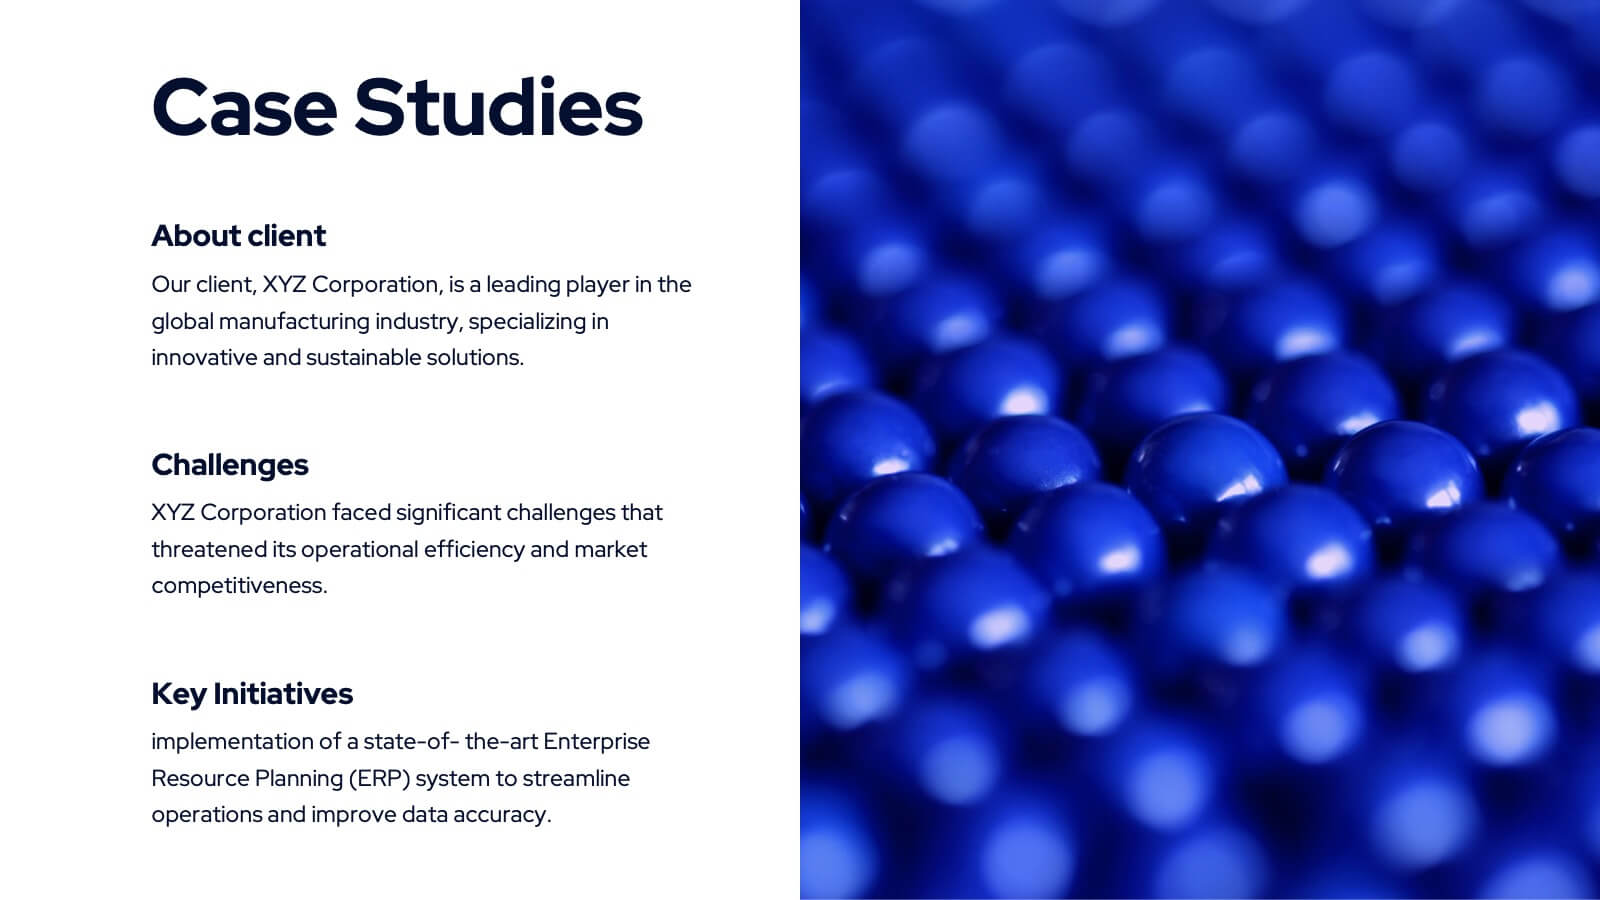
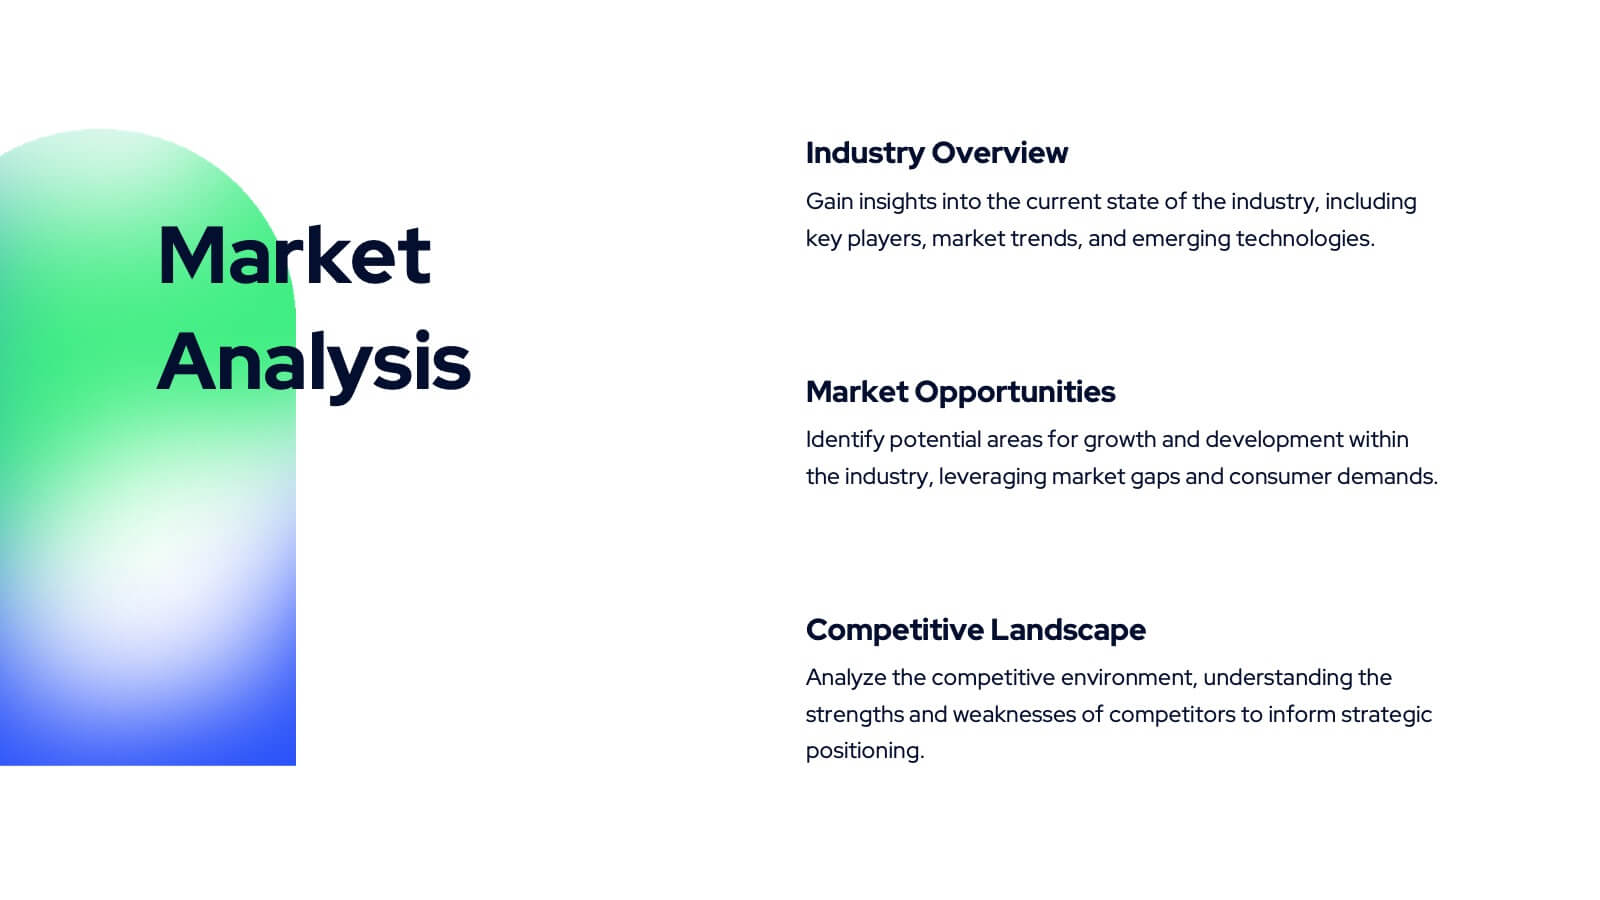
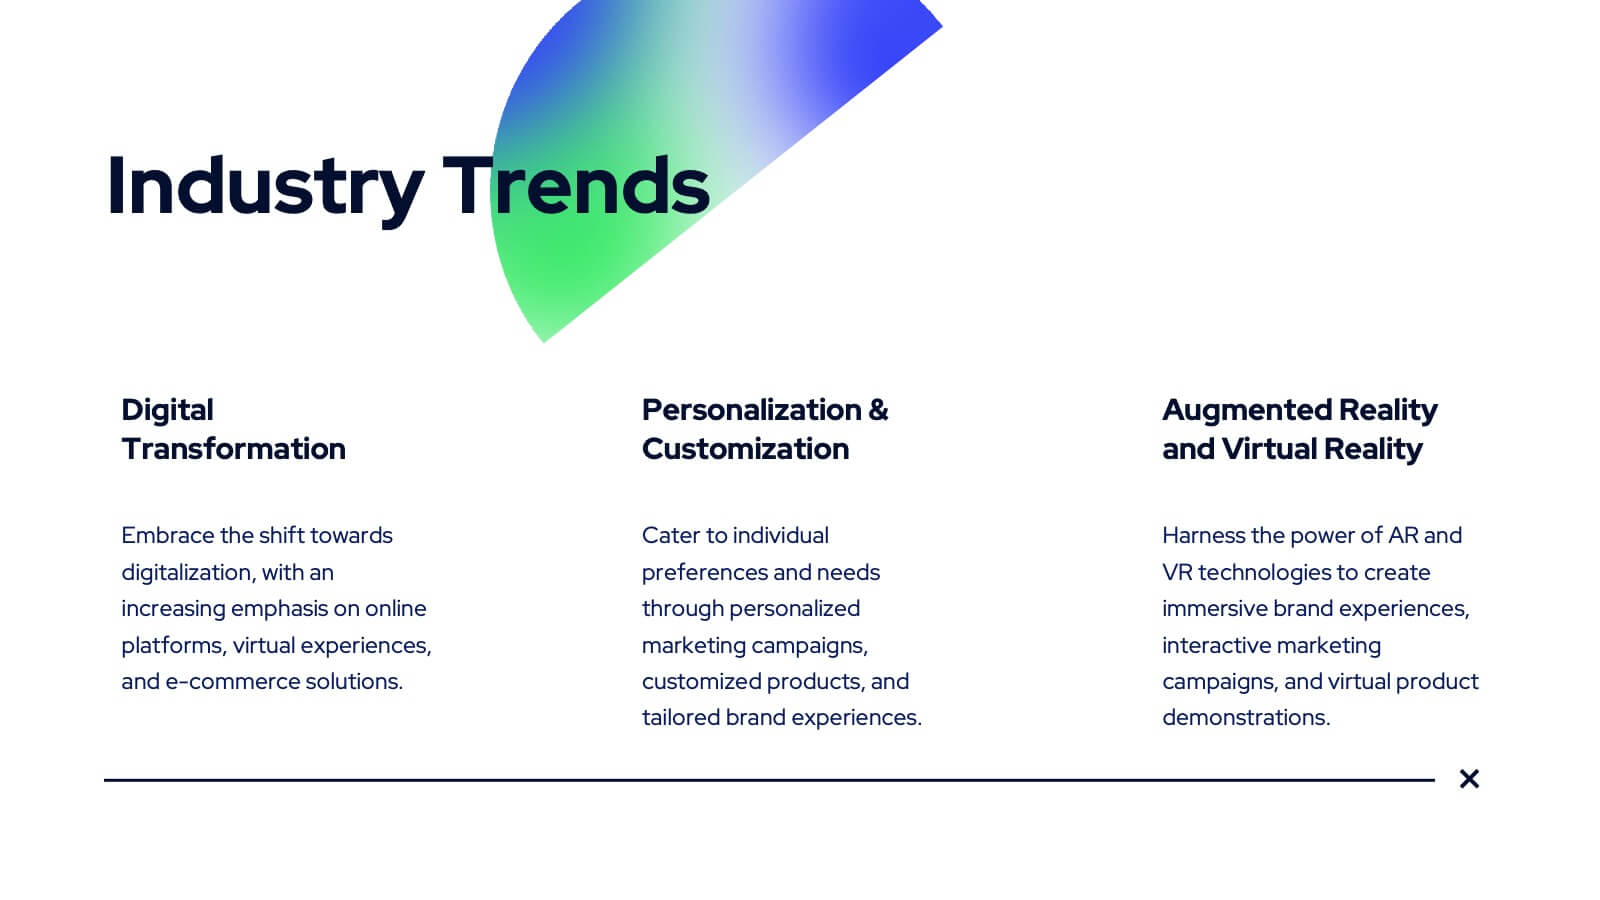
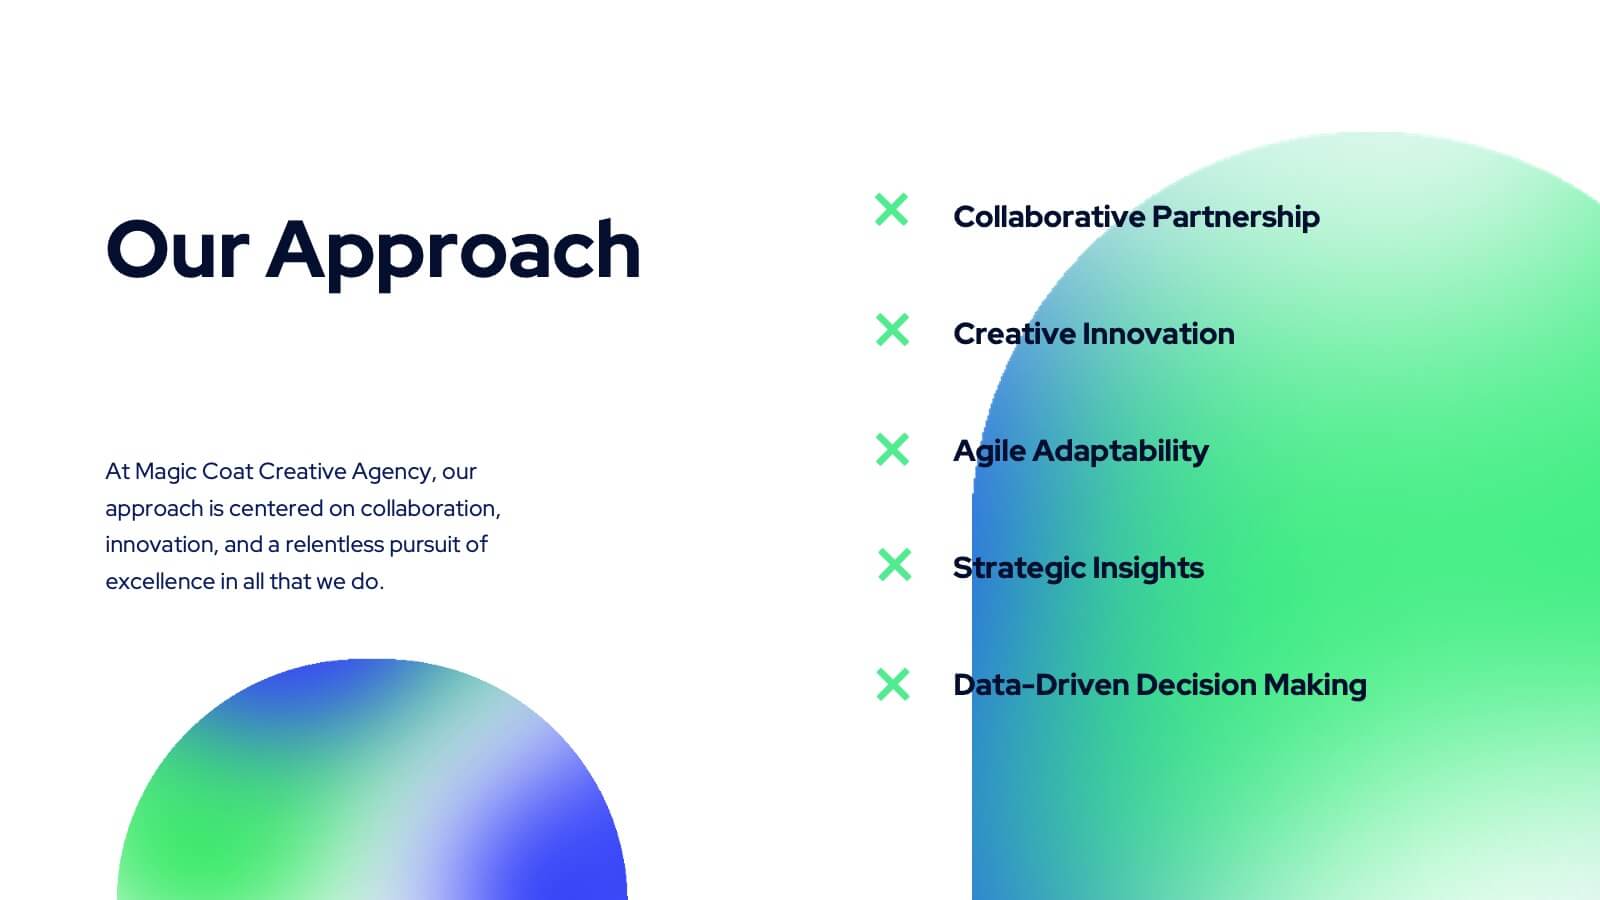
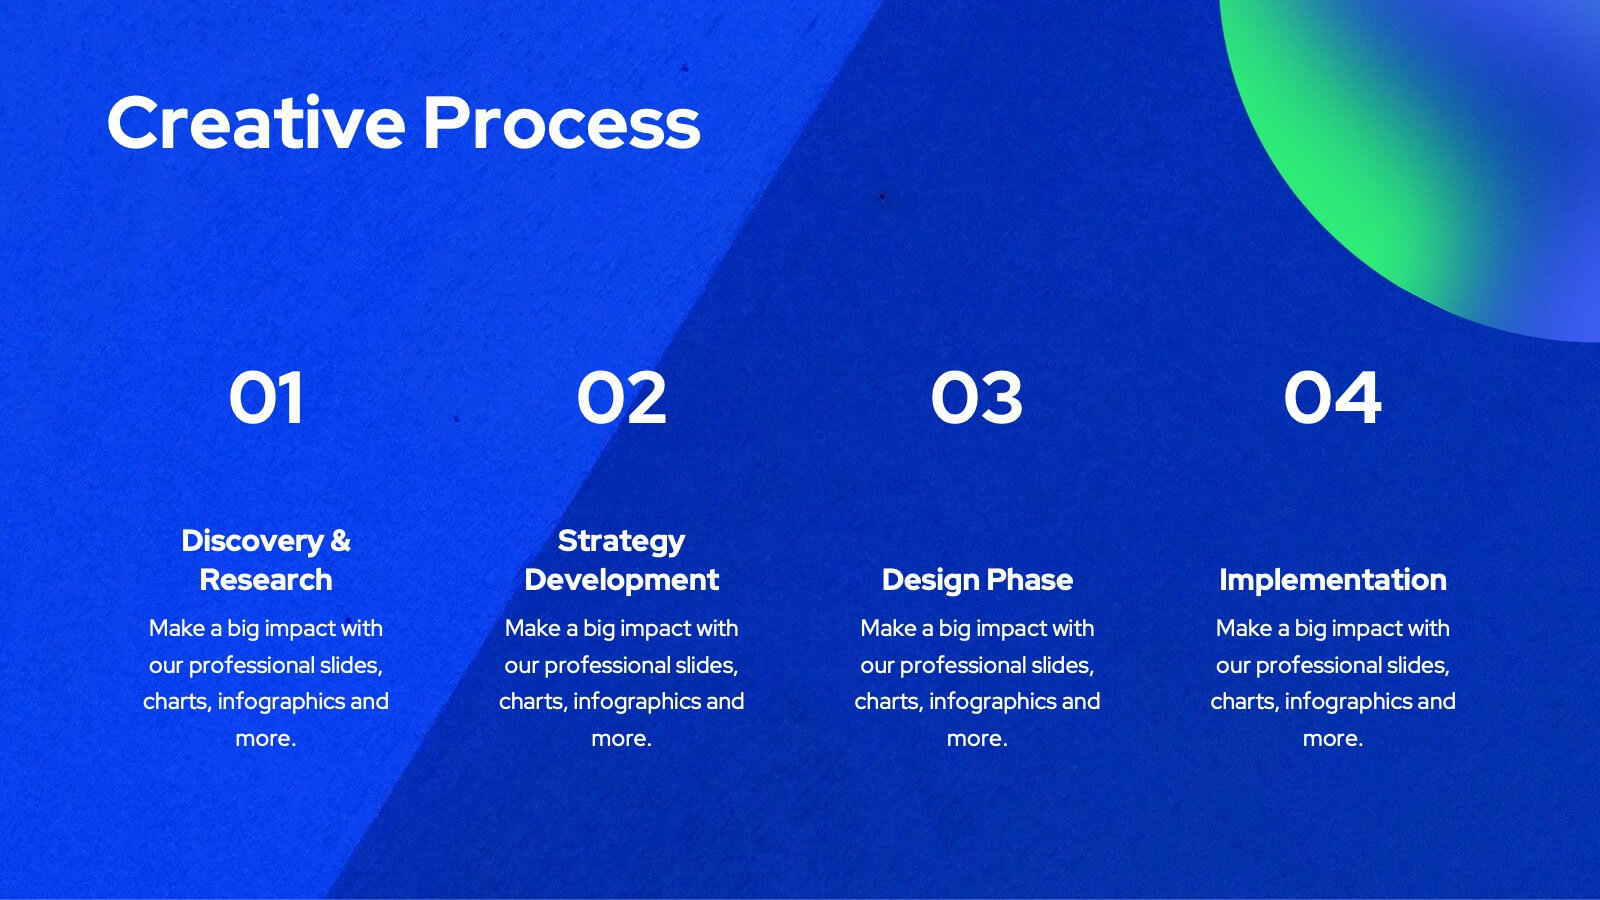
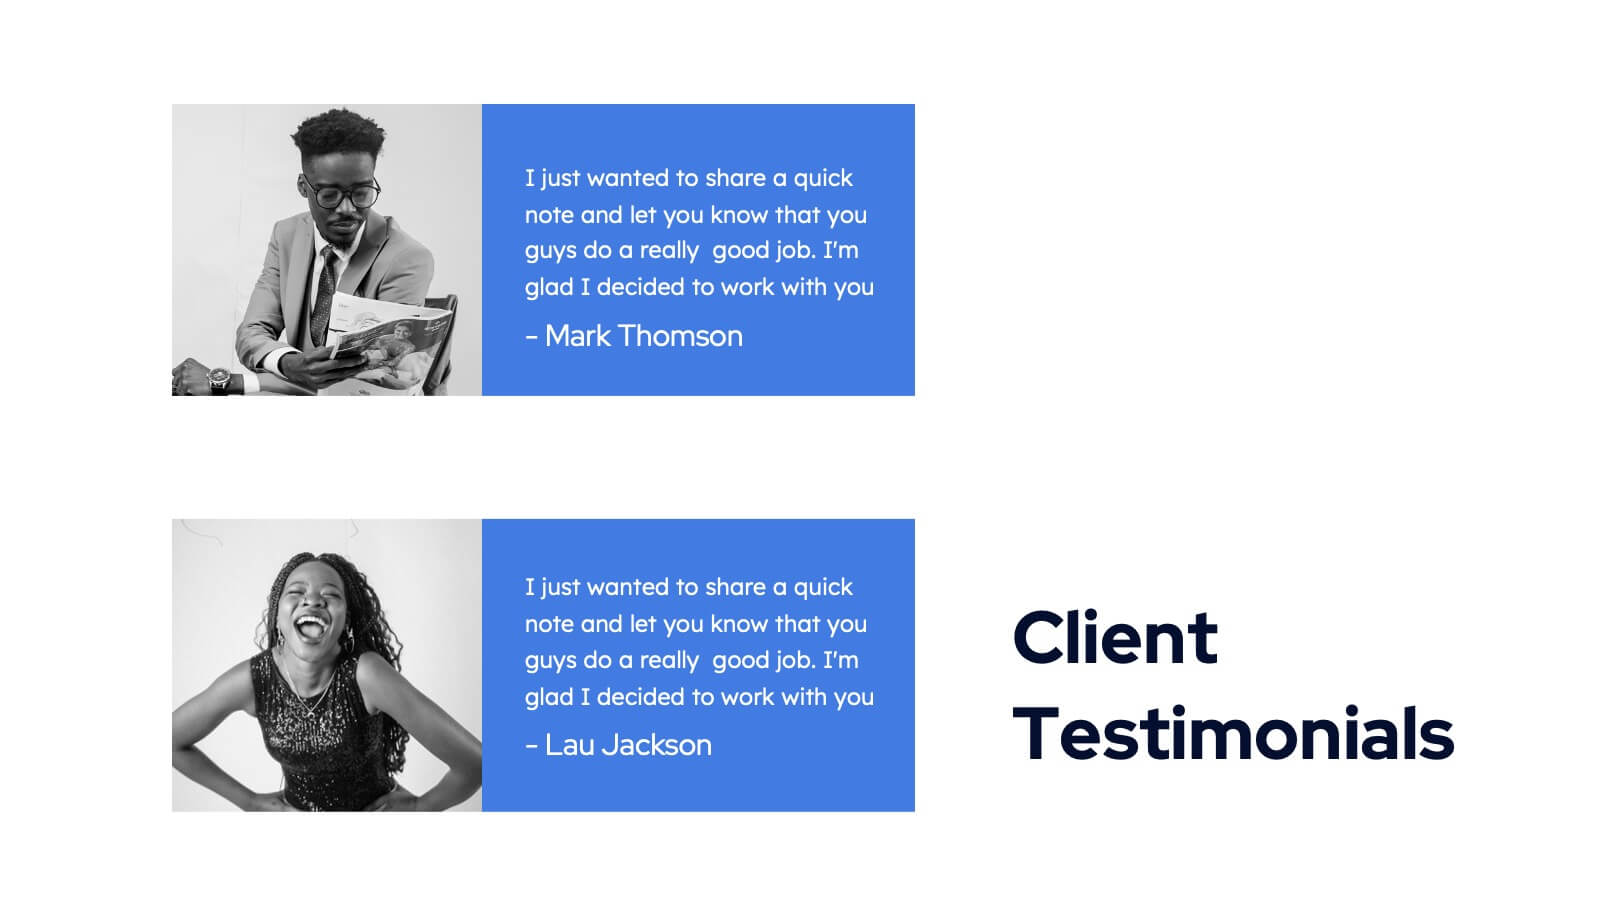
Tanzanite Full-Service Agency Project Plan Presentation
Showcase your agency's strengths with this bold and modern portfolio presentation template! From client success stories and case studies to market analysis and strategy development, this template highlights your expertise and approach. Perfect for agencies looking to present their services, creative processes, and partnerships. Compatible with PowerPoint, Keynote, and Google Slides, making it easy to impress any audience.


21 diapositivas
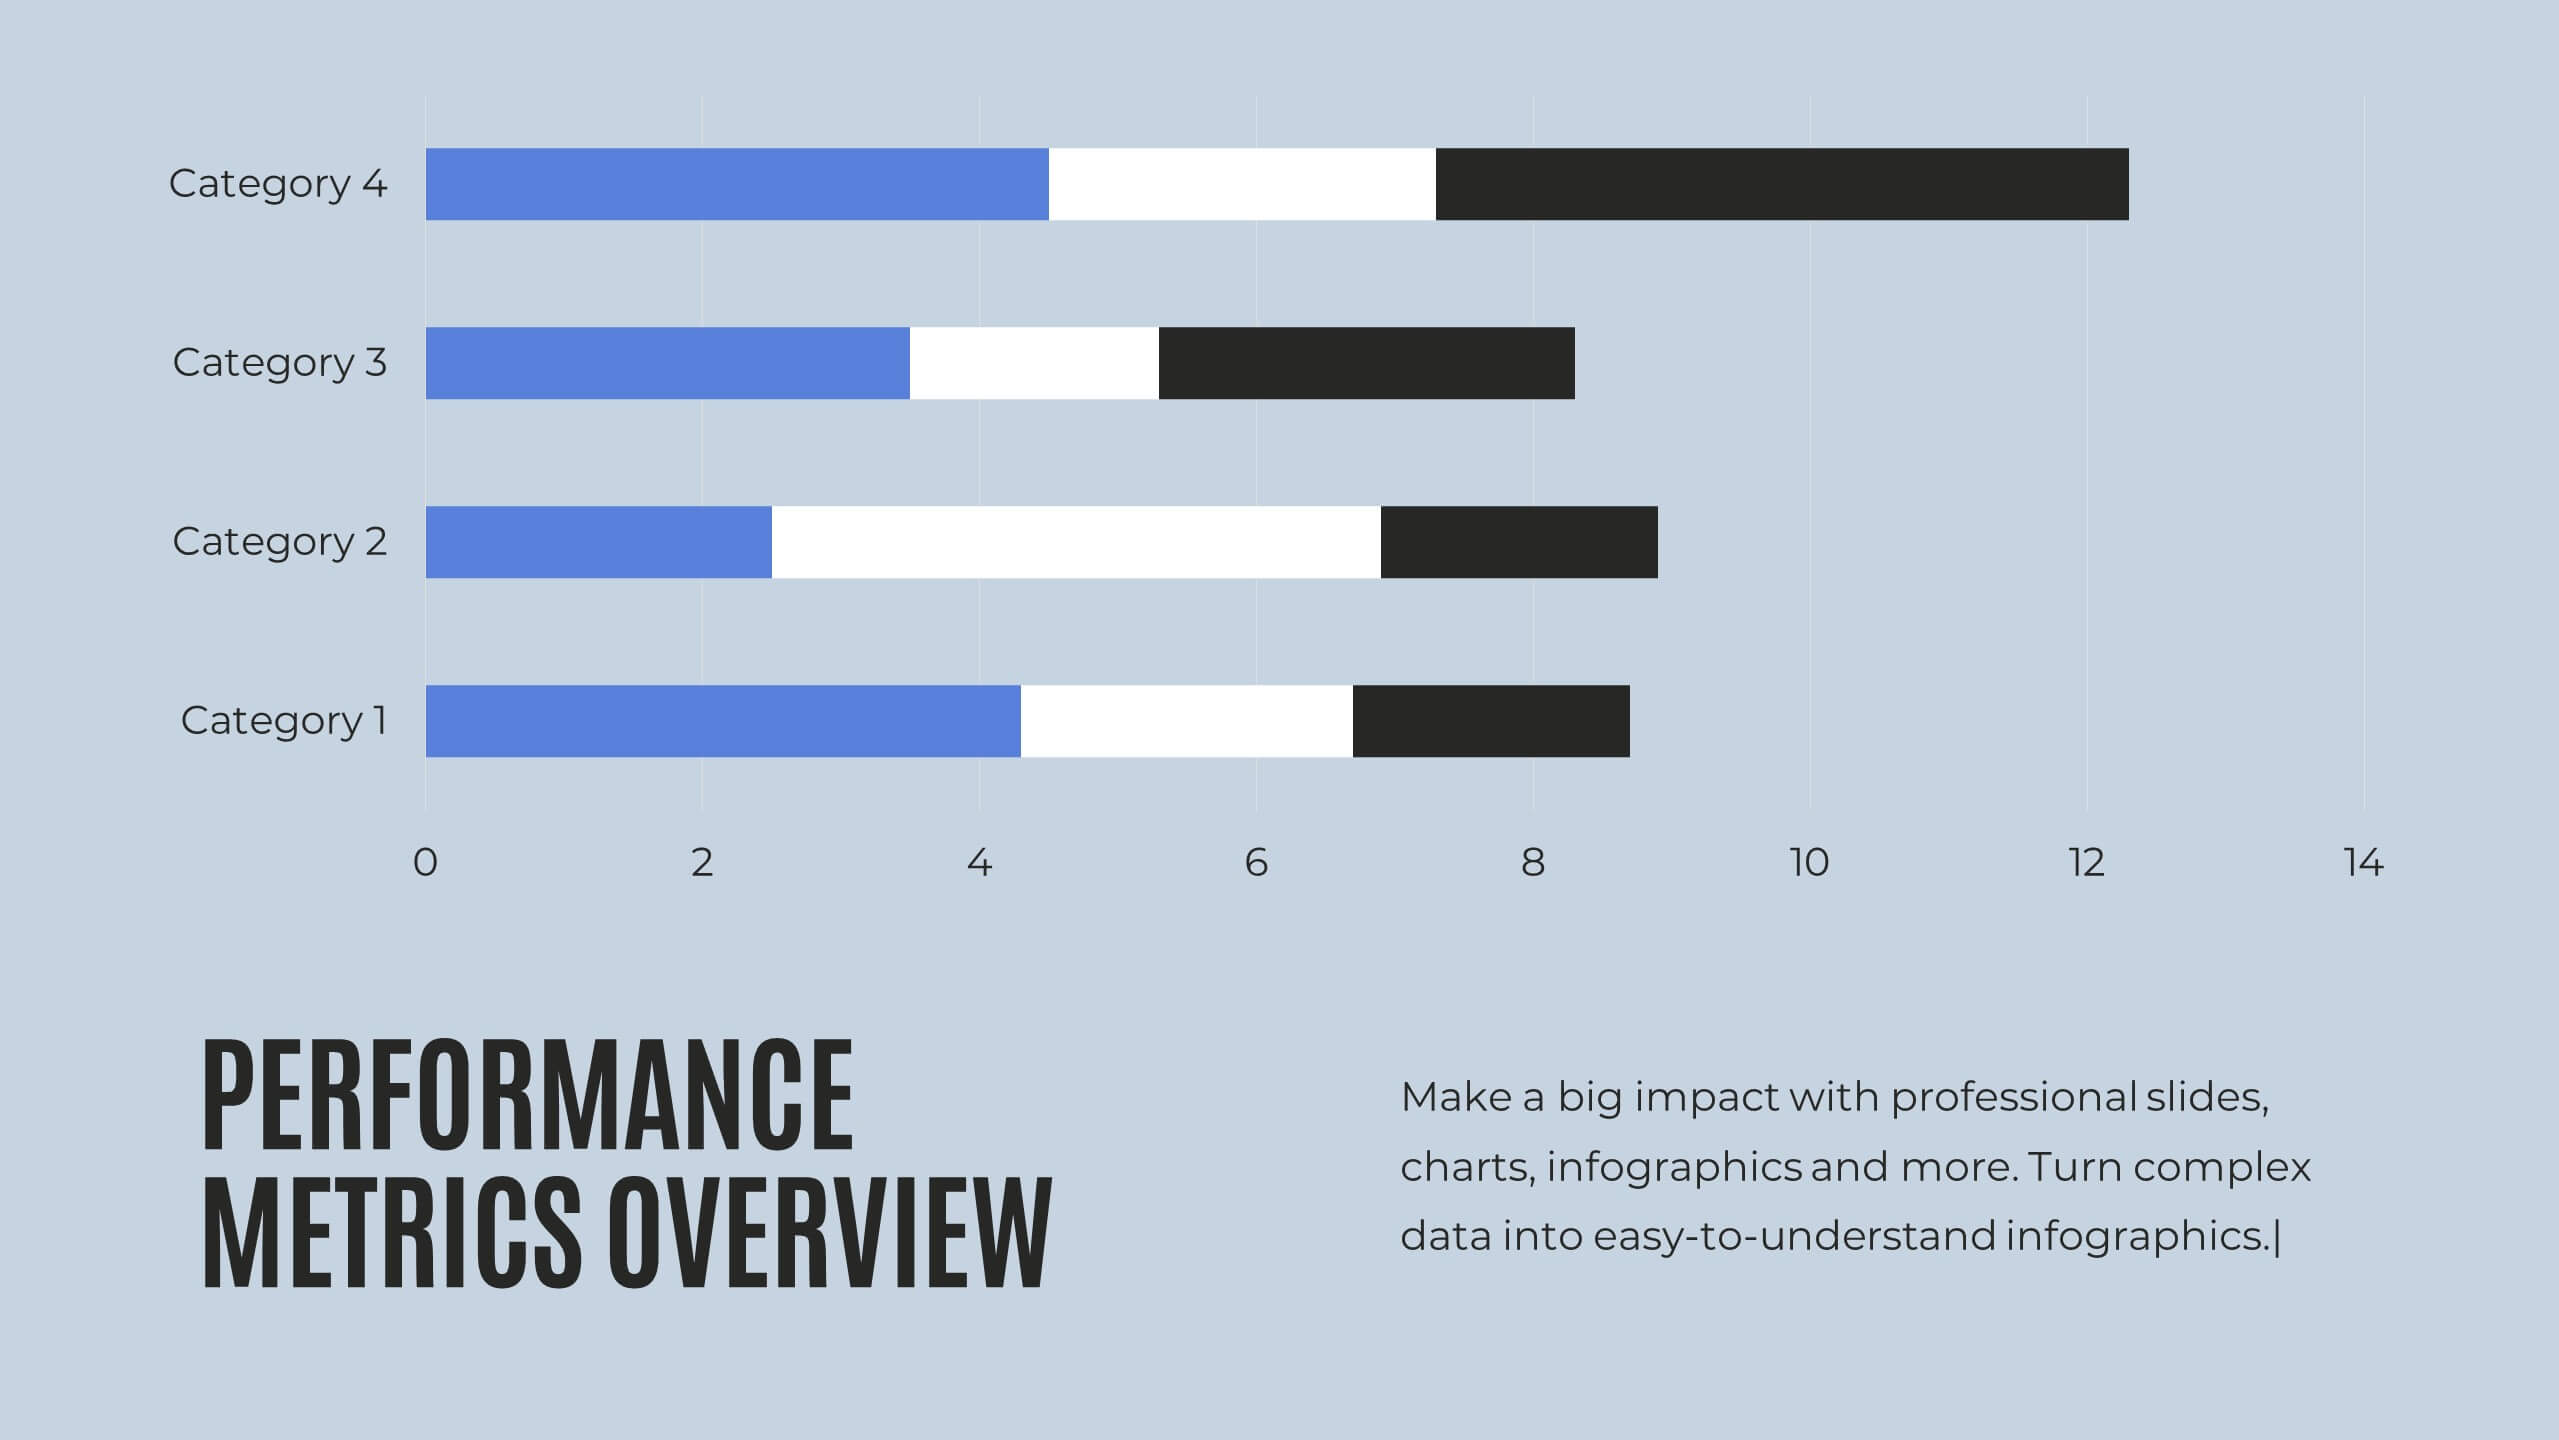
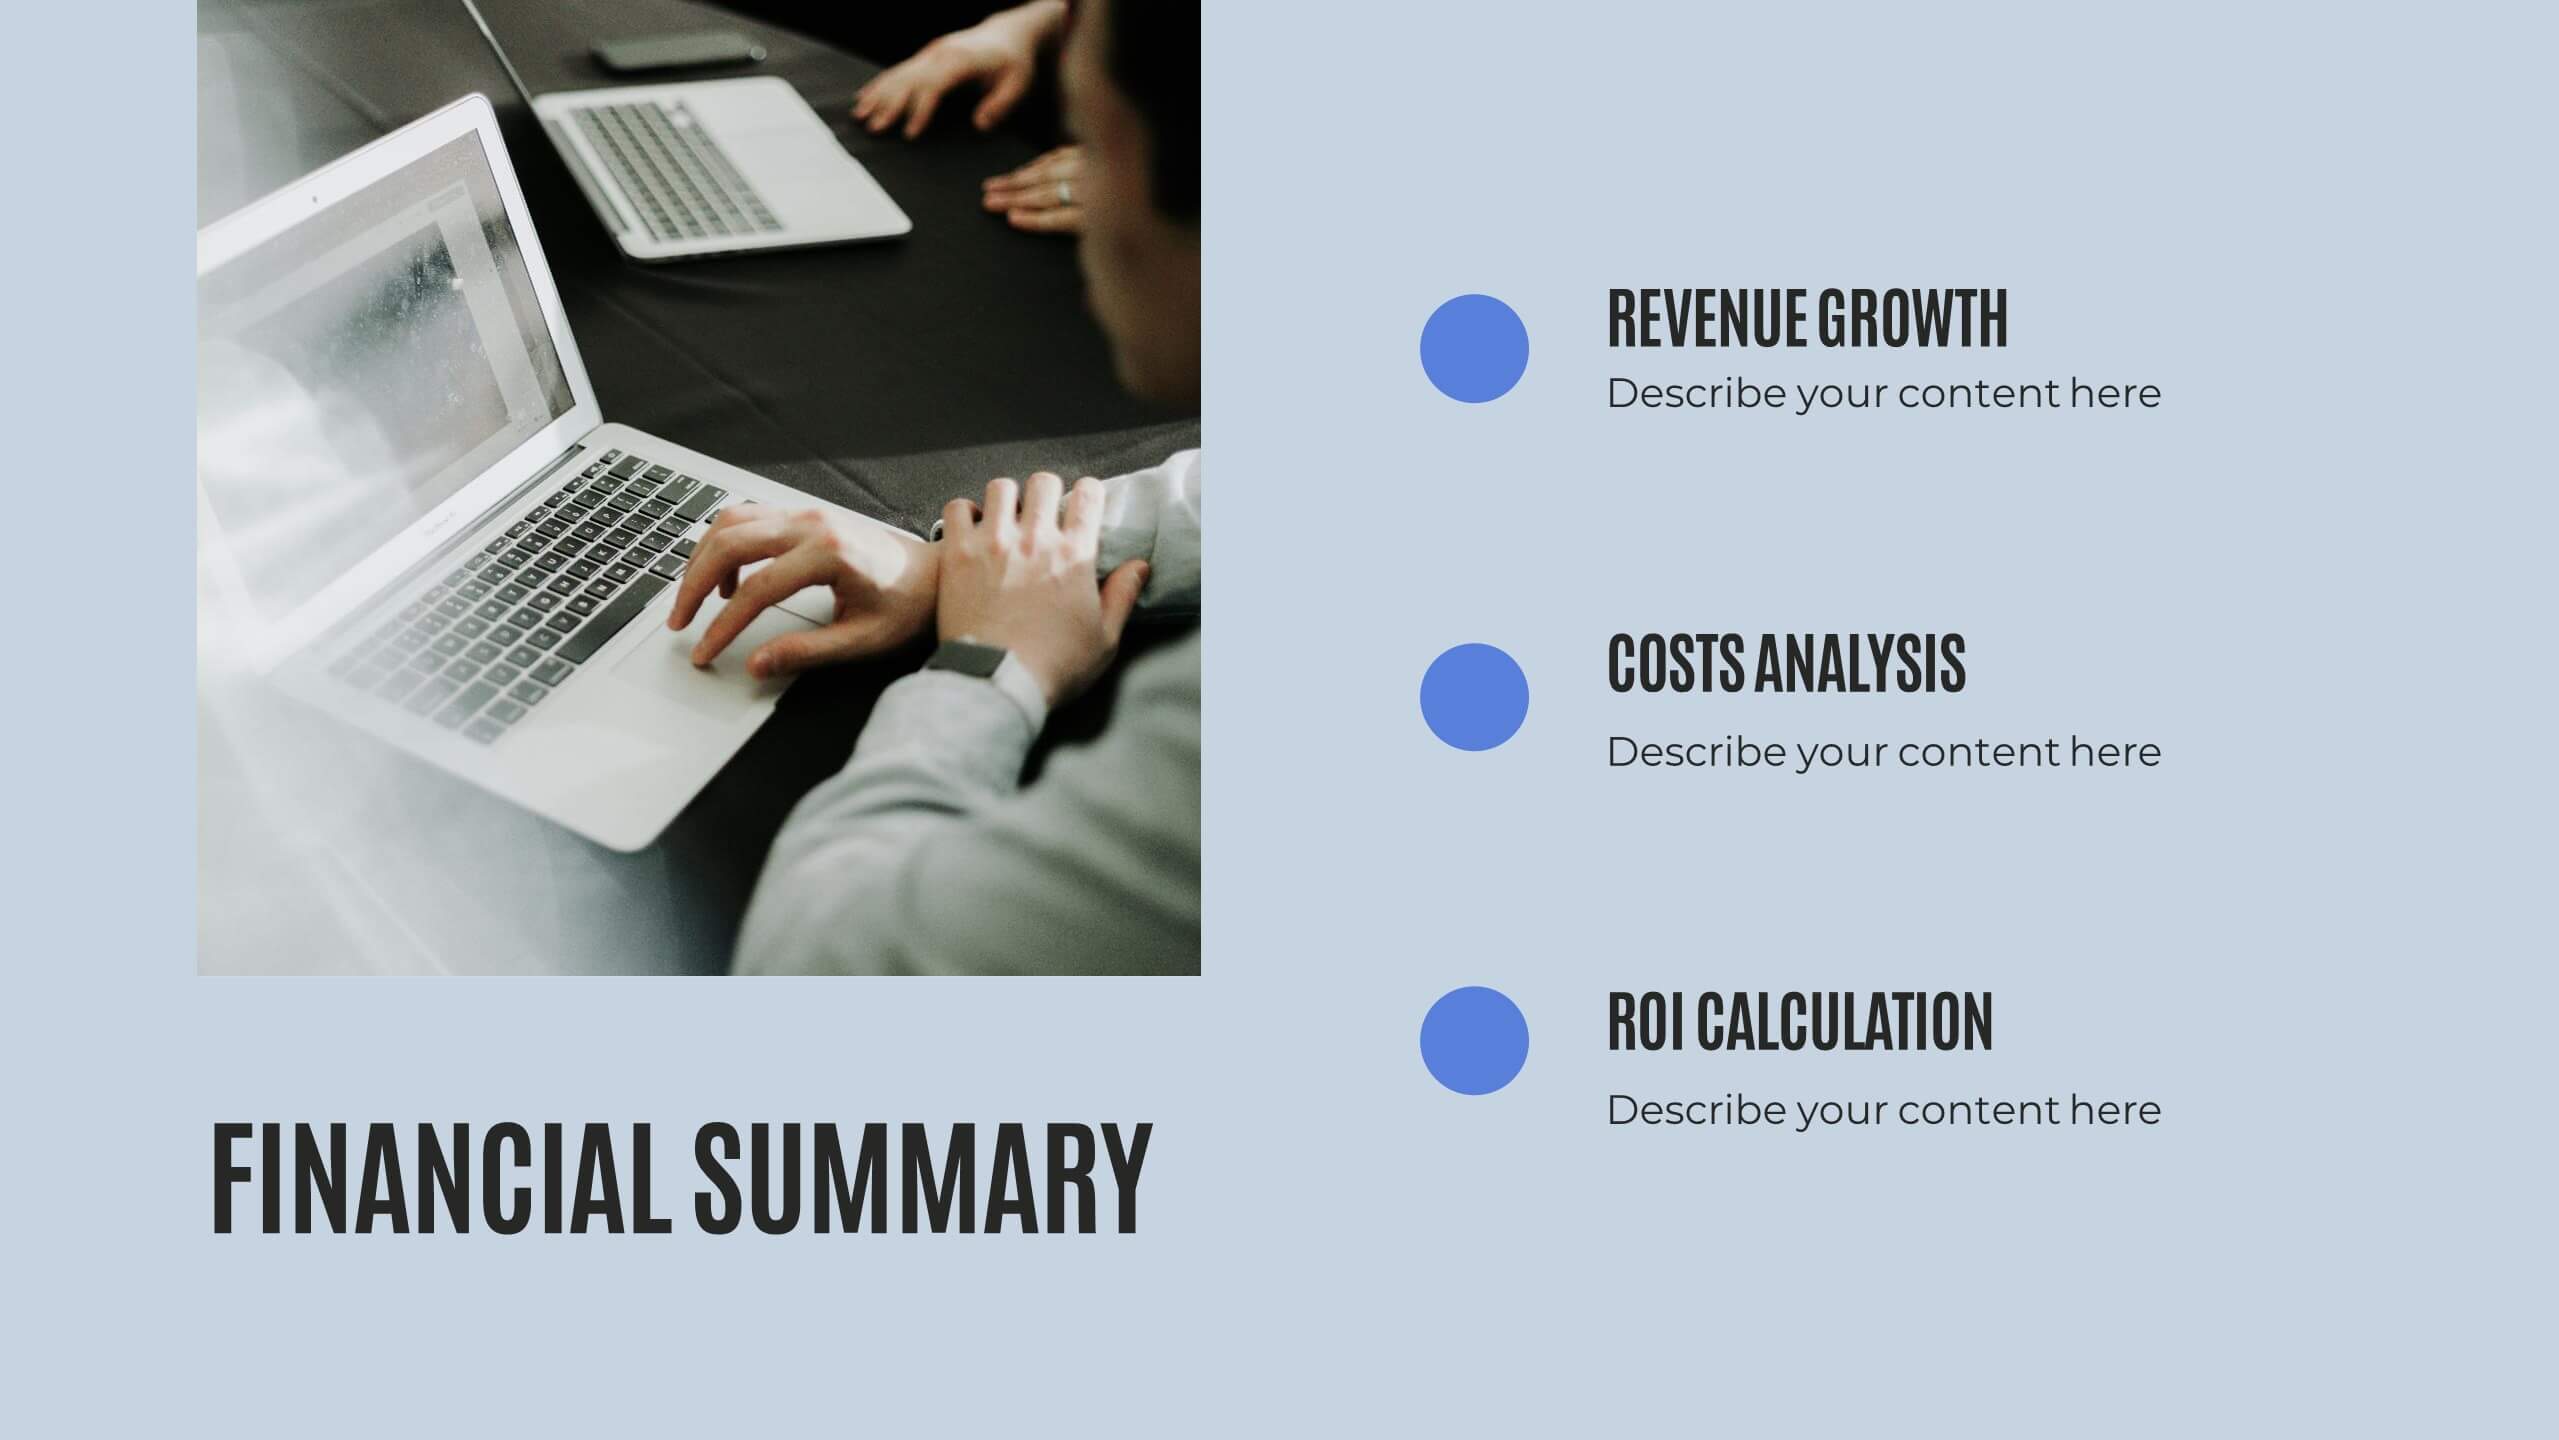
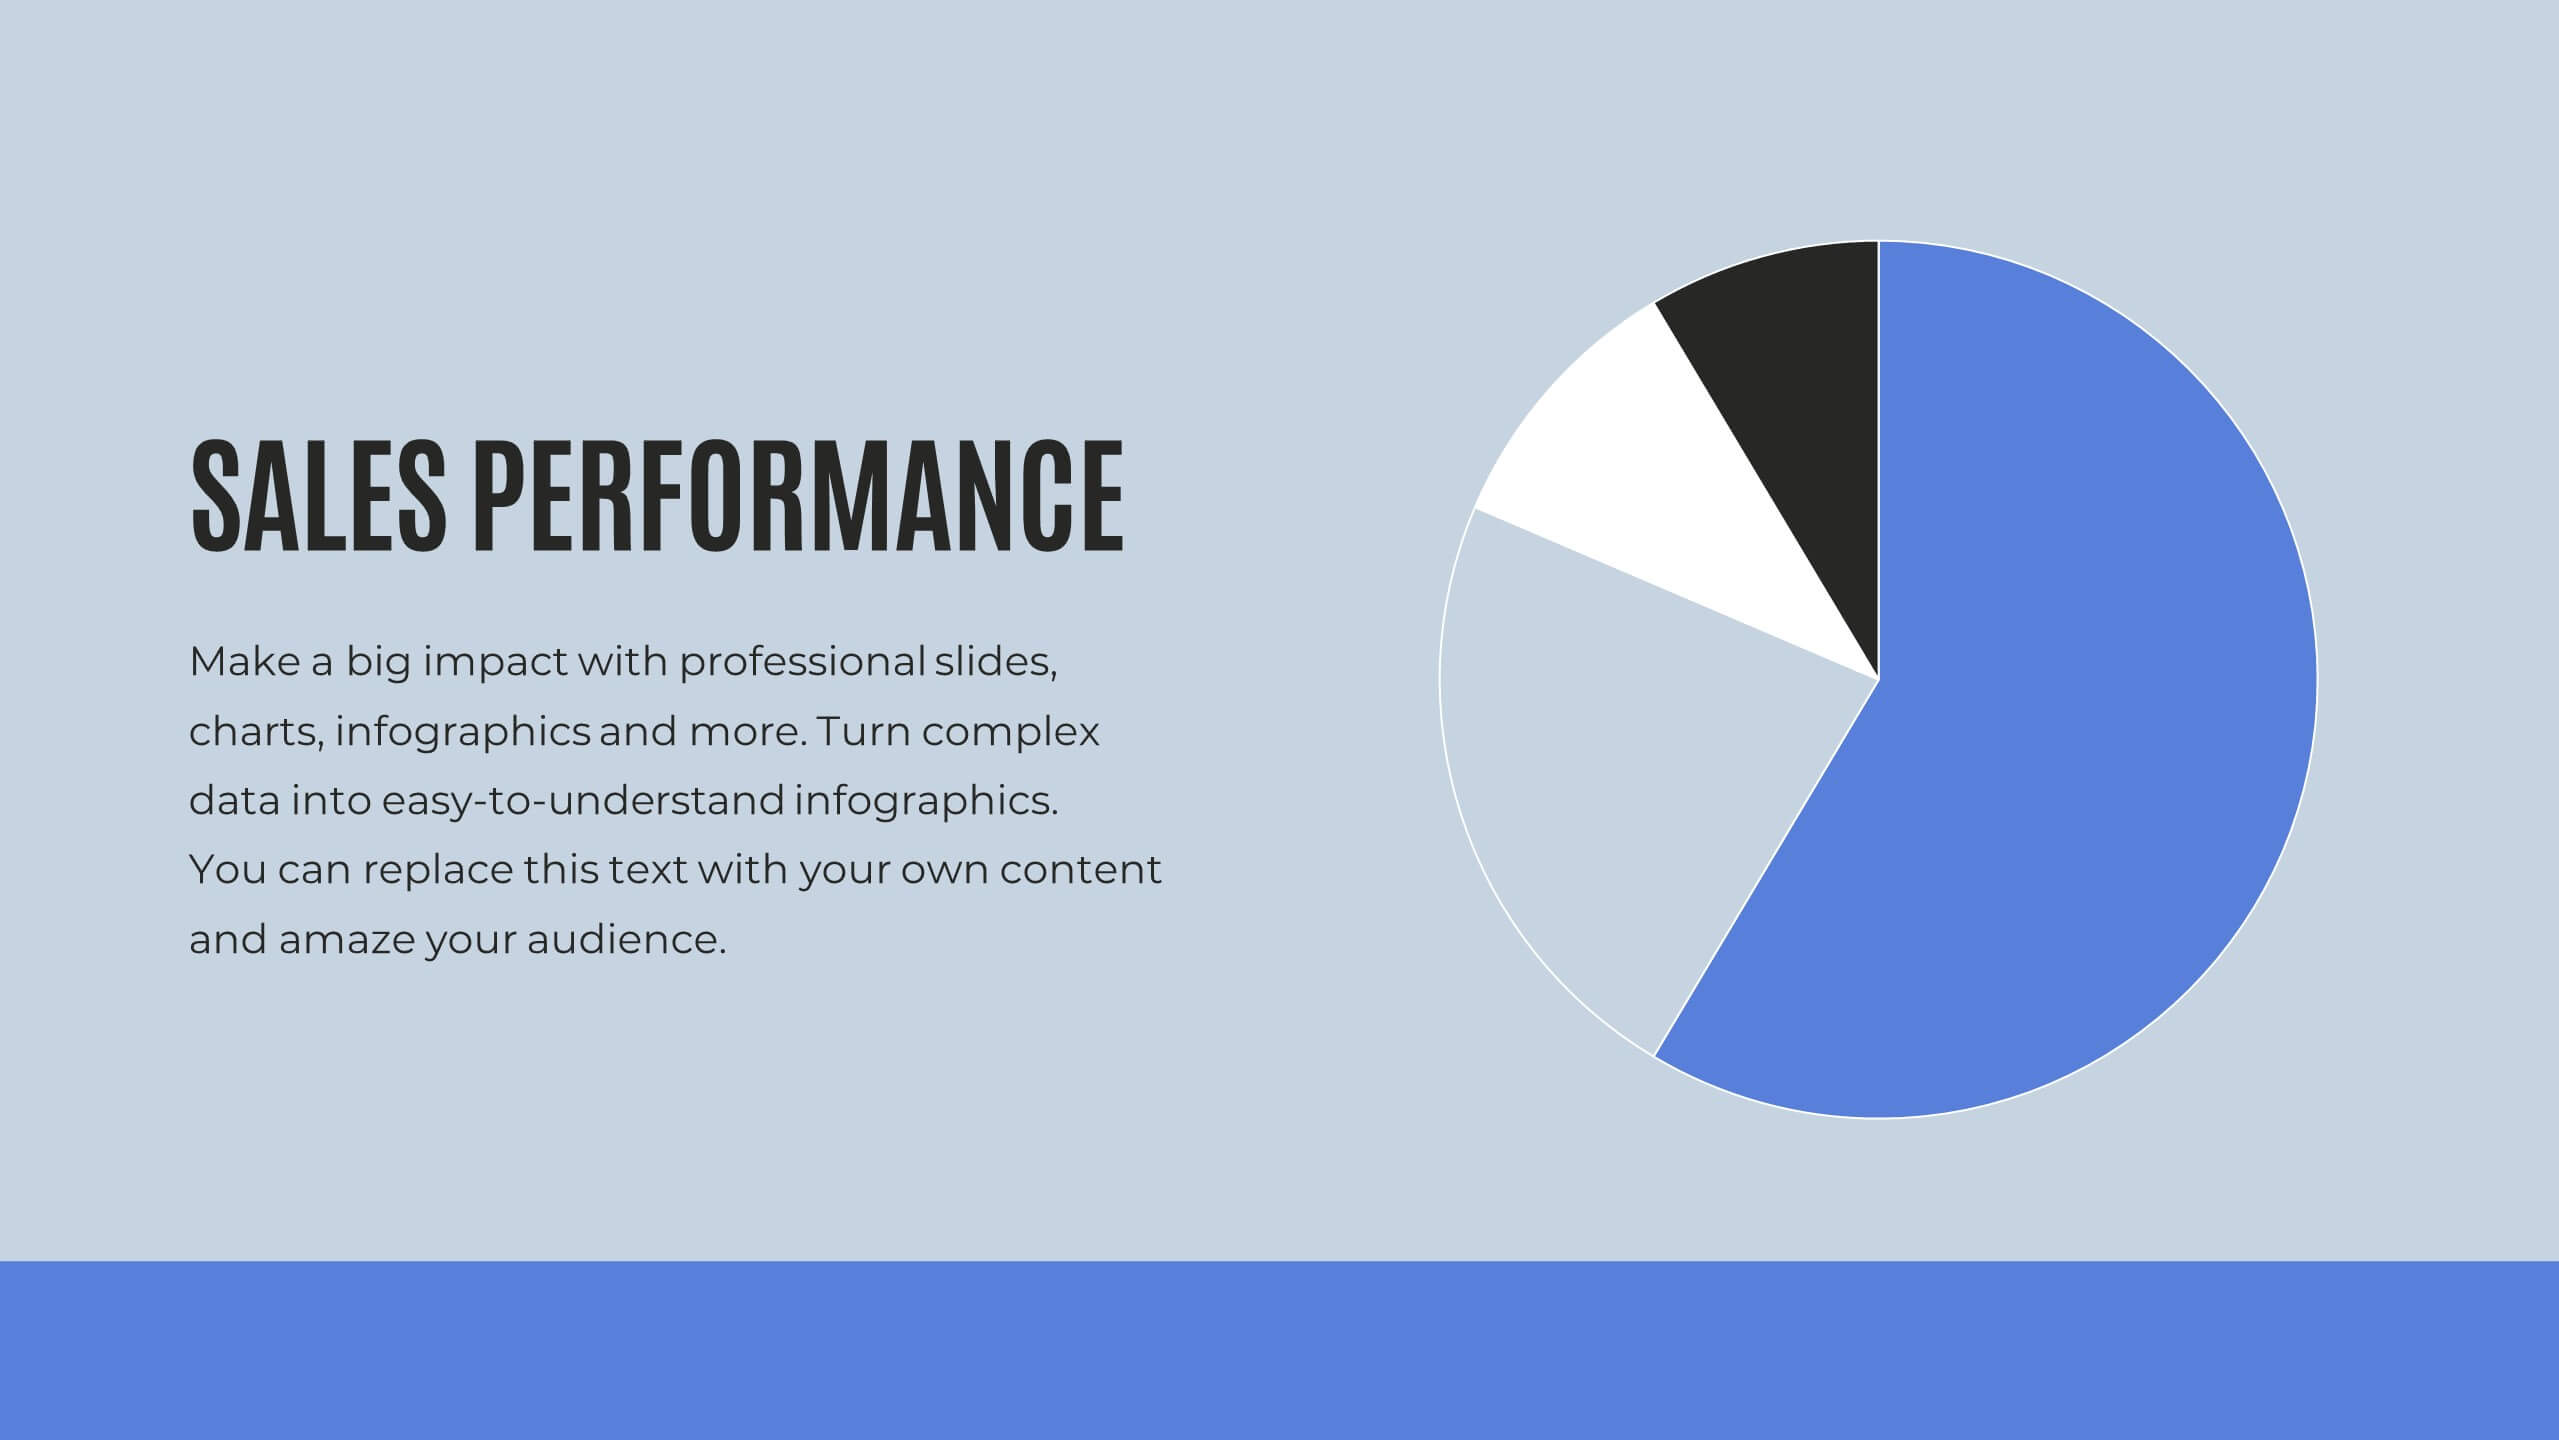
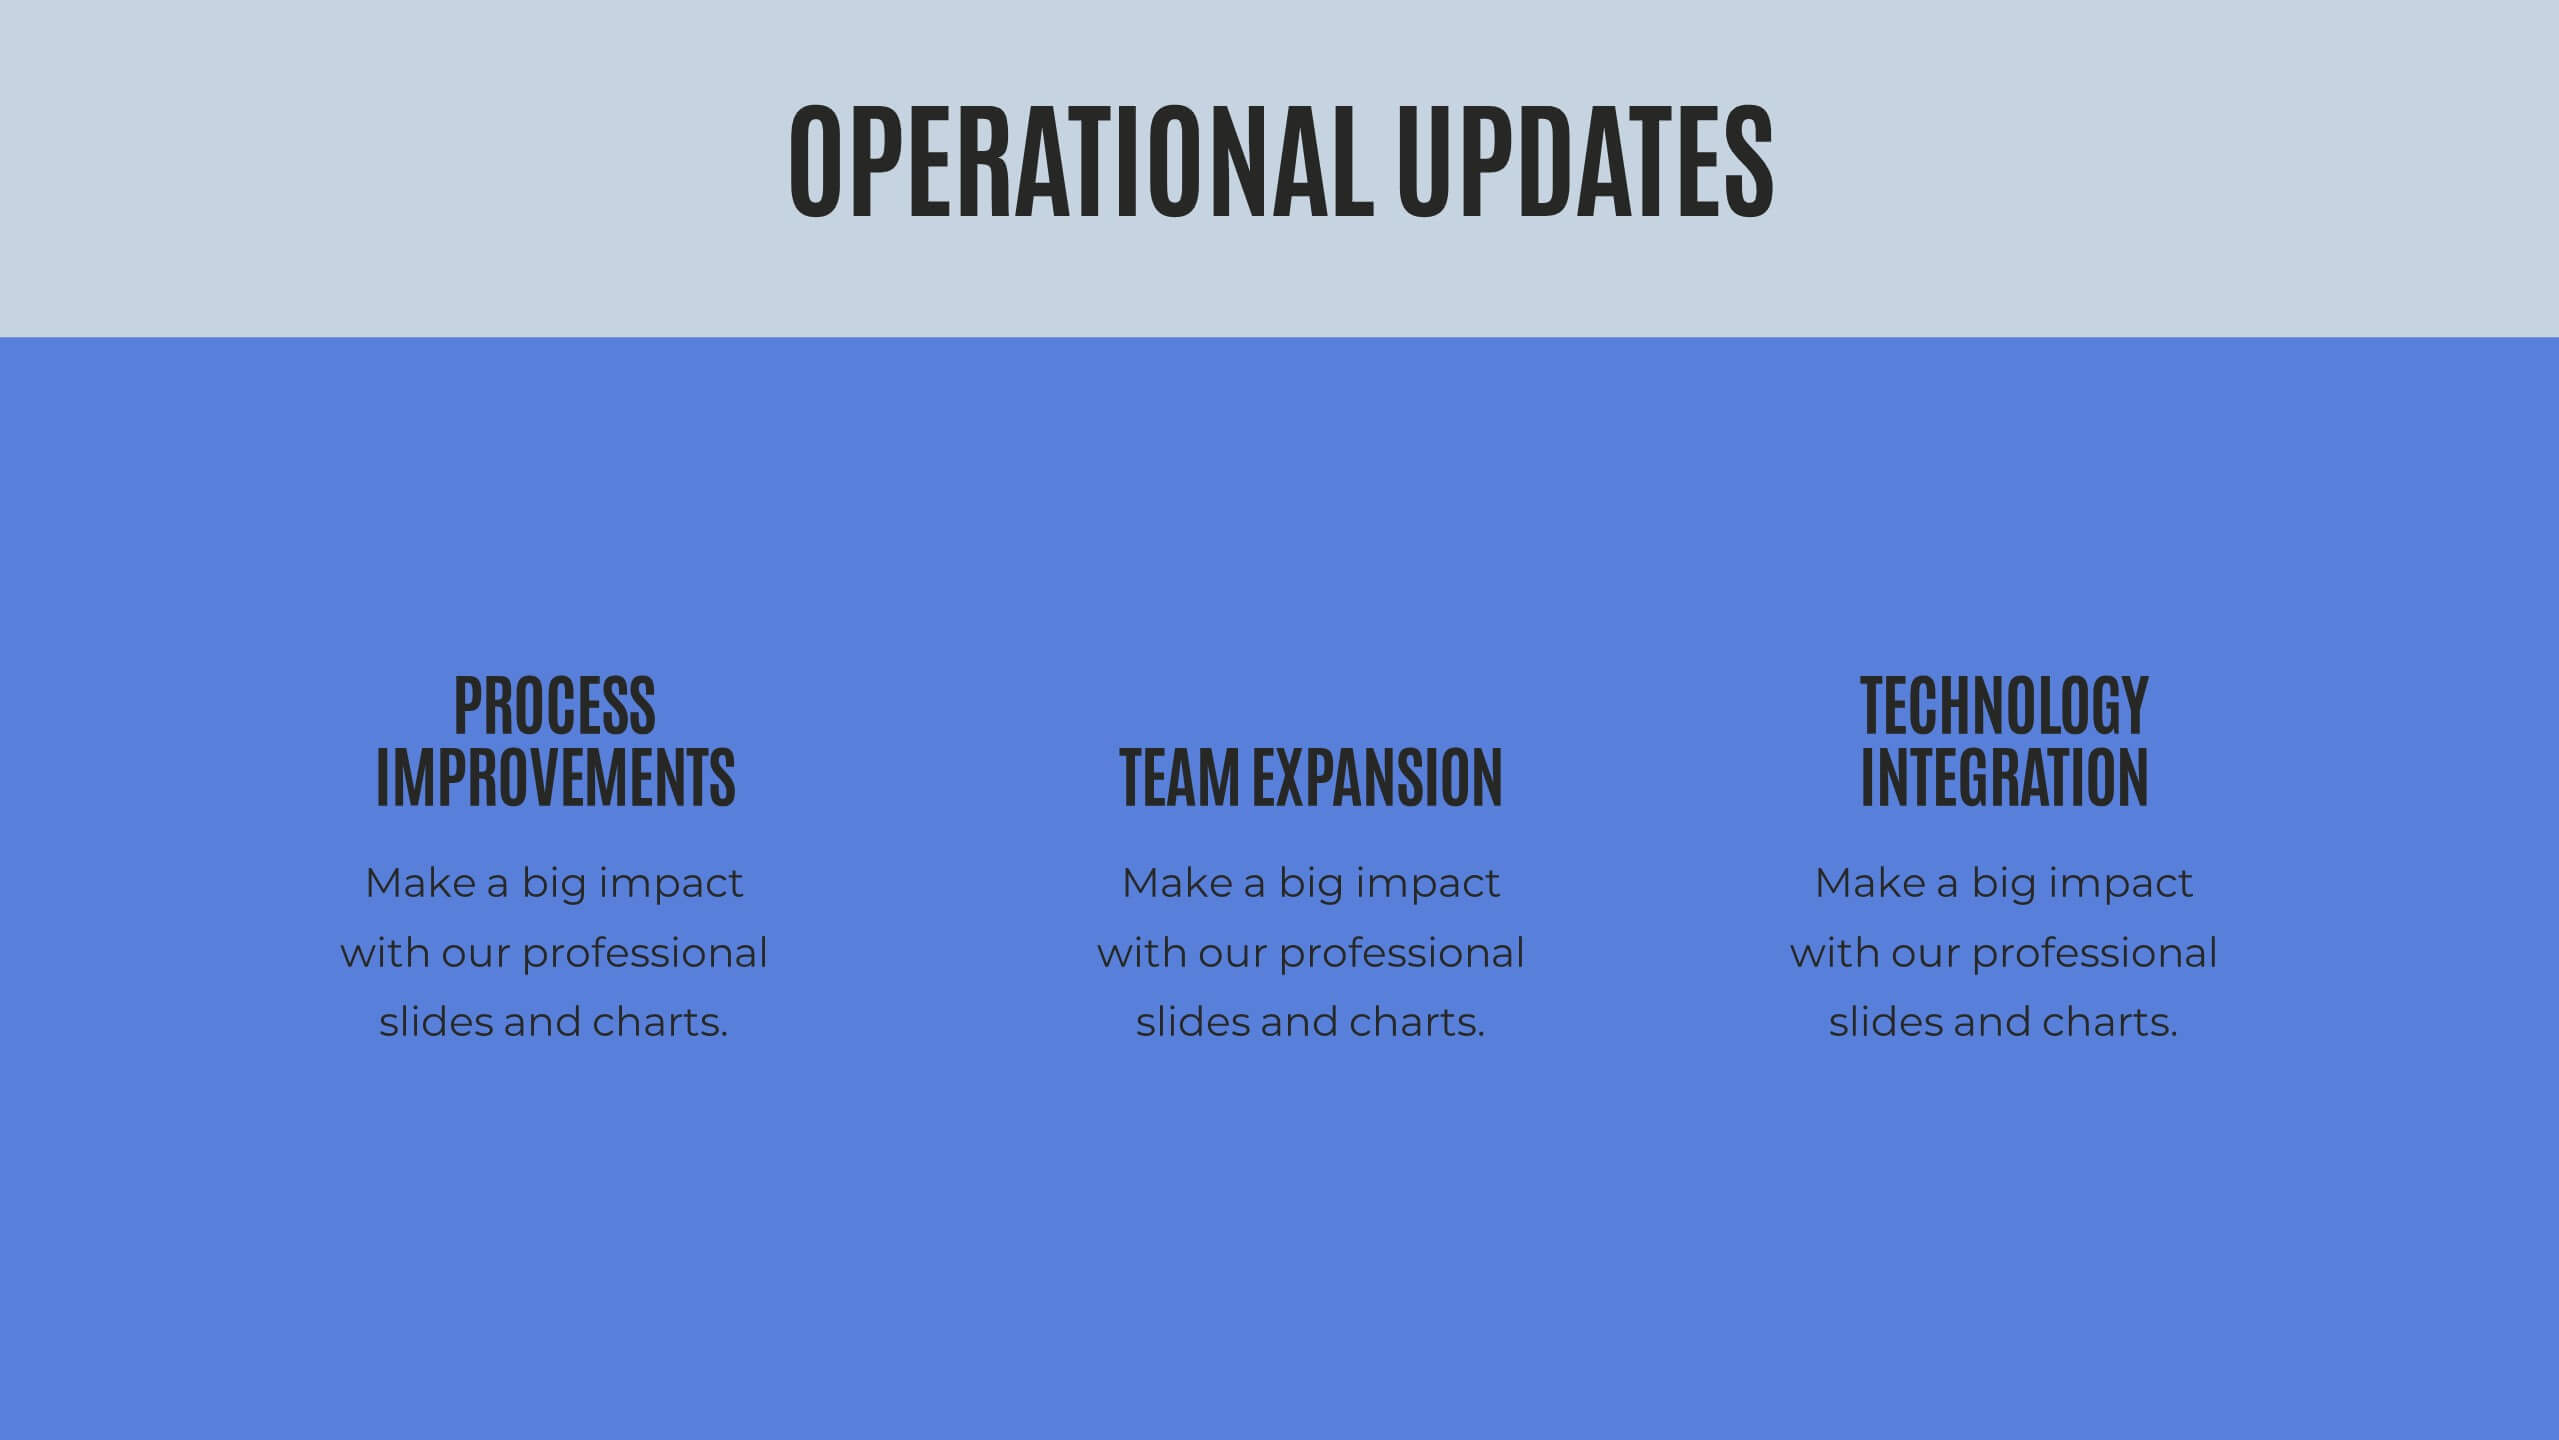
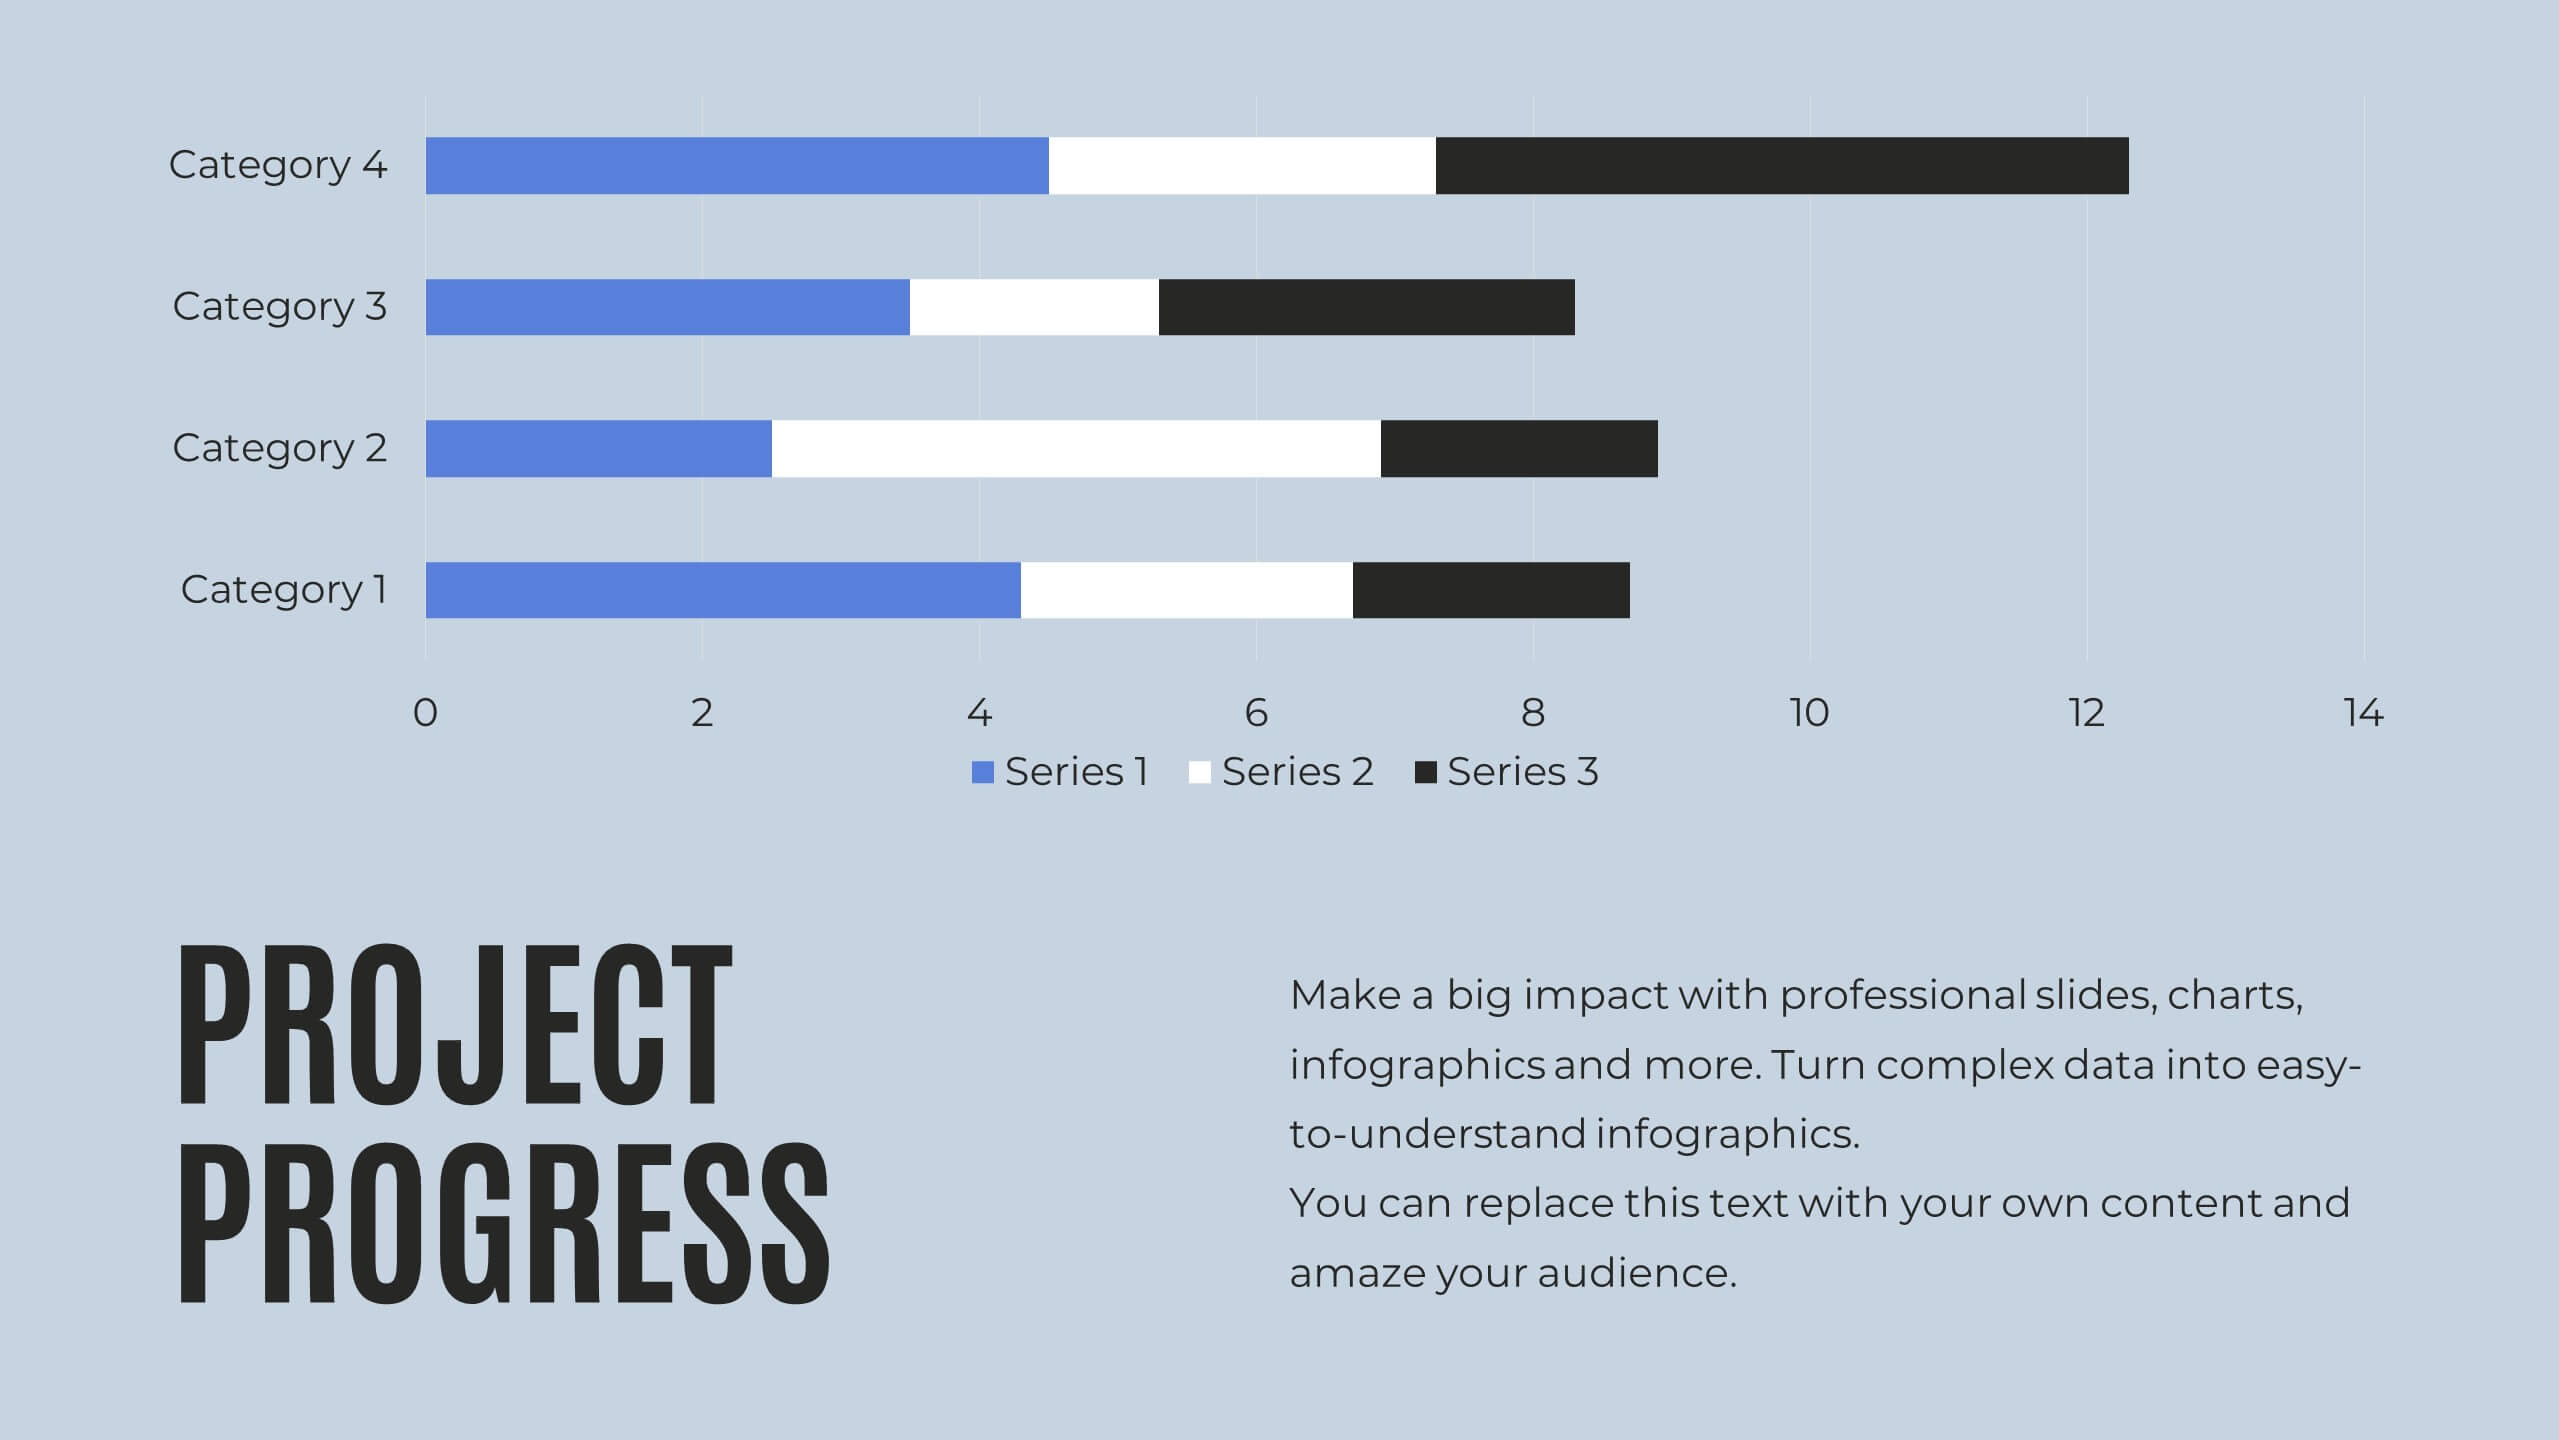
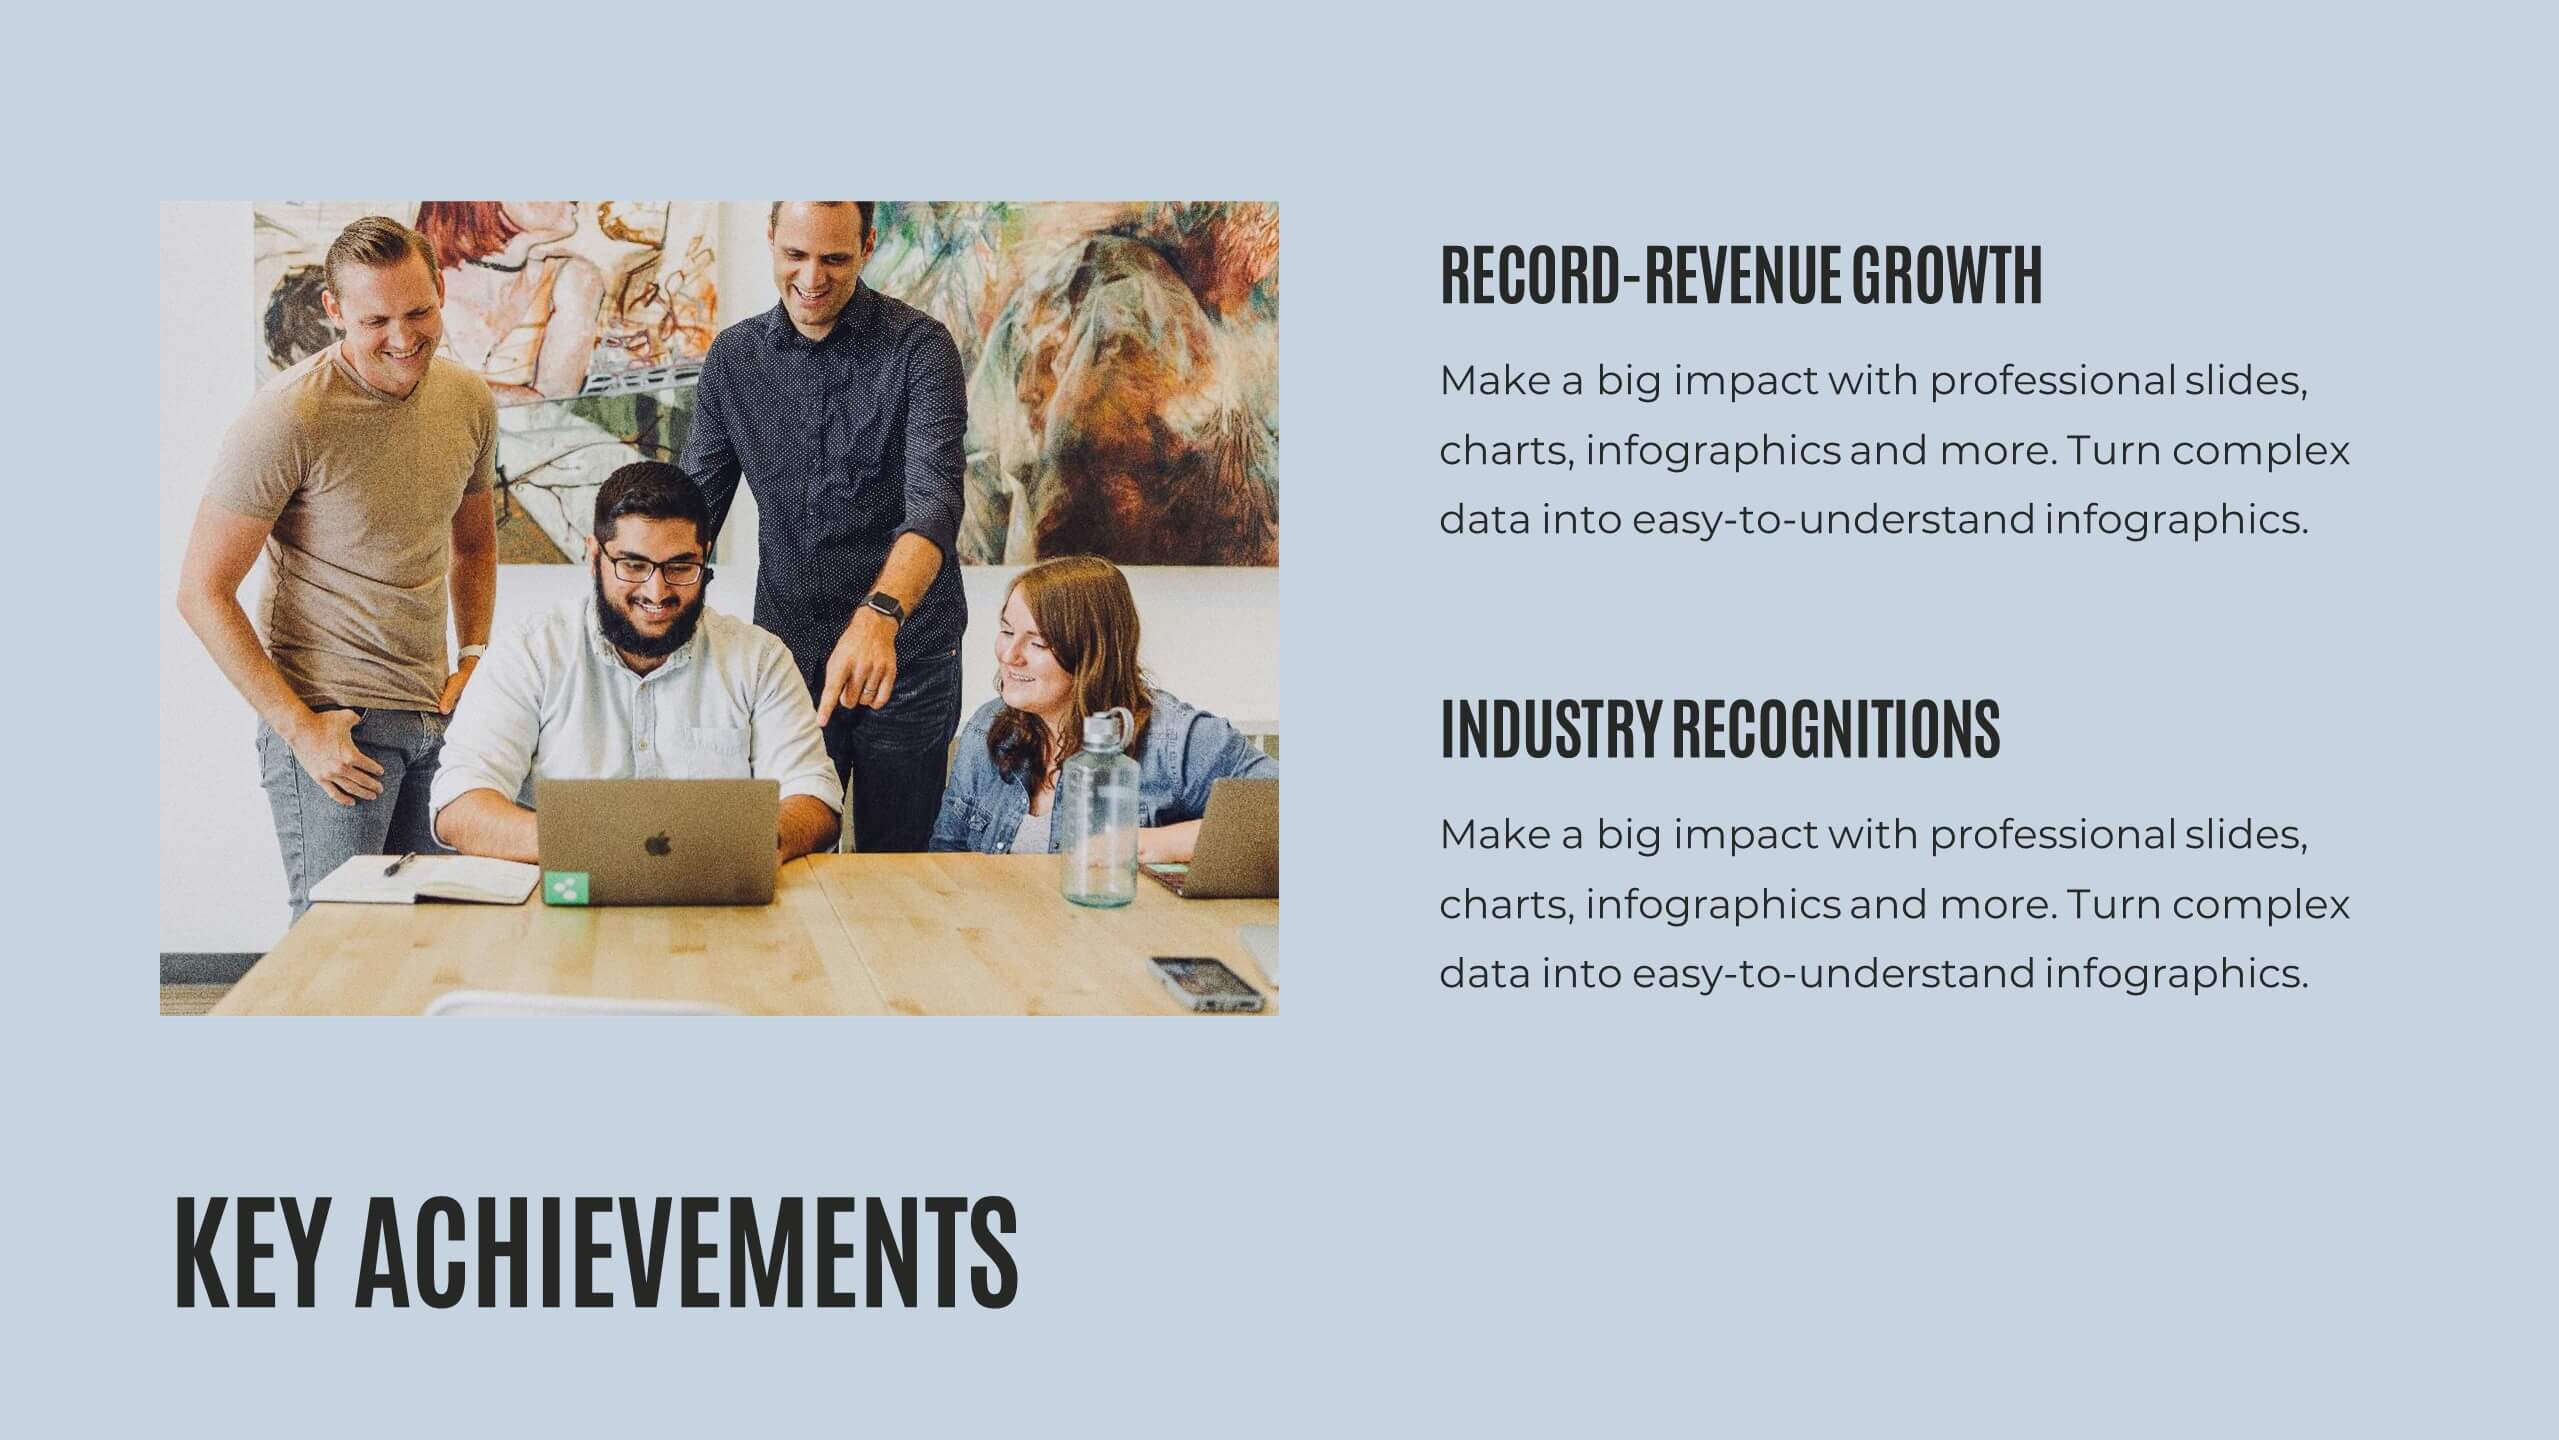
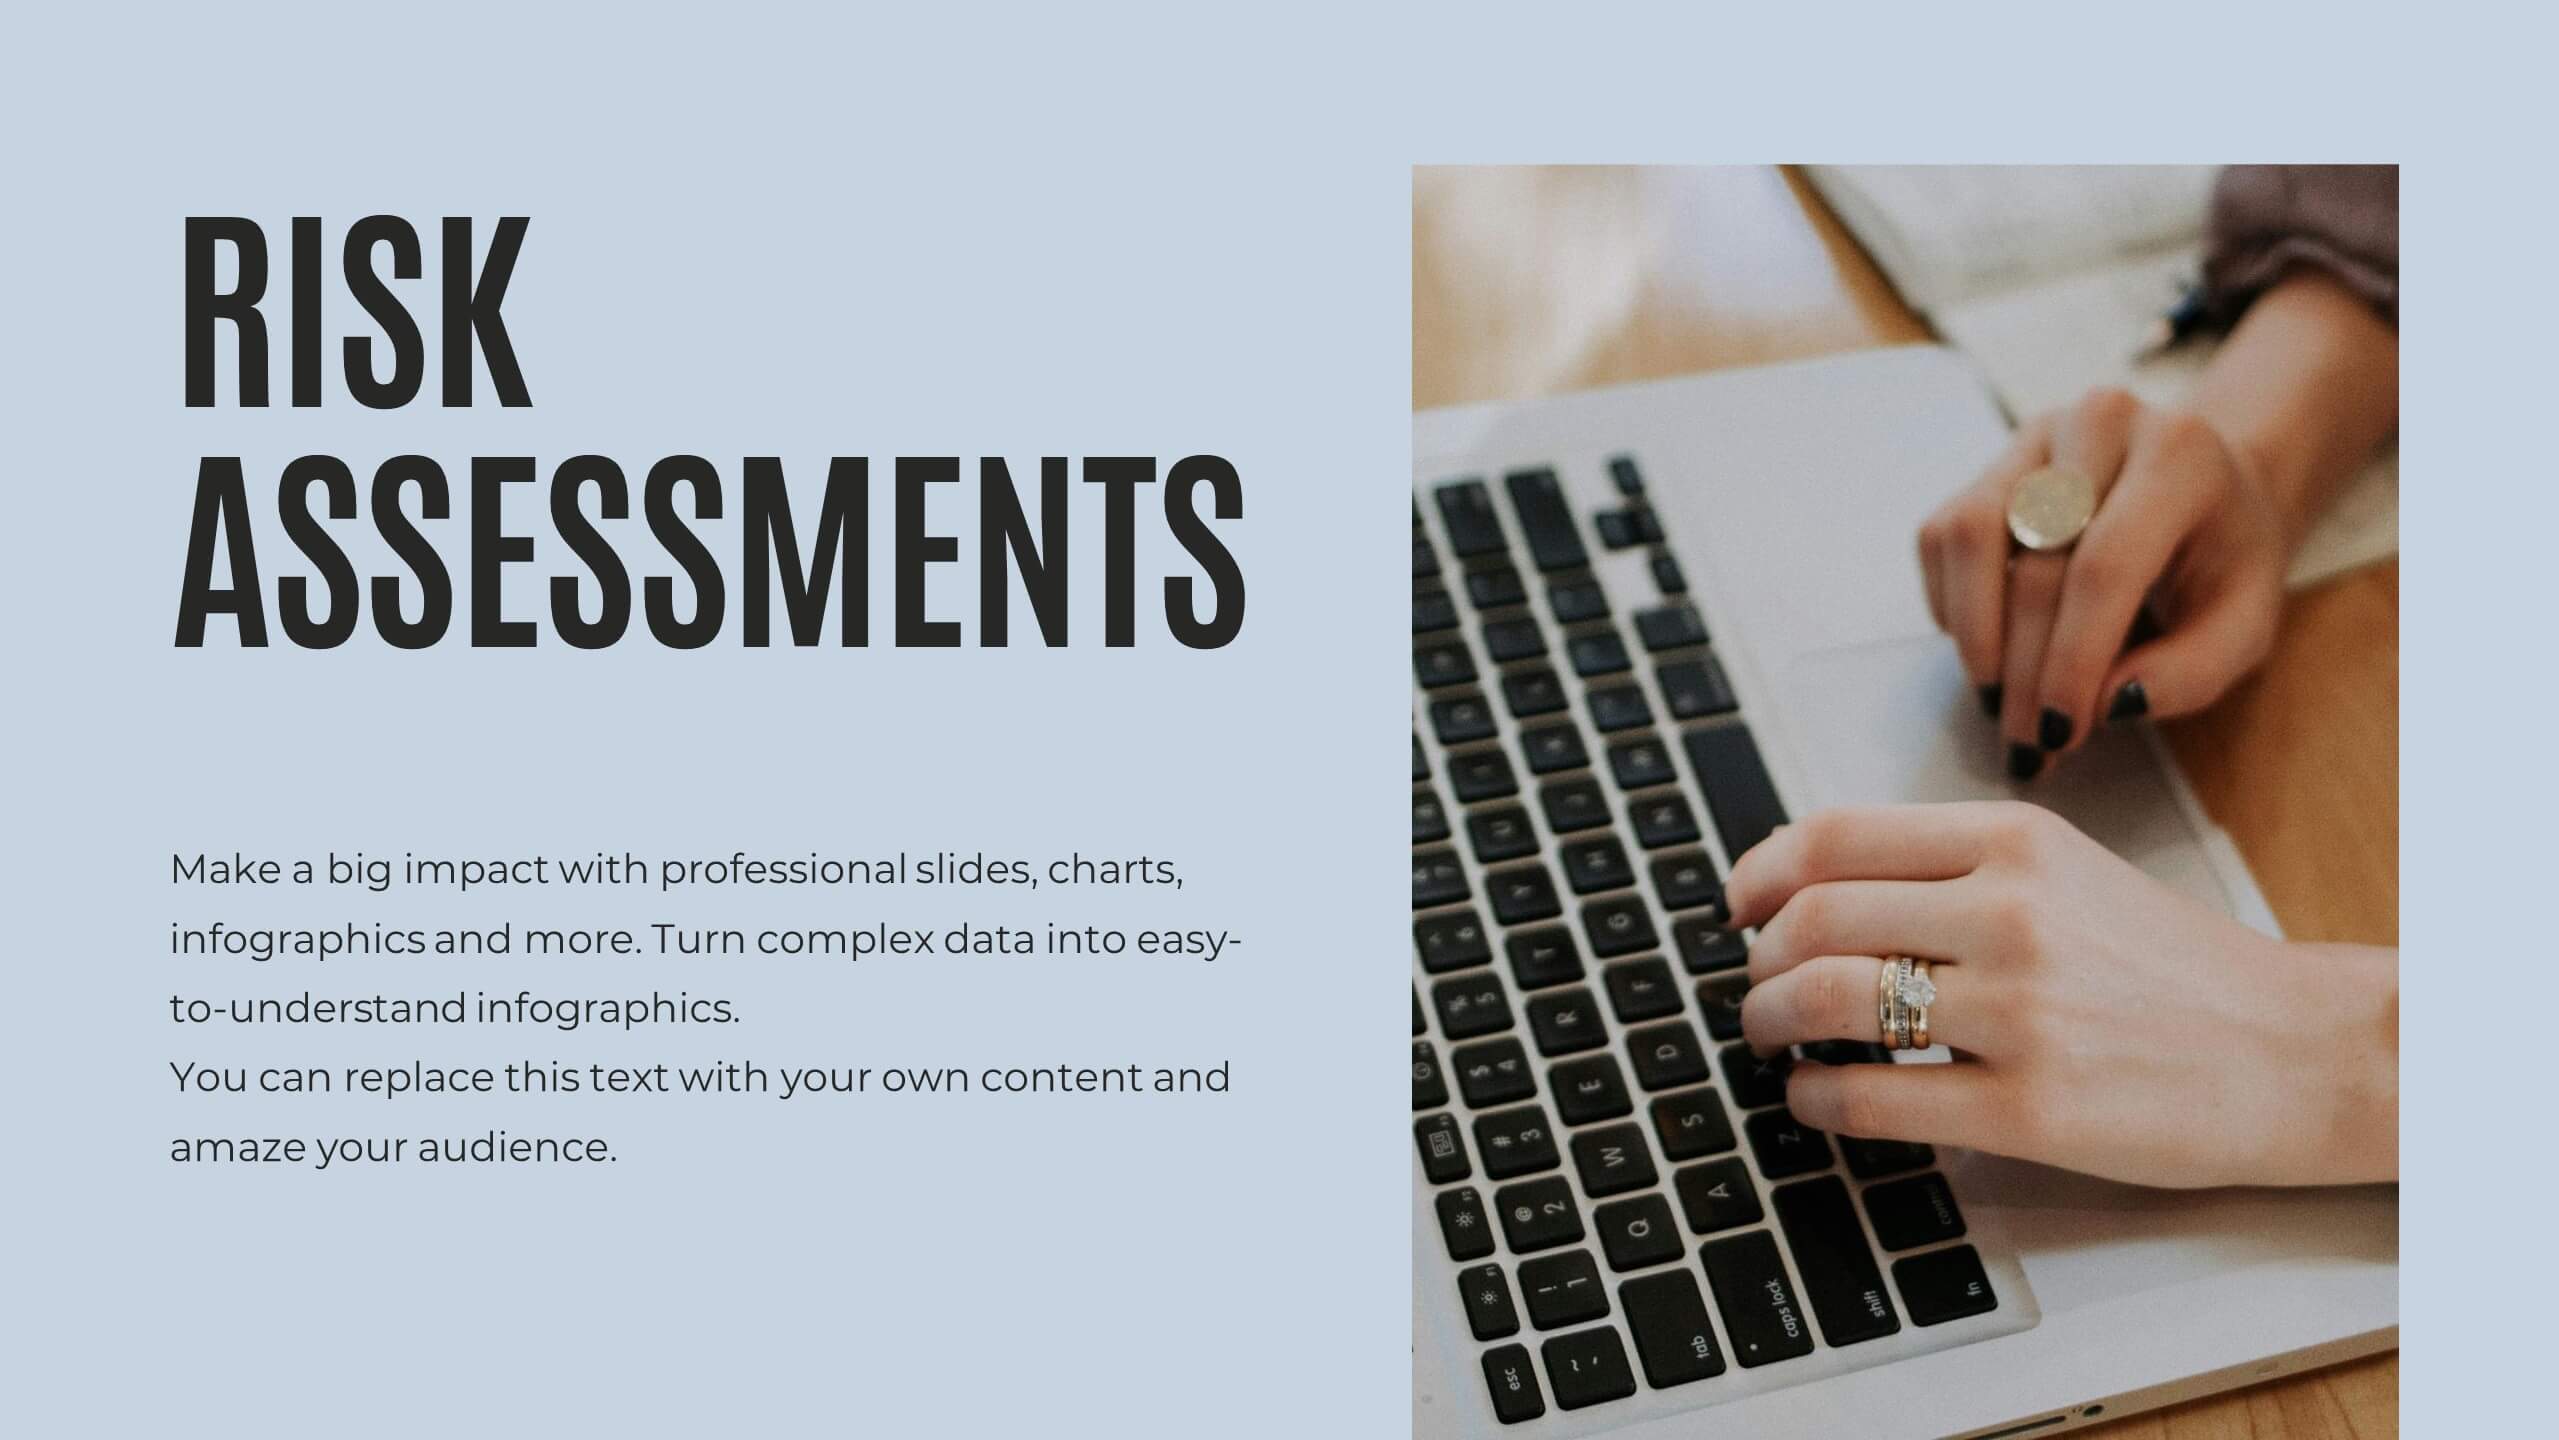
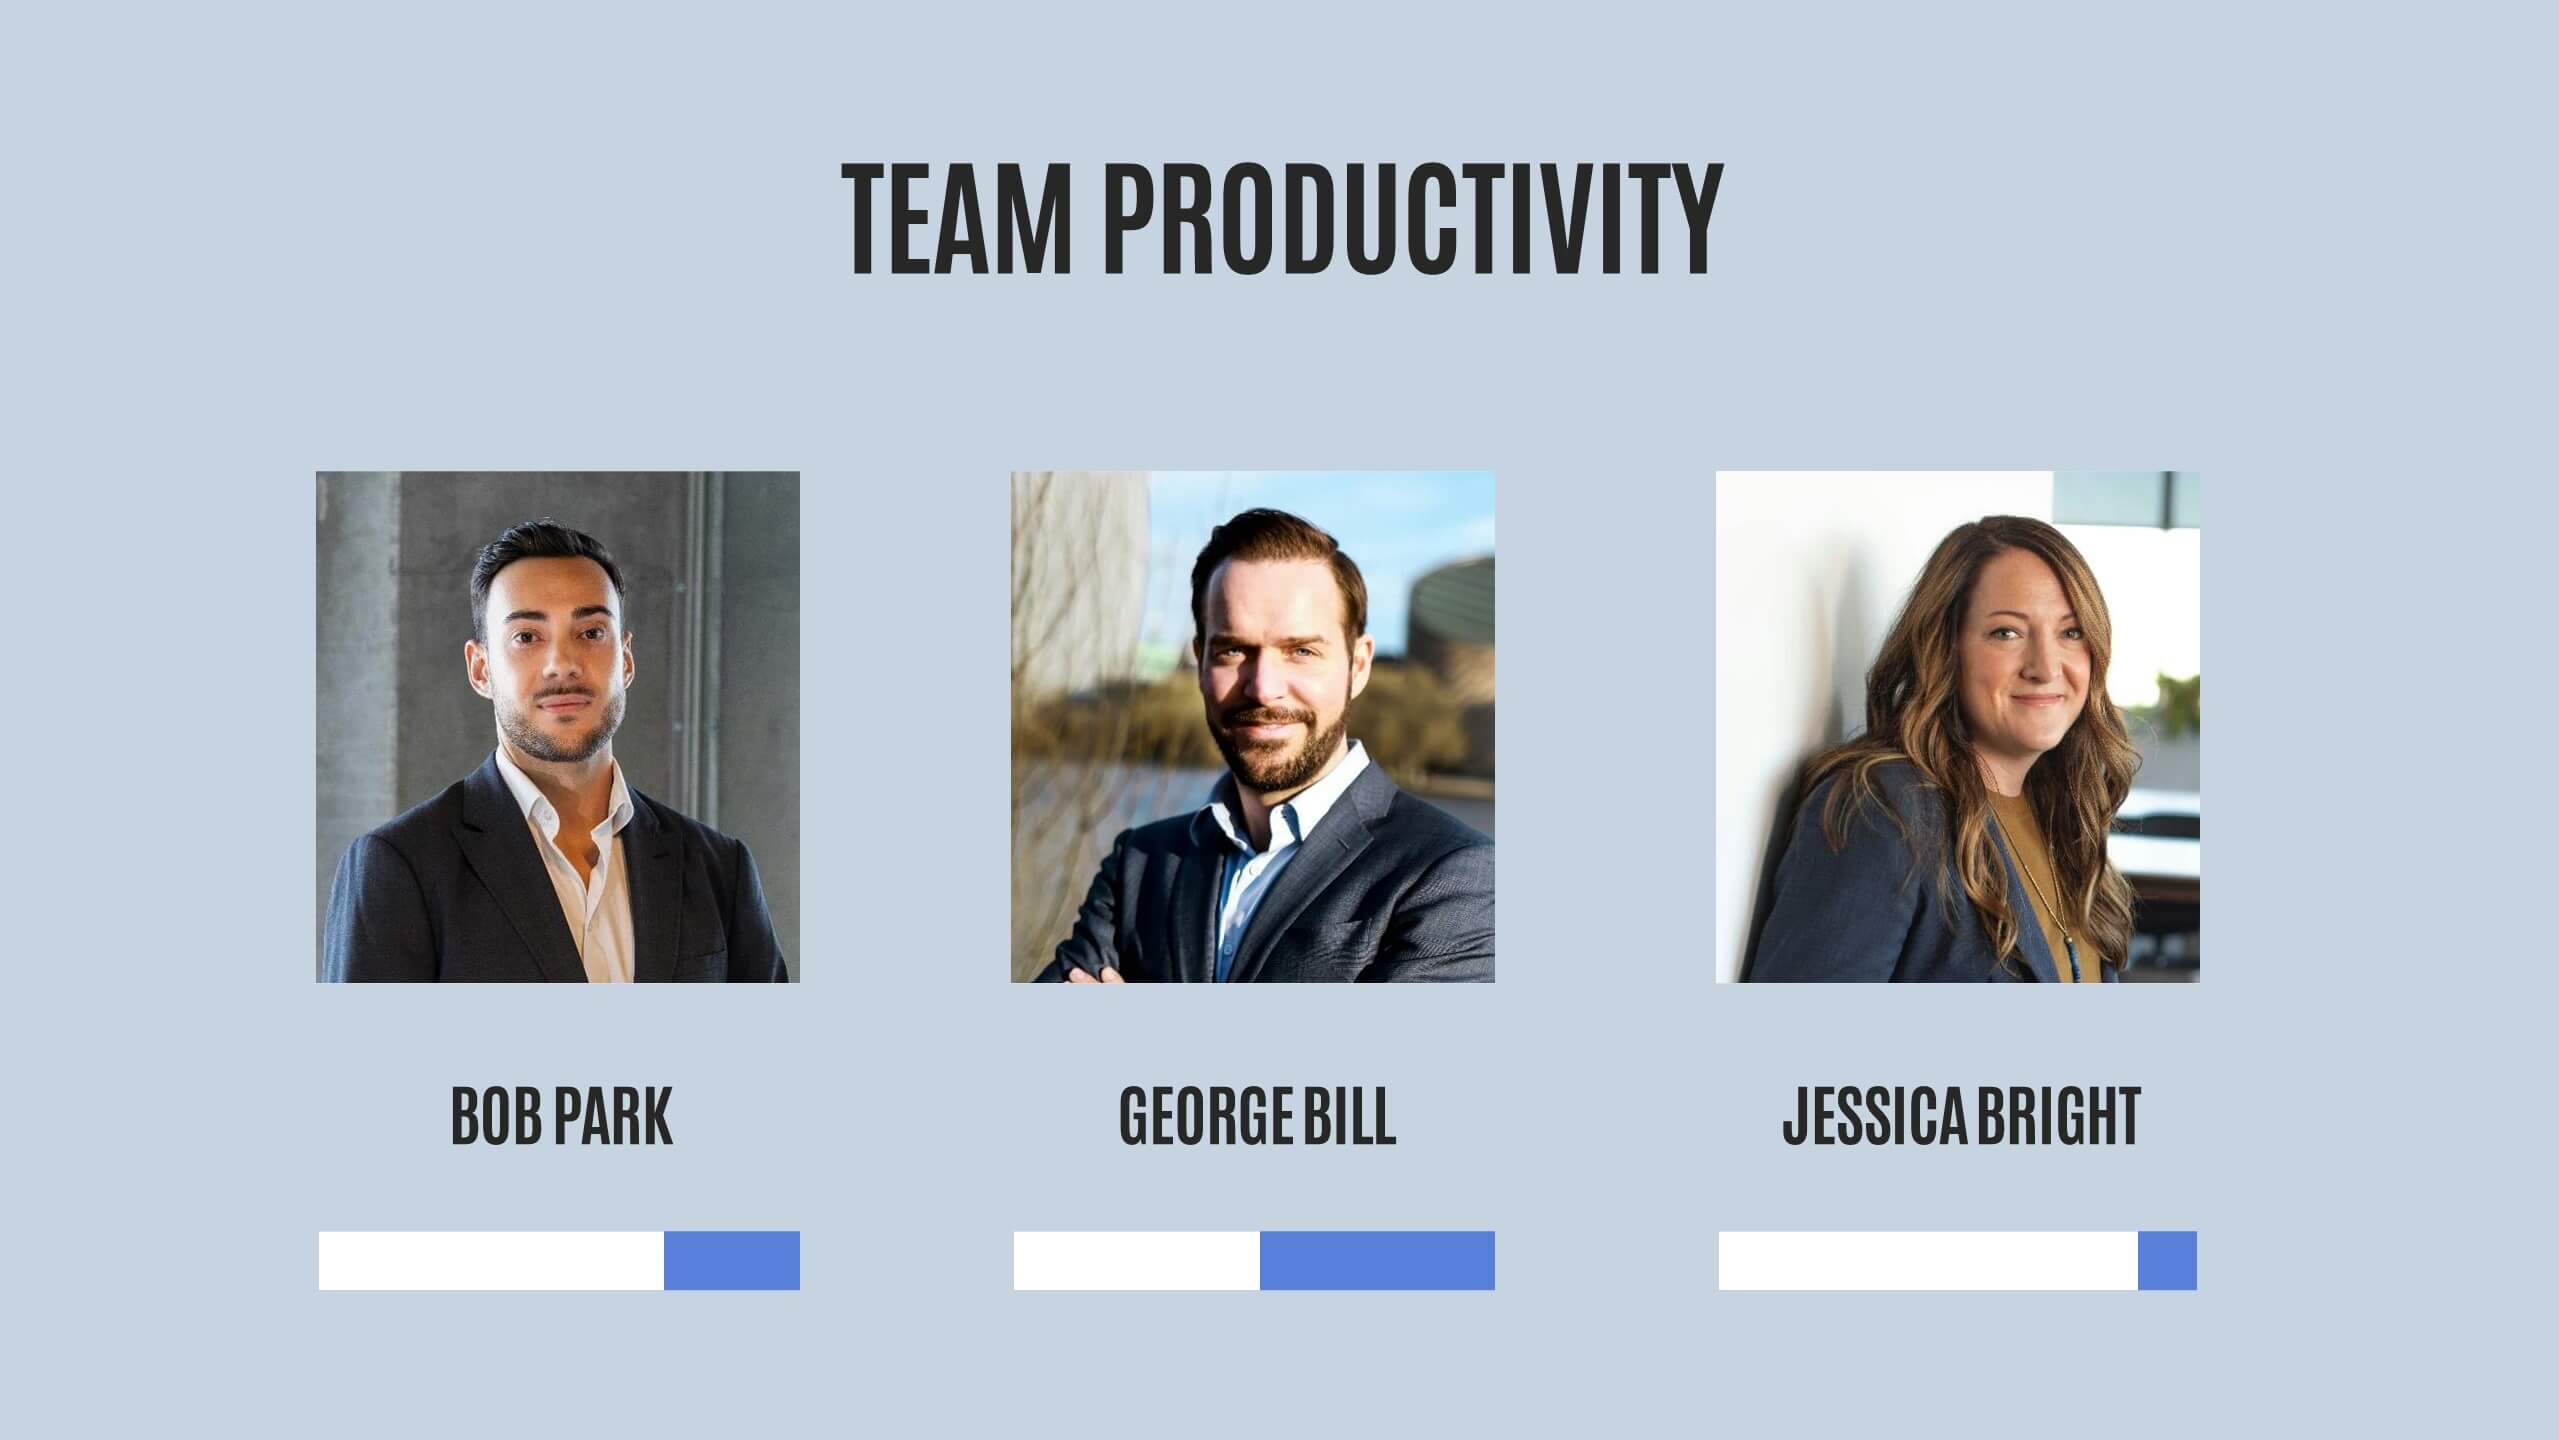
Quill Research Findings Report Presentation
Illuminate your findings with this comprehensive research report template! Perfect for presenting key highlights, performance metrics, and financial summaries, it features professional slides for project progress, risk assessments, and market trends analysis. Engage your audience with clear visuals and detailed content. Compatible with PowerPoint, Keynote, and Google Slides for seamless presentations on any platform.


4 diapositivas
Investment Analysis Finance Presentation
Target your financial insights with this Investment Analysis Finance Presentation. Designed with a bold bullseye diagram and four labeled pointers, this slide helps communicate core focus areas, ROI, risk zones, or asset distribution. Ideal for pitch decks, portfolio reviews, and financial reports. Fully editable in PowerPoint, Keynote, and Google Slides—perfect for analysts, investors, and finance professionals.


6 diapositivas
Business Decision Flow Model Presentation
Make smarter choices with this Business Decision Flow Model presentation. Clearly map out key decisions, steps, and potential outcomes using a structured, color-coded flow. Perfect for strategy reviews, team meetings, and executive briefings. Fully editable in Canva, PowerPoint, and Google Slides for seamless customization.


8 diapositivas
Business Expense and Cost Control
Visualize cost distribution and expense tracking with the Business Expense and Cost Control Presentation. This circular arrow chart is ideal for breaking down four key categories—such as departments, cost centers, or financial strategies—while also displaying percentage-based insights. Fully customizable in PowerPoint, Keynote, and Google Slides, it’s perfect for finance teams, analysts, or consultants needing a visual approach to budget control.


4 diapositivas
Modern Company Profile Layout Presentation
Bring your brand to life with this clean and modern layout built to highlight your company’s mission, values, and team. Its balanced design and easy-to-read sections make every detail stand out beautifully. Fully editable and compatible with PowerPoint, Keynote, and Google Slides for smooth customization and professional presentations.
7 diapositivas
Six Arrow Infographic Presentation
A Arrow infographic is an effective visual tool that can help communicate a process or a series of steps in a clear and engaging way. The arrows represent the sequential flow of steps or actions and text boxes are included to further explain each step. This template includes pre-made layouts so all that is left to do is add your own text, images, and colors. This is a perfect way to communicate your message. With a clean, contemporary look, this template will help you raise awareness about your cause and spread your ideas. This is perfect for any of your business or academic projects!


5 diapositivas
Performance Progress and Achievements Presentation
Showcase your team’s accomplishments and growth over time with this visually engaging bar chart layout. Each performance level is color-coded for clarity and paired with space for concise descriptions. Ideal for reporting KPIs, quarterly wins, or business milestones. Fully customizable in PowerPoint, Keynote, and Google Slides.


6 diapositivas
PESTEL Environment Analysis Infographics
Elevate your strategic analysis presentations with our PESTEL Environment Analysis infographic template. Designed for PowerPoint, Keynote, and Google Slides, this template is a must-have for business strategists, analysts, and students alike. This template efficiently breaks down the complex components of PESTEL analysis - Political, Economic, Social, Technological, Environmental, and Legal factors. Each segment is given its own distinct space, making it easy to input and display your analysis in a clear, organized manner. The sophisticated and educational design of the template ensures that your content is both accessible and engaging. The diverse yet harmonious color palette of the template enhances its visual appeal, reflecting the multifaceted nature of PESTEL analysis. This makes it ideal for detailed presentations where clarity and aesthetics are key. Whether you're presenting to a classroom, a boardroom, or at a conference, this infographic template will help you convey your environmental analysis with professionalism and style.


4 diapositivas
Cost Comparison Analysis Chart Presentation
Turn your price evaluations into something visually compelling with this sleek and modern layout. Perfect for showcasing product features, service packages, or market comparisons, it simplifies decision-making with a clear side-by-side design. Fully editable and compatible with PowerPoint, Keynote, and Google Slides for effortless customization.


24 diapositivas
Copper Small Business Pitch Deck Presentation
Elevate your business presentations with this clean and professional pitch deck template! Ideal for team meetings, business updates, or investor pitches, it includes sections for collaboration opportunities, performance metrics, and process improvements. The layout ensures clarity and focus, making it perfect for effective communication. It’s fully customizable and works seamlessly with PowerPoint, Keynote, and Google Slides for hassle-free integration.