


Características


¿Tienes alguna pregunta?
Recomendar


7 diapositivas
Professional Project Management Infographic Presentation
Project management is the process of planning, organizing, and overseeing resources and tasks to achieve goals and objectives within a defined timeframe. This template includes a clean, eye-catching design with plenty of space to add your content. This infographic template provides a step by step explanation of project management. It's the perfect way to explain complex projects easily to clients and employees. This template is compatible with Powerpoint, keynote and google slides making it easily customizable and editable. Use this for next project management research paper, presentation, etc.


7 diapositivas
Business Concept Mind Map Presentation
Visualize strategic thinking with the Business Concept Mind Map Presentation. This clear, central-diagram layout helps organize six core ideas around a business theme, making complex concepts easy to grasp. Ideal for planning, brainstorming, or presentations. Fully editable and compatible with PowerPoint, Keynote, and Google Slides for maximum flexibility.


7 diapositivas
Travel Agency Infographic
A travel agency is a business that assists individuals or groups in planning, booking, and organizing travel and vacation experiences. This infographic template is designed to showcase the magic of travel and the essential services provided by travel agencies. This template is perfect for inspiring wanderlust and aiding travelers in planning their dream adventures. The primary goal is to make your travel planning process easier and more convenient for your audience. Compatible with Powerpoint, Keynote, and Google Slides. This template is your gateway to a world of exciting adventures and seamless travel planning.


23 diapositivas
Tempest Design Portfolio Presentation
Elevate your creative showcase with the Tempest Design Portfolio Presentation template! This beautifully crafted layout is designed to highlight your best work in a sophisticated and professional manner. The subtle earthy tones and minimalist design create a perfect backdrop for presenting your projects, from the initial concept to the final execution. Whether you're an individual designer or a creative agency, this template allows you to elegantly present your portfolio, philosophy, and style, making a powerful impact on your audience. Each slide is thoughtfully designed to emphasize your achievements, client testimonials, and services offered, ensuring that your work shines through with clarity and style. Ideal for client presentations, creative pitches, or showcasing your portfolio online, this template is fully compatible with PowerPoint, Keynote, and Google Slides. Make your design story unforgettable with the Tempest template, and let your creativity speak volumes!


6 diapositivas
Forecasting Budget Methods Infographics
Enhance your budget forecasting strategies with our Forecasting Budget Methods infographic template. This template is fully compatible with popular presentation software like PowerPoint, Keynote, and Google Slides, allowing you to easily customize it to meet your specific financial planning needs. The Forecasting Budget Methods infographic template provides a structured framework for illustrating various budgeting techniques, such as top-down, bottom-up, zero-based budgeting, and more. Whether you're a financial analyst, business owner, or involved in financial planning, this template offers a user-friendly platform to create informative presentations and educational materials. Improve your financial decision-making with this SEO-optimized Forecasting Budget Methods infographic template, thoughtfully designed for clarity and ease of use. Customize it to showcase the strengths and applications of different budgeting methods, helping you make informed financial forecasts and achieve your financial goals. Start crafting your personalized infographic today!


4 diapositivas
Corporate Planning and Analysis Presentation
Simplify strategic discussions with this Corporate Planning and Analysis Presentation. Featuring a circular 4-piece puzzle diagram, each section highlights a different business focus area using icons and color coding. Ideal for illustrating synergy between departments or initiatives. Fully customizable in PowerPoint, Keynote, and Google Slides.


6 diapositivas
Execution Phase and Follow-up Steps Presentation
Make your process crystal clear with the Execution Phase and Follow-up Steps Presentation. Featuring a dynamic six-step linked chain design, this template is ideal for showcasing sequential workflows, project lifecycles, or task dependencies. Each step is color-coded with icons to enhance clarity and engagement. Fully customizable in PowerPoint, Keynote, and Google Slides.


7 diapositivas
3D Infographic Presentation Template
Featuring our 3D Infographic template this is a great way to present data and showcase ideas. This template features vibrant colors, modern fonts and an attractive design to engage your audience. This will help impress your customers and get better conversion. All objects are in place and well organized, so it’s easy to change the text or replace text with your own. This template is a highly customizable, fully responsive and interactive. This template is an ideal choice to create an infographic-based presentation or product launch, it provides different options for you to customize.


6 diapositivas
Fishbone Concept Infographic
Dissect complex issues with our Fishbone Concept Infographic, ideal for Powerpoint, Google Slides, and Keynote. This infographic, also known as the Ishikawa or cause-and-effect diagram, is designed for problem-solving and root cause analysis. This template features a series of branching arrows leading to a central spine, enabling you to map out multiple cause-and-effect relationships. Each ‘bone’ represents a category of causes that you can customize to fit your specific analysis needs. With this fishbone infographic, you can effectively organize and present complex data, making it easier for your audience to understand and engage with the content of your presentation.


6 diapositivas
Future Trends in Tech Presentation
Forecast innovation with clarity using this Future Trends in Tech Presentation. Designed with a modern silhouette head and brain visualization, this slide emphasizes key trend comparisons using icon-labeled callouts and bold percentage highlights. Ideal for tech forecasting, AI adoption, or market prediction topics. Fully editable in PowerPoint, Keynote, and Google Slides—available in both light and dark modes.


4 diapositivas
Operational Flow Mapping and Control Presentation
Streamline complex processes with the Operational Flow Mapping and Control Presentation. This template uses a clear, hierarchical layout to visualize workflows, decision points, and operational branches. Ideal for SOPs, business systems, or process improvement plans. Fully editable in Canva, PowerPoint, and Google Slides to fit any project or team need.

22 diapositivas
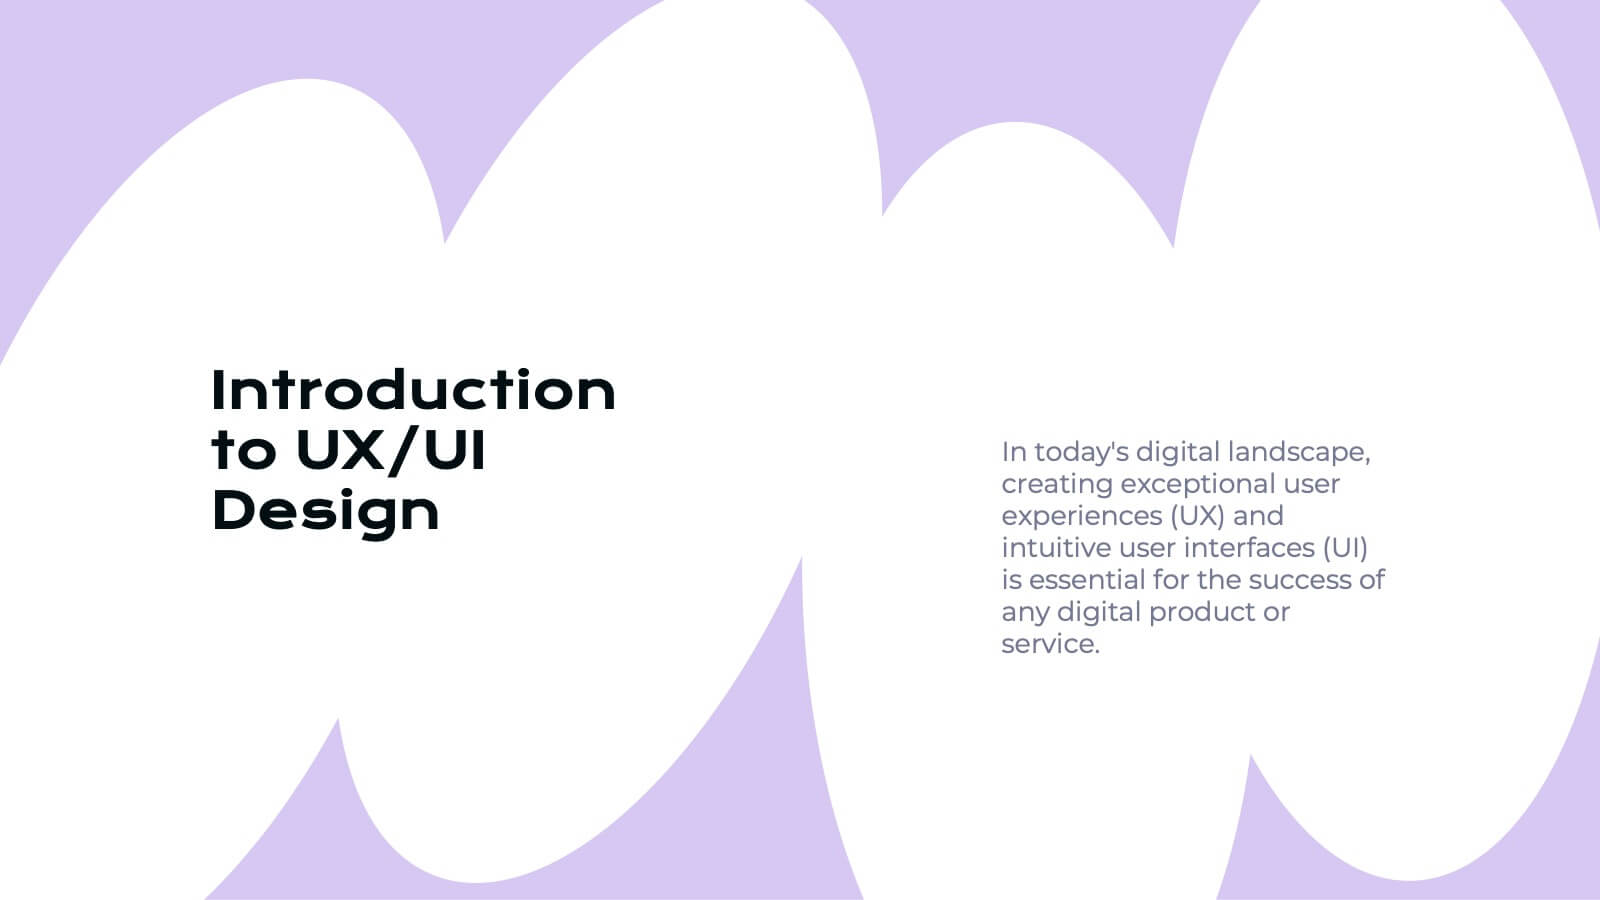
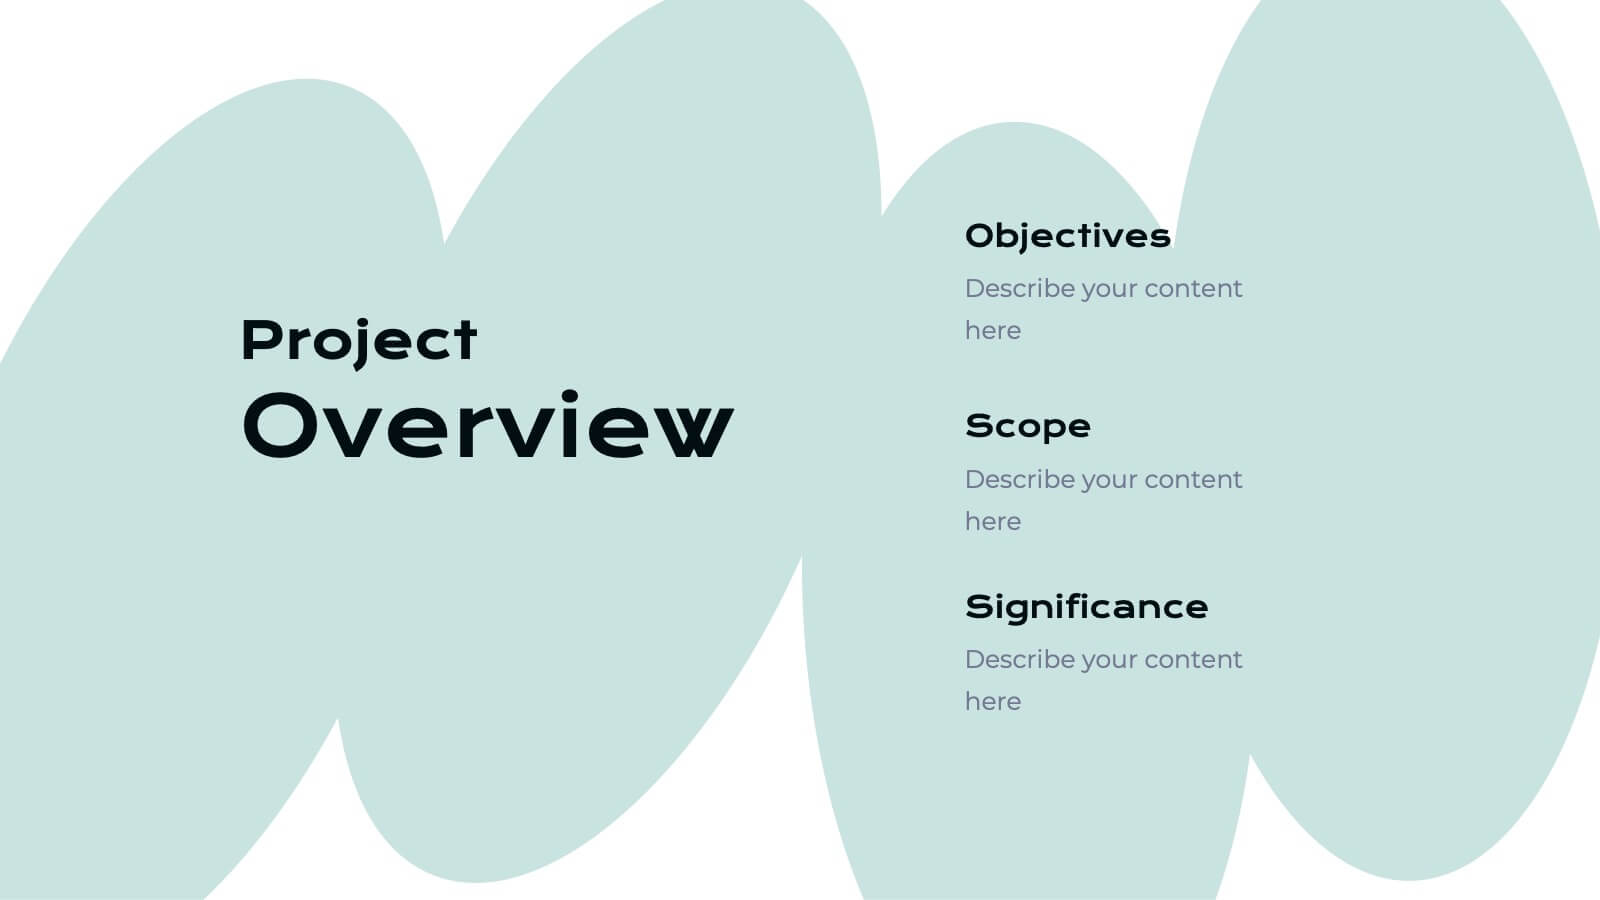
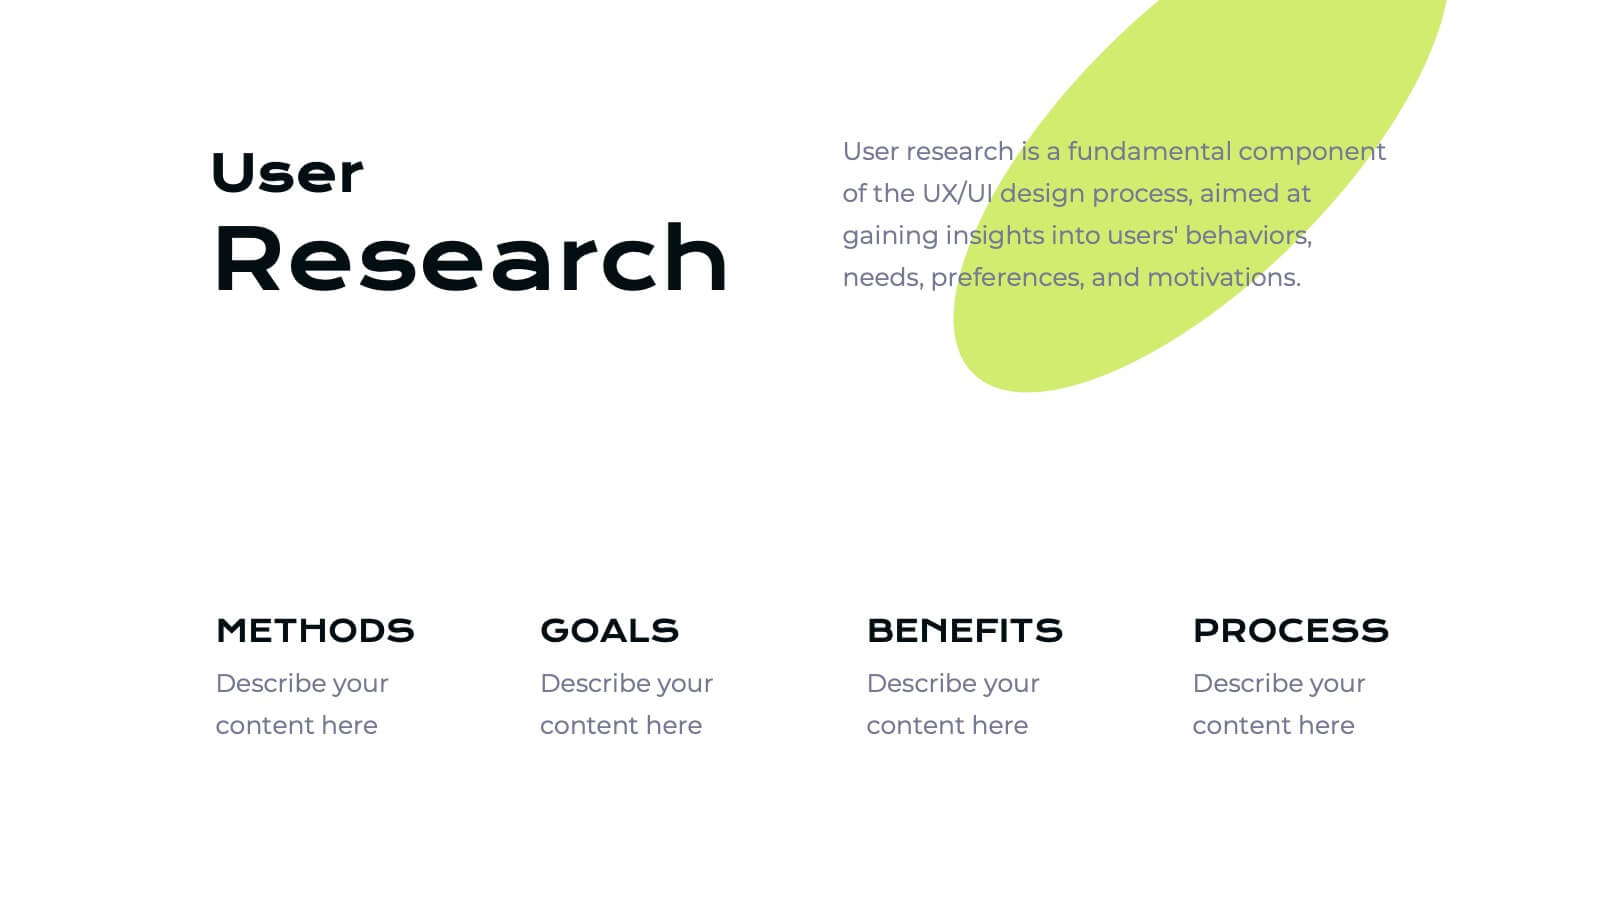
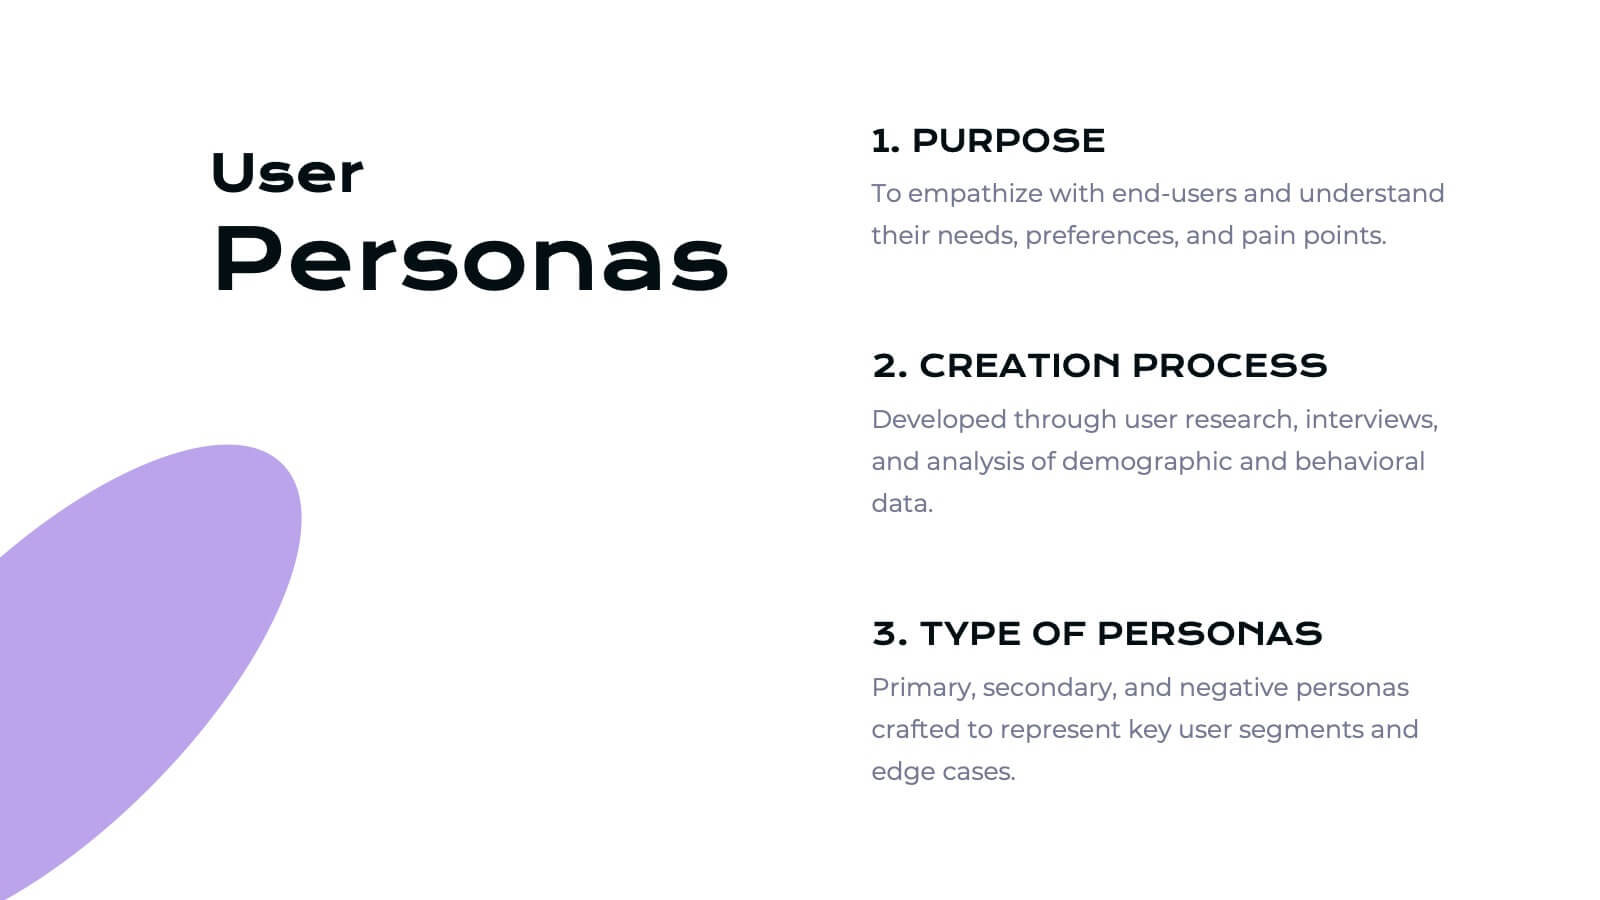
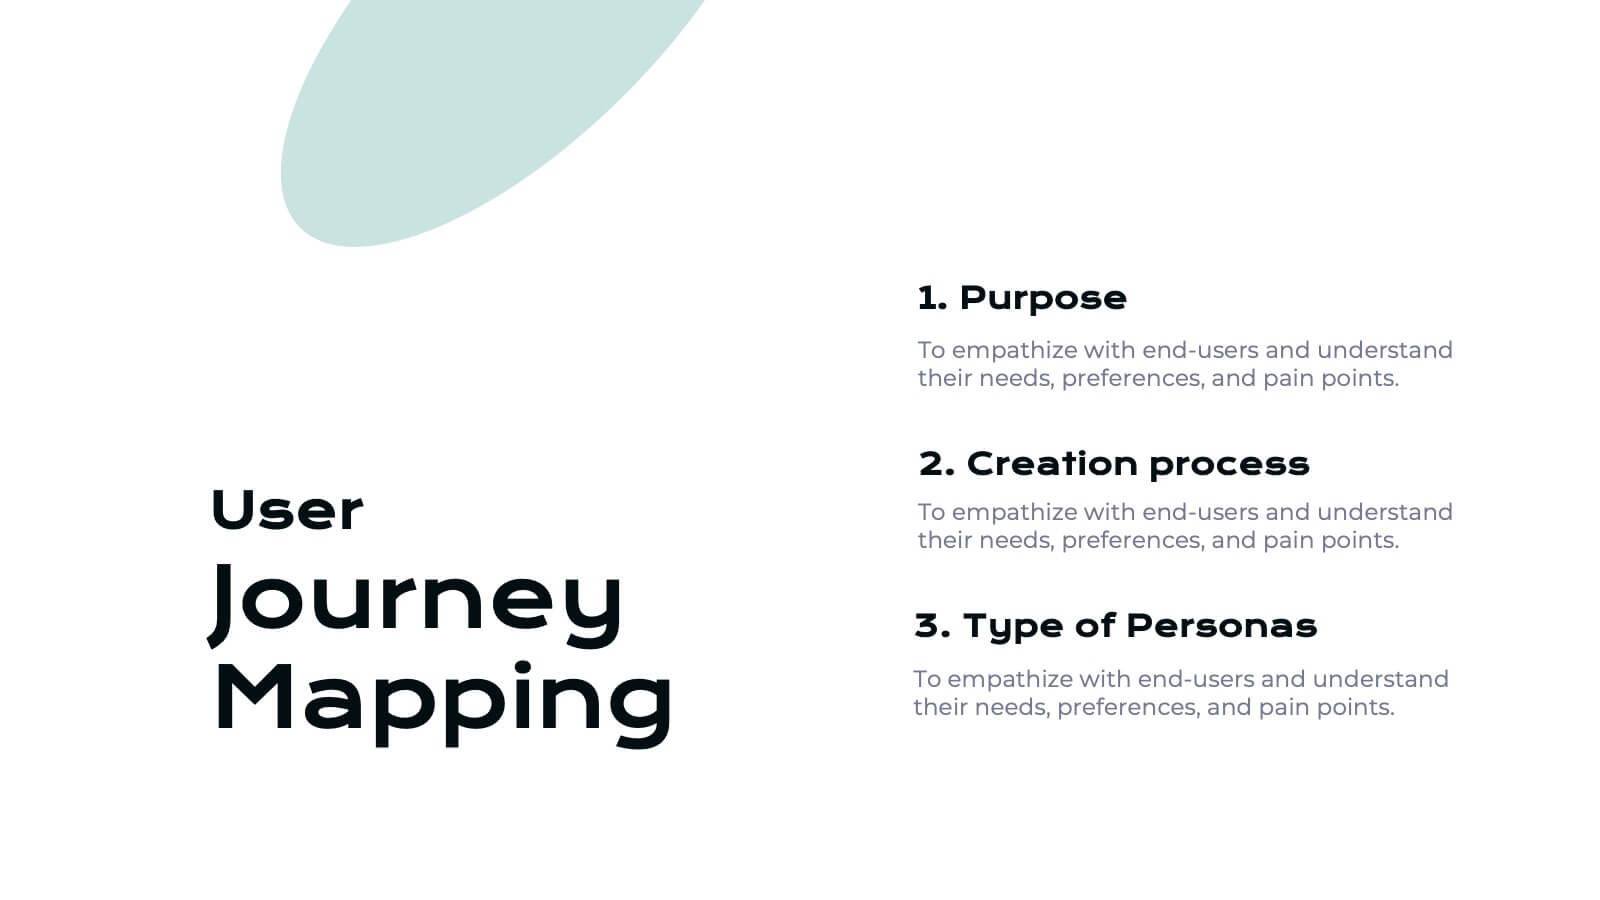
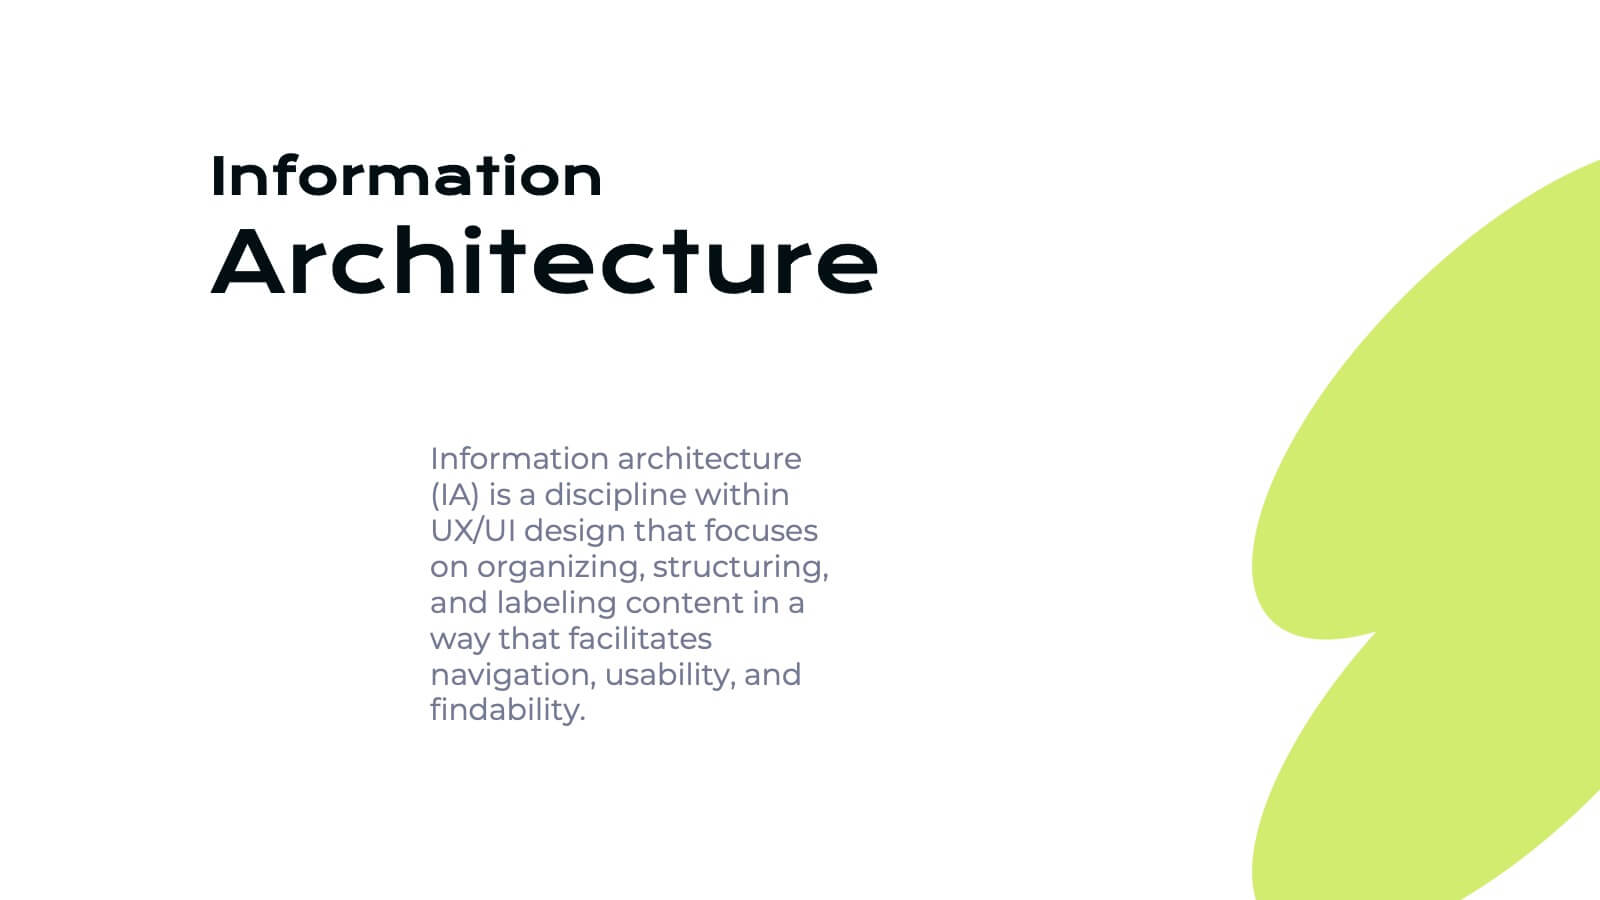
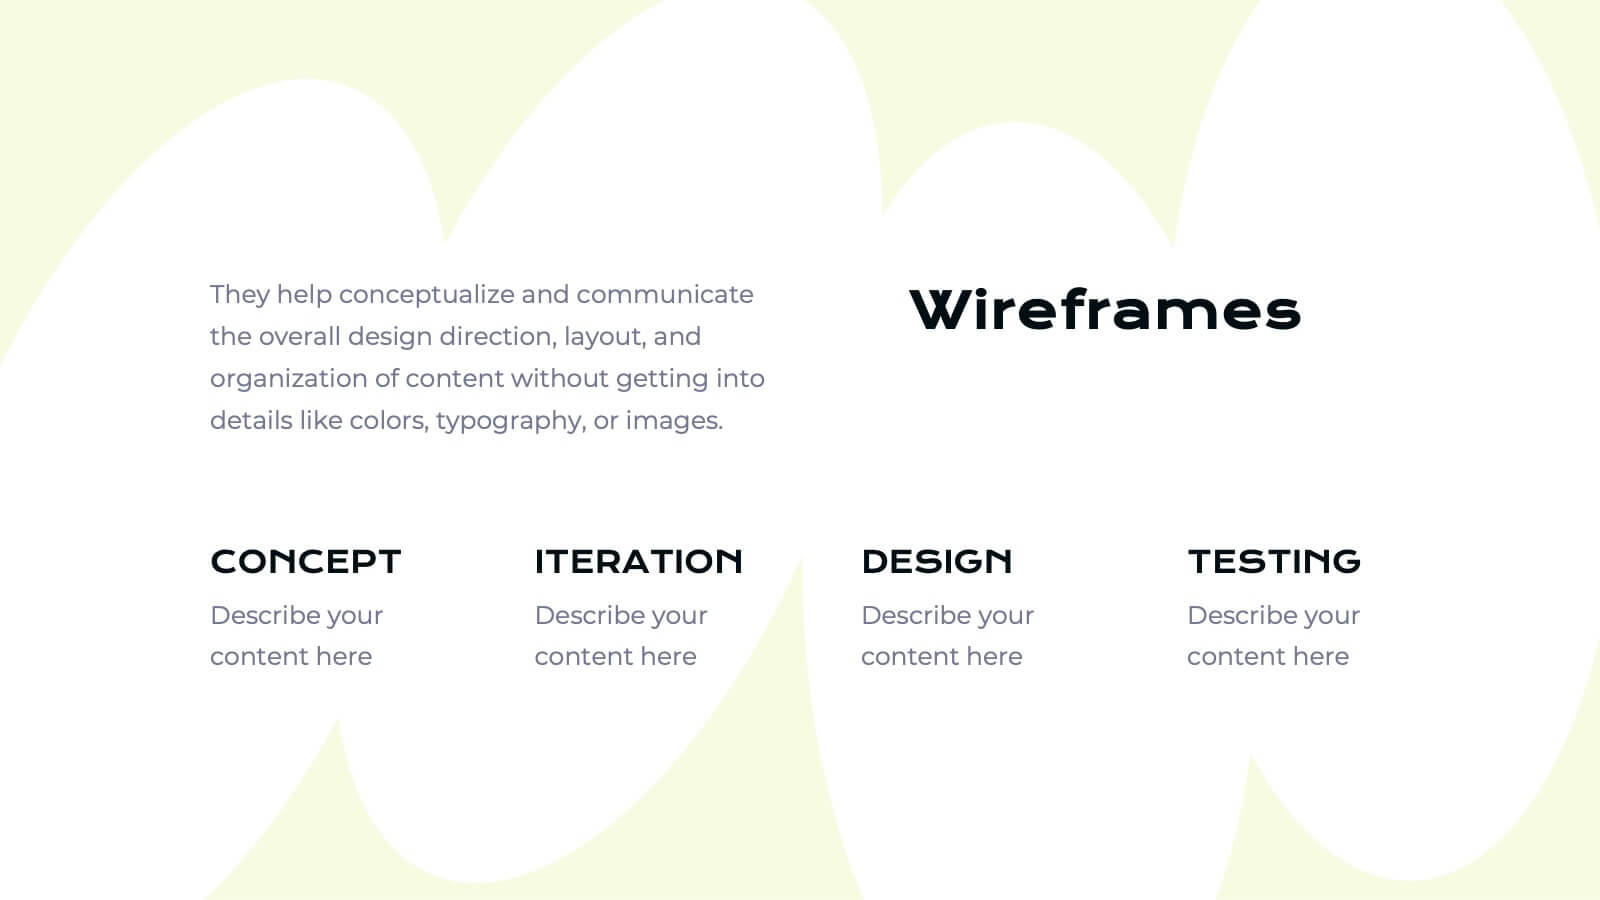
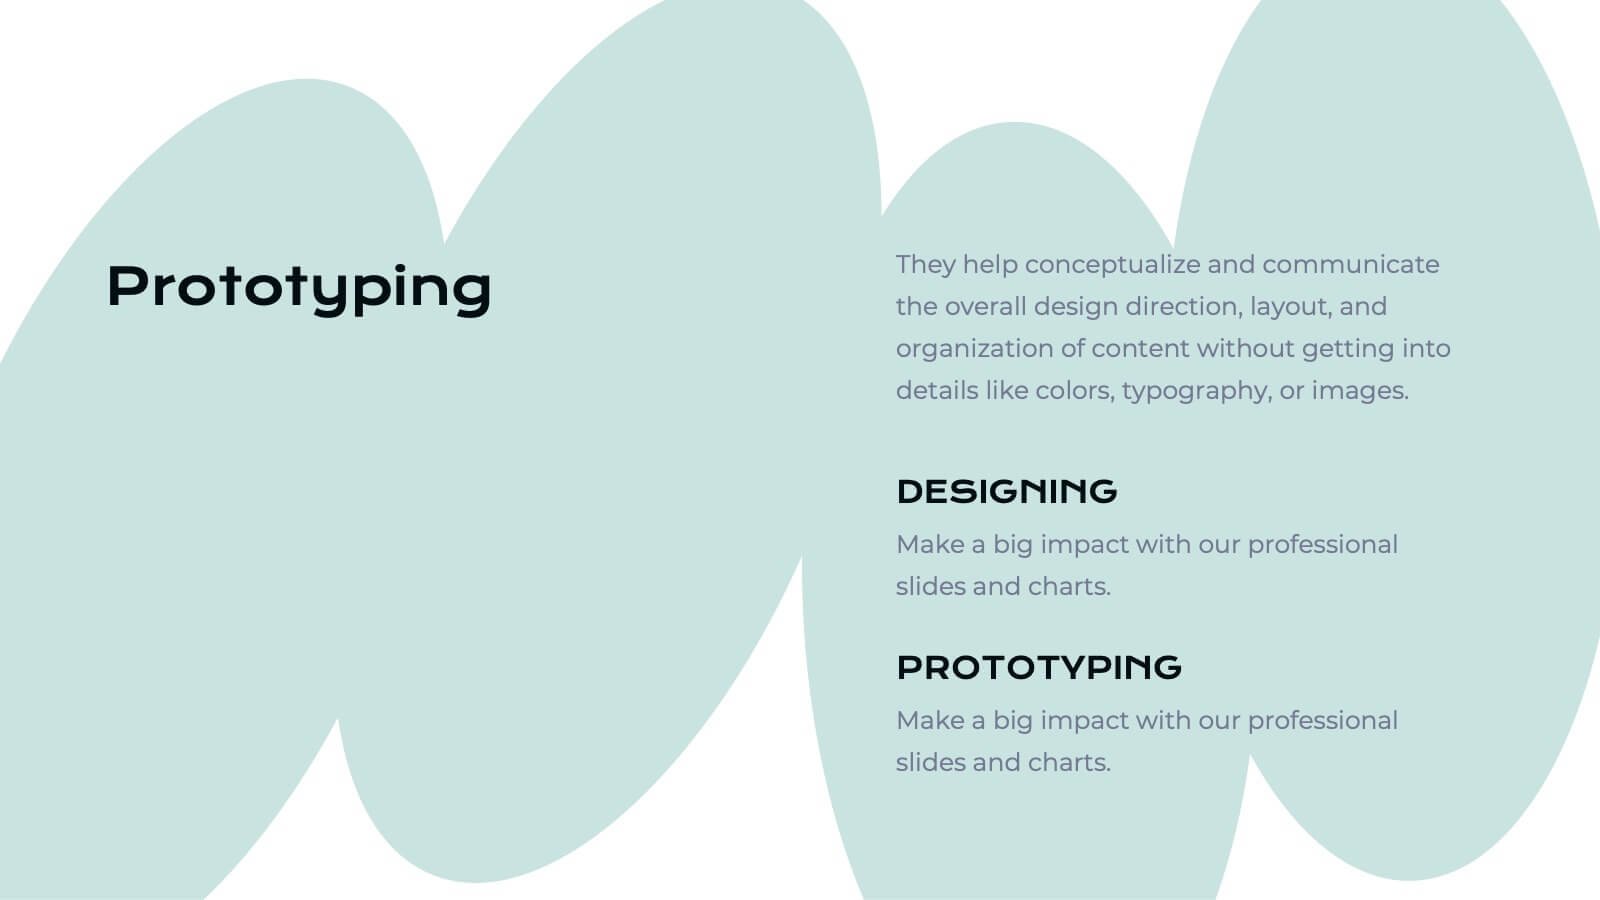
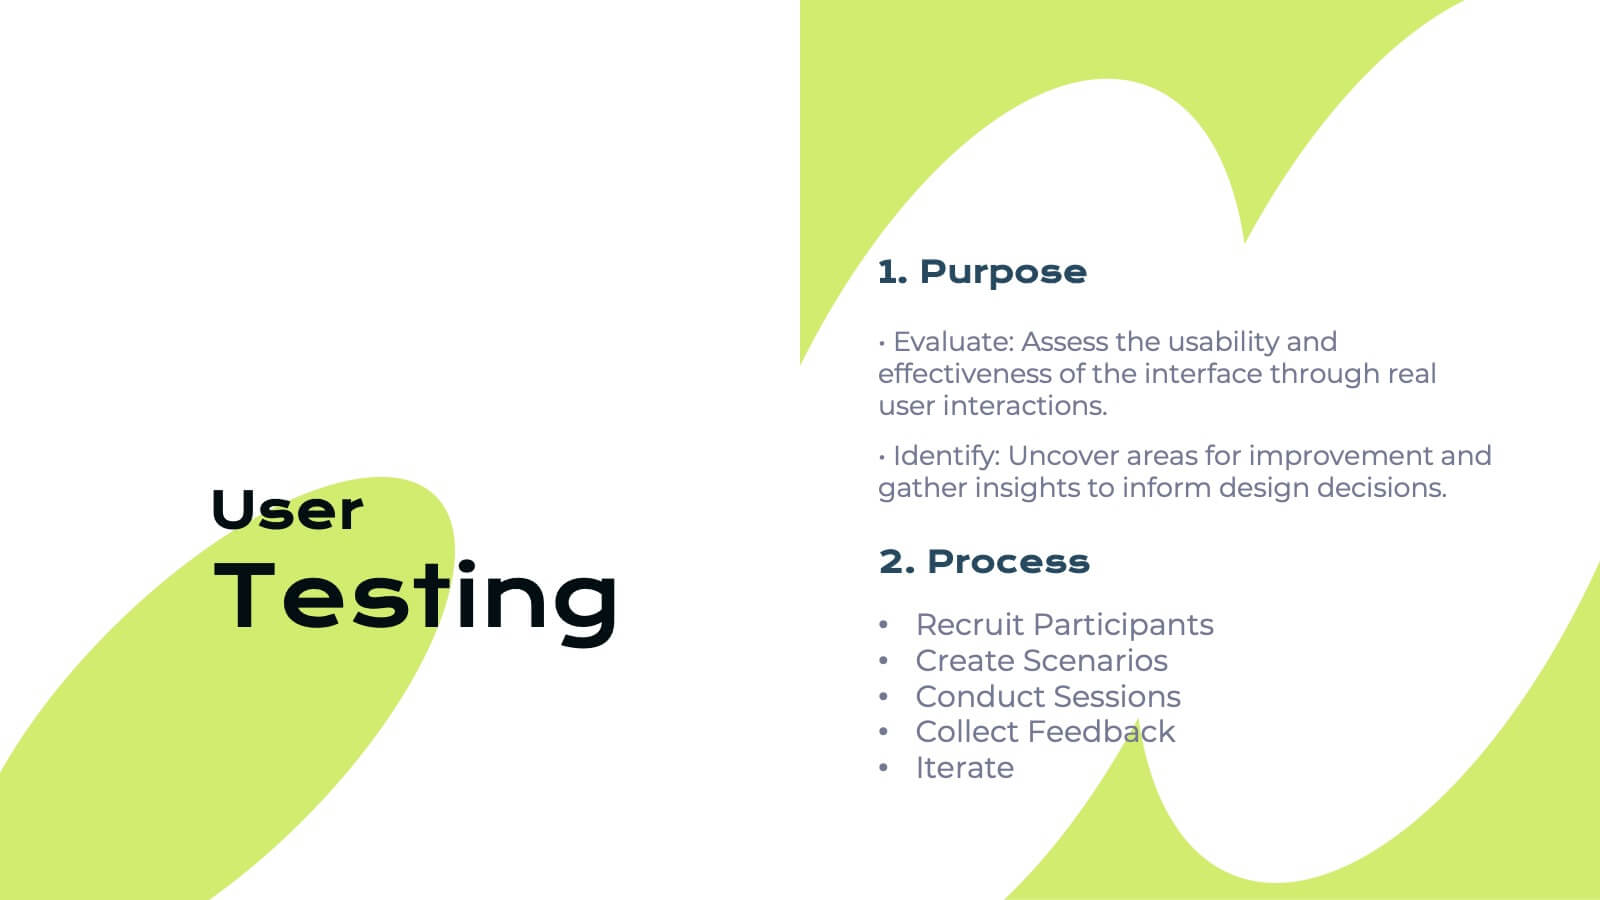
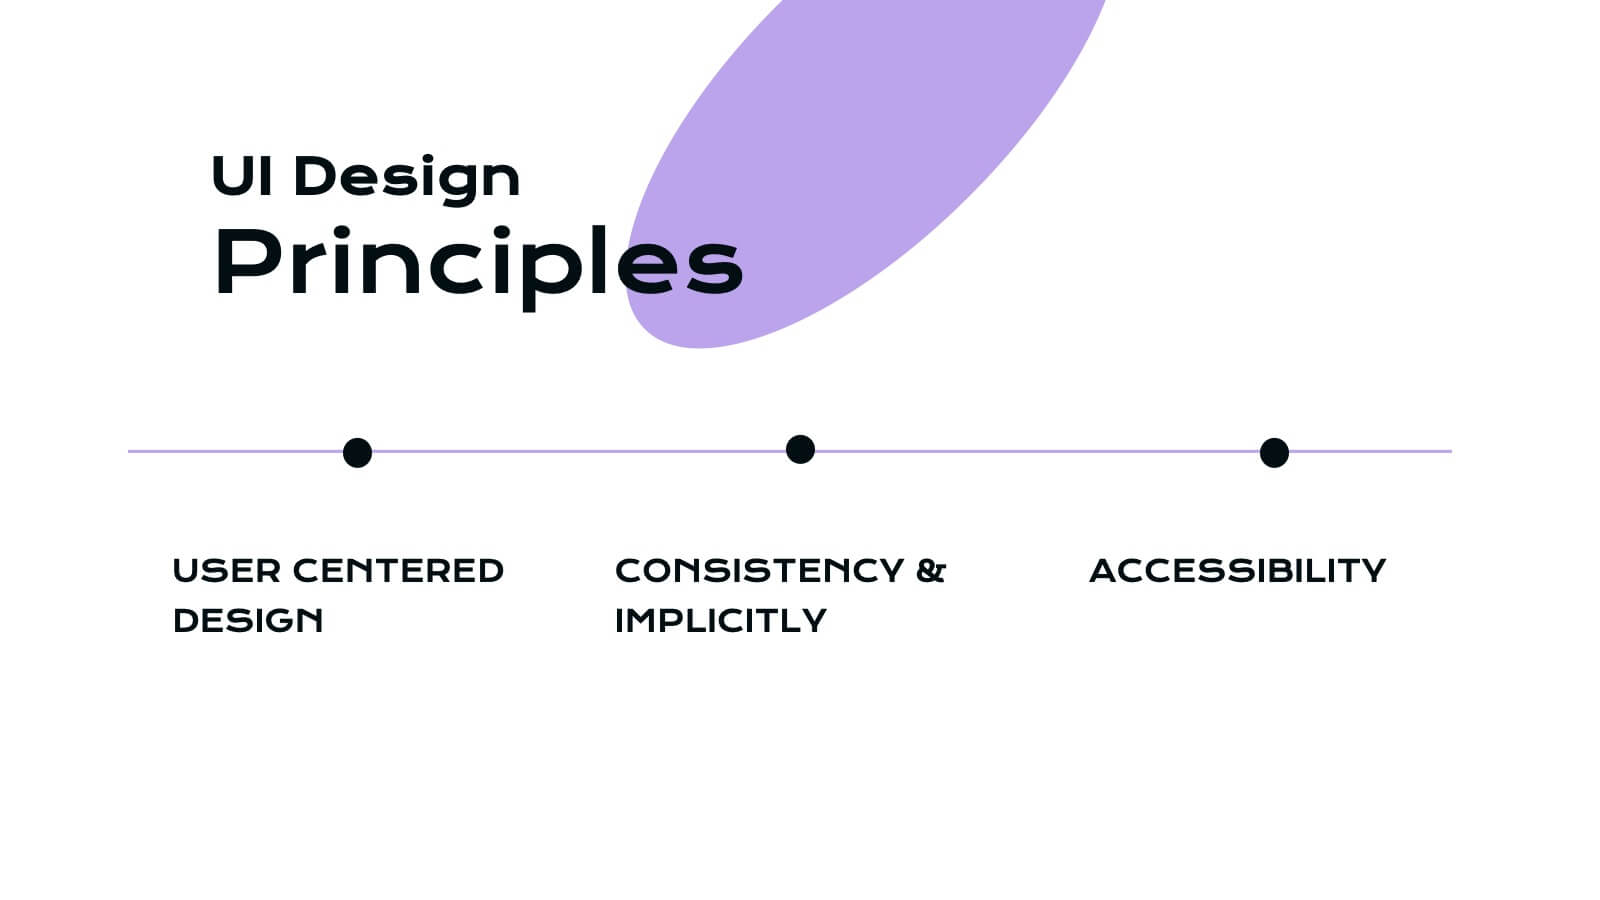
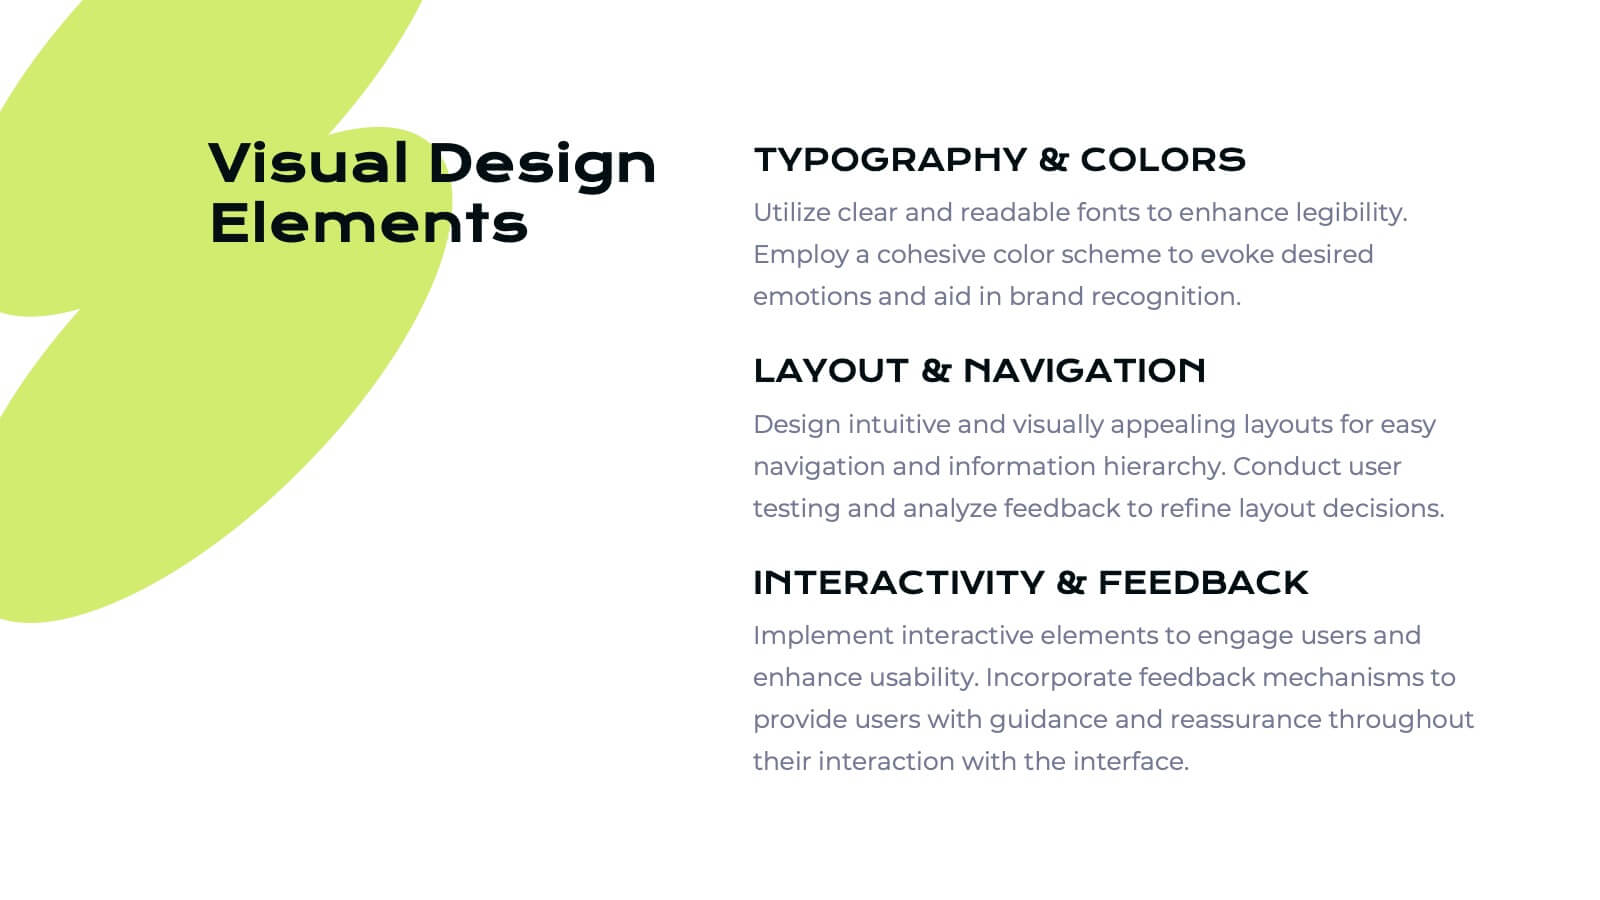
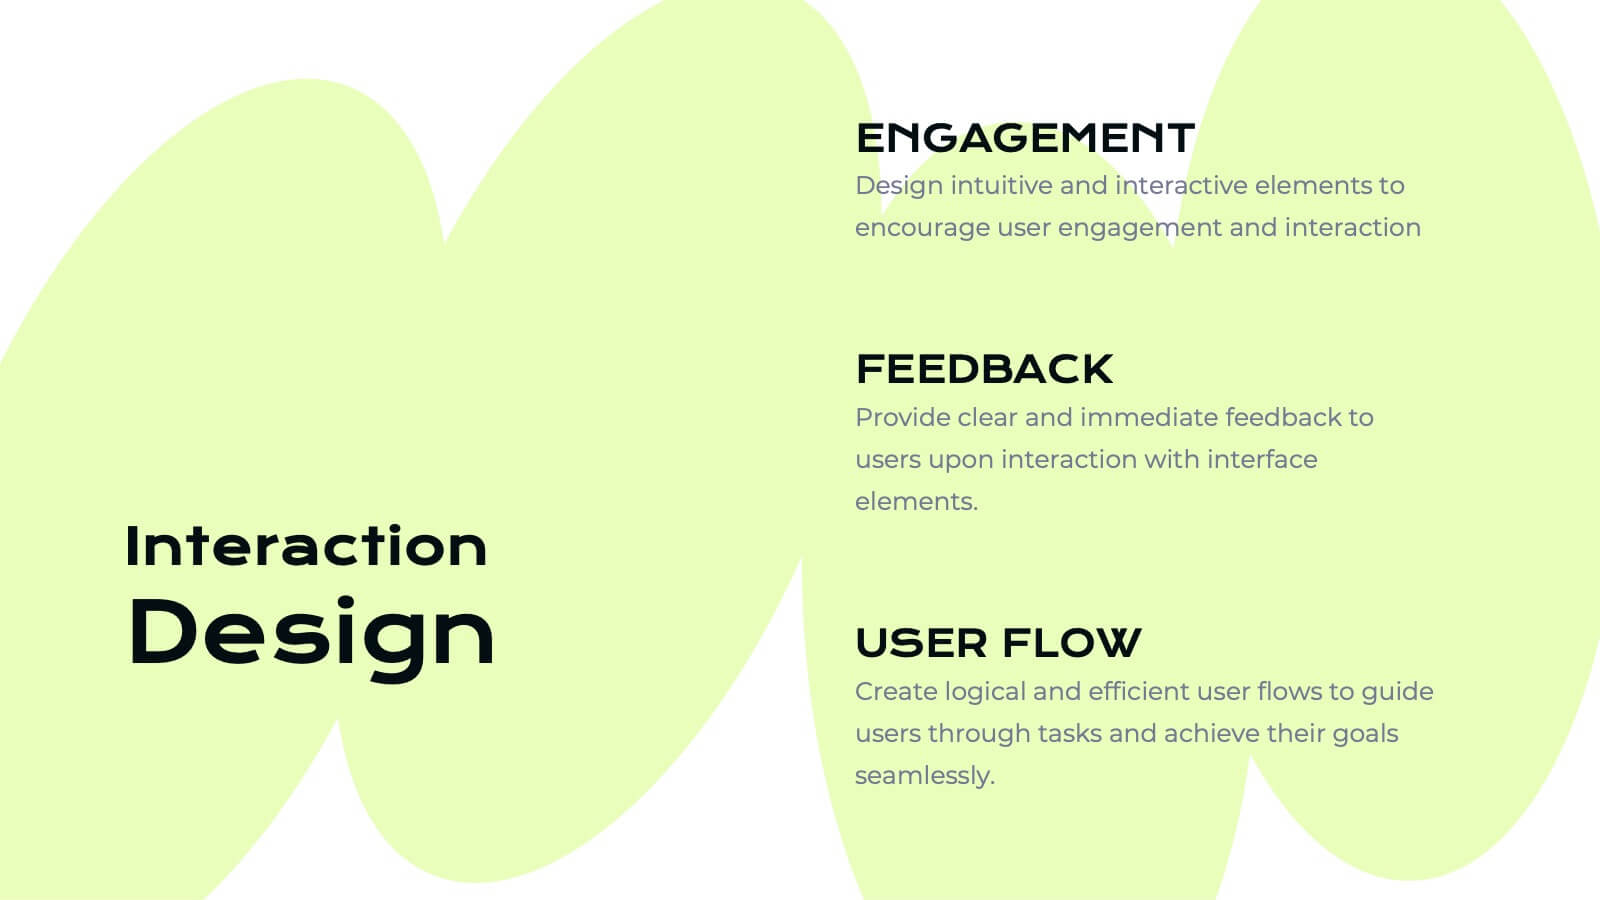
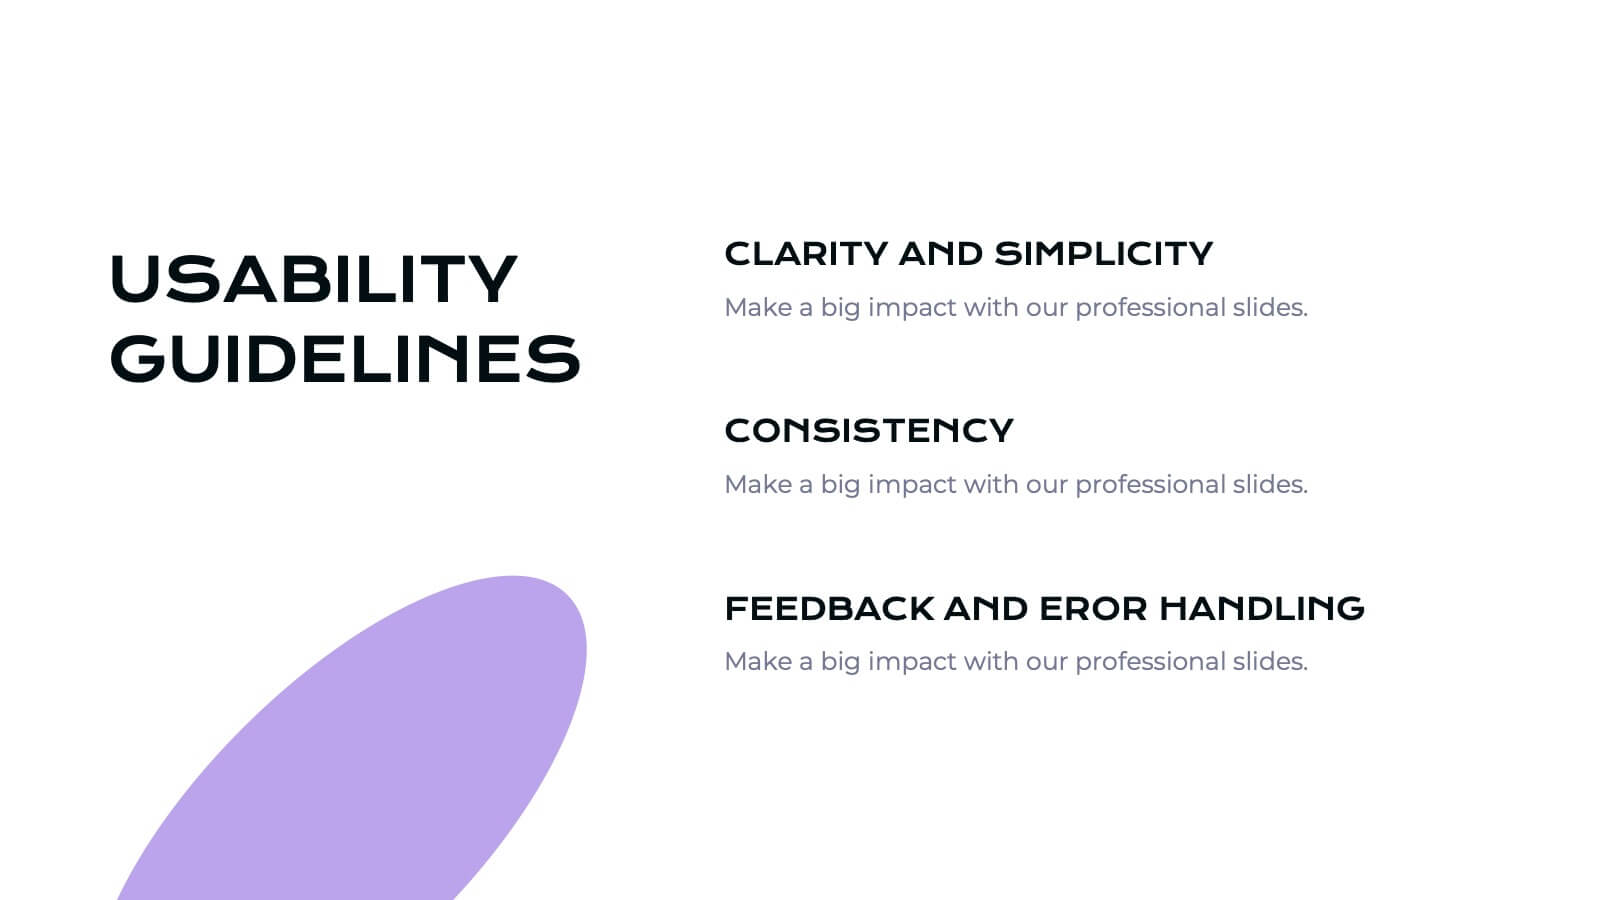
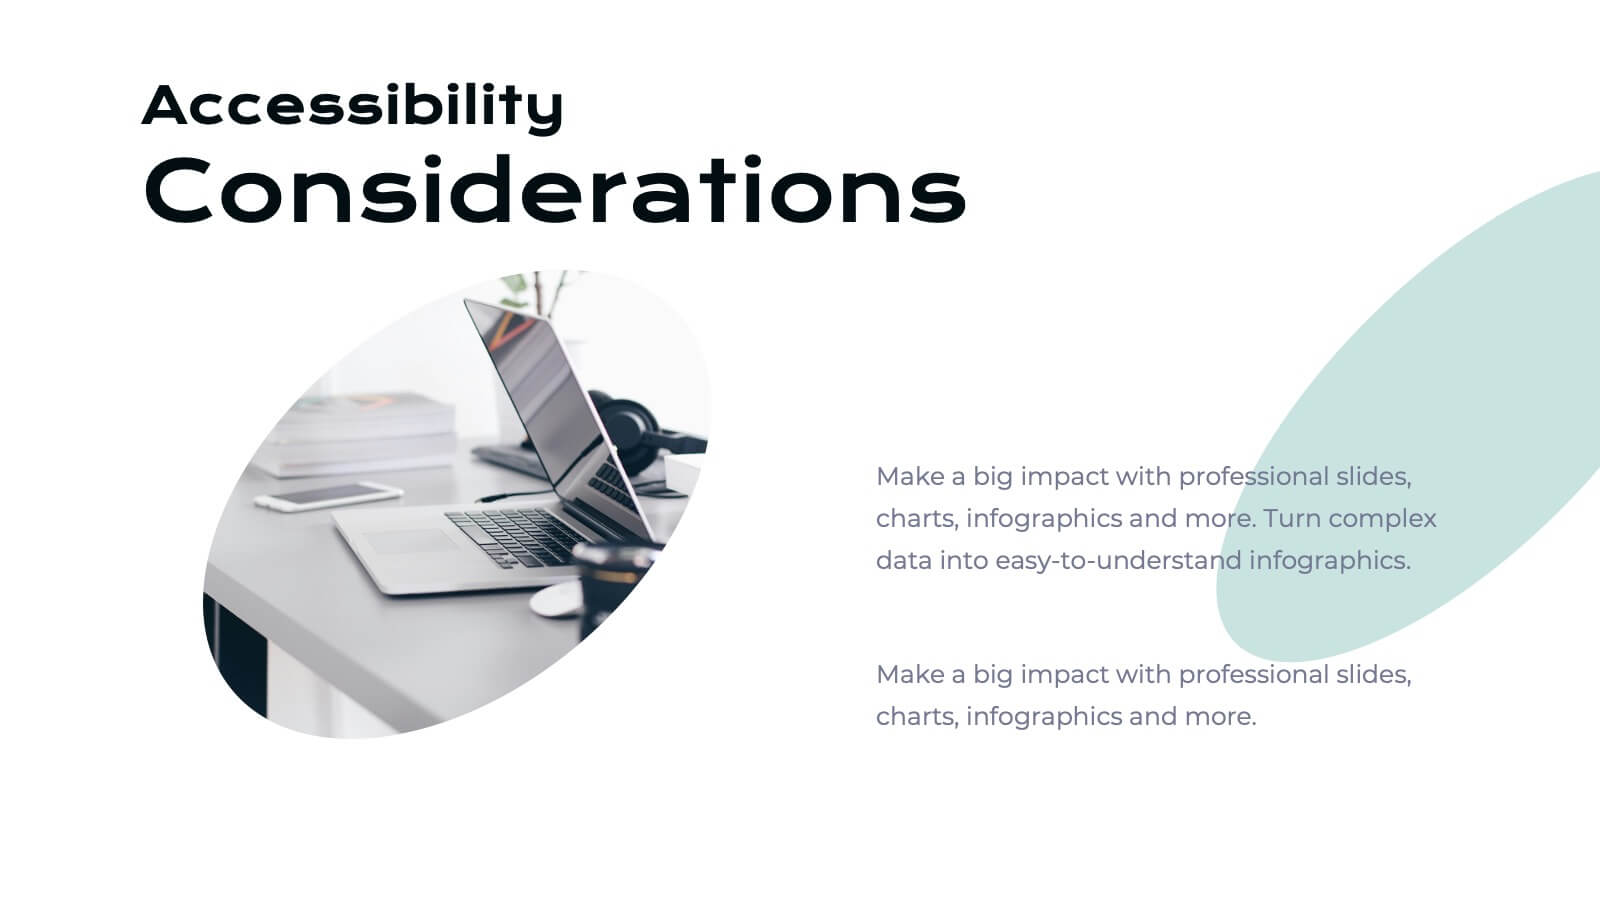
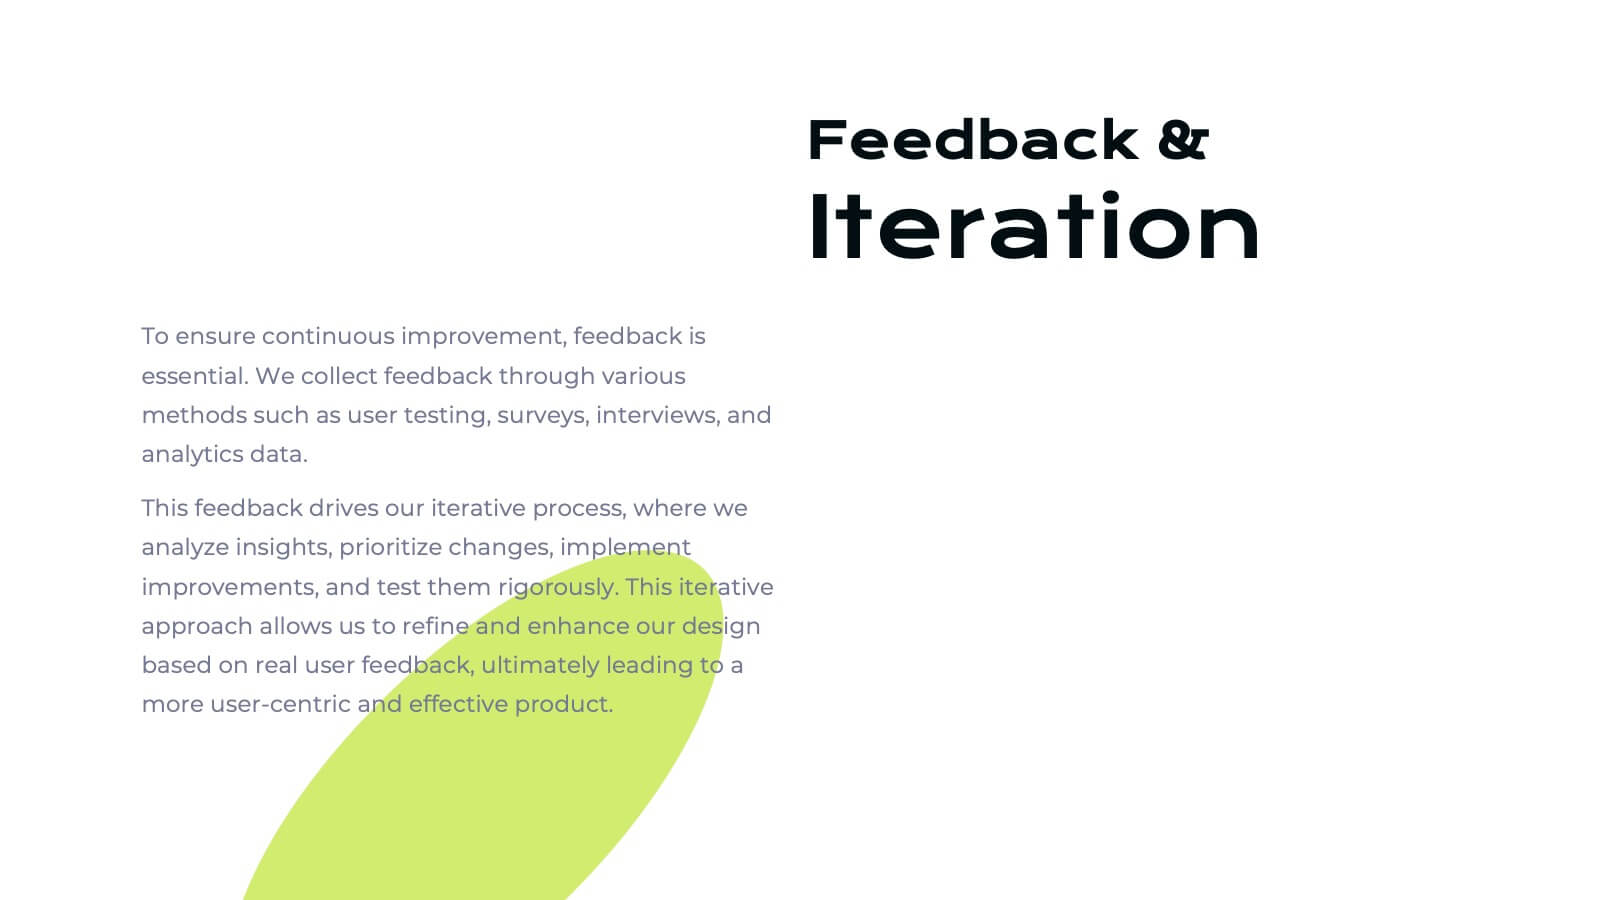
Ifrit User Experience Proposal Presentation
Unleash the power of great design with this fiery Ifrit-inspired presentation, perfect for delivering your user experience proposal! This template lets you showcase your UX strategies, research, and design process in a visually striking and well-organized format. Impress stakeholders with every slide. Compatible with PowerPoint, Keynote, and Google Slides.


23 diapositivas
Solarae Investor Pitch Presentation
This Investor Pitch Deck Presentation is designed to impress potential investors with a modern, professional layout. Covering key topics like company overview, financials, competitive landscape, and milestones, it's fully customizable and easy to edit in PowerPoint, Keynote, and Google Slides. Perfect for startups seeking funding opportunities.


4 diapositivas
Revenue and Expense Forecasting Overview Presentation
Easily illustrate financial trade-offs with the Revenue and Expense Forecasting Overview Presentation. This clean, visual slide design features a seesaw-style balance graphic to help communicate proportional budgeting between revenue, balance, and expenses. Ideal for finance updates, annual reports, and planning meetings. Fully editable in PowerPoint, Google Slides, Keynote, and Canva.


4 diapositivas
Digital Payment and Card Services Presentation
Step into the world of contactless commerce with this clean, modern slide design. It’s built to help you present how digital payment systems and card-based services are transforming transactions in today’s economy. Perfect for fintech updates, product walkthroughs, or training decks. Fully compatible with PowerPoint, Keynote, and Google Slides.


4 diapositivas
Task Workflow and Process Automation Presentation
Streamline complex systems with the Task Workflow and Process Automation Presentation. This flowchart-based layout is perfect for visualizing step-by-step procedures, automation pipelines, or operational structures. Each phase is clearly separated, making it easy to track tasks, decisions, and outcomes. Ideal for IT, operations, or management teams. Fully editable in PowerPoint, Keynote, and Google Slides.
21 diapositivas
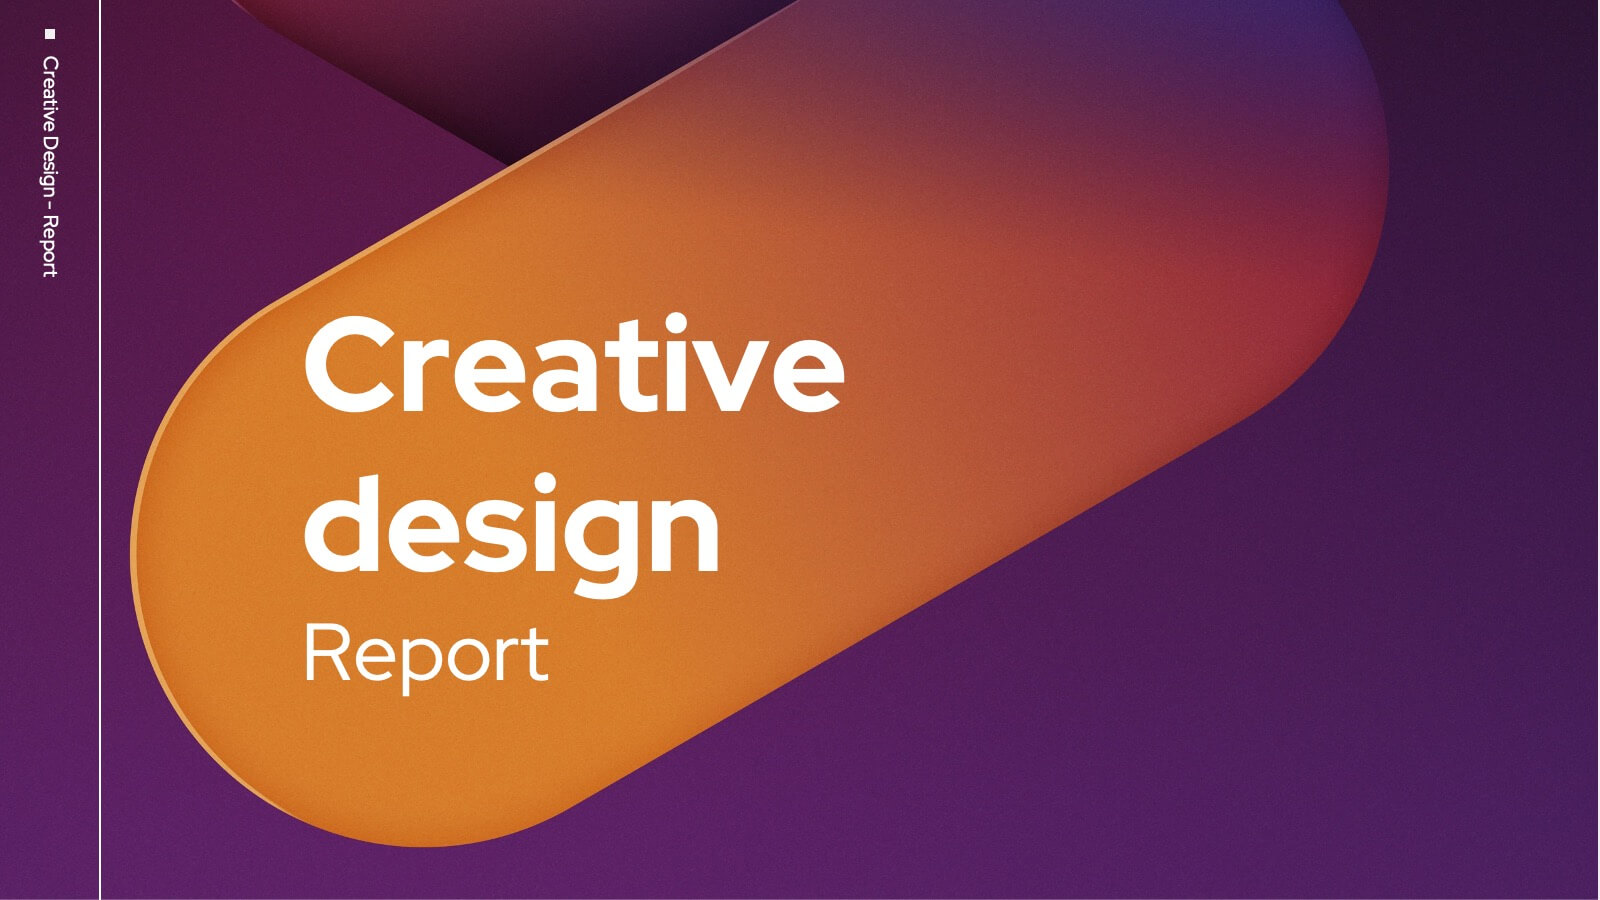
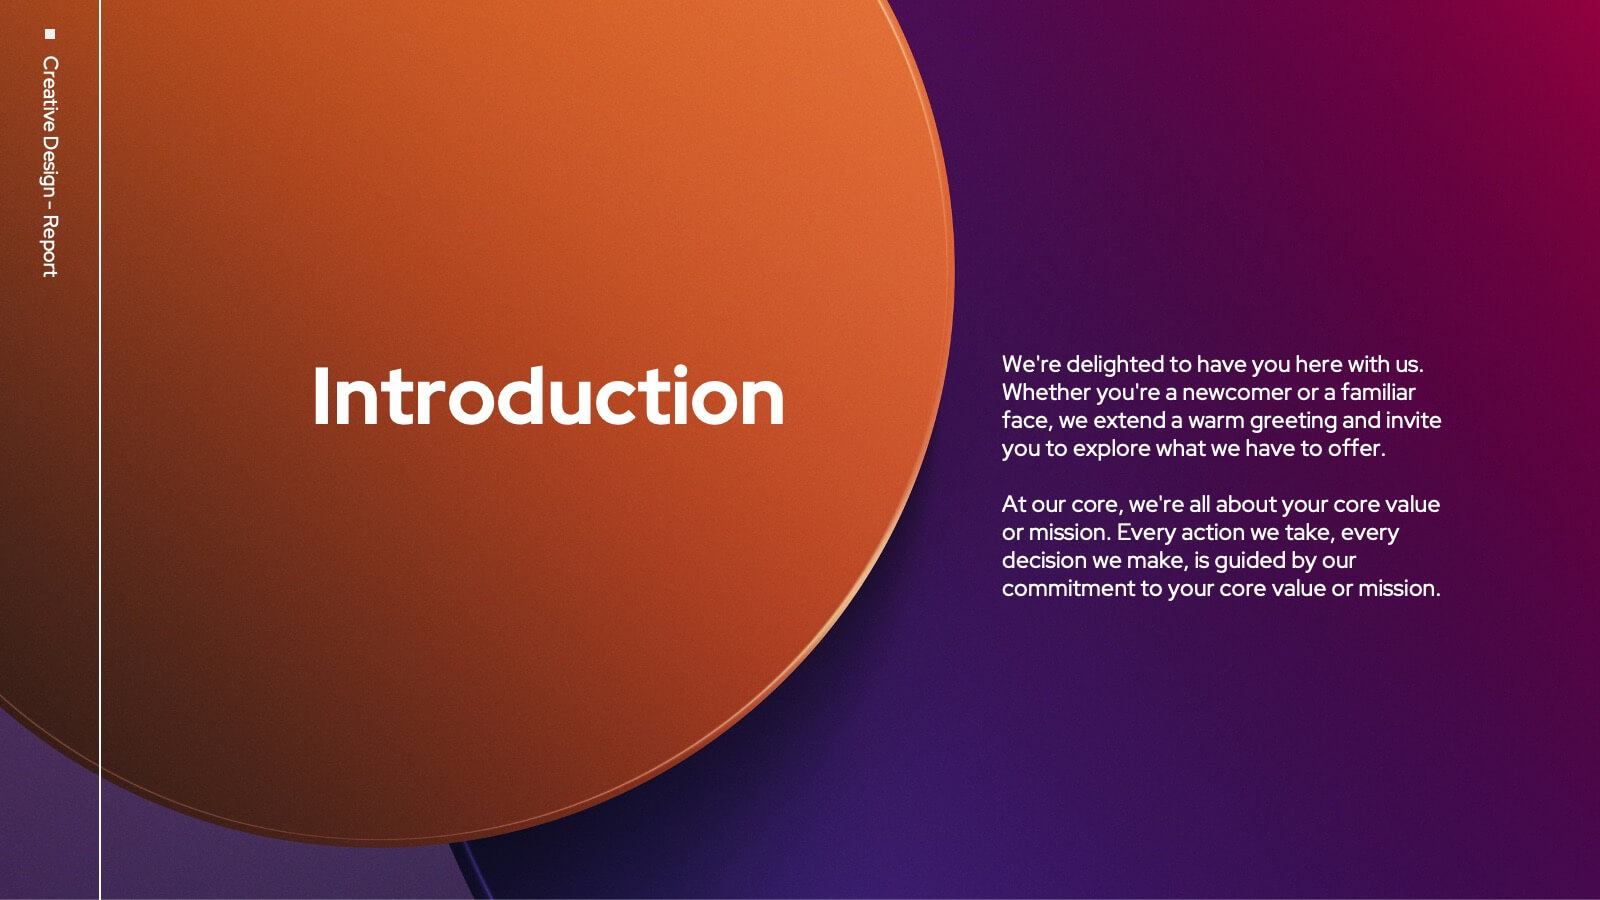
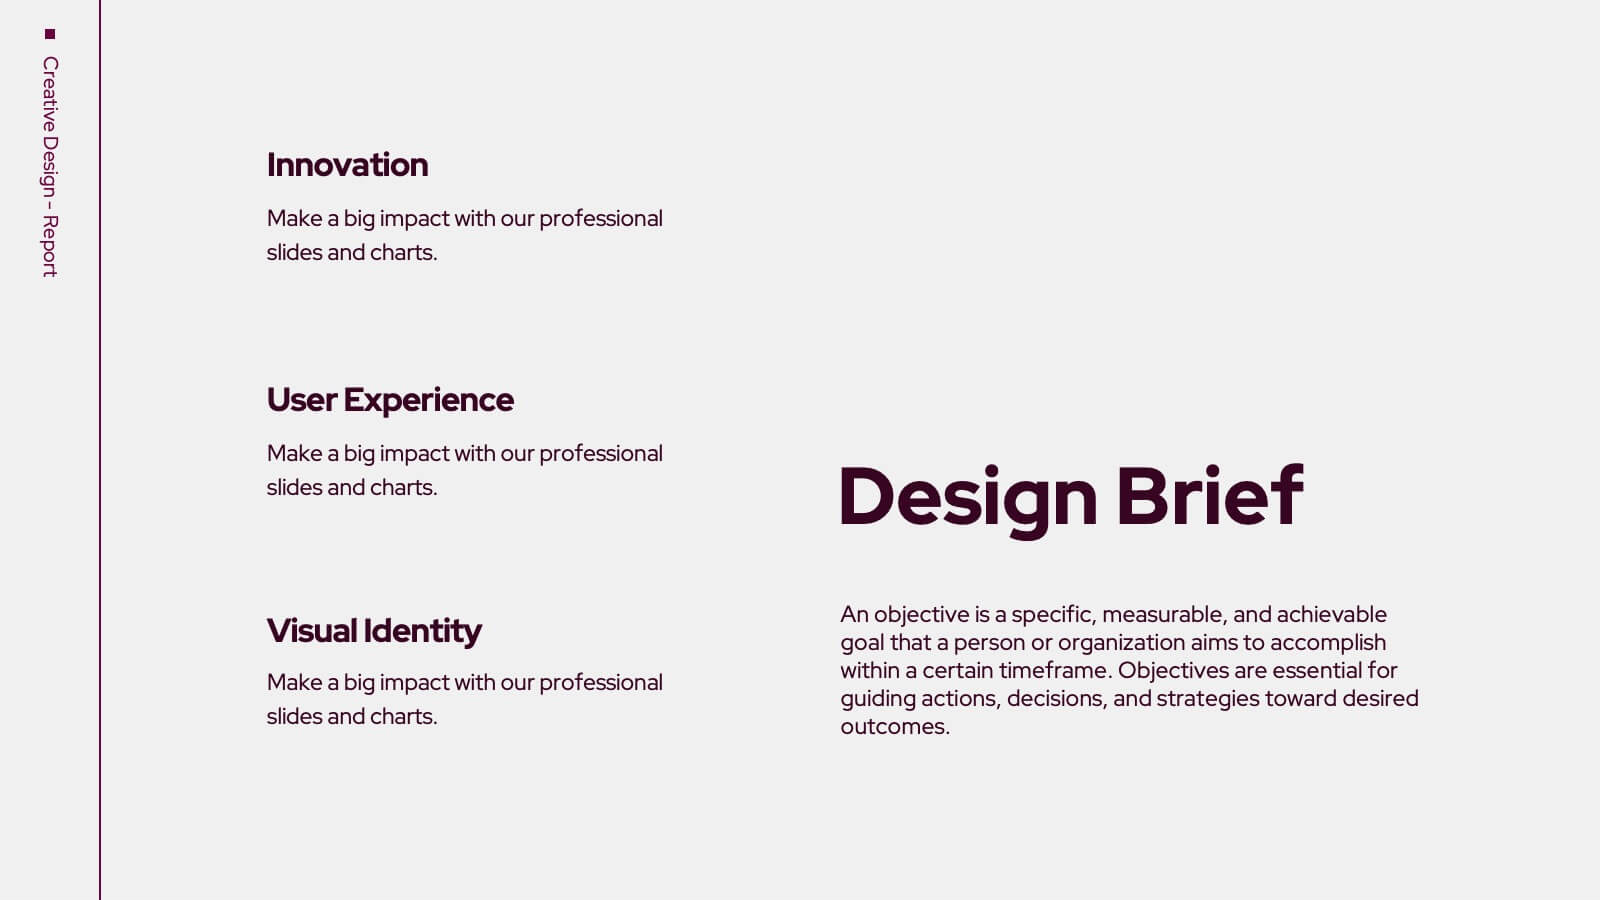
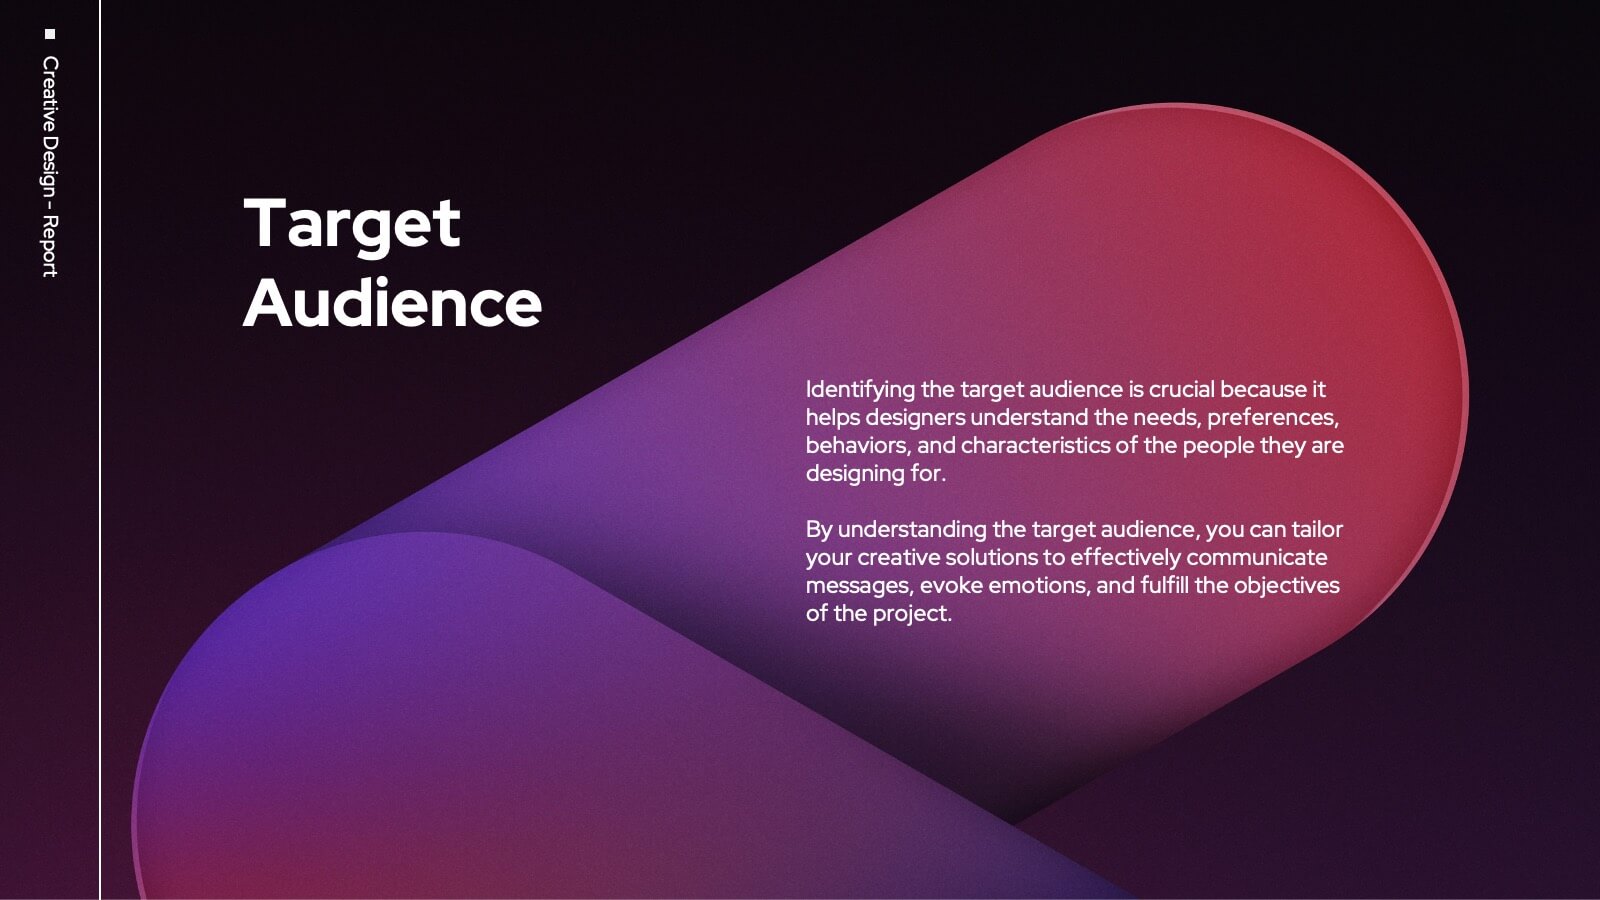
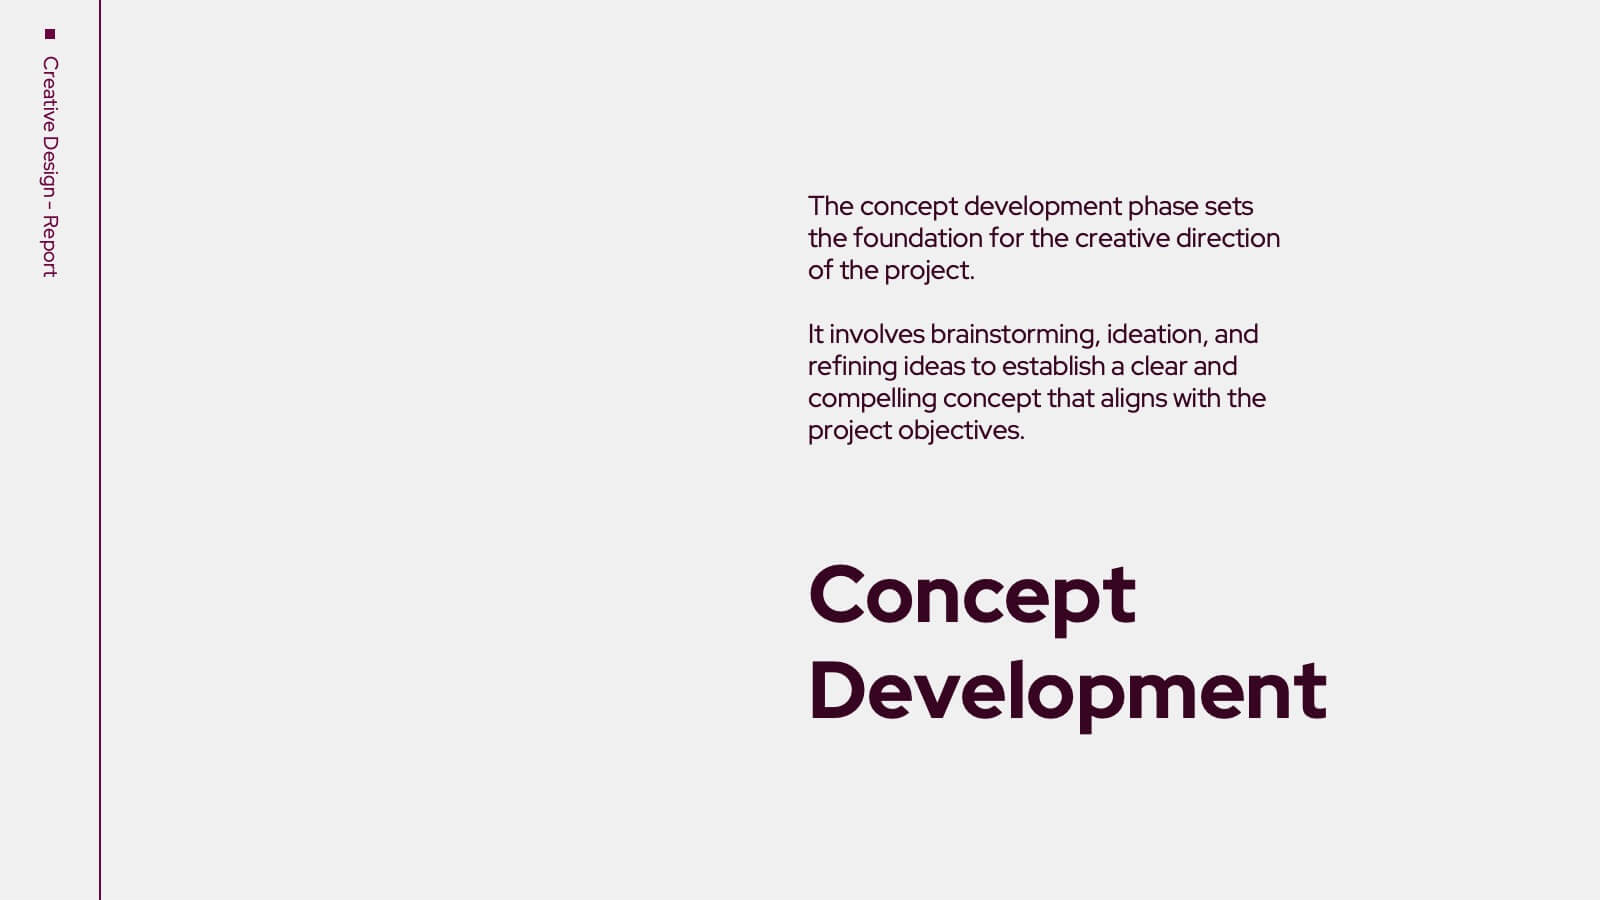
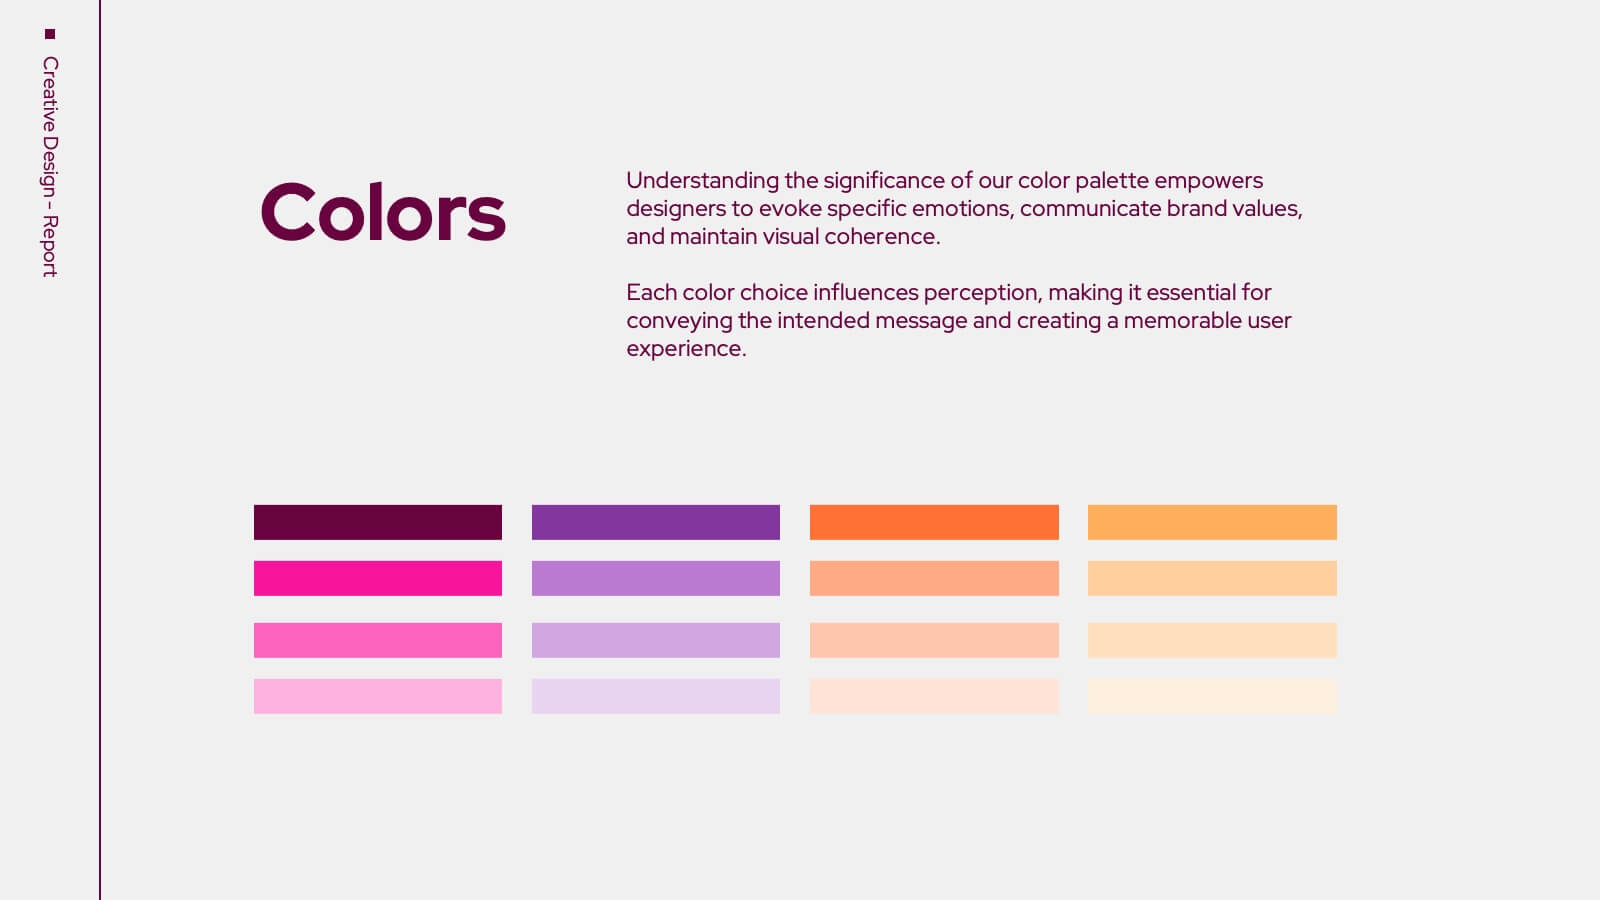
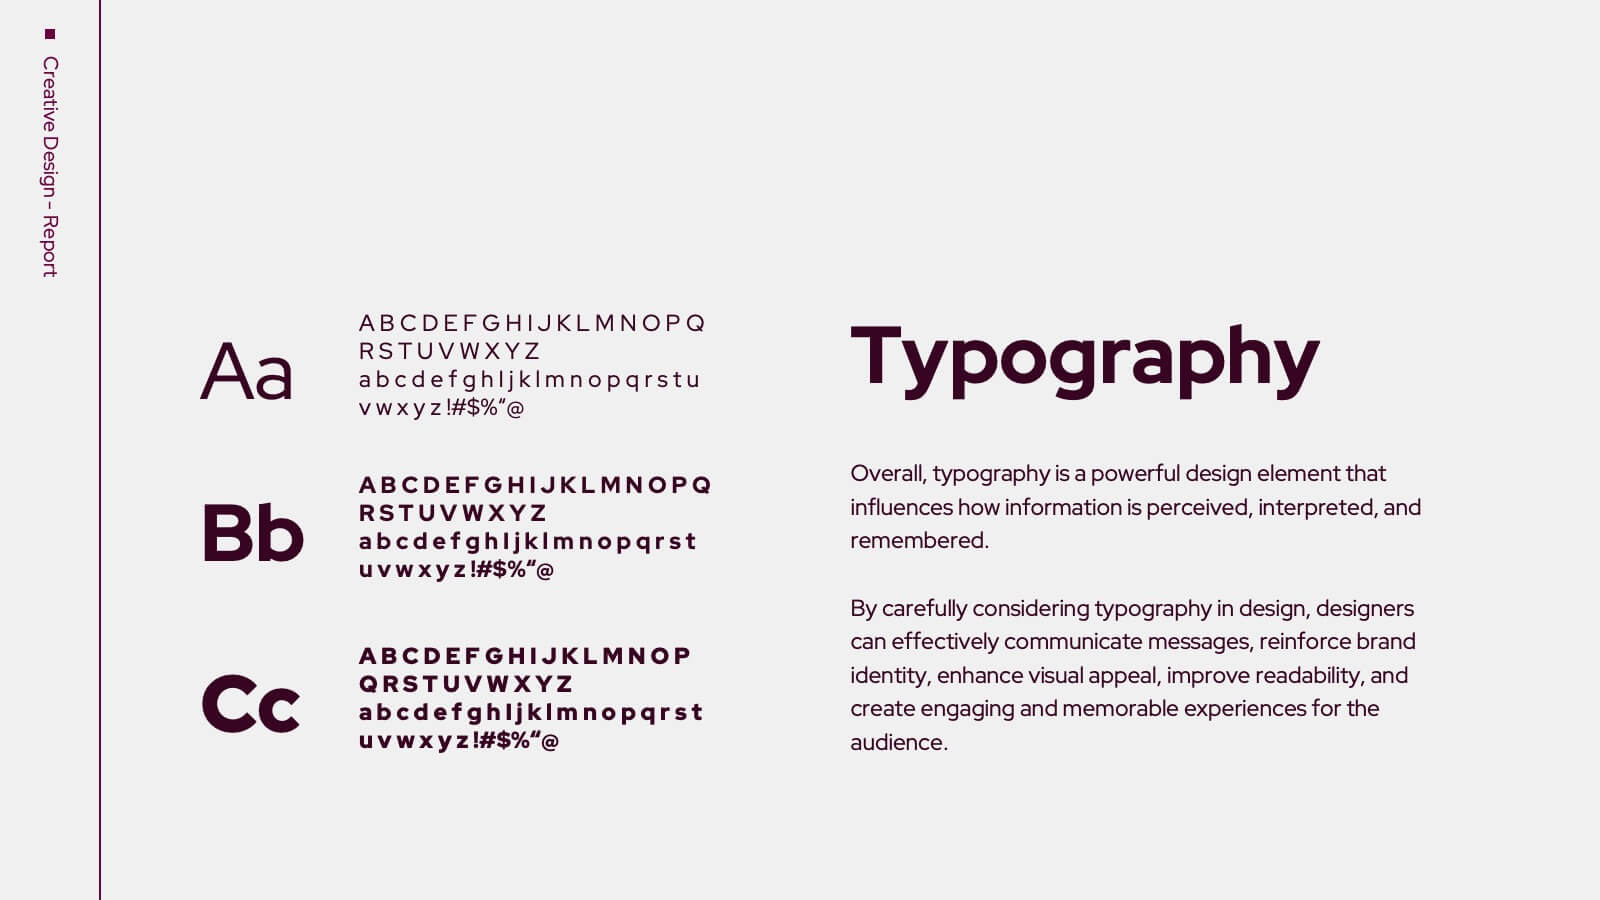
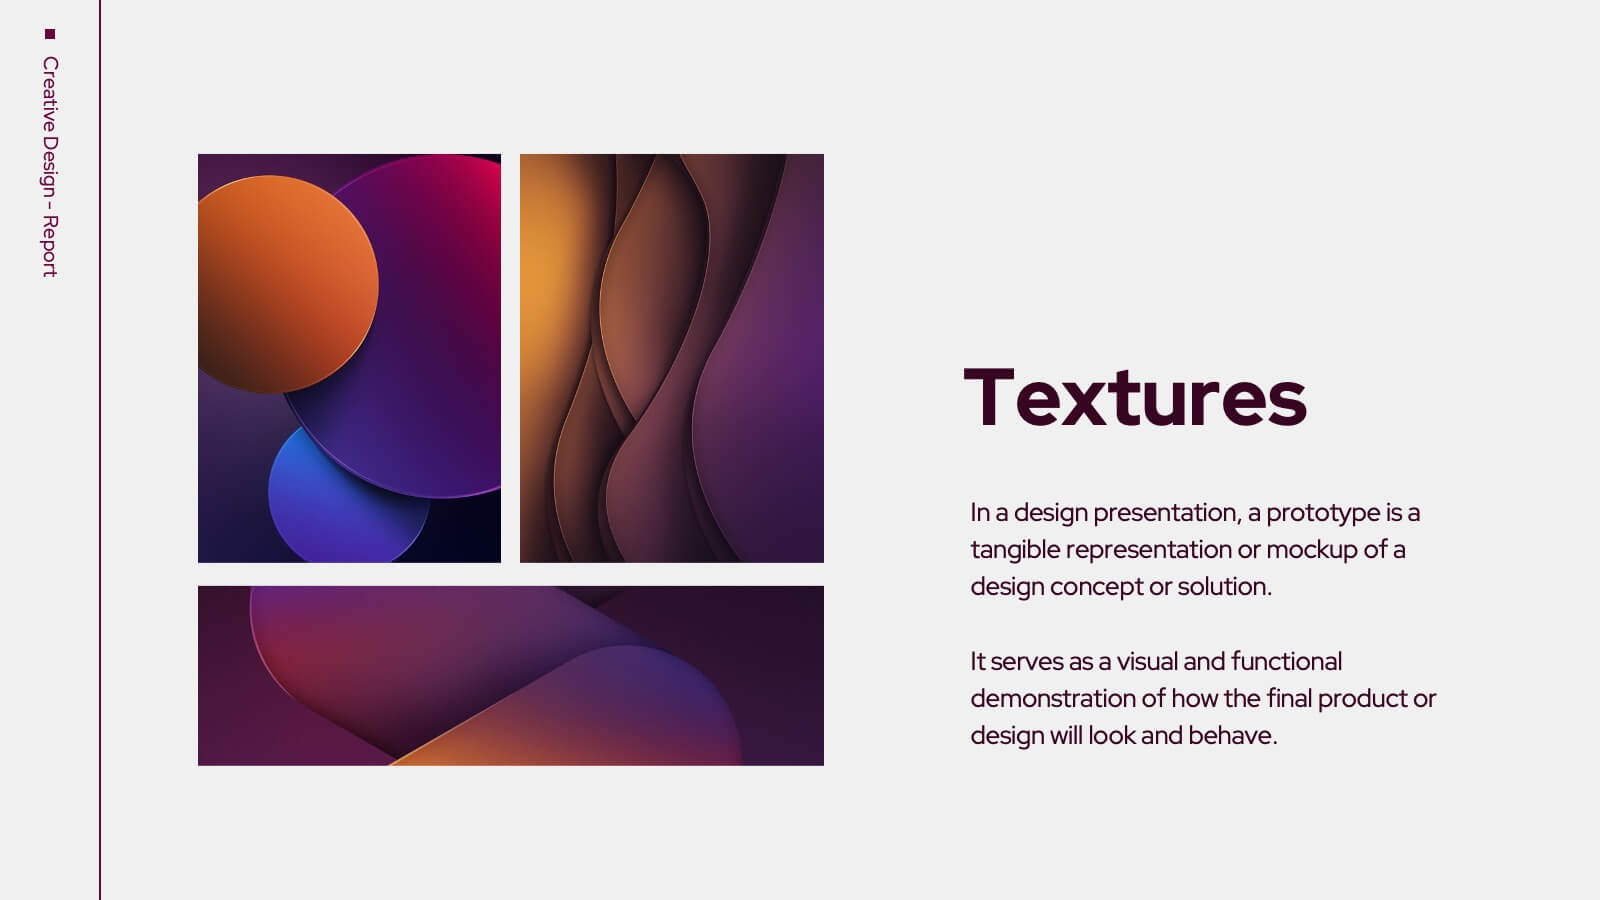
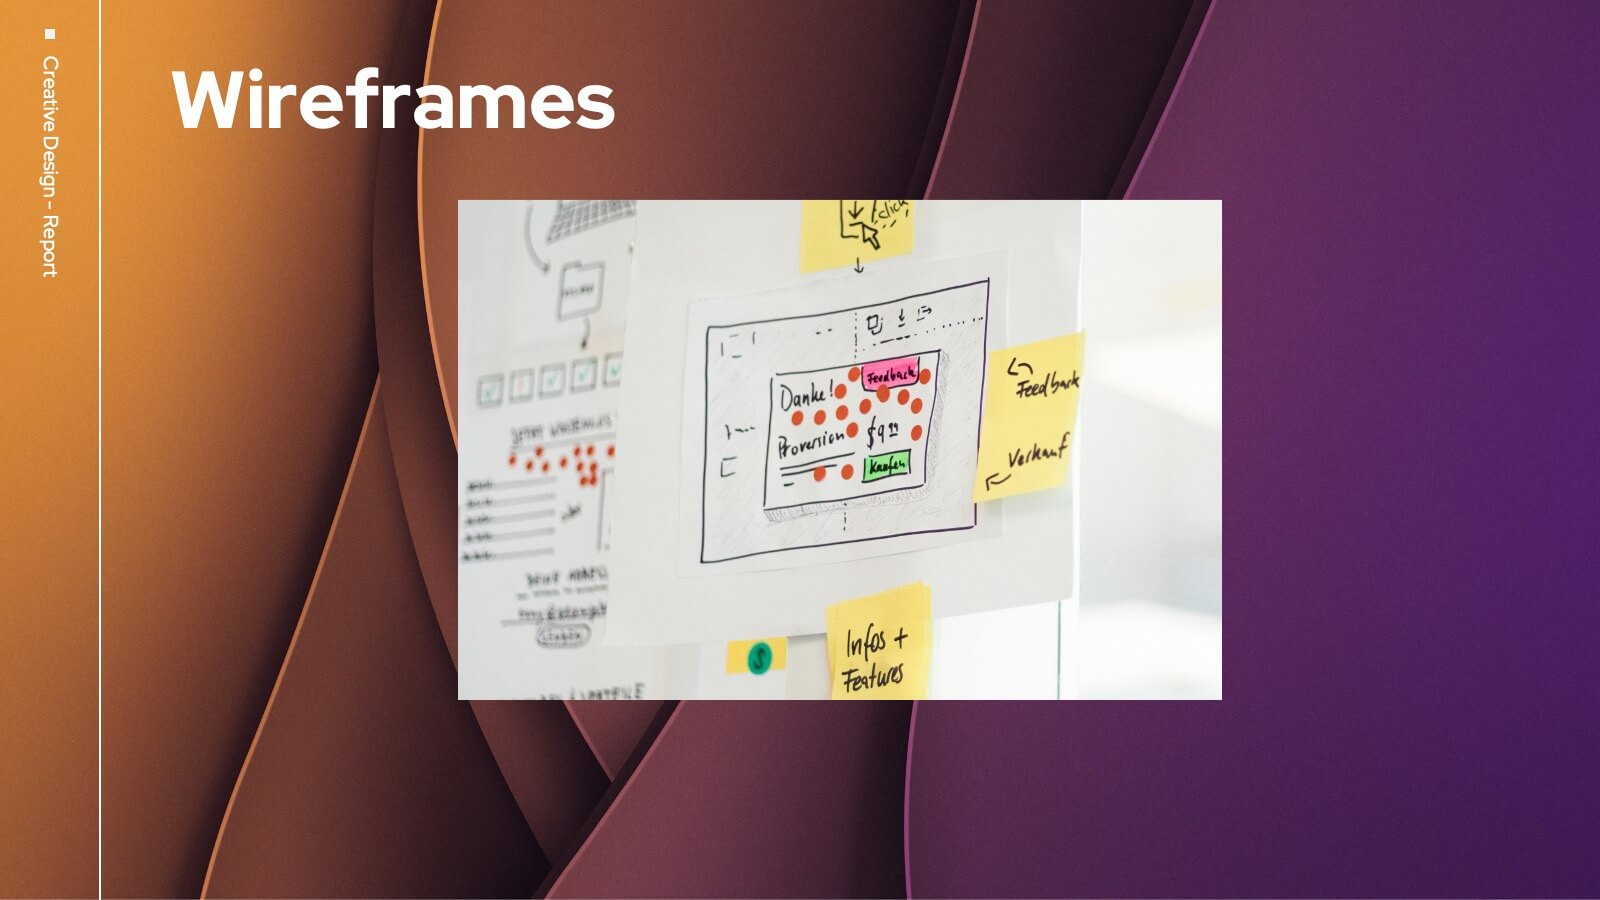
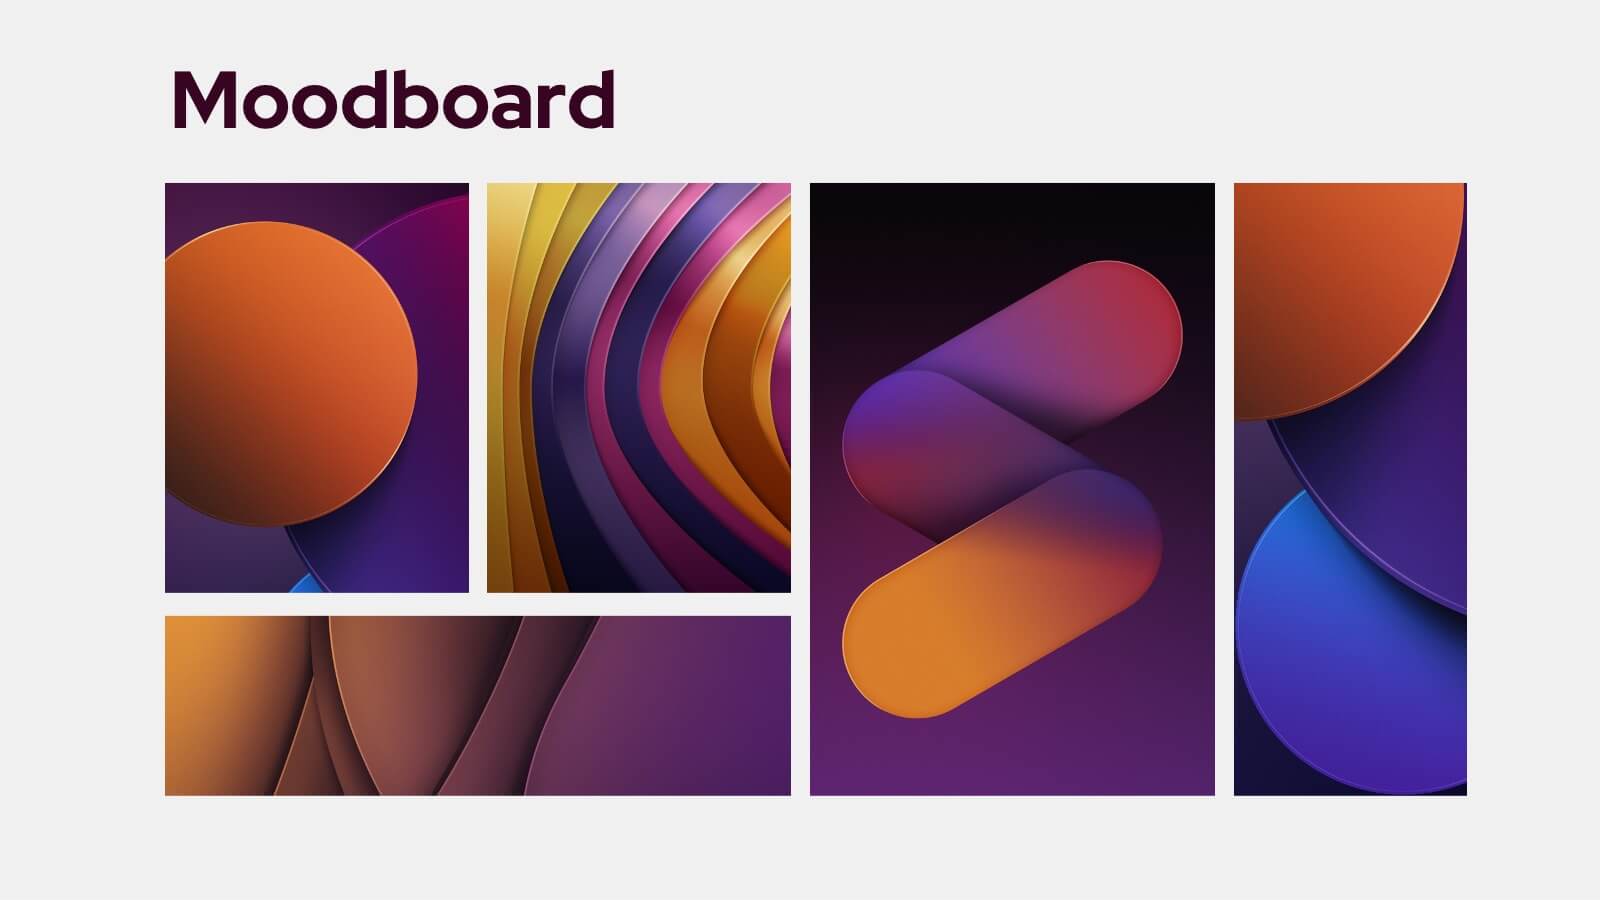
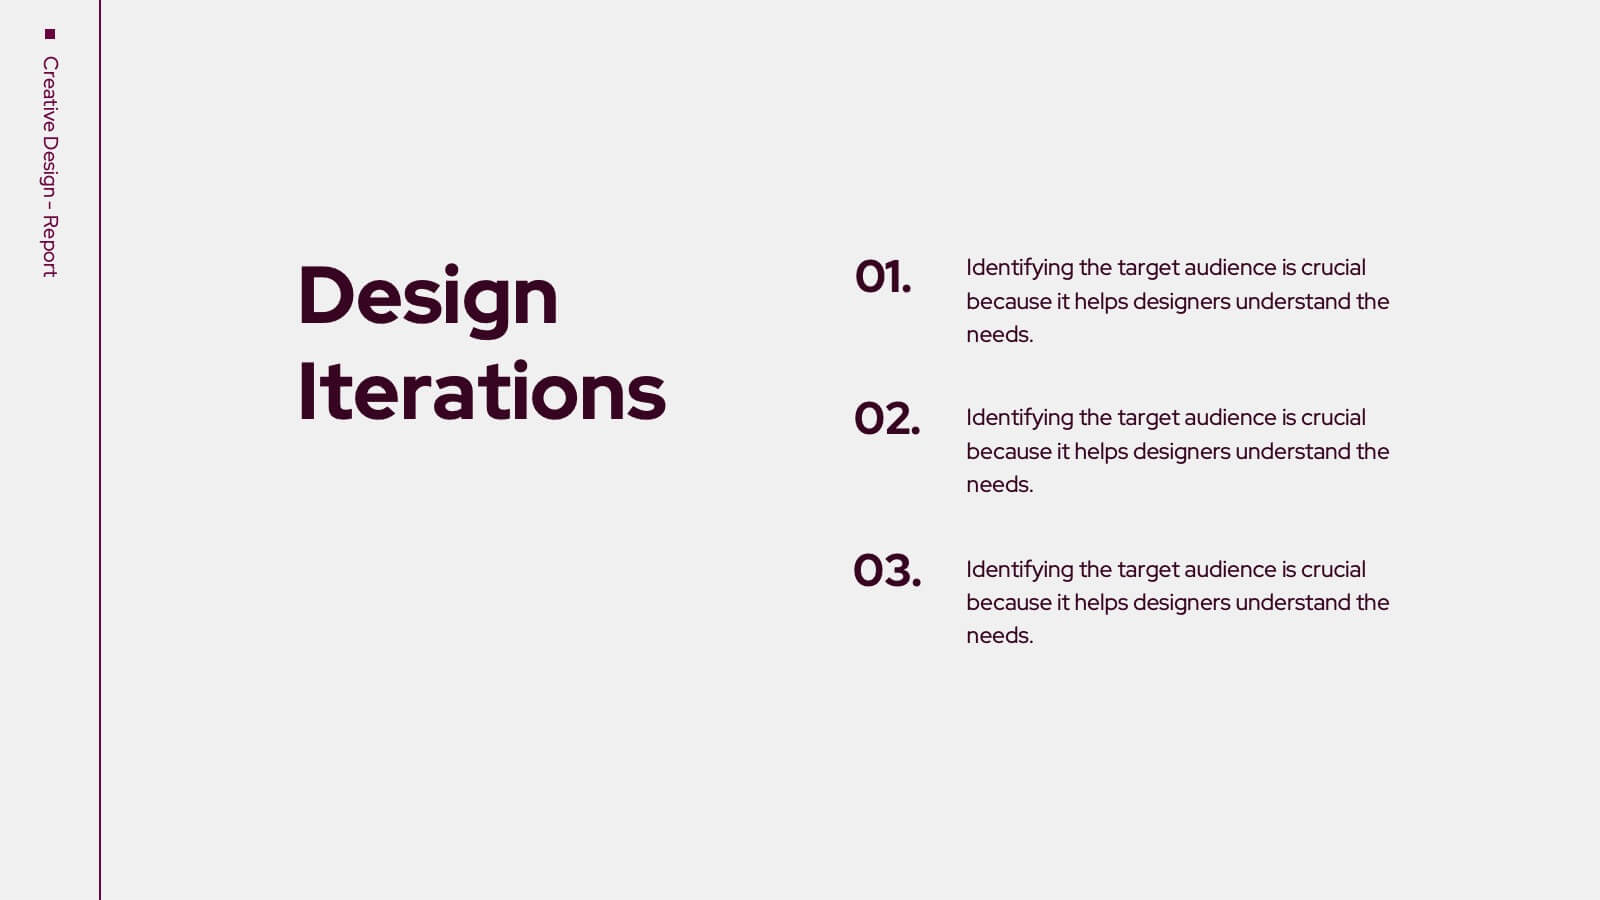
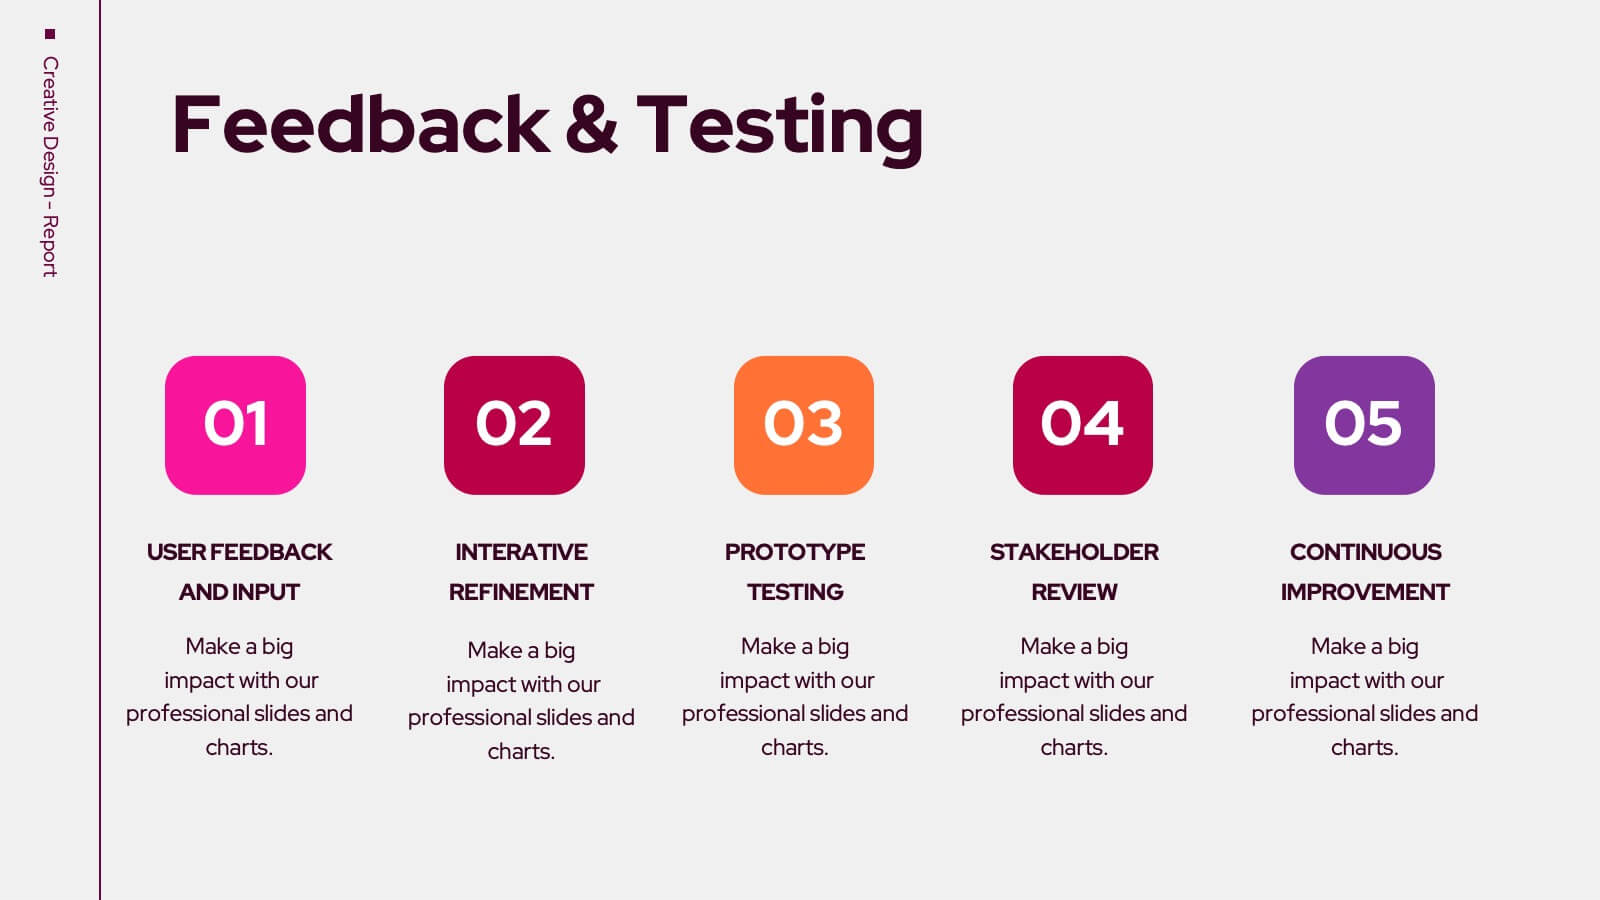
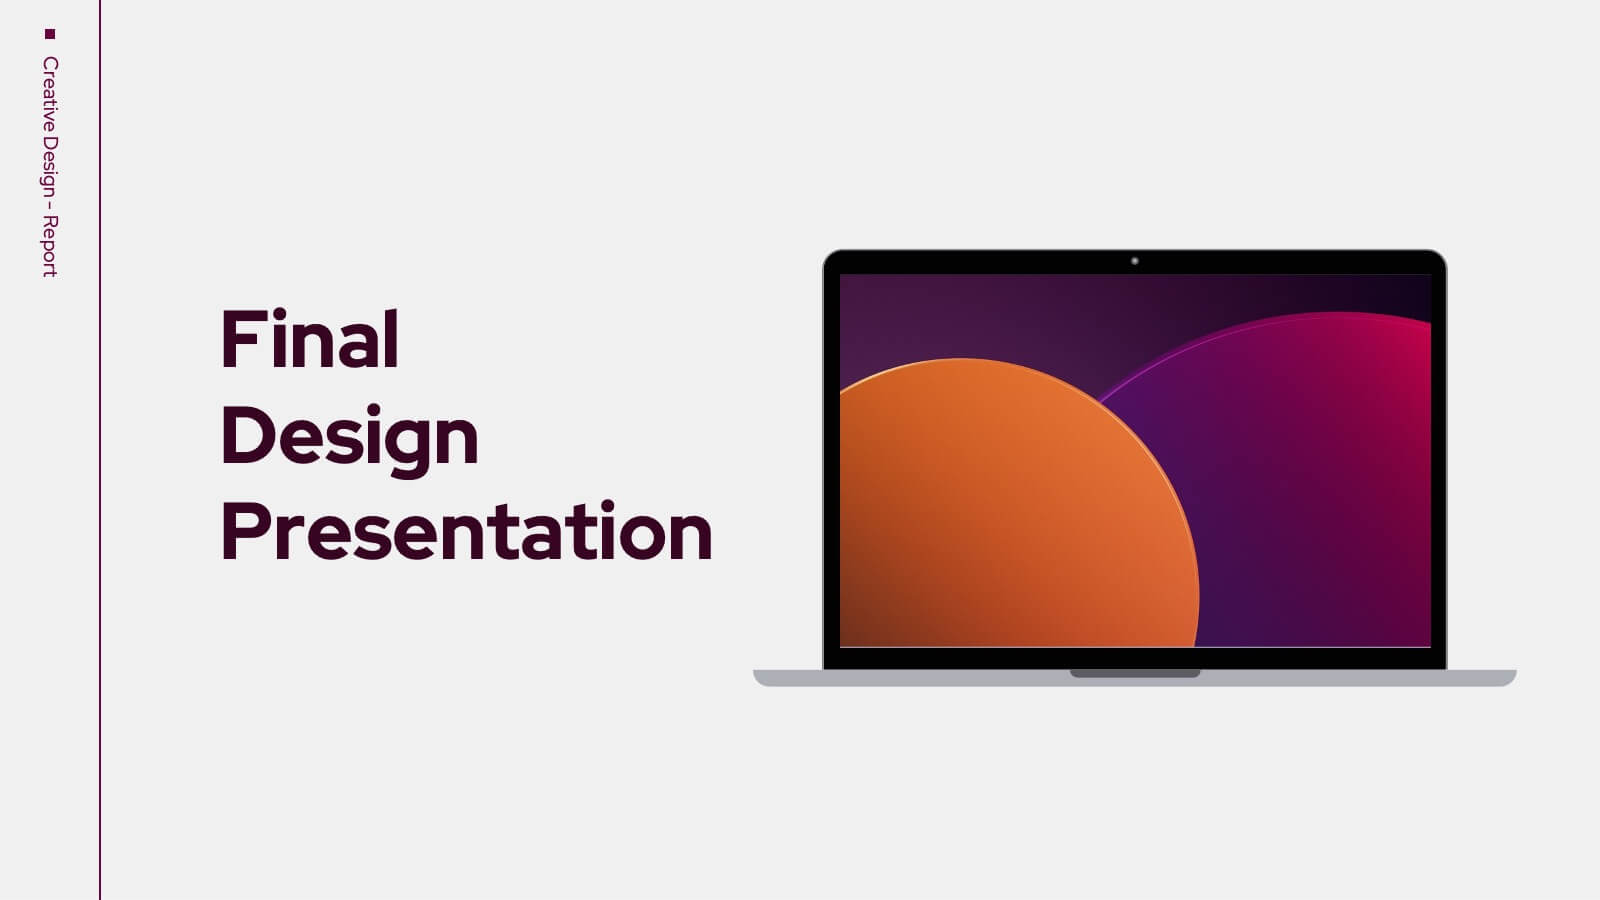
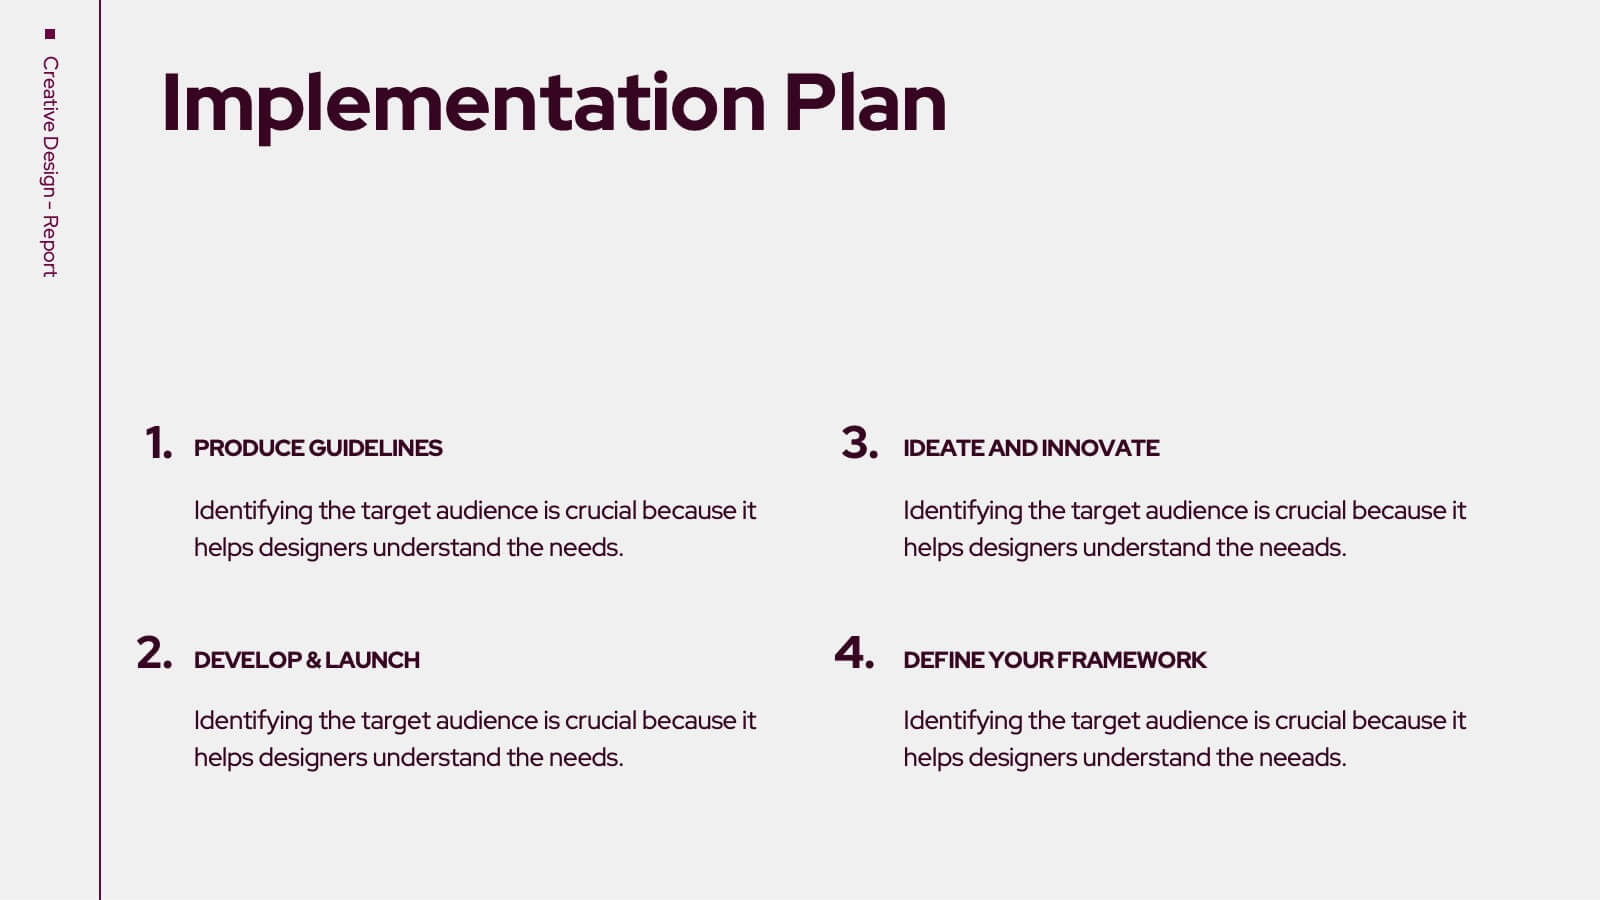
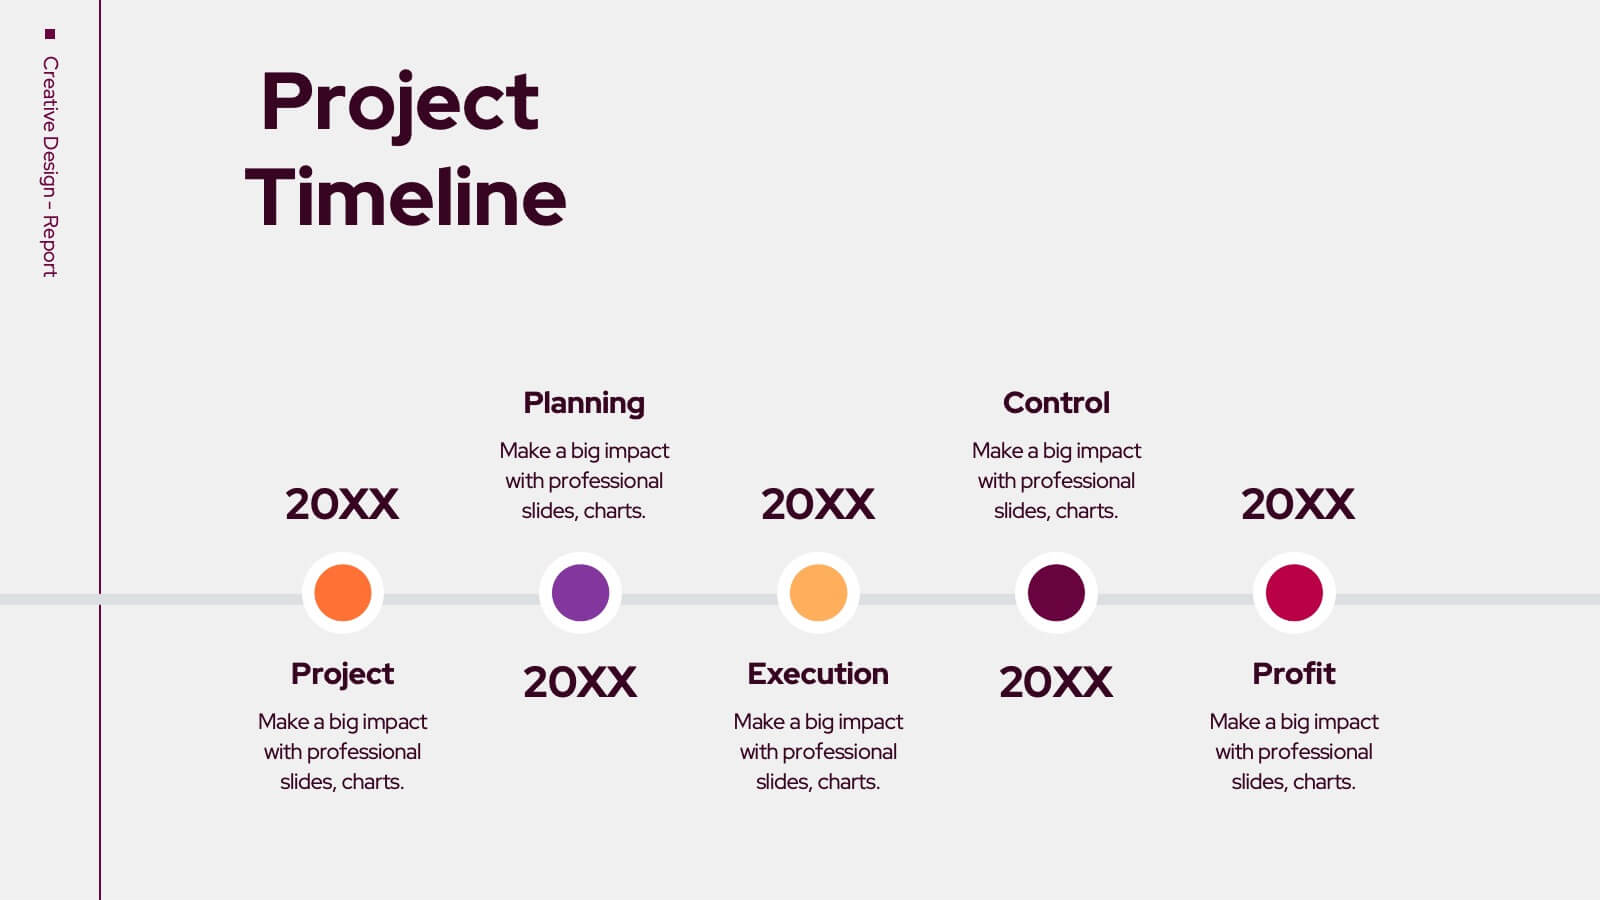
Trojan Creative Design Report Presentation
Unleash your creativity with this striking Trojan-inspired presentation template! Ideal for showcasing your design projects, this presentation enables you to highlight key concepts, inspirations, and visual elements effectively. Its engaging layout ensures your ideas shine through, captivating your audience. Compatible with PowerPoint, Keynote, and Google Slides for seamless presentations.