


Características


¿Tienes alguna pregunta?
Recomendar


2 diapositivas
Designer Portfolio for Client Showcase Presentation
Showcase your creative work with the Designer Portfolio for Client Showcase Presentation. This sleek layout emphasizes visual storytelling, making it ideal for graphic designers, illustrators, and creatives presenting to potential clients. Highlight your projects in a clean, modern format. Compatible with Canva, PowerPoint, Keynote, and Google Slides for full customization.


24 diapositivas
Crest User Experience Proposal Presentation
Present your user experience design proposal with a vibrant and engaging template! This design covers key UX aspects like user research, wireframes, prototyping, and usability guidelines. Ideal for showcasing your process from personas to interaction design, it's fully compatible with PowerPoint, Keynote, and Google Slides for seamless presentations.


4 diapositivas
Current Project Health and Status Report Presentation
Track progress with clarity using the Current Project Health and Status Report presentation slide. Featuring a modern clipboard layout with checkboxes and project tools like a pencil, magnifier, and ruler, this slide is perfect for highlighting task completion, pending issues, and project milestones. Ideal for weekly updates, stakeholder reviews, or status dashboards. Fully editable in PowerPoint, Keynote, and Google Slides.


6 diapositivas
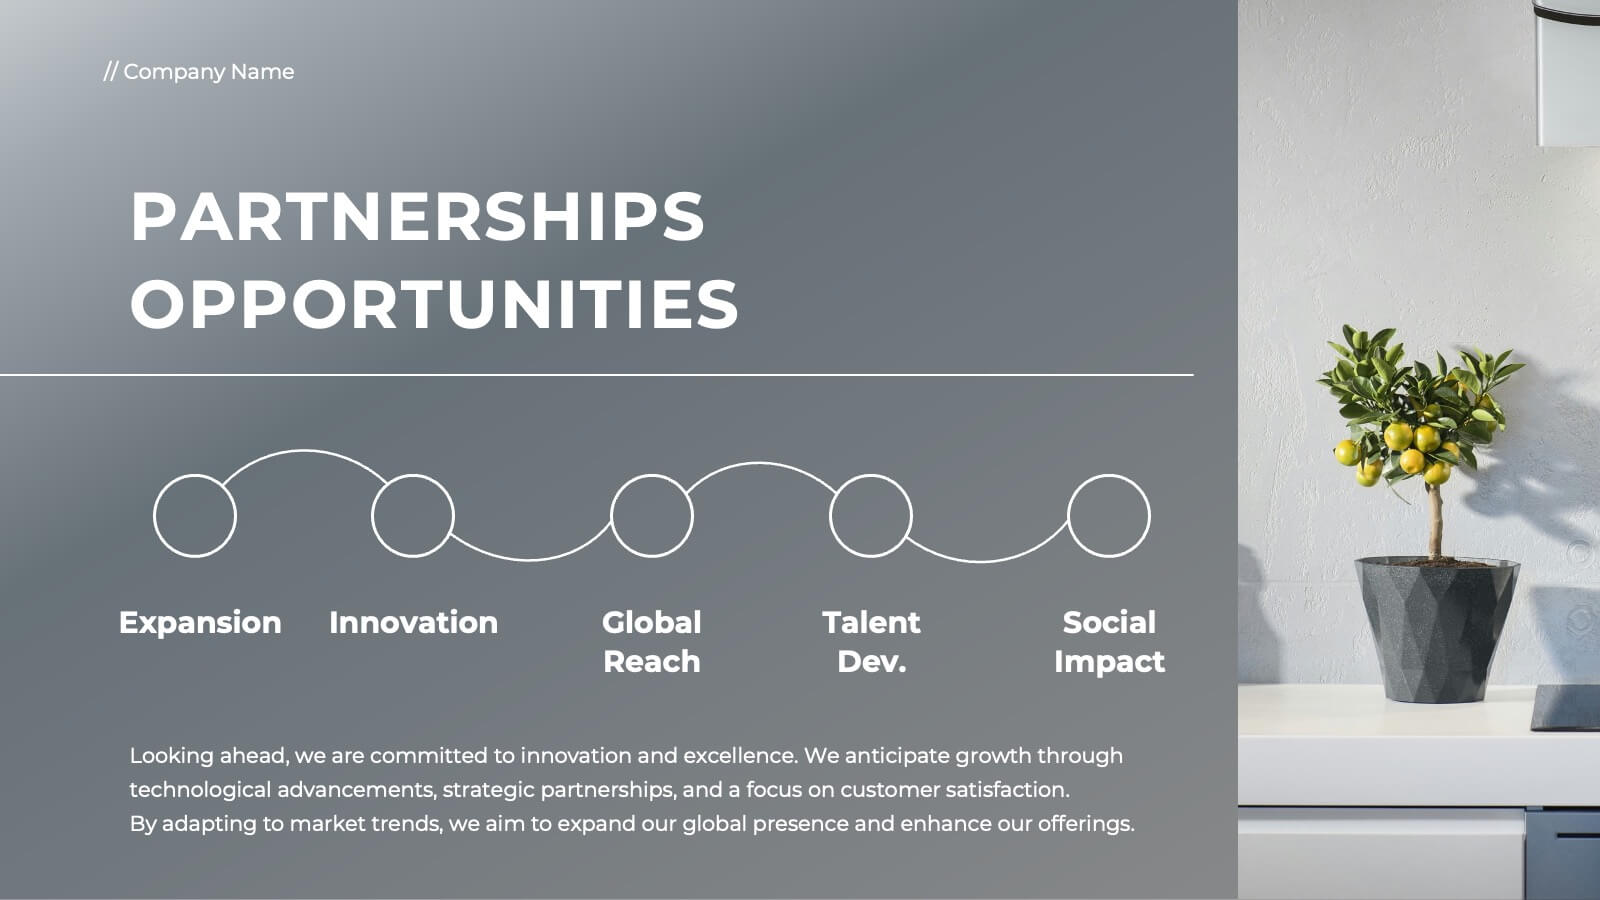
Learning Models and Instructional Design Presentation
Present educational strategies with clarity using the Learning Models and Instructional Design Presentation. This wavy, multi-step visual helps illustrate instructional stages, e-learning workflows, or training models with ease. Ideal for educators, coaches, and corporate trainers. Fully editable in PowerPoint, Keynote, Canva, and Google Slides.


26 diapositivas
Quantum Computing Presentation
Step into the future of technology with this fascinating presentation on quantum computing. Covering key concepts like quantum bits, superposition, entanglement, and real-world applications, this template helps simplify complex ideas for any audience. Fully customizable and compatible with PowerPoint, Keynote, and Google Slides for a seamless and insightful presentation experience.


21 diapositivas
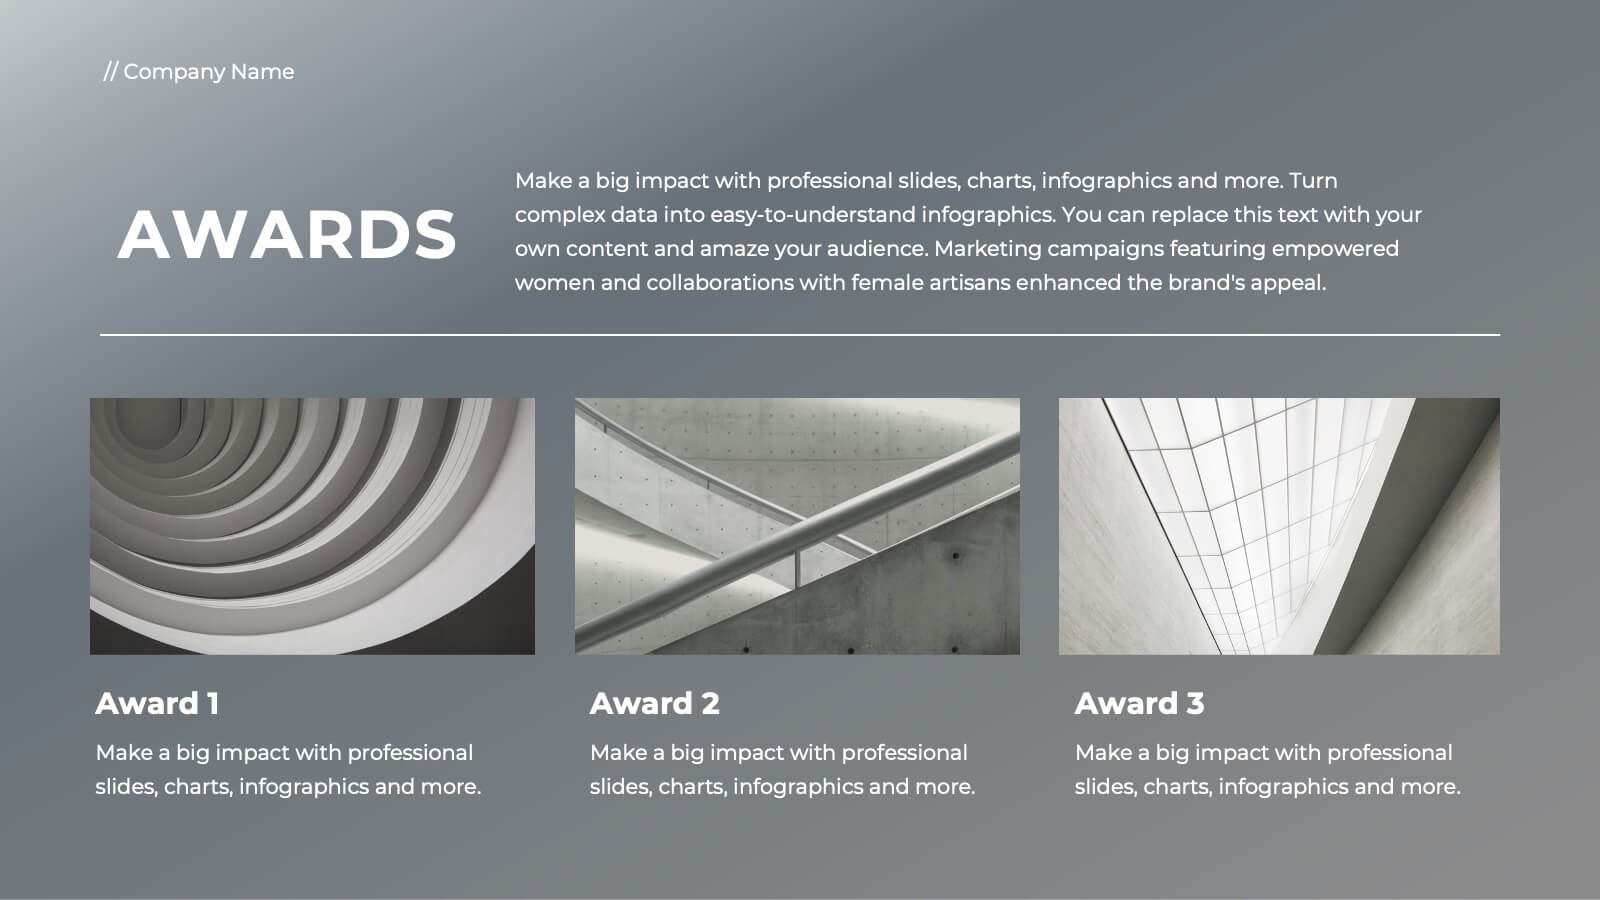
Luminary Annual Report Presentation
Create stunning annual reports with this sleek template! Highlight key achievements, financial summaries, and performance metrics. Perfect for showcasing operational updates, strategic initiatives, and market trends. Designed for business professionals and analysts. Compatible with PowerPoint, Keynote, and Google Slides.


7 diapositivas
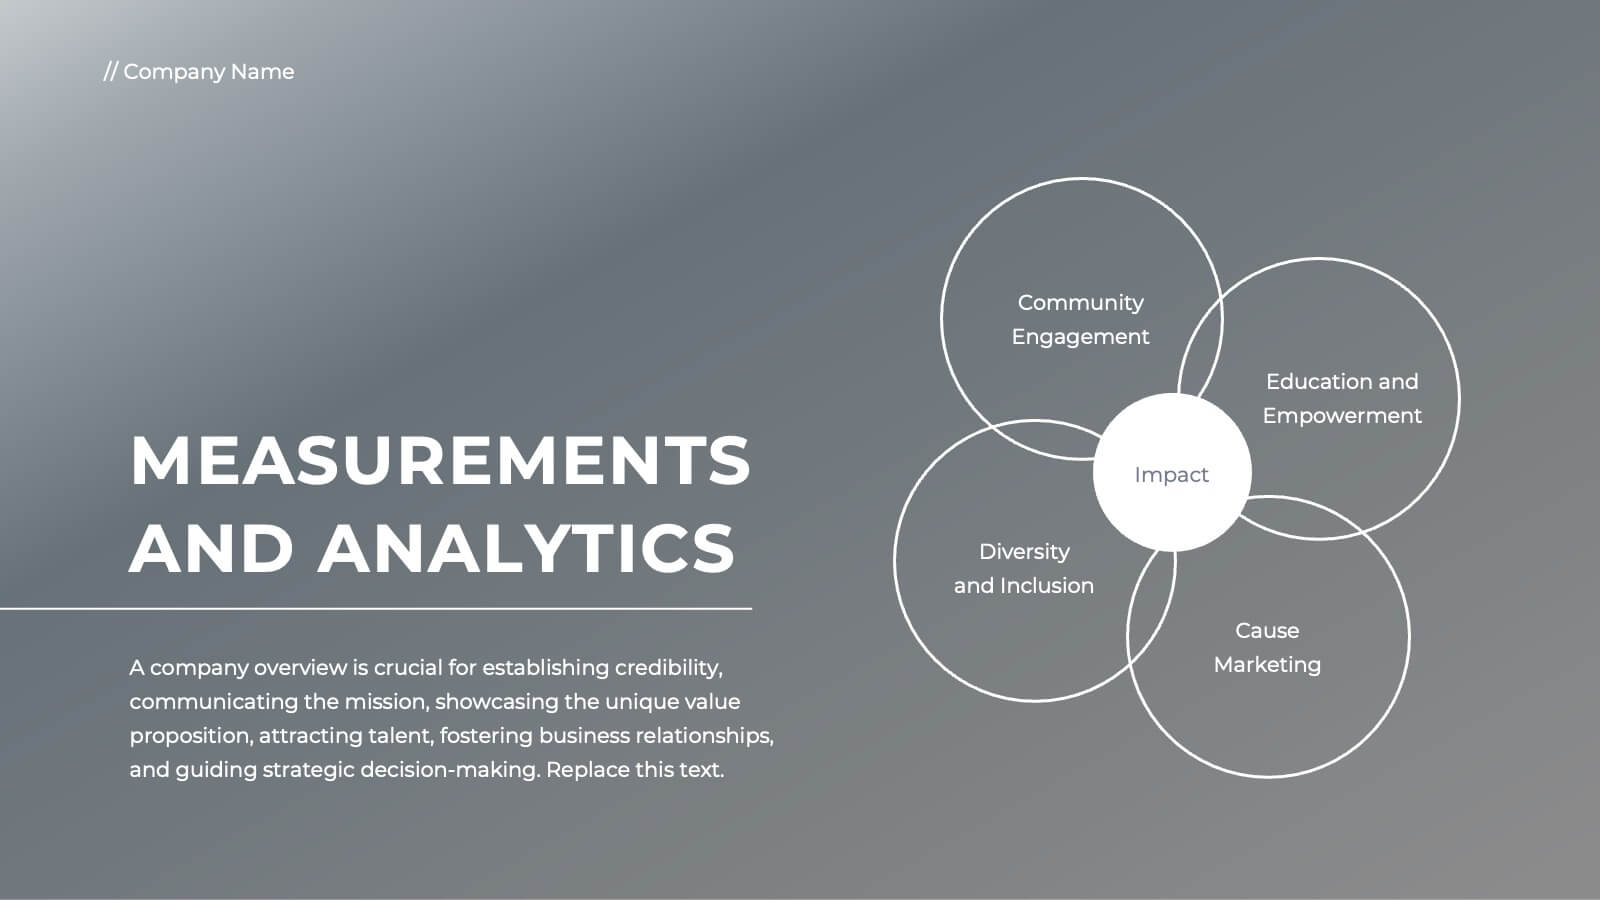
Mind-Brain Concept Diagram Presentation
Visualize cognitive processes with the Mind-Brain Concept Diagram. This engaging infographic presents six key elements surrounding a central brain illustration, making it ideal for psychology, neuroscience, or decision-making presentations. Fully editable with customizable text, colors, and icons. Compatible with PowerPoint, Keynote, and Google Slides for seamless integration.


5 diapositivas
5-Level Smile Rating Presentation
Give your audience a fun, visual way to understand sentiment with this colorful rating slide. Perfect for feedback summaries, project reviews, or performance insights, it displays five clear emotion levels in a simple, engaging format. Easy to customize and fully compatible with PowerPoint, Keynote, and Google Slides.


4 diapositivas
Environmental Sustainability Strategy Presentation
The "Environmental Sustainability Strategy" presentation template is a visually engaging tool designed to outline an organization's approach to integrating sustainable practices into its operations. The template illustrates the journey from social to environmental and corporate sustainability, represented by seedlings growing into mature plants, symbolizing development and growth in sustainable practices. This template is perfect for businesses aiming to communicate their commitment to sustainability, detailing specific strategies and milestones in social, environmental, and corporate domains. It encourages viewers to think about the progressive stages of implementing sustainable actions within a corporate framework.
22 diapositivas
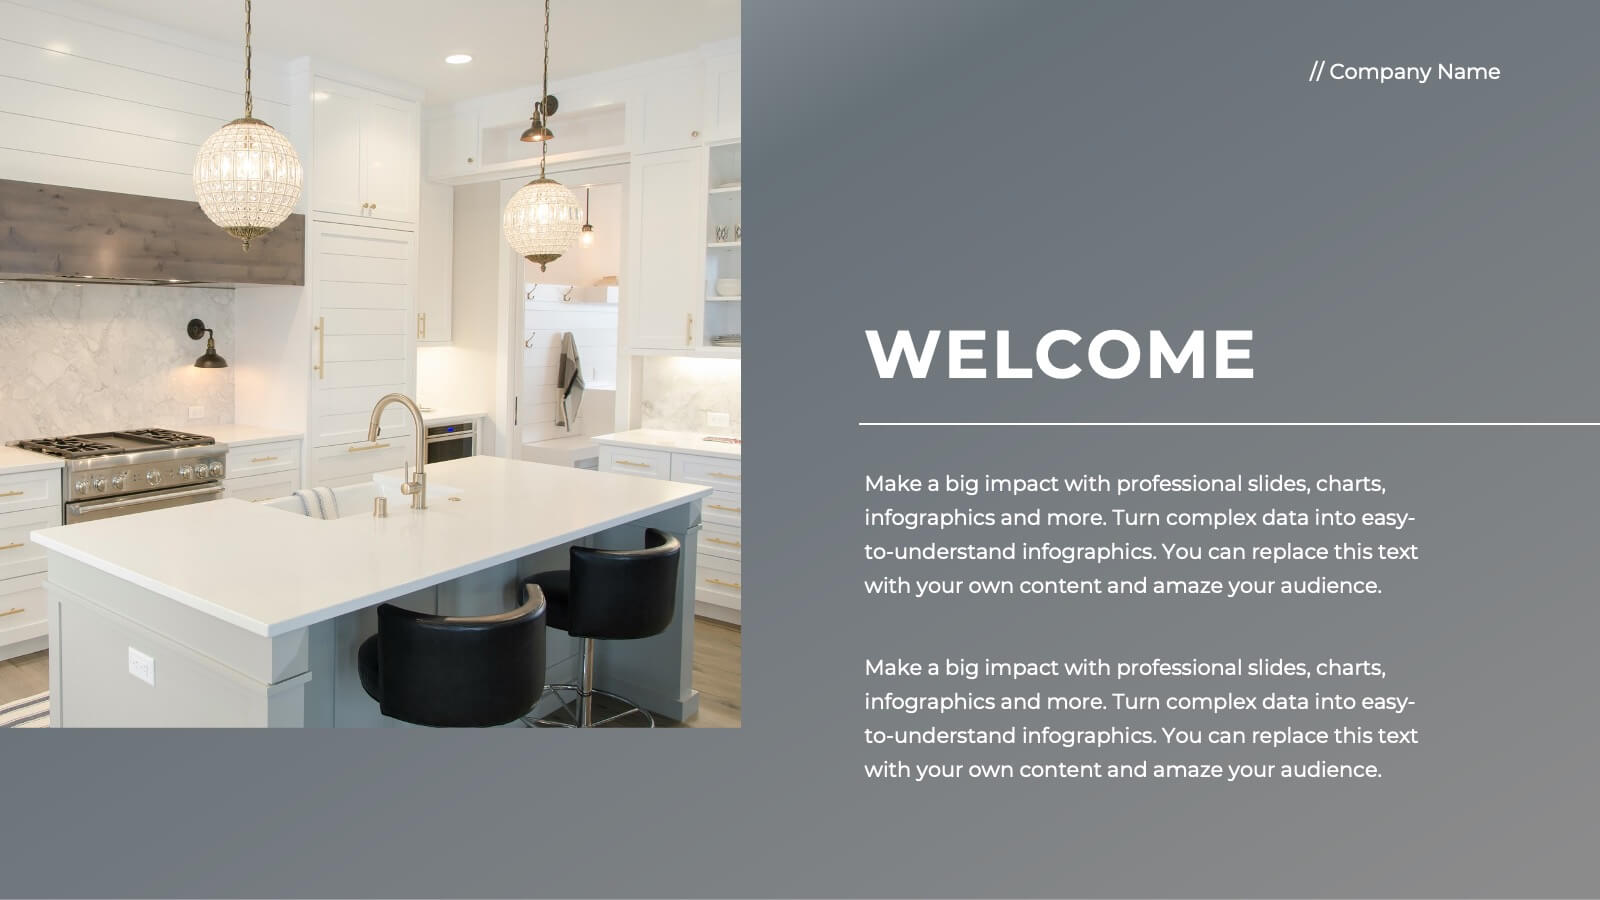
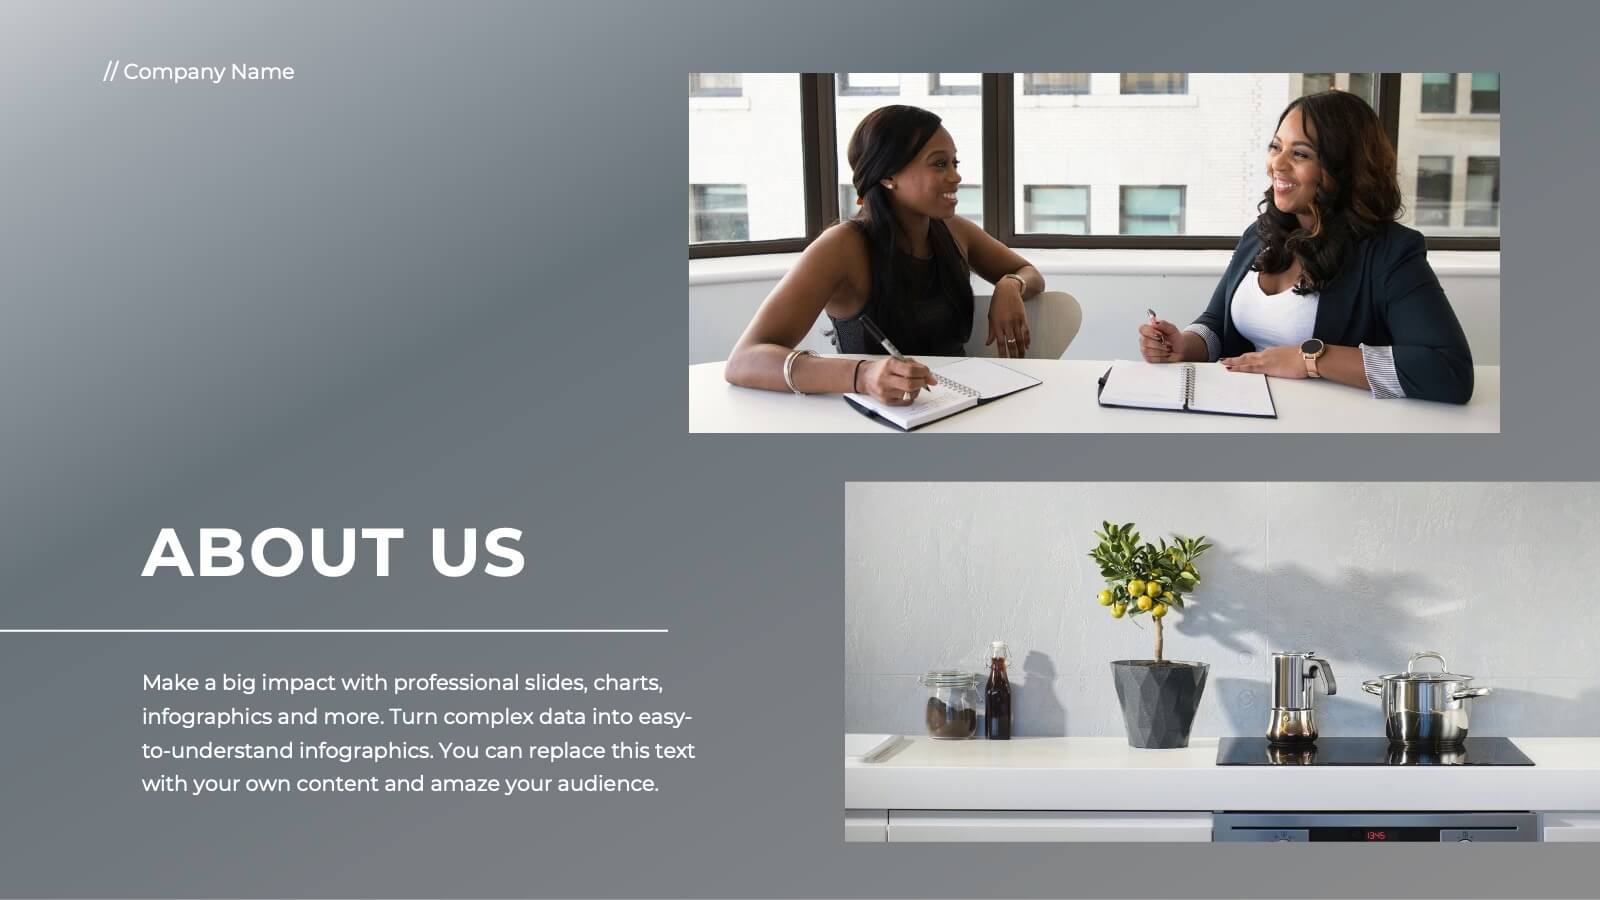
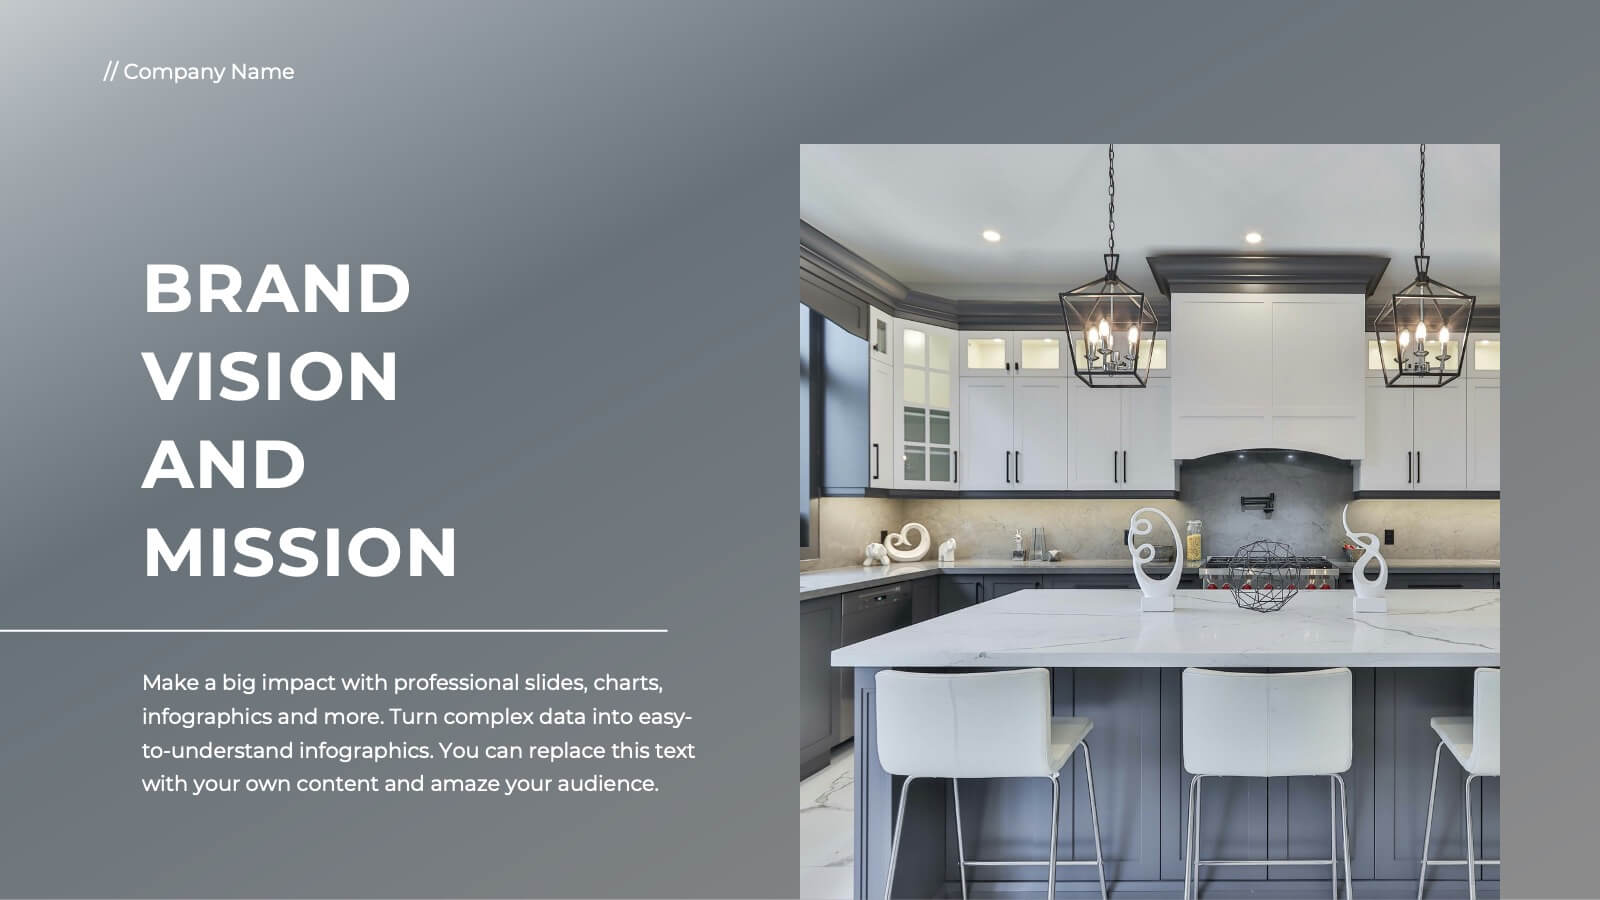
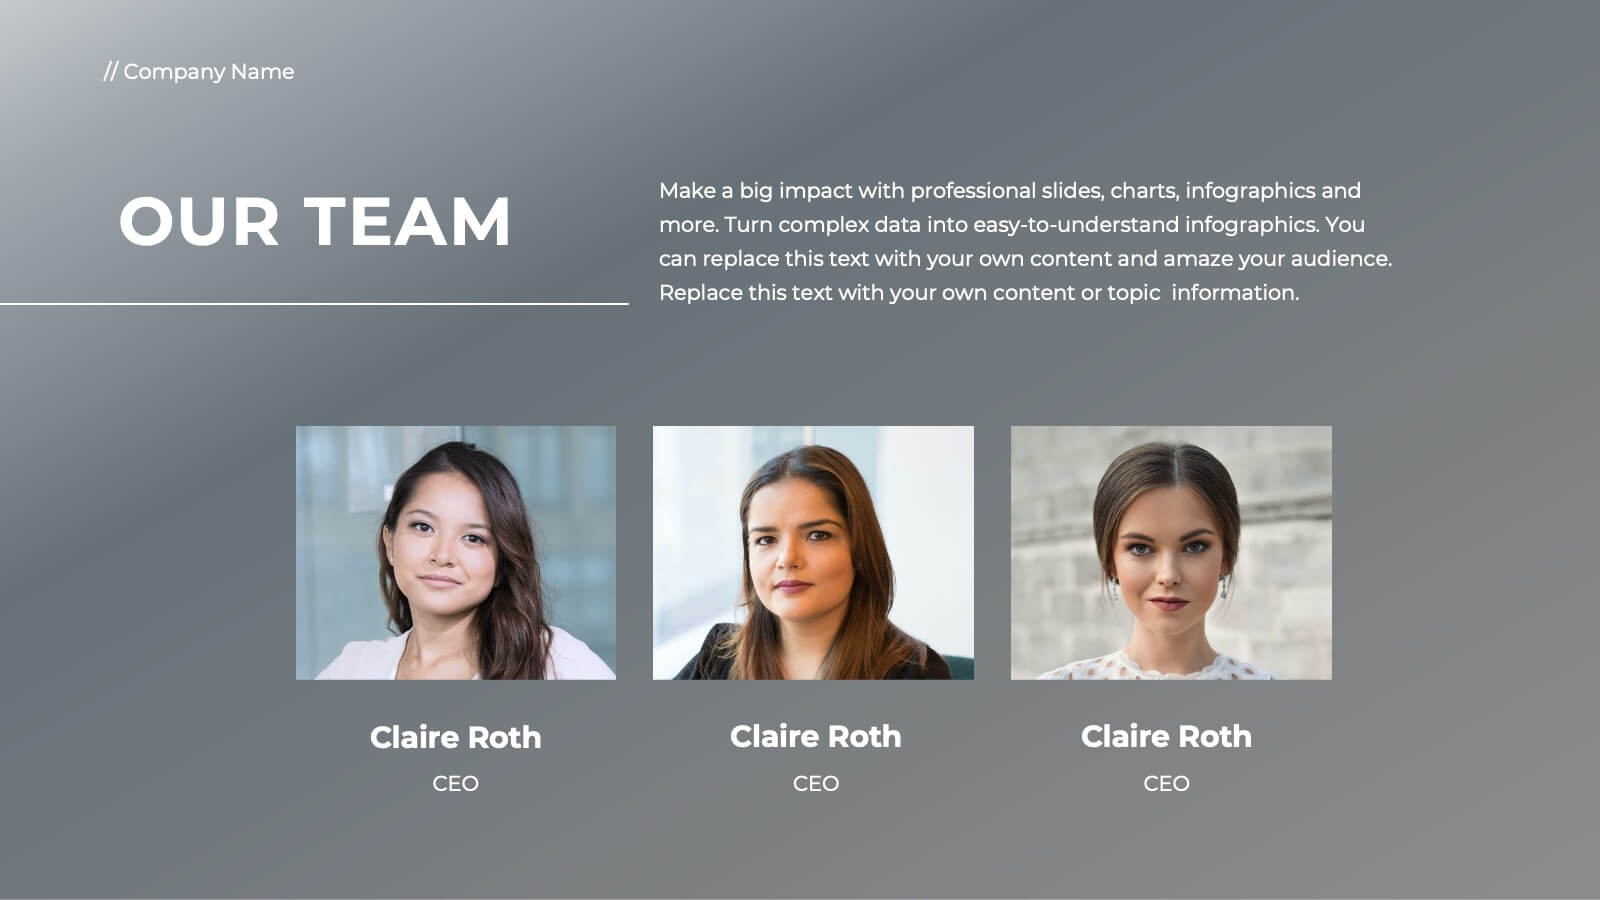
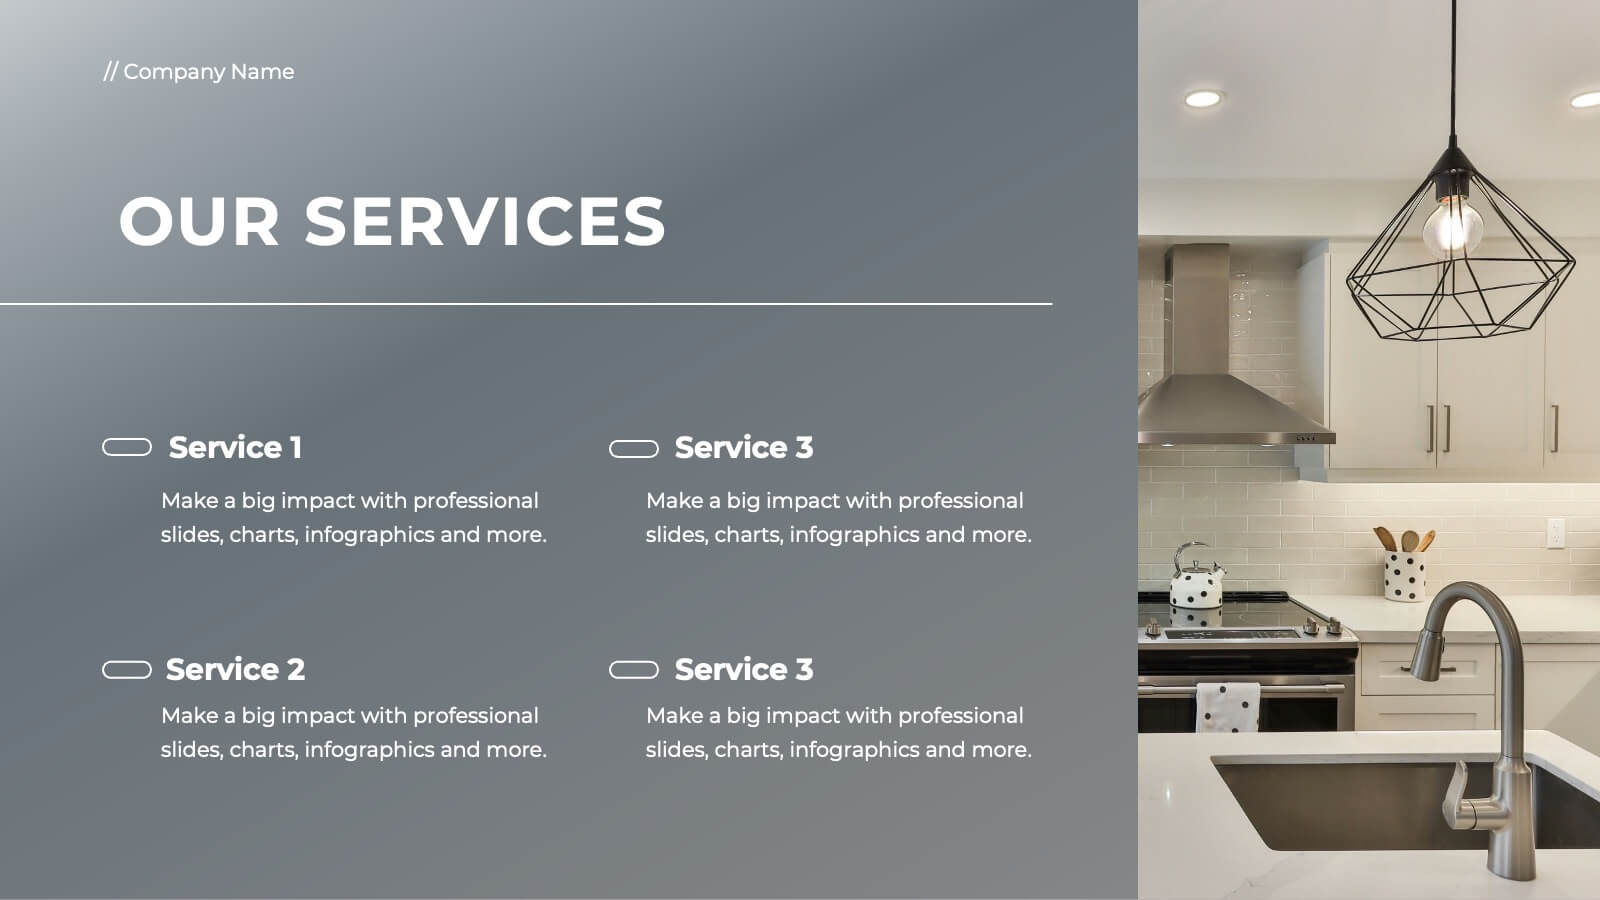
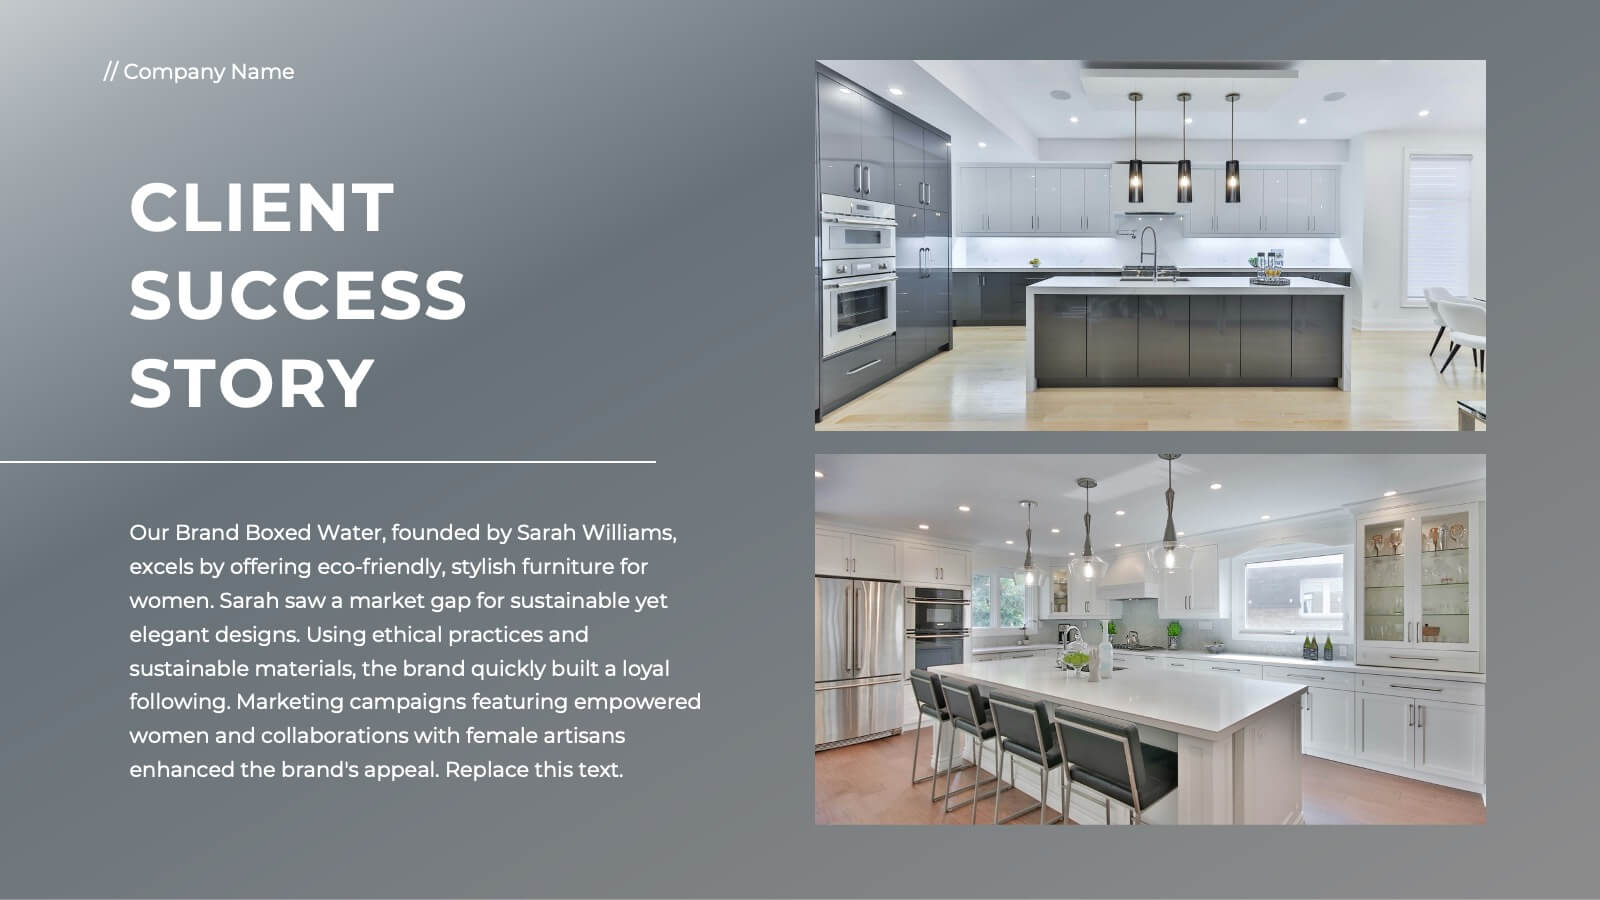
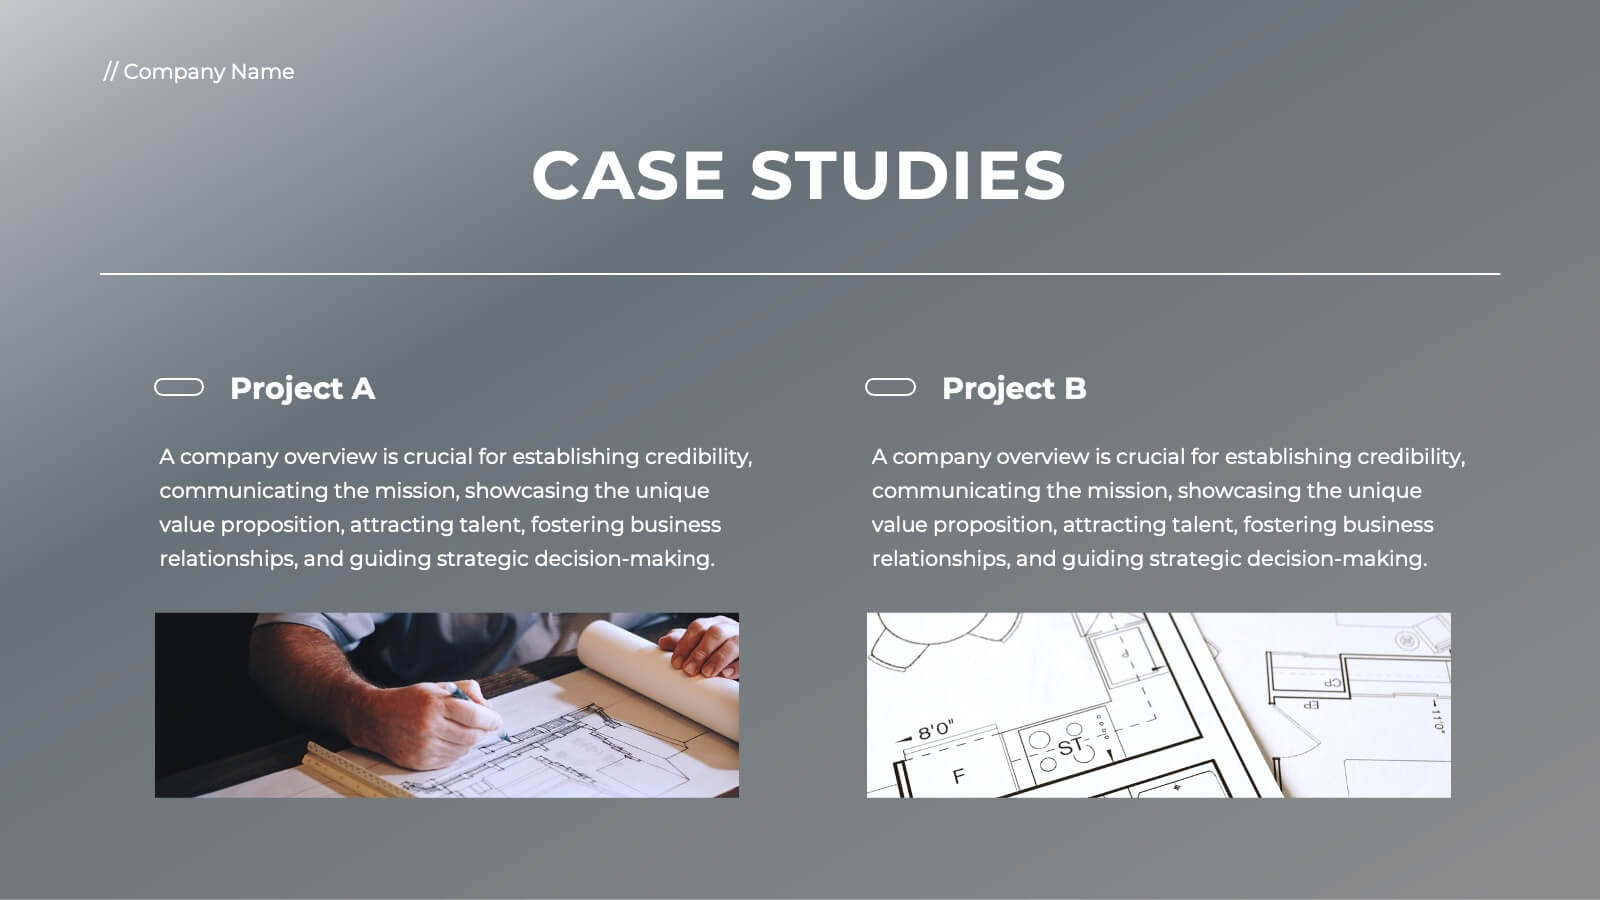
Ember Full-Service Agency Project Plan Presentation
Elevate your agency's presentation with this sleek project plan template! Ideal for showcasing your team's vision, market analysis, and client success stories, it includes slides for strategic development, campaign execution, and partnerships. Impress clients and stakeholders with professional visuals and detailed content. Compatible with PowerPoint, Keynote, and Google Slides for seamless presentations on any platform.


6 diapositivas
Organized TOC Page for Reports Presentation
Make your reports easy to navigate with this Organized Table of Contents slide. Featuring modern icons, image placeholders, and clean formatting, it’s perfect for business briefs, analytics, and internal documents. Fully editable in PowerPoint, Keynote, and Google Slides—ideal for structuring complex information into a visually appealing and accessible format.


6 diapositivas
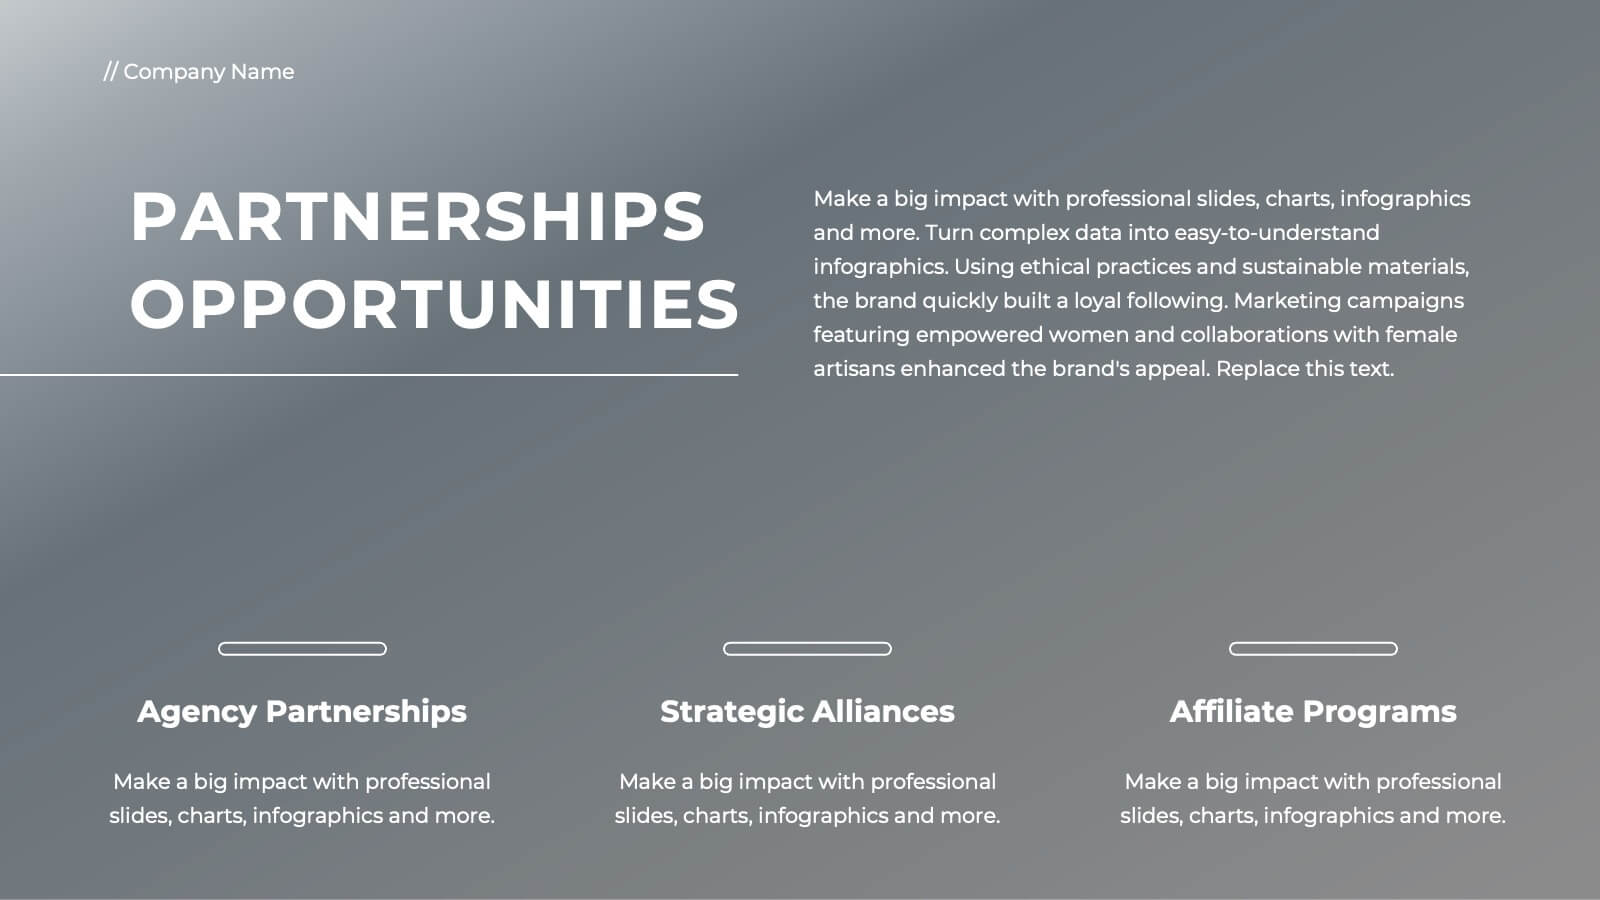
Business Plan Next Steps Presentation
Map out your strategy with the Business Plan Next Steps Presentation template. This visually structured layout helps outline key actions, milestones, and priorities for business growth and execution. Ideal for entrepreneurs, executives, and project managers, this slide ensures clarity and alignment on upcoming initiatives. Fully customizable in PowerPoint, Keynote, and Google Slides for easy integration into your planning process.
20 diapositivas
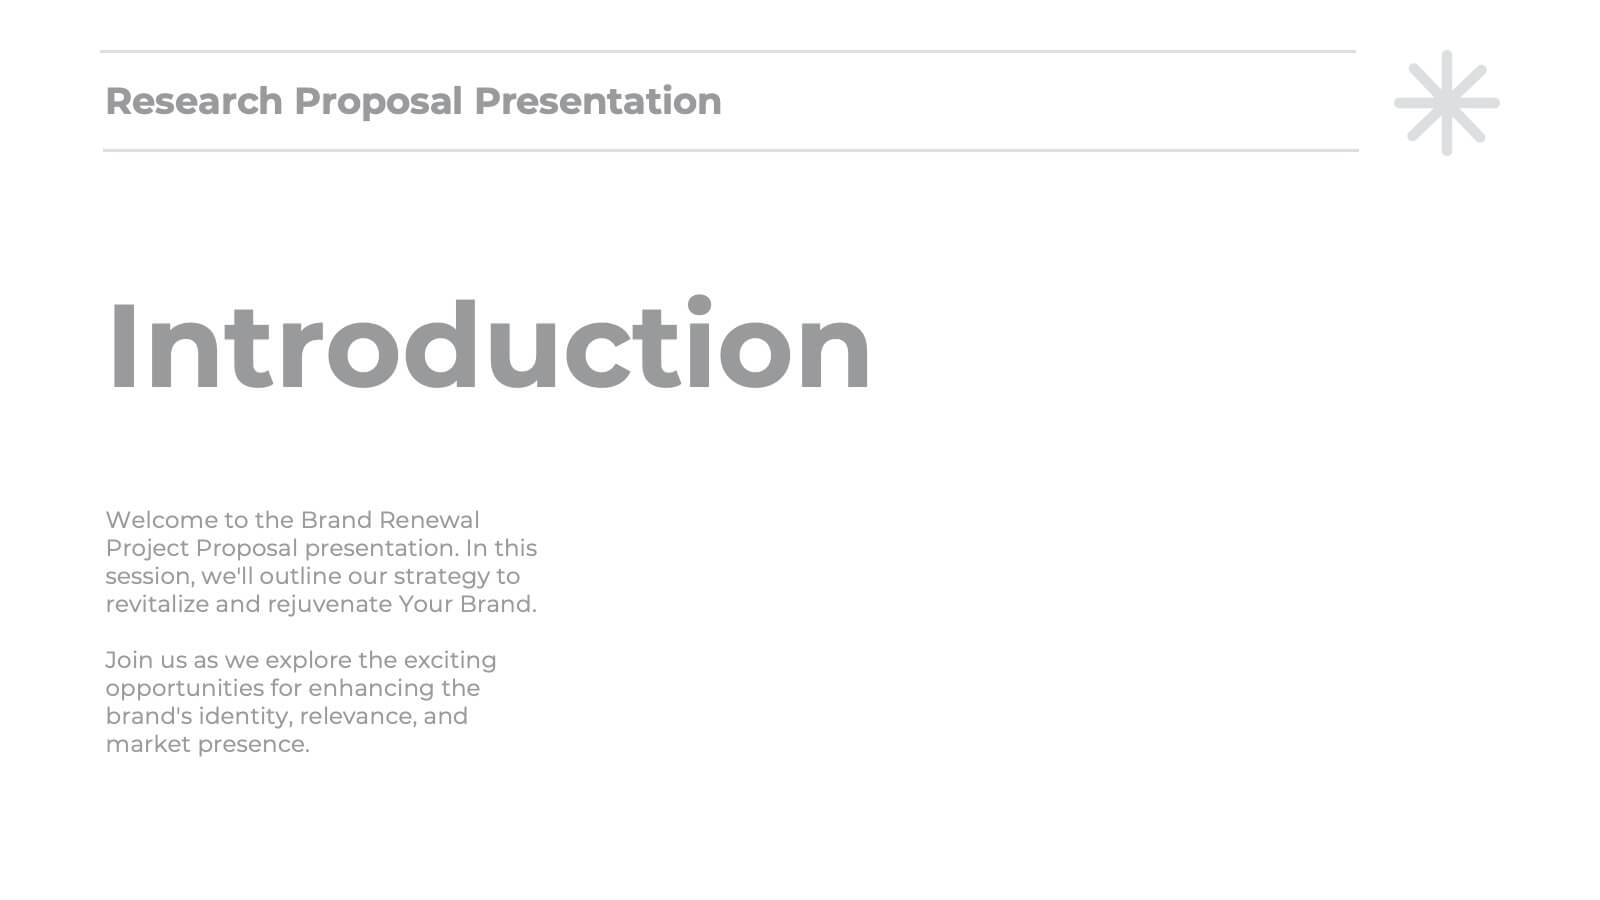
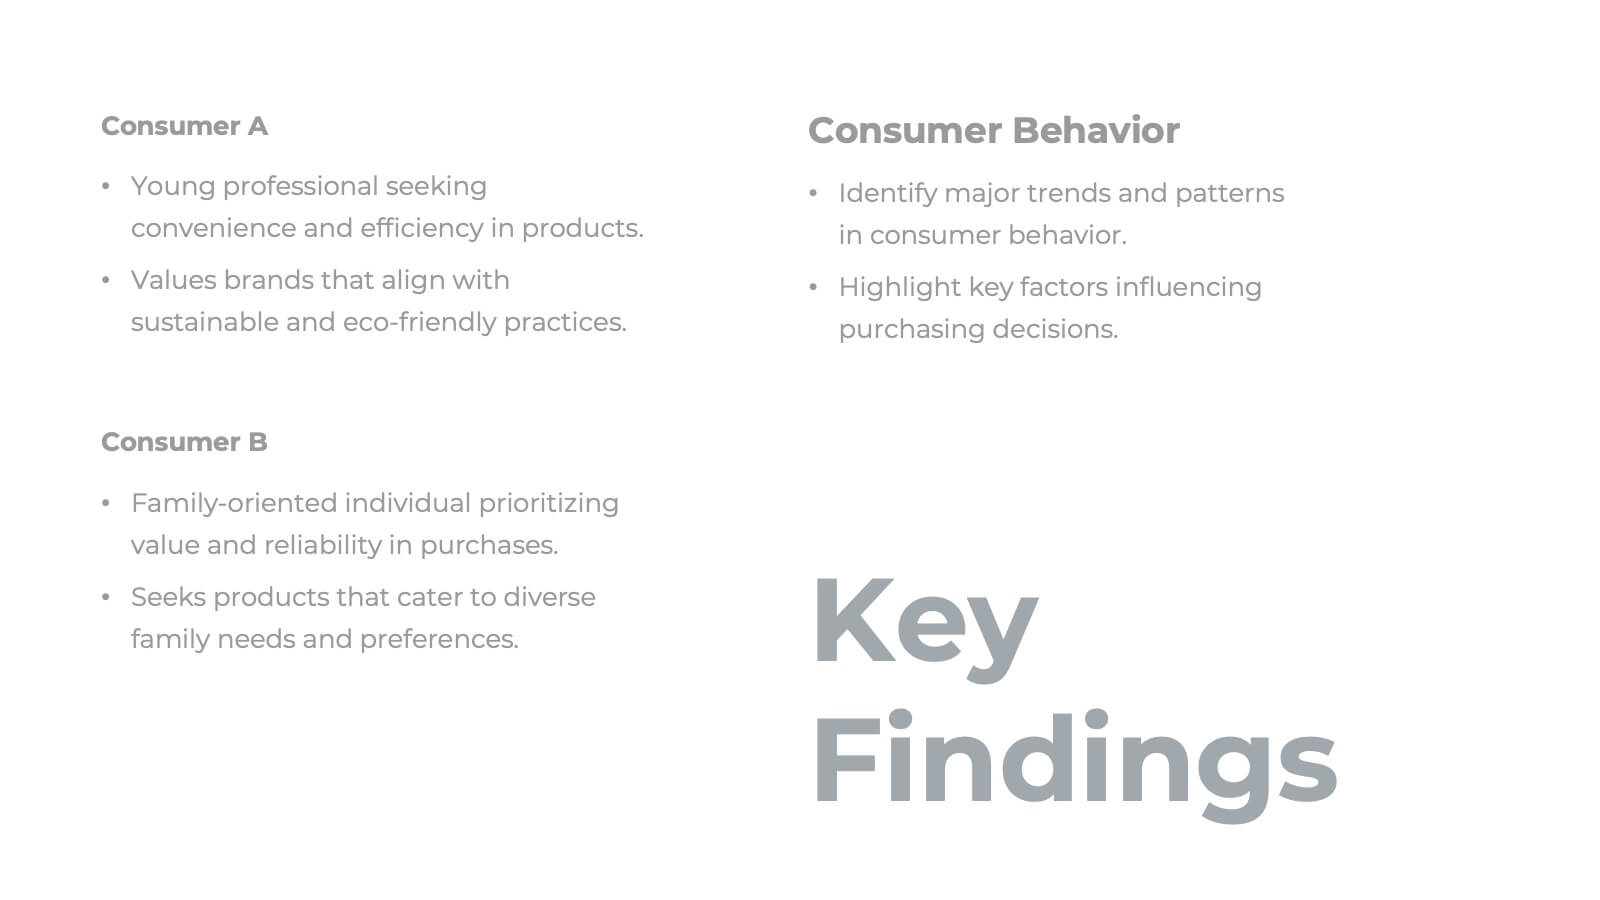
Malachite Research Proposal Presentation
Present your research findings with clarity and professionalism using this structured research presentation template! Covering all essential elements, from research objectives and methodology to key findings and implications, this template ensures your work is communicated effectively. It's perfect for academic, corporate, or scientific presentations. Compatible with PowerPoint, Keynote, and Google Slides, it's versatile and ready for your next project.


5 diapositivas
Health Care Infographics
Taking care of your health is an investment in your future self and can lead to a happier and more fulfilling life. These vertical health care infographics are visual representations of information related to health care. They can cover a wide range of topics, such as disease prevention, medical treatments, and patient care. These are designed to be easily understandable and engaging for a general audience. They use colorful graphics and illustrations to convey complex information in an eye-catching manner. These also include graphs, diagrams text boxes, and other design elements to highlight key information.


5 diapositivas
Strategic Planning Model Presentation
Align your vision with action using the Strategic Planning Model Presentation. This pyramid-based slide design is ideal for breaking down your long-term strategy into four structured, actionable layers. From foundational ideas to top-level goals, each tier includes space for clear, concise business insights. Fully customizable and compatible with PowerPoint, Keynote, and Google Slides for seamless editing.


5 diapositivas
Company History and Growth Timeline Presentation
Present your milestones with clarity using the Company History and Growth Timeline presentation. Ideal for startups, enterprises, and project retrospectives, this timeline layout helps you highlight key achievements, growth phases, and expansion years in a visually structured format. With modern design elements, editable text fields, and dynamic year markers, it's perfect for telling your brand story or progress journey. Fully compatible with PowerPoint, Keynote, and Google Slides.


5 diapositivas
4 Steps Travel Itinerary Slide Presentation
Plan every adventure with a slide that makes travel feel effortless and exciting. This presentation helps you map out destinations, activities, and budgets in four clear, intuitive steps—perfect for trip planning or presenting itinerary options. Designed for smooth customization and fully compatible with PowerPoint, Keynote, and Google Slides.