


Características


¿Tienes alguna pregunta?
Recomendar
7 diapositivas
Project Status Tracking Infographic
For any project manager or team leader, tracking the progress and status of projects is paramount. This project status tracking infographic simplifies this task, offering a visually appealing representation of every project phase. With a predominant palette of white and blue, this design captures attention and imparts clarity. Tailored for project managers, stakeholders, and team members, this infographic acts as a dynamic snapshot of ongoing tasks, completed milestones, and impending deadlines. Designed for seamless use with PowerPoint, Keynote, and Google Slides, it's your ultimate tool for effective project communication.


6 diapositivas
Six Sigma DMAIC Method Presentation
Bring clarity and momentum to your improvement plan with this dynamic presentation, designed to visually guide teams through each stage of a structured problem-solving process. It helps you present goals, insights, and actions with confidence while keeping the workflow clear and engaging. Fully compatible with PowerPoint, Keynote, and Google Slides.


6 diapositivas
Corporate Governance Strategy
Present your company’s leadership structure with clarity using this corporate governance strategy slide. This hexagonal framework highlights key areas such as vision, objectives, and strategy—surrounded by six supporting pillars. Each section includes editable icons and text for board responsibilities, ethics, oversight, and more. Ideal for executive updates, policy reviews, and stakeholder reports. Fully customizable in PowerPoint, Keynote, and Google Slides.


5 diapositivas
Business Vision Statement Presentation
Focus on the future with our "Business Vision Statement" presentation template, ideal for outlining your company's aspirations. This visually engaging template helps you present your business's core values and long-term goals, ensuring alignment across the organization. Perfect for strategic meetings and stakeholder presentations, it is compatible with PowerPoint, Keynote, and Google Slides. This template is a crucial tool for leaders looking to inspire and direct their teams towards common objectives.


6 diapositivas
Real Estate Classes Infographic
Real estate classes are educational programs or courses that provide individuals with the knowledge and skills needed to succeed in the real estate industry. This infographic template provides an overview of different types of real estate classes and what real estate is. This is designed to help individuals interested in the real estate industry understand the various educational opportunities available to them. Help your audience make informed decisions about their educational journey in the real estate field. Fully customizable and compatible with Powerpoint, Keynote, and Google Slides.


5 diapositivas
Healthcare Lifestyle Infographic
Maintaining a healthy lifestyle can prevent or manage many health problems and improve one's quality of life. These vertical infographics are an effective way to convey information about health and wellness to a wide audience. This infographic can be used to showcase statistics, health tips, and other information related to healthy living. It is a visually stunning and informative way to present important health and wellness information. This template includes special sections for showcasing key statistics and facts related to health and wellness, as well as tips for maintaining a healthy lifestyle.


23 diapositivas
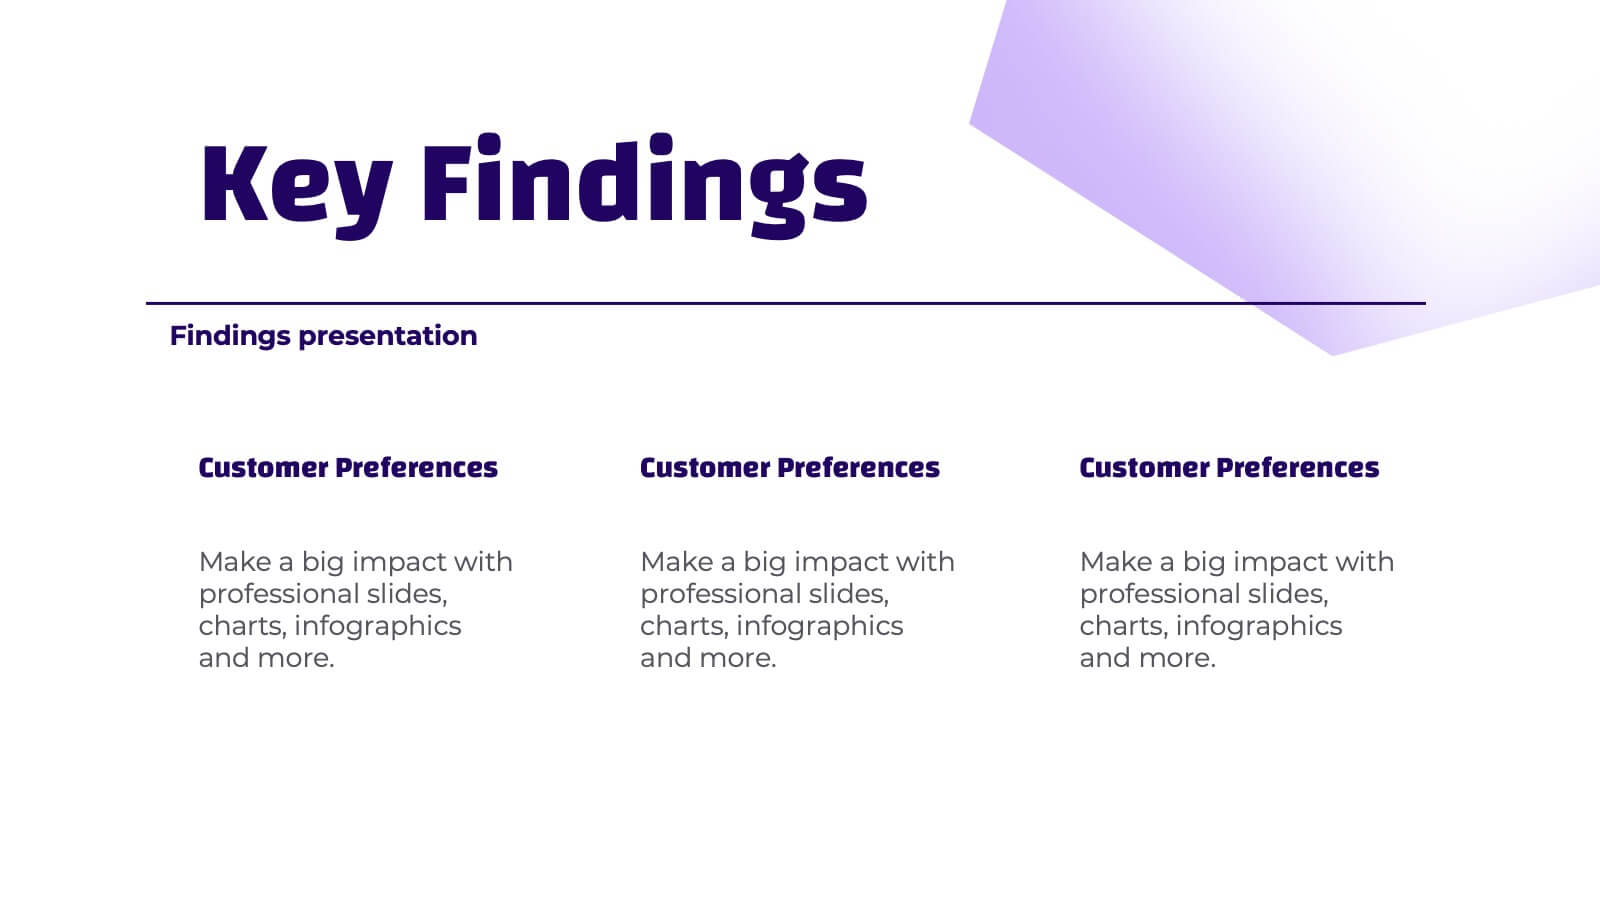
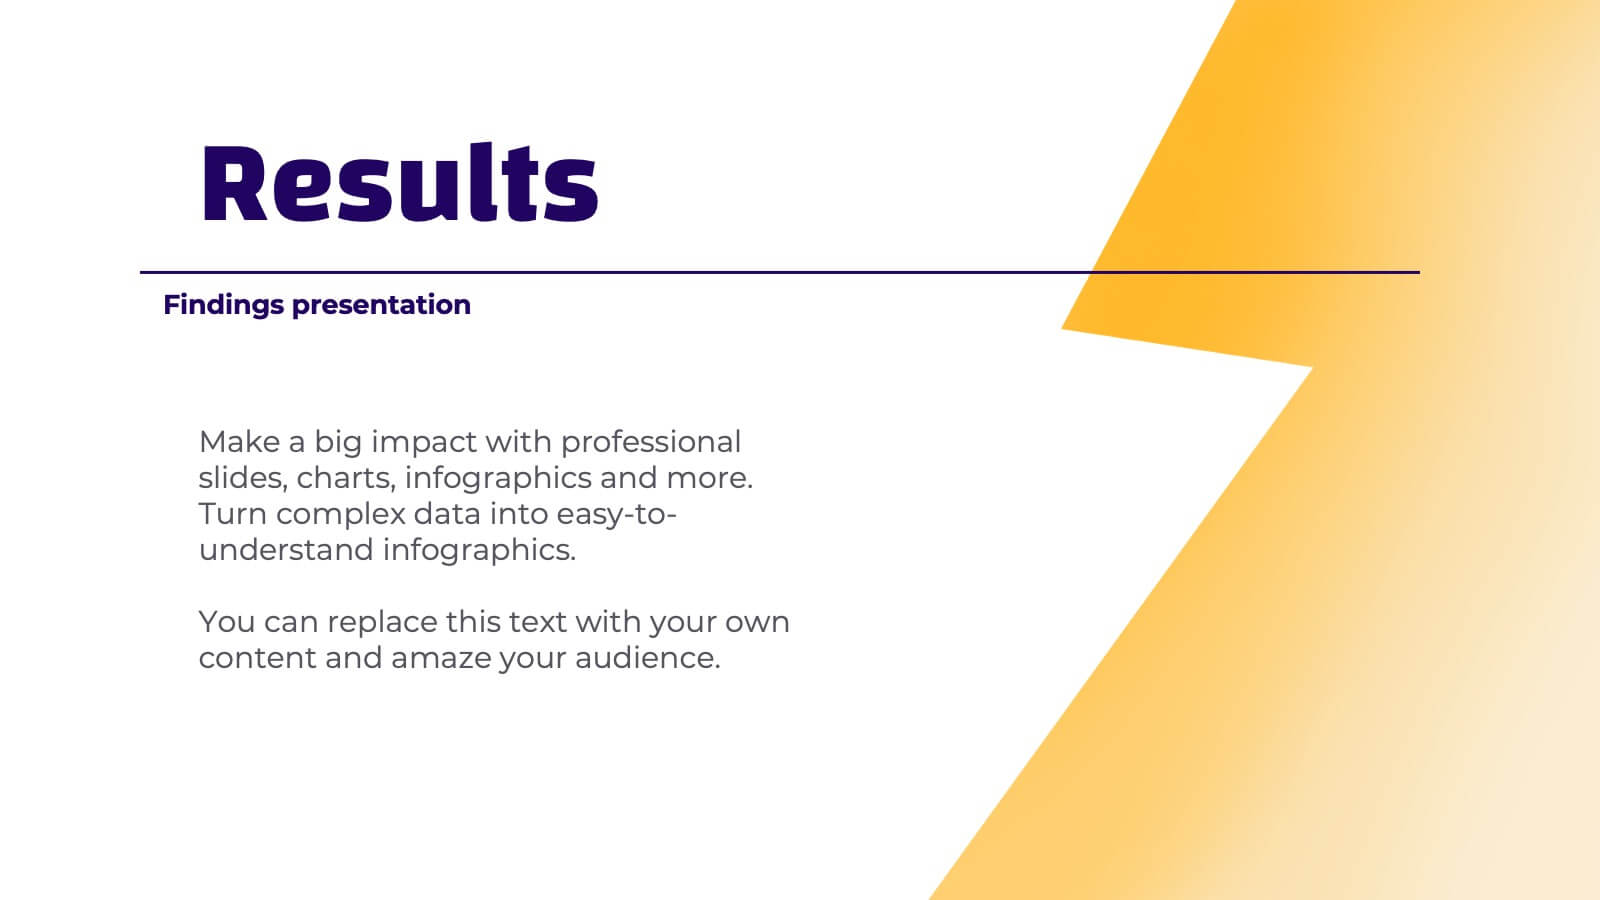
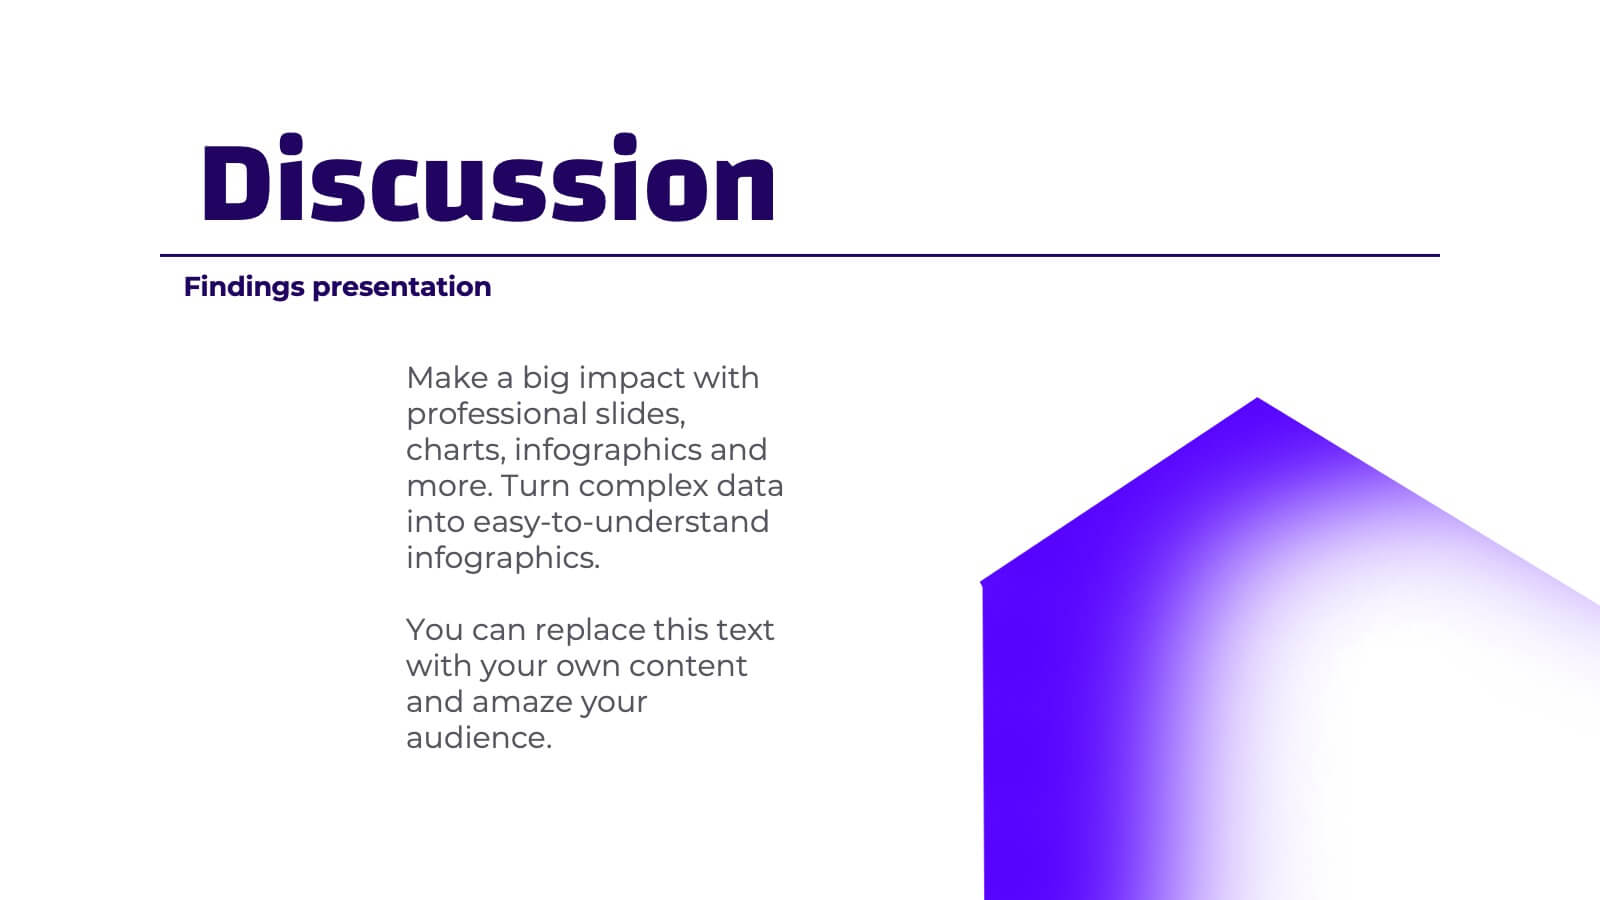
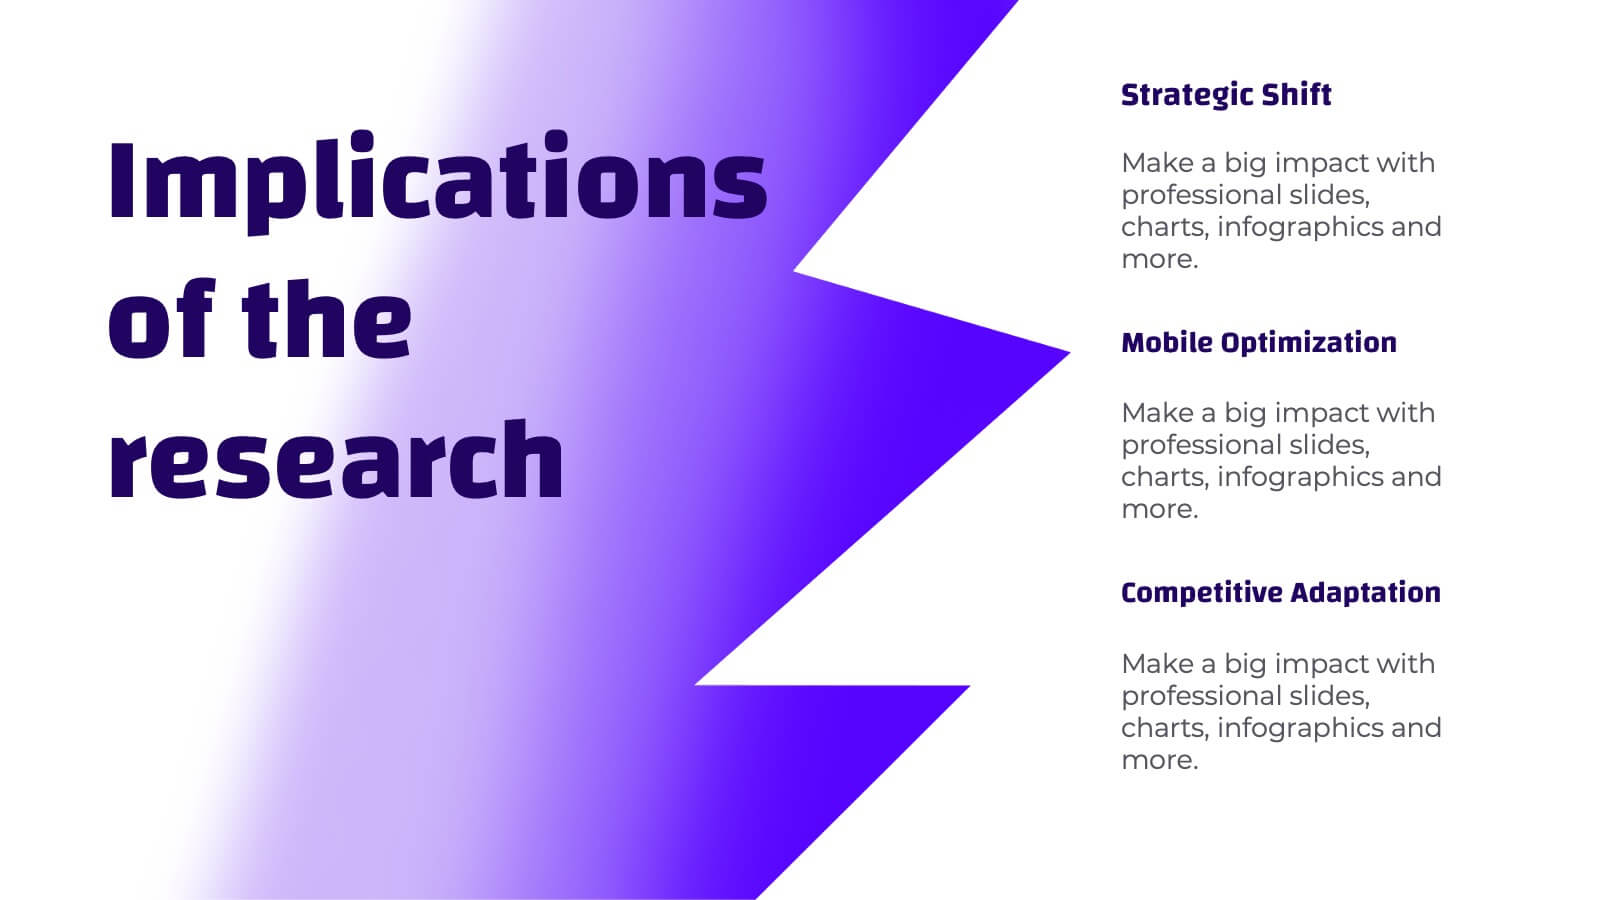
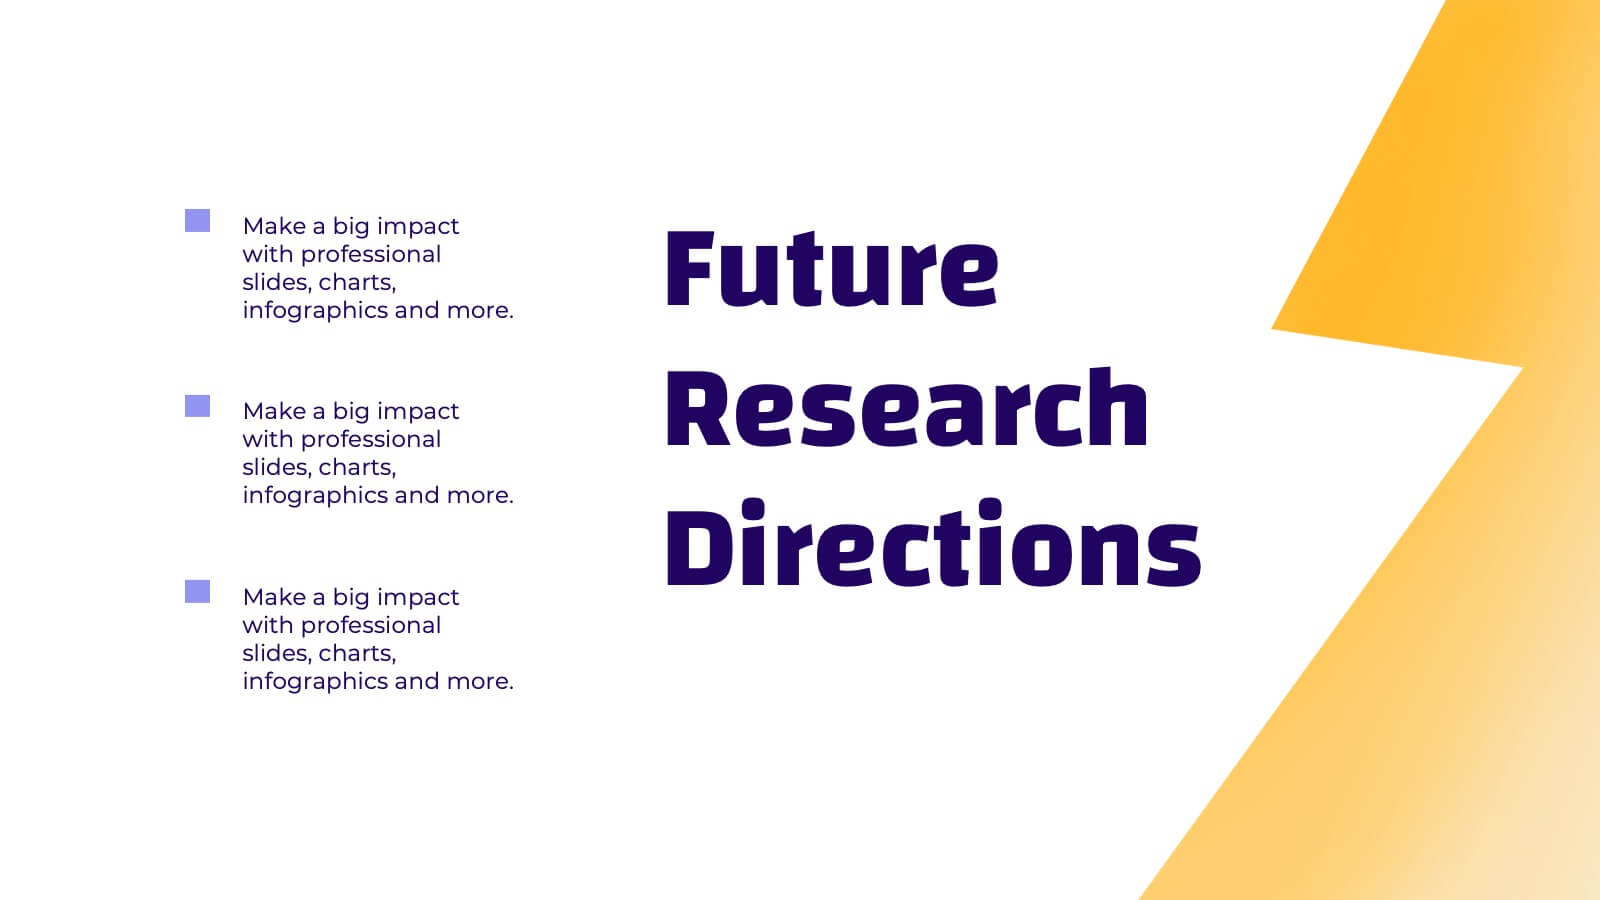
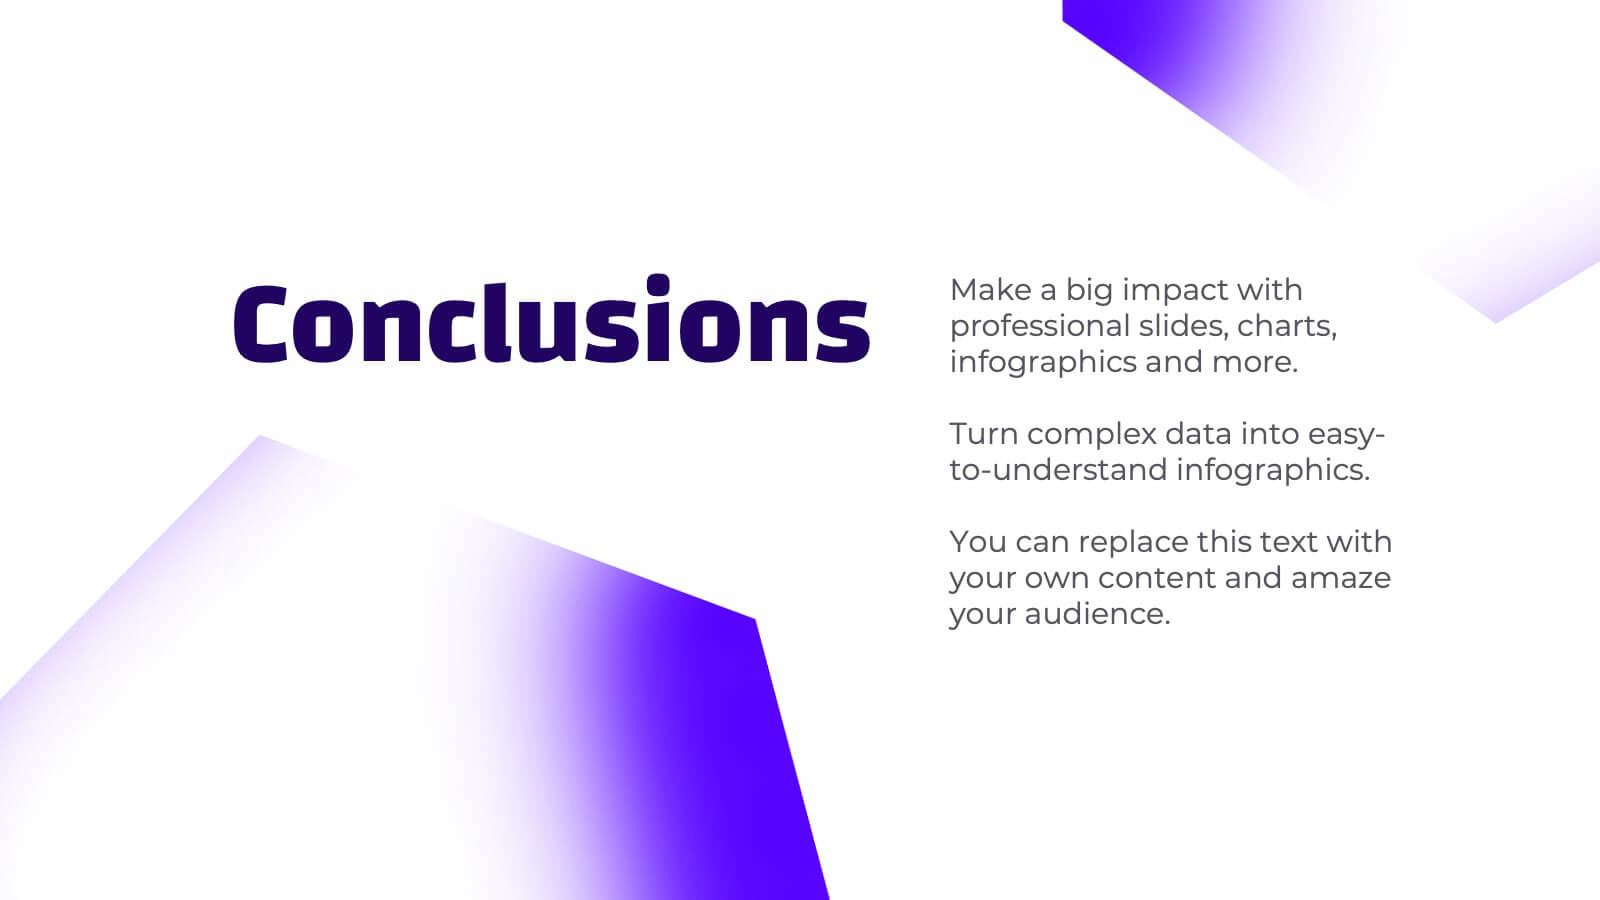
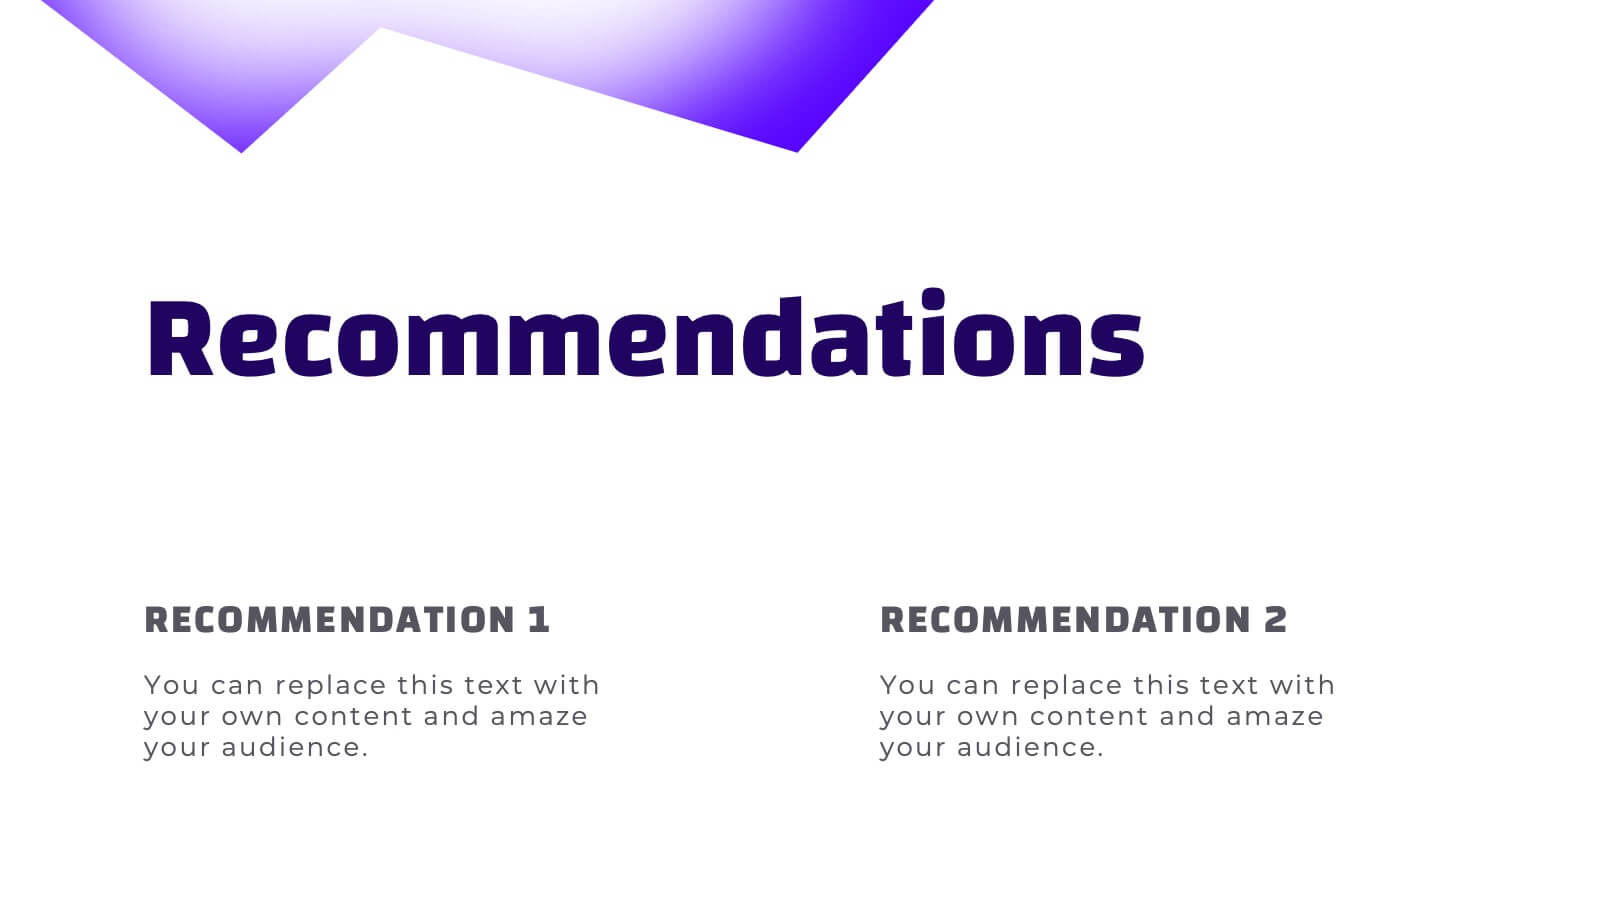
Naiad Qualitative Research Findings Presentation
Dive into your data with this refreshing, Naiad-inspired presentation template, perfect for sharing qualitative research findings! Designed to showcase insights, trends, and key conclusions with clarity, this visually appealing layout ensures your research captivates and informs. Make your data flow effortlessly. Compatible with PowerPoint, Keynote, and Google Slides for easy customization.


6 diapositivas
McKinsey Strategy Implementation Model Presentation
Visualize organizational alignment with the McKinsey 7S Model slide. Featuring a clean circular layout, it highlights Strategy, Structure, Systems, Shared Values, Style, Staff, and Skills. Ideal for consulting, planning, or leadership presentations. Fully editable and compatible with PowerPoint, Google Slides, and Keynote for easy customization and branding.


10 diapositivas
Financial Investment Strategy Presentation
Bring your financial ideas together with a clean, puzzle-style layout that instantly makes complex strategies feel organized and actionable. This presentation helps you explain key components, compare performance drivers, and present investment plans with clarity and confidence. Easy to edit and fully compatible with PowerPoint, Keynote, and Google Slides.


7 diapositivas
Solutions to Problems Infographic
These slides are designed to outline and explore solutions to identified problems in a clear and effective manner. Each slide uses a clean layout with a consistent color theme that enhances readability and focus. They effectively combine text and graphical elements to showcase problem-solving strategies, making the slides ideal for business presentations or strategic meetings. The inclusion of icons and diagrams aids in visualizing the problem-solving process, and the structured design ensures that the information is presented in a logical sequence. This approach not only aids in communicating the solutions effectively but also engages the audience by making complex information easier to understand. These templates can be adapted for various industries and scenarios, where clear communication of problem-solving steps is crucial. They are especially useful for team discussions, stakeholder presentations, and strategic planning sessions.


7 diapositivas
International Finance Infographic
International finance is a branch of economics and financial studies that deals with monetary interactions that occur between two or more countries. Dive into the intricate world of finance with our visually captivating international finance infographic. This template is your passport to understanding the complexities and opportunities in the global financial landscape. With this template you will be able to analyze the dynamics of exchange rates, foreign investment, and how these factors influence global economics. This infographic is crafted to provide a holistic view of the world of finance.


22 diapositivas
Galileo Advertising Agency Proposal Presentation
Present your advertising agency’s capabilities with a proposal template designed to captivate and convince. This sleek and professional layout is perfect for agencies looking to showcase their services, team expertise, and strategic approach to clients. Highlight key sections such as your mission, client success stories, market analysis, and creative process, ensuring every detail is covered. Dive into campaign execution plans, resource allocation, and testimonials to build trust and credibility. Visualize your strategy development with data-driven slides and impactful case study layouts. Fully customizable in PowerPoint, Google Slides, and Keynote, this template is tailored for seamless editing to reflect your agency’s branding. The clean design, bold accents, and structured content make it ideal for pitches, client proposals, or business development meetings. Take your presentations to the next level and leave a lasting impression on potential clients.


8 diapositivas
Corporate Annual Summary Report Presentation
Visualize your company's yearly progress with the Corporate Annual Summary Report Presentation. This professional template highlights quarterly results using progress circles and percentage data, making it easy to track key milestones and performance. Perfect for board meetings and stakeholder reports. Fully editable in Canva, PowerPoint, and Google Slides.


4 diapositivas
Financial Report Presentation
Enhance your financial presentations with our "Financial Report Presentation" template. Designed for clarity and visual impact, this infographic features a stylized financial bag icon segmented into color-coded sections, each representing a different financial metric such as revenue, expenses, profits, and investments. This creative visual structure allows for a clear and segmented display of your company's financial health, making complex data easily understandable. Ideal for financial analysts, corporate presentations, and investor meetings, this template ensures key financial insights are communicated effectively and efficiently. Compatible with PowerPoint, Keynote, and Google Slides, it's an essential tool for delivering detailed and precise financial reports.


7 diapositivas
Drawing Anatomy Infographic
Dive into the captivating world of human anatomy with our drawing anatomy infographic. Crafted with vibrant hues of green, orange, red, and blue, this template brings to life the intricacies and artistry of the human form. Whether you're an aspiring artist, a seasoned illustrator, or an educator, this infographic is tailored to enhance your understanding or teaching of anatomical details. The fun, colorful design ensures engagement, making learning a visually pleasing experience. Seamlessly incorporate it into PowerPoint, Keynote, or Google Slides for versatile and effective presentations.


7 diapositivas
Work From Home Jobs Infographic Presentation
Working from home provides businesses with increased flexibility and can help ensure continuity of operations during times of disruption. This template is a great way to create a infographic about work from home jobs, or if you want to market your own work at home business. This template is easy to customize and full of useful design elements and tools that make it very easy to create stunning presentations. It includes a title slide with vibrant background colors for each section and a clean layout design. This template will help you make your own unique presentation in just minutes!


7 diapositivas
Standard Process Infographic
Streamline operations with clarity with our standard process infographic. This template is your ultimate tool for presenting complex processes in a clear, easy-to-understand manner. This infographic is designed to break down intricate procedures into visual, digestible segments. This includes a step-by-step diagram presenting each step clearly. Compatible with Powerpoint, Keynote, and Google Slides. Include a versatile color palette to choose from, matching your brand or adding visual interest. With this template you'll make even the most complicated processes understandable and actionable. Start streamlining your operations today!