


Características


¿Tienes alguna pregunta?
Recomendar


10 diapositivas
Financial Money Management Strategies Presentation
Break down your key financial strategies with this clear, wheel-style diagram. Perfect for outlining budgeting principles, savings goals, or investment methods, each segment includes space for titles and concise text. Ideal for financial advisors, consultants, or internal team planning. Fully customizable in PowerPoint, Keynote, and Google Slides.


4 diapositivas
Three-Part Triangle Model Presentation
Show the perfect balance between three core ideas with this dynamic triangular layout. Designed for clarity and structure, it’s ideal for visualizing strategies, models, or relationships in a professional way. Fully editable and compatible with PowerPoint, Keynote, and Google Slides for effortless customization and polished results.


26 diapositivas
Mazen Presentation Template
Mazen is a multi-purpose template that’s perfect for any business. The colors and layout are clean and chic, and it’s suitable for all types of businesses, from small business accounts to large corporate companies. It also has a hip aesthetic with nude warm tones, while pictures and charts are easy to edit and easy to read so users can easily understand the information in them. Easy to use, high quality and many features make this template suitable for all kinds of businesses. Pictures and charts are also made for easy editing as well as easy readability without too much confusion on reading.


4 diapositivas
Market Expansion Planning with Blue Ocean Presentation
Visualize your growth journey with this two-step strategic layout. Ideal for presenting current positioning and future market opportunities using Blue Ocean thinking. Each step is illustrated with bold icons and color-coded nodes. Fully editable in PowerPoint, Keynote, and Google Slides—perfect for business development, strategy sessions, and executive presentations.


7 diapositivas
Company Profile Structure Infographic
This series of templates is meticulously crafted to represent a company’s structure in a detailed and organized manner. Each template varies in design and layout, ensuring that there is a style to suit different business needs and preferences. From straightforward, clean layouts to more dynamic, visually engaging designs, these templates provide an excellent basis for companies to present their organizational structure, core team members, departmental divisions, and key business areas effectively. Key information such as company values, mission statements, and strategic objectives can be clearly highlighted, allowing companies to communicate their business essence and operational ethos to stakeholders. Each template also accommodates data visualization through charts, graphs, and infographics, which are instrumental in depicting growth trajectories, performance metrics, or demographic breakdowns. With customization options, these templates can be tailored to reflect a company's unique brand identity, including color schemes, typography, and corporate logos, making each presentation not only informative but also reflective of the company's image. This collection is ideal for corporate introductions, stakeholder meetings, and internal presentations aimed at fostering a clear understanding of the company’s operational framework and strategic direction.


5 diapositivas
New Employee Onboarding Training Presentation
Make a lasting first impression with a fun, visual walkthrough of your company’s onboarding steps. This presentation template breaks down training stages into a clean, engaging flow that helps new hires feel welcomed and informed. It’s fully editable and works seamlessly in PowerPoint, Keynote, and Google Slides.


5 diapositivas
Causes of Poaching Infographics
Poaching refers to the illegal hunting, capturing, or killing of wildlife, typically for commercial or personal gain. These infographic templates are designed to raise awareness about the underlying drivers of poaching activities and the need for concerted efforts to combat this illegal and harmful practice. The text boxes and illustrations included can be used to highlight the causes and factors contributing to the issue of poaching. Present the complex factors driving this issue, and empower your audience to support conservation efforts, advocate for stricter regulations, and contribute to the protection of wildlife.


28 diapositivas
Pitch Deck Entrepreneur's Canvas Presentation
Sharpen your business presentation with this Pitch Deck template. It covers essential areas such as market opportunity, business model, and competitive analysis, designed for startups and entrepreneurs. Fully customizable and compatible with PowerPoint, Keynote, and Google Slides, it's ideal for impressing investors and partners with your business vision.


5 diapositivas
Buyer Persona Strategy Presentation
Enhance Customer Understanding! The Buyer Persona Strategy Presentation template helps analyze customer behaviors, goals, and frustrations to create targeted marketing strategies. Fully editable and compatible with PowerPoint, Keynote, and Google Slides, it’s perfect for marketers and strategists looking to optimize engagement with a modern, professional, and visually compelling layout.


7 diapositivas
Job Objective Infographic Presentation
A Job Objective is an introduction that summarizes an individual's career goals and objectives. This Template is designed to create a visual experience with a focus of solving your objectives, showcasing your expertise and individuality. Use this infographic to help you visually communicate your knowledge and skills with a powerful presentation. Highlight your experience, skills and key achievements. You can edit the graphics, photos, data and text in this template so that it fits your needs perfectly. All you have to do is just download this template in PowerPoint, Keynote, or Google Slides.


4 diapositivas
Content Calendar and Engagement Plan Presentation
Plan and track content effectively with this calendar-style engagement layout. Visualize posting frequency, engagement goals, and campaign performance in a single view. Ideal for content strategists and marketers managing social or editorial schedules. Fully editable in PowerPoint, Keynote, or Google Slides to suit your unique workflow and branding needs.


6 diapositivas
Product Comparison Table Presentation
Compare features, performance, or specifications at a glance with this Product Comparison Table Presentation. Featuring colorful bar charts and side-by-side metrics, this layout is perfect for showcasing multiple options clearly and professionally. Fully customizable in PowerPoint, Keynote, and Google Slides.


5 diapositivas
Long-Term Strategy Slide Presentation
Ignite big ideas with a bold, forward-moving layout that makes long-range goals feel inspiring and achievable. This presentation helps you outline future plans, key milestones, and strategic priorities with clarity and visual impact. Easy to edit and fully compatible with PowerPoint, Keynote, and Google Slides.


6 diapositivas
Audience Segmentation by Region Presentation
Discover where your audience truly connects with a visually engaging layout that highlights market insights across regions. This presentation helps businesses identify, compare, and target audiences by location for smarter decision-making. Fully customizable and compatible with PowerPoint, Keynote, and Google Slides for seamless professional use and presentation flexibility.

20 diapositivas
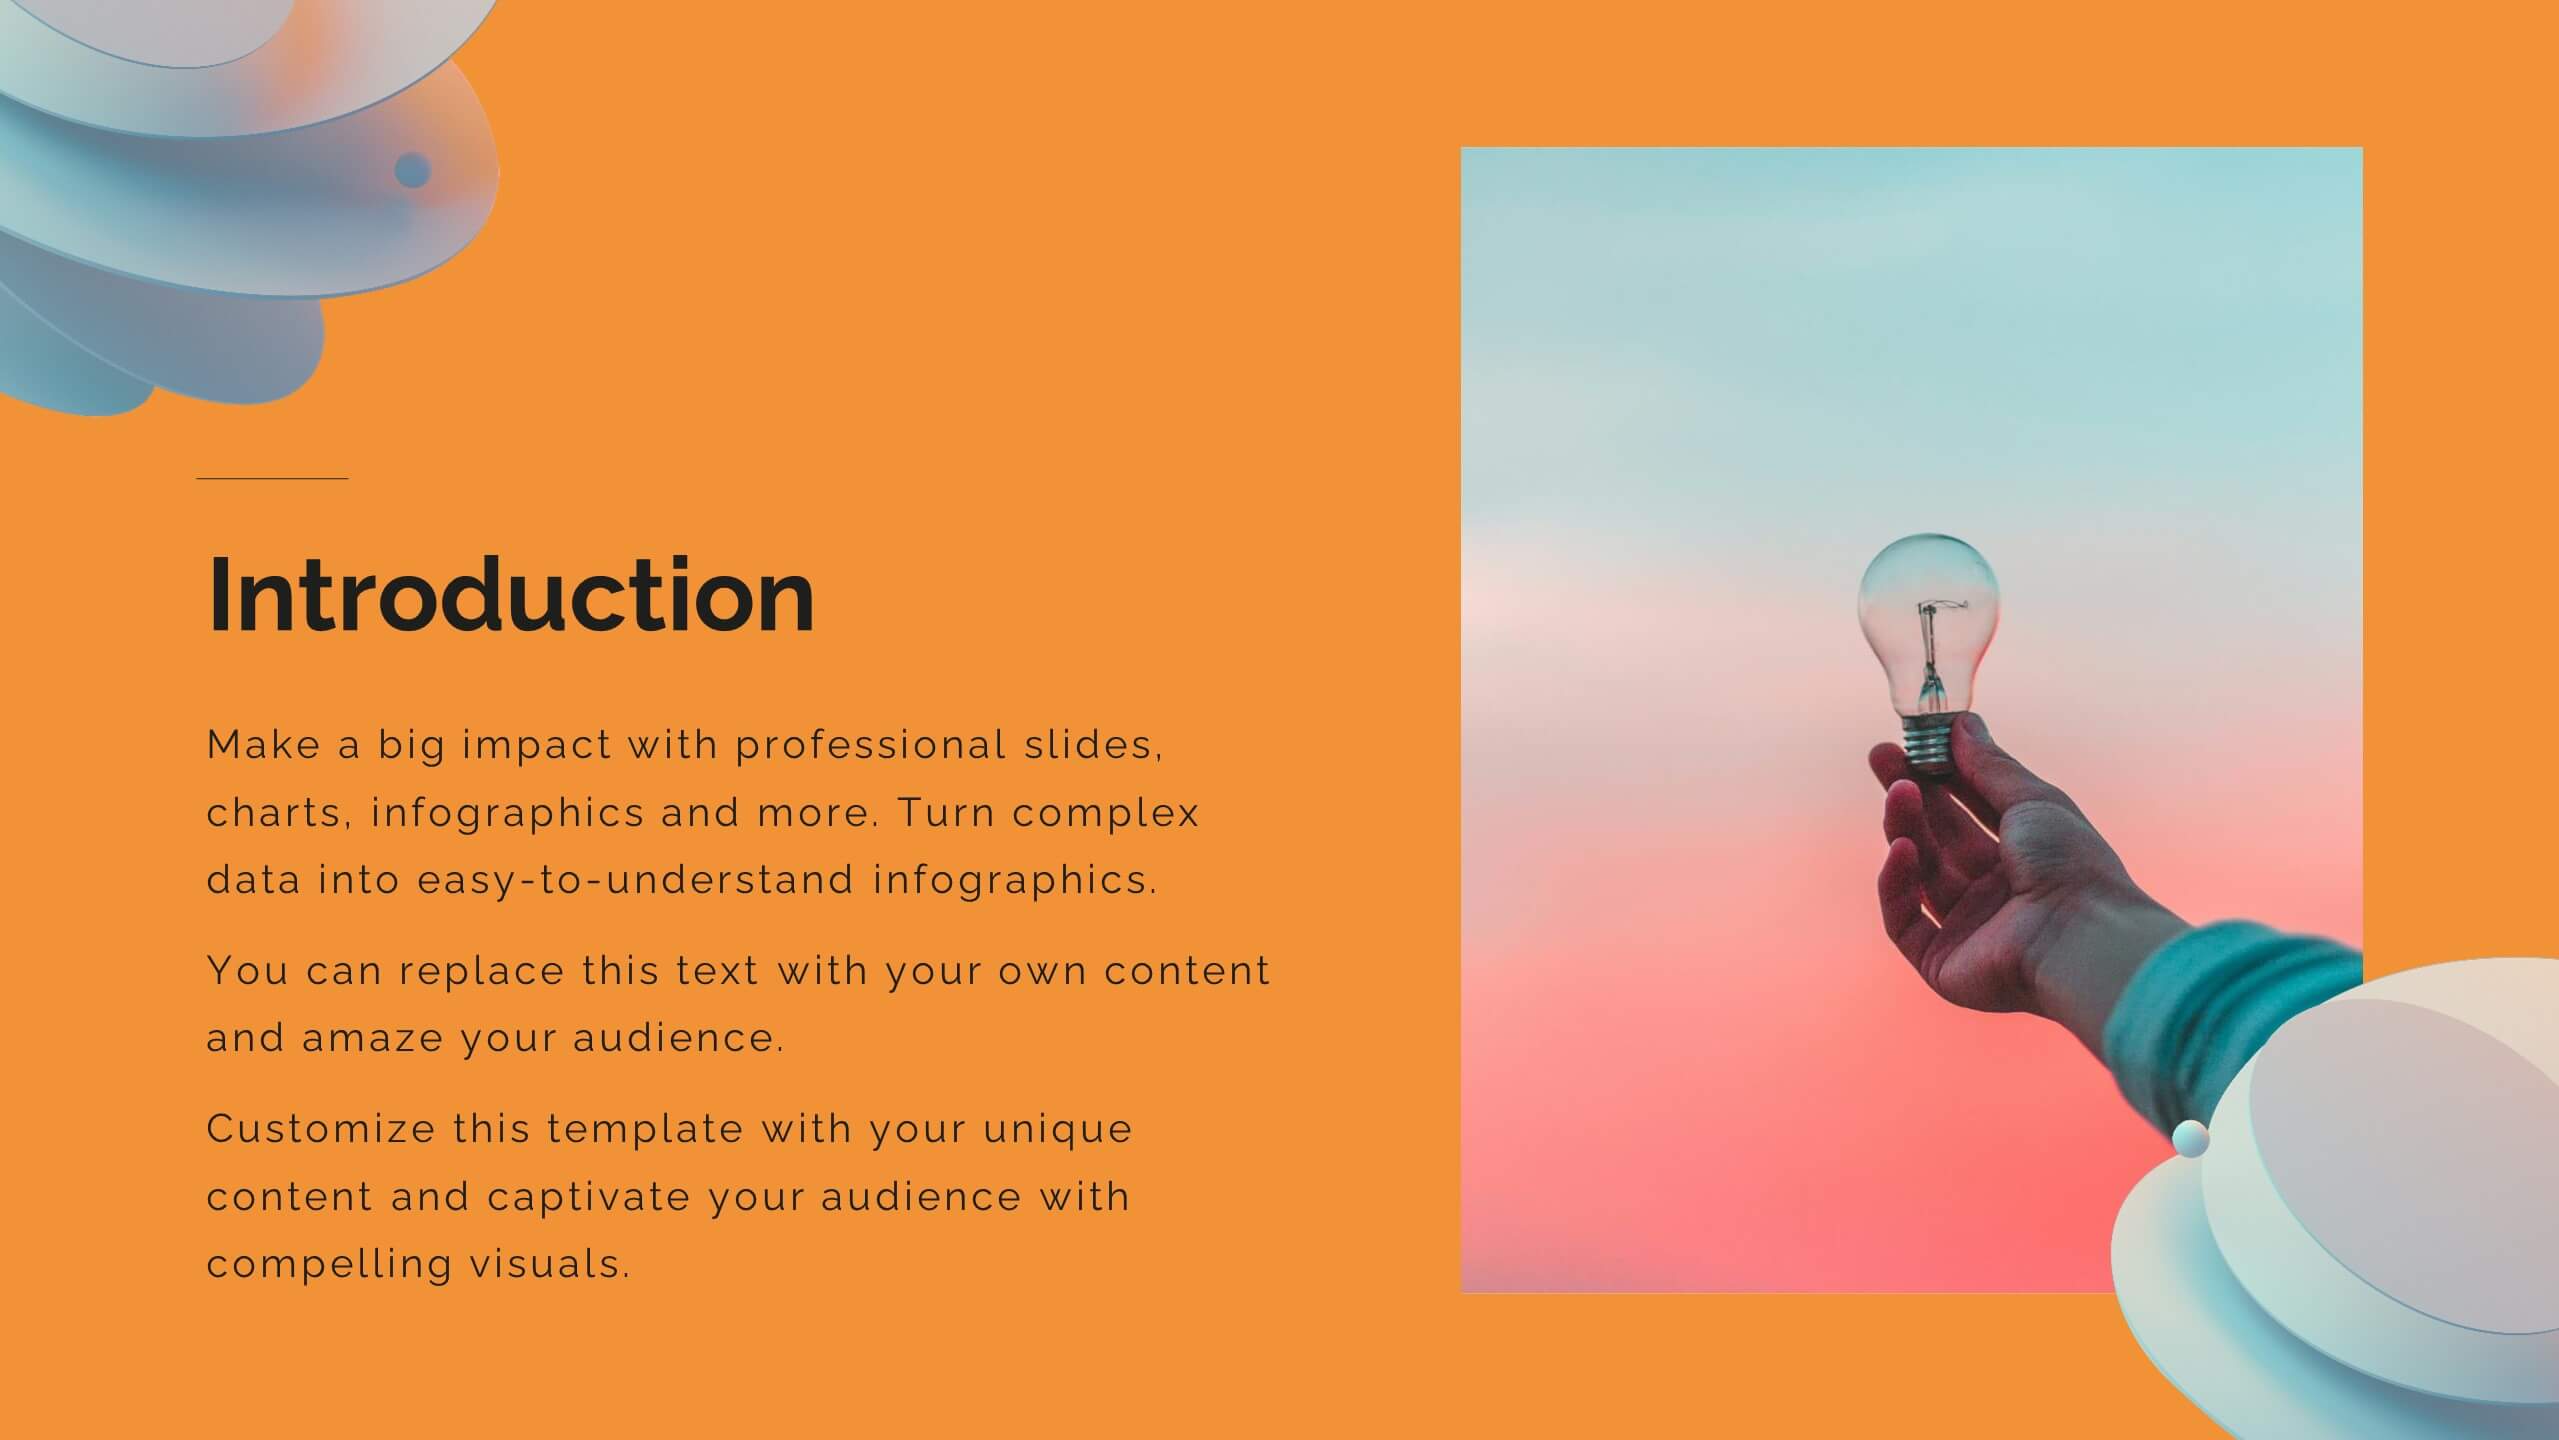
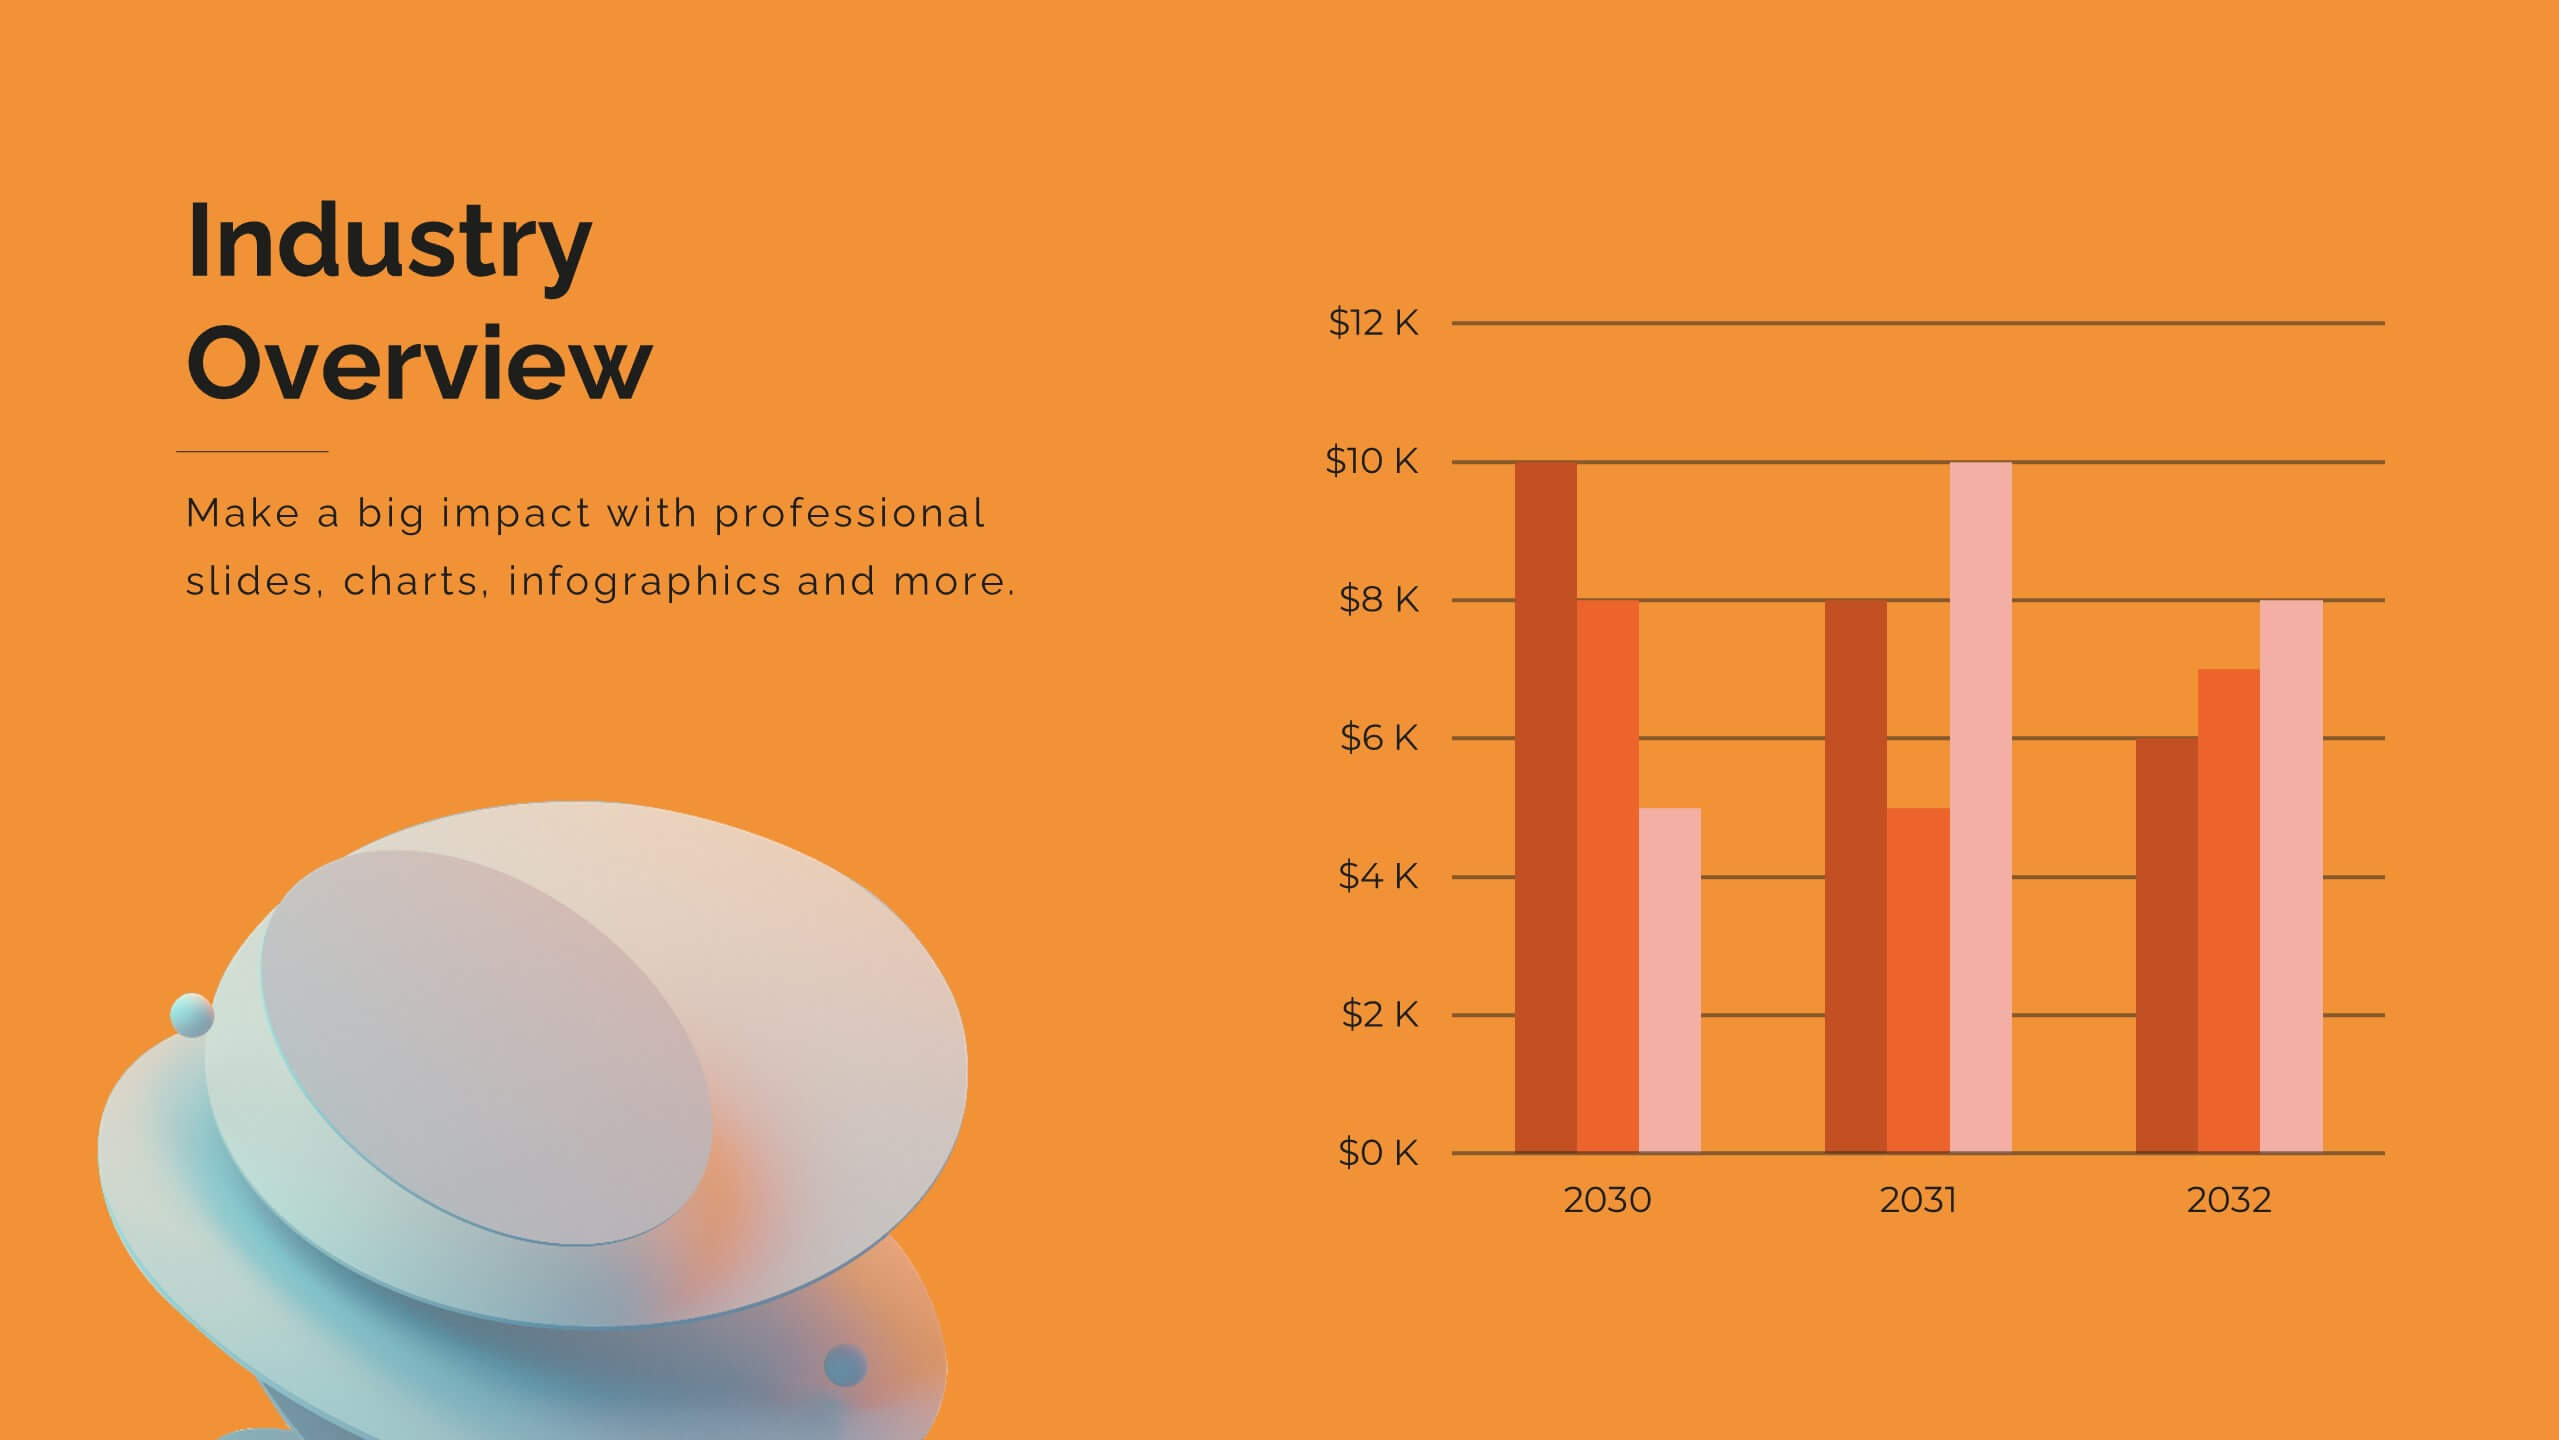
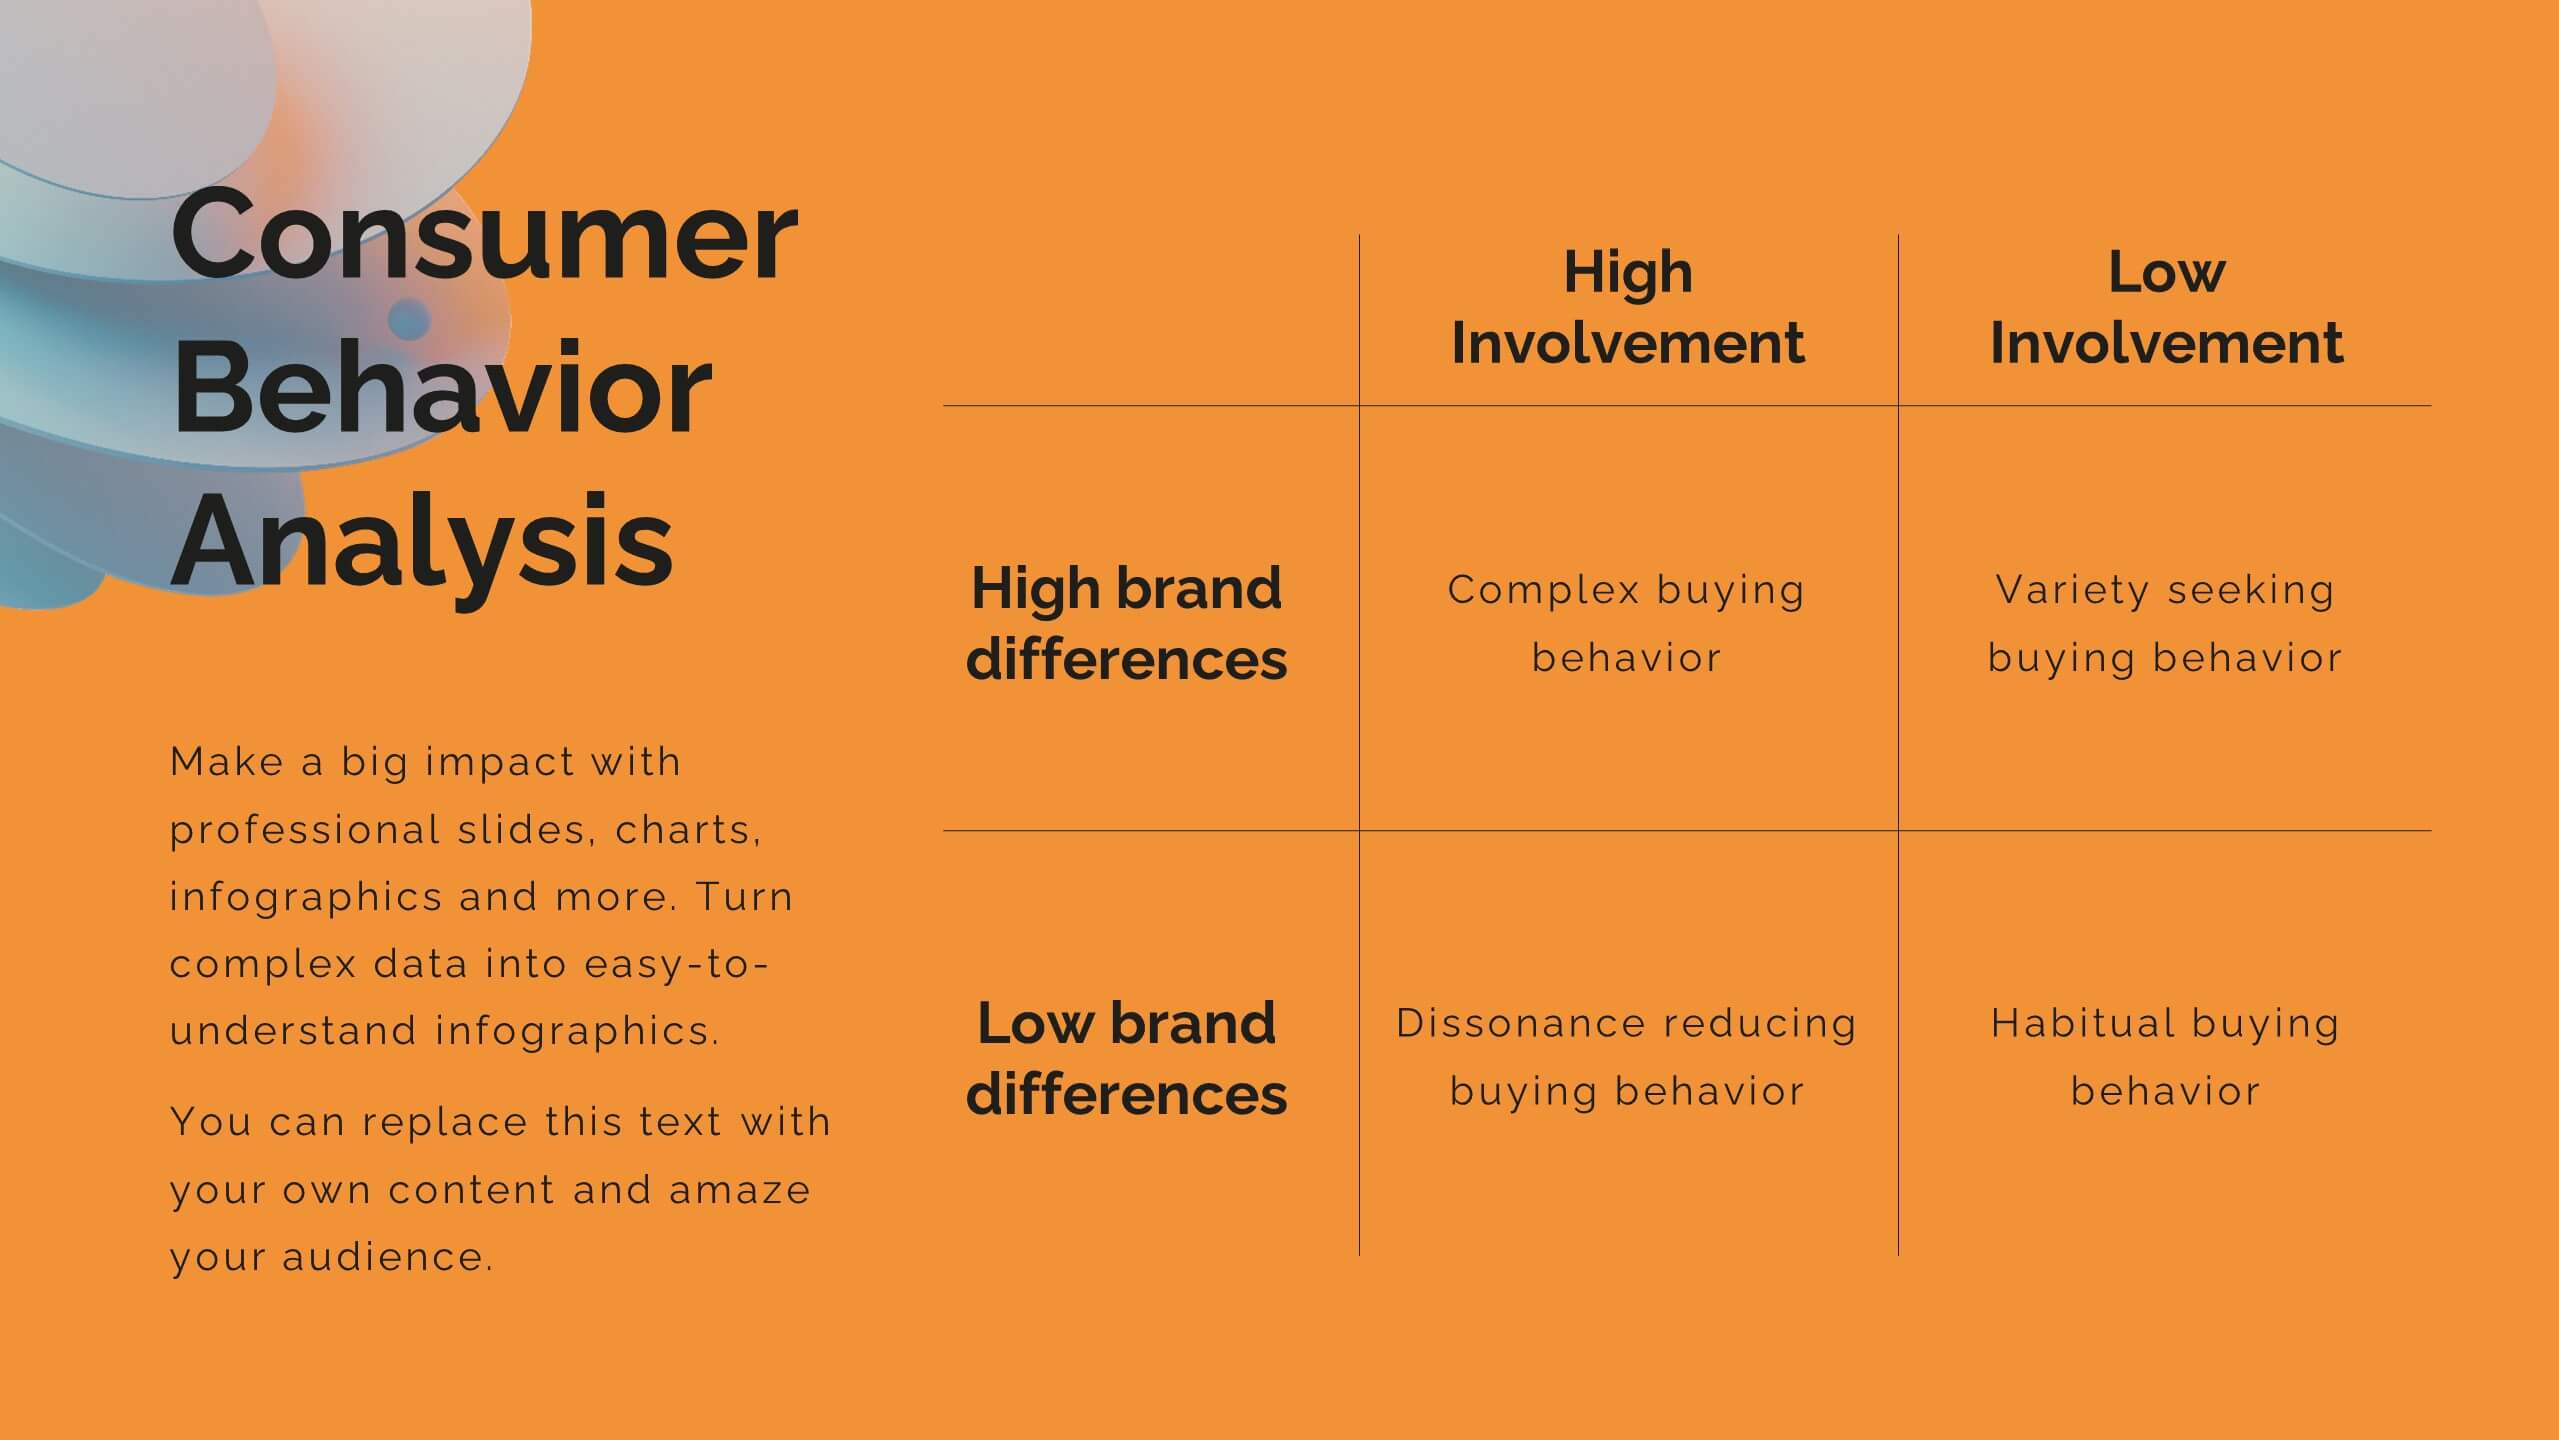
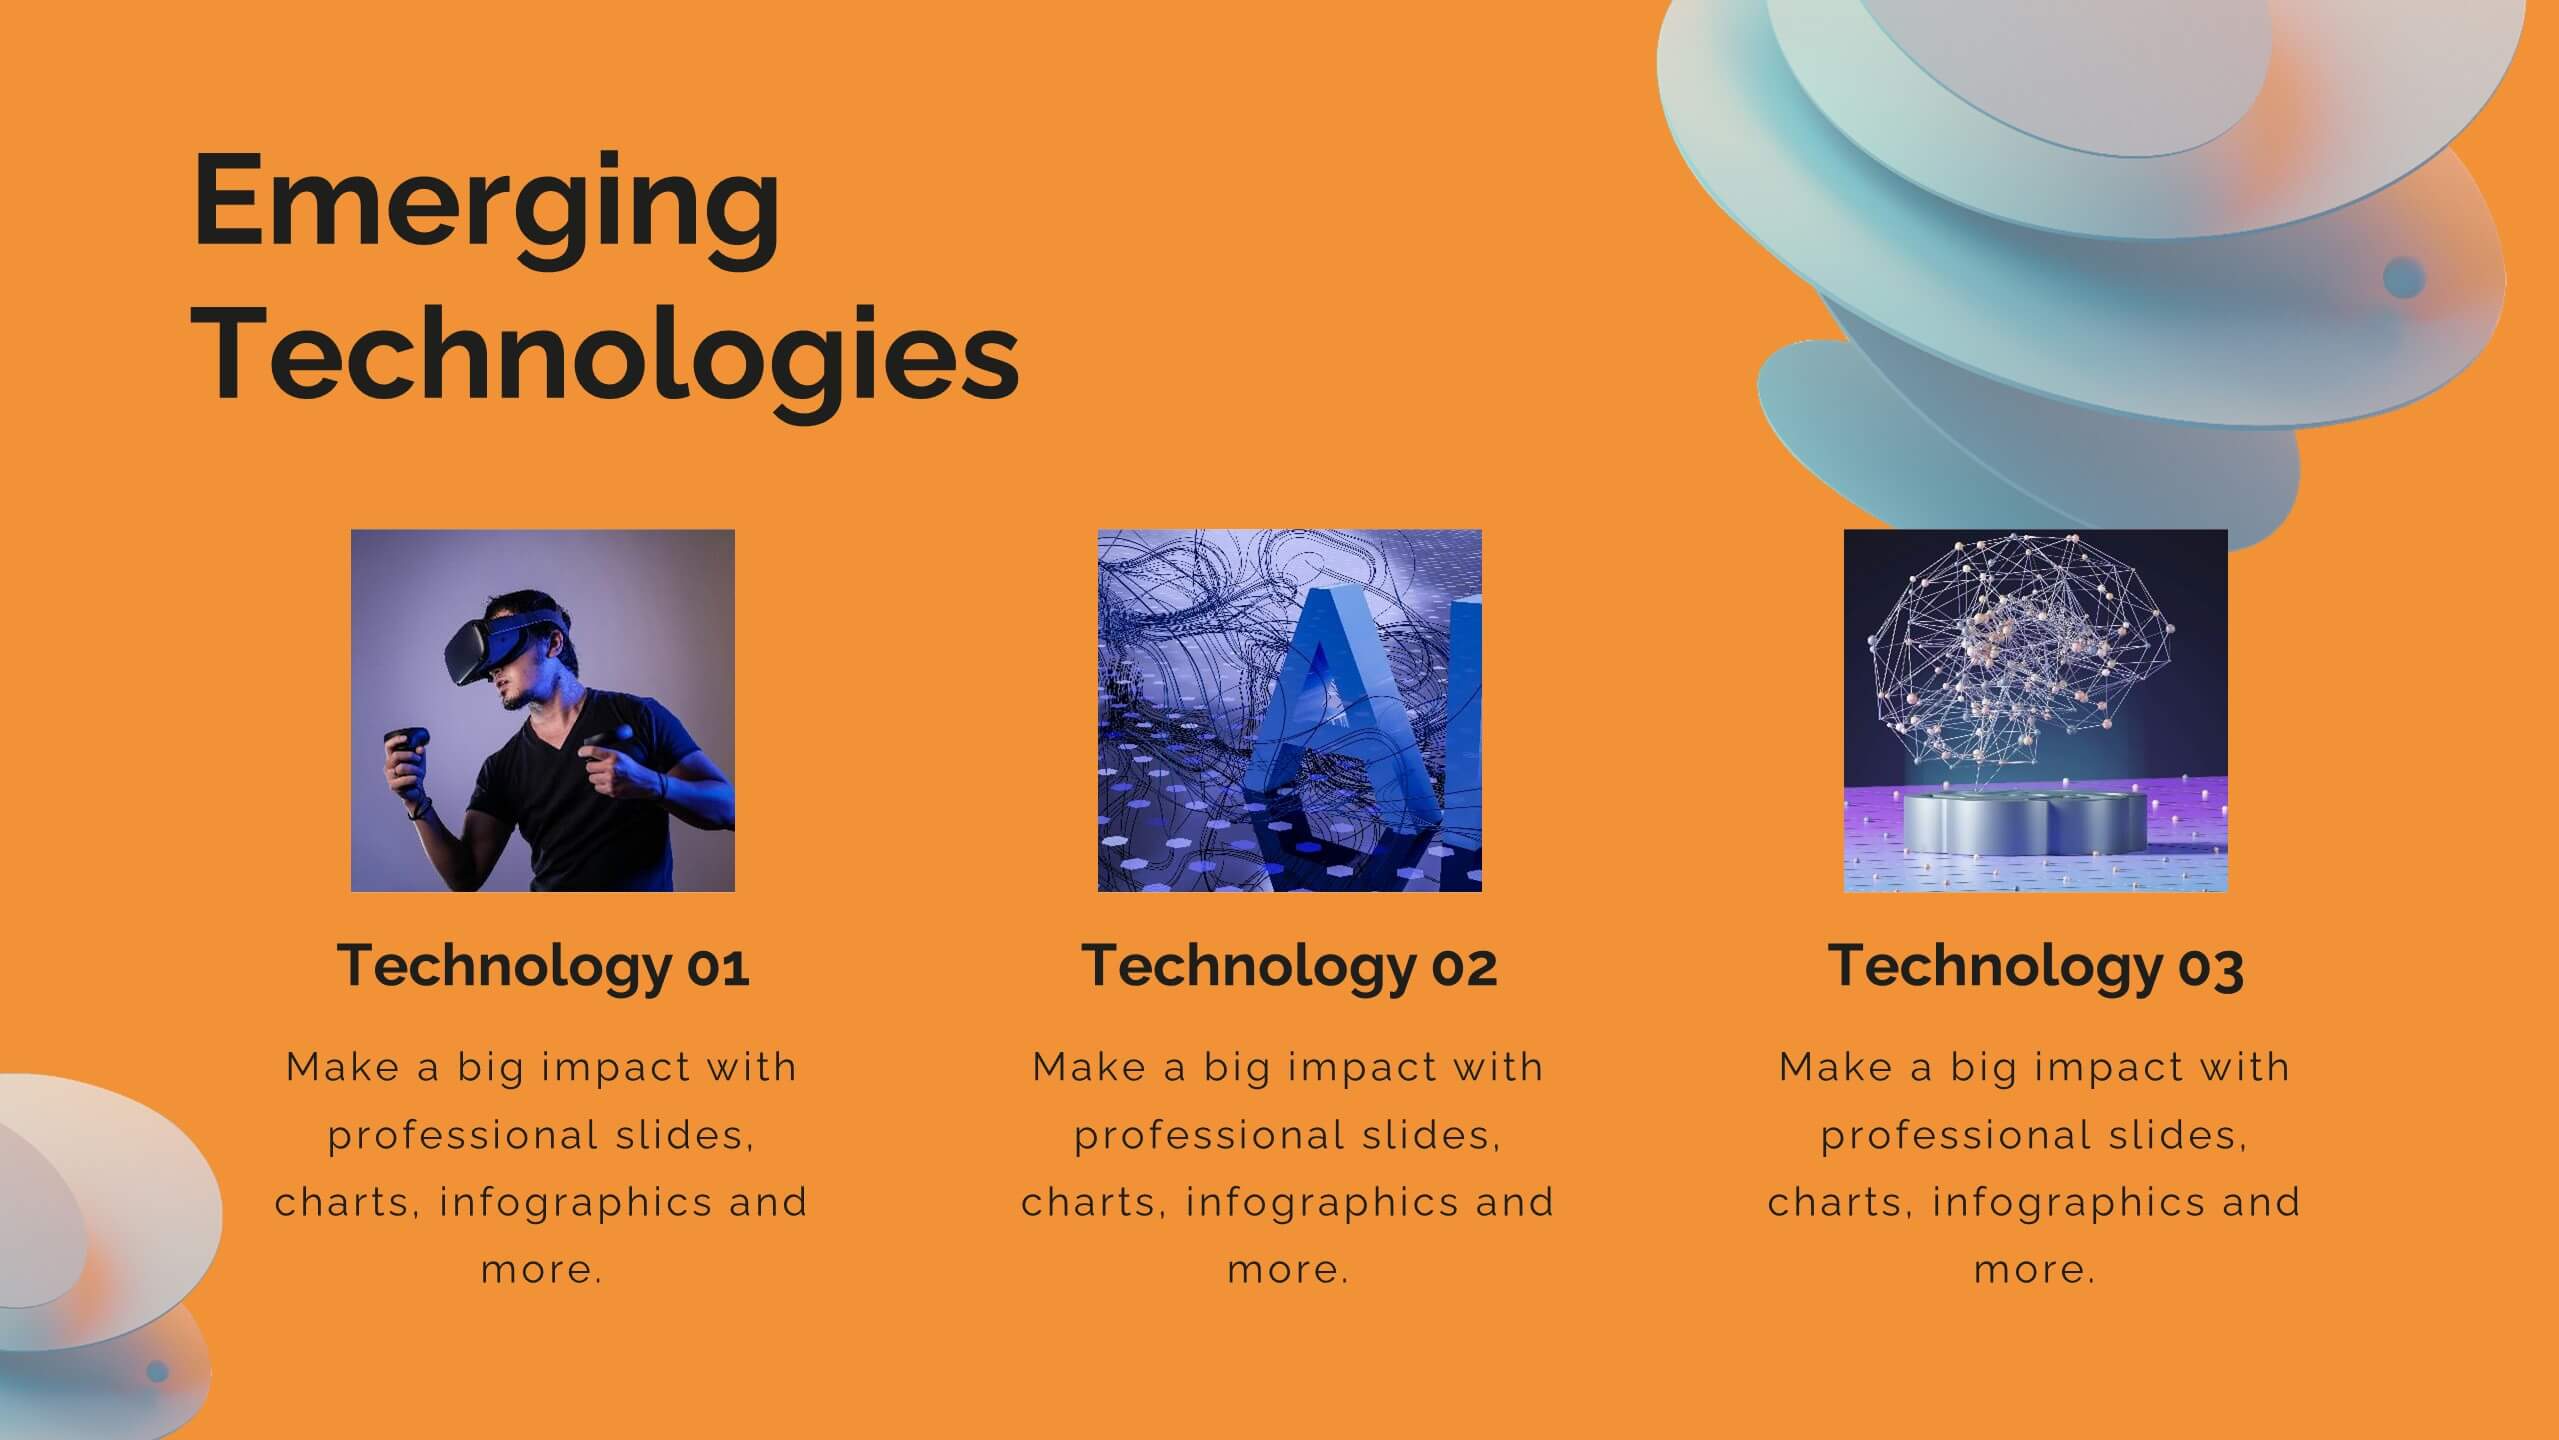
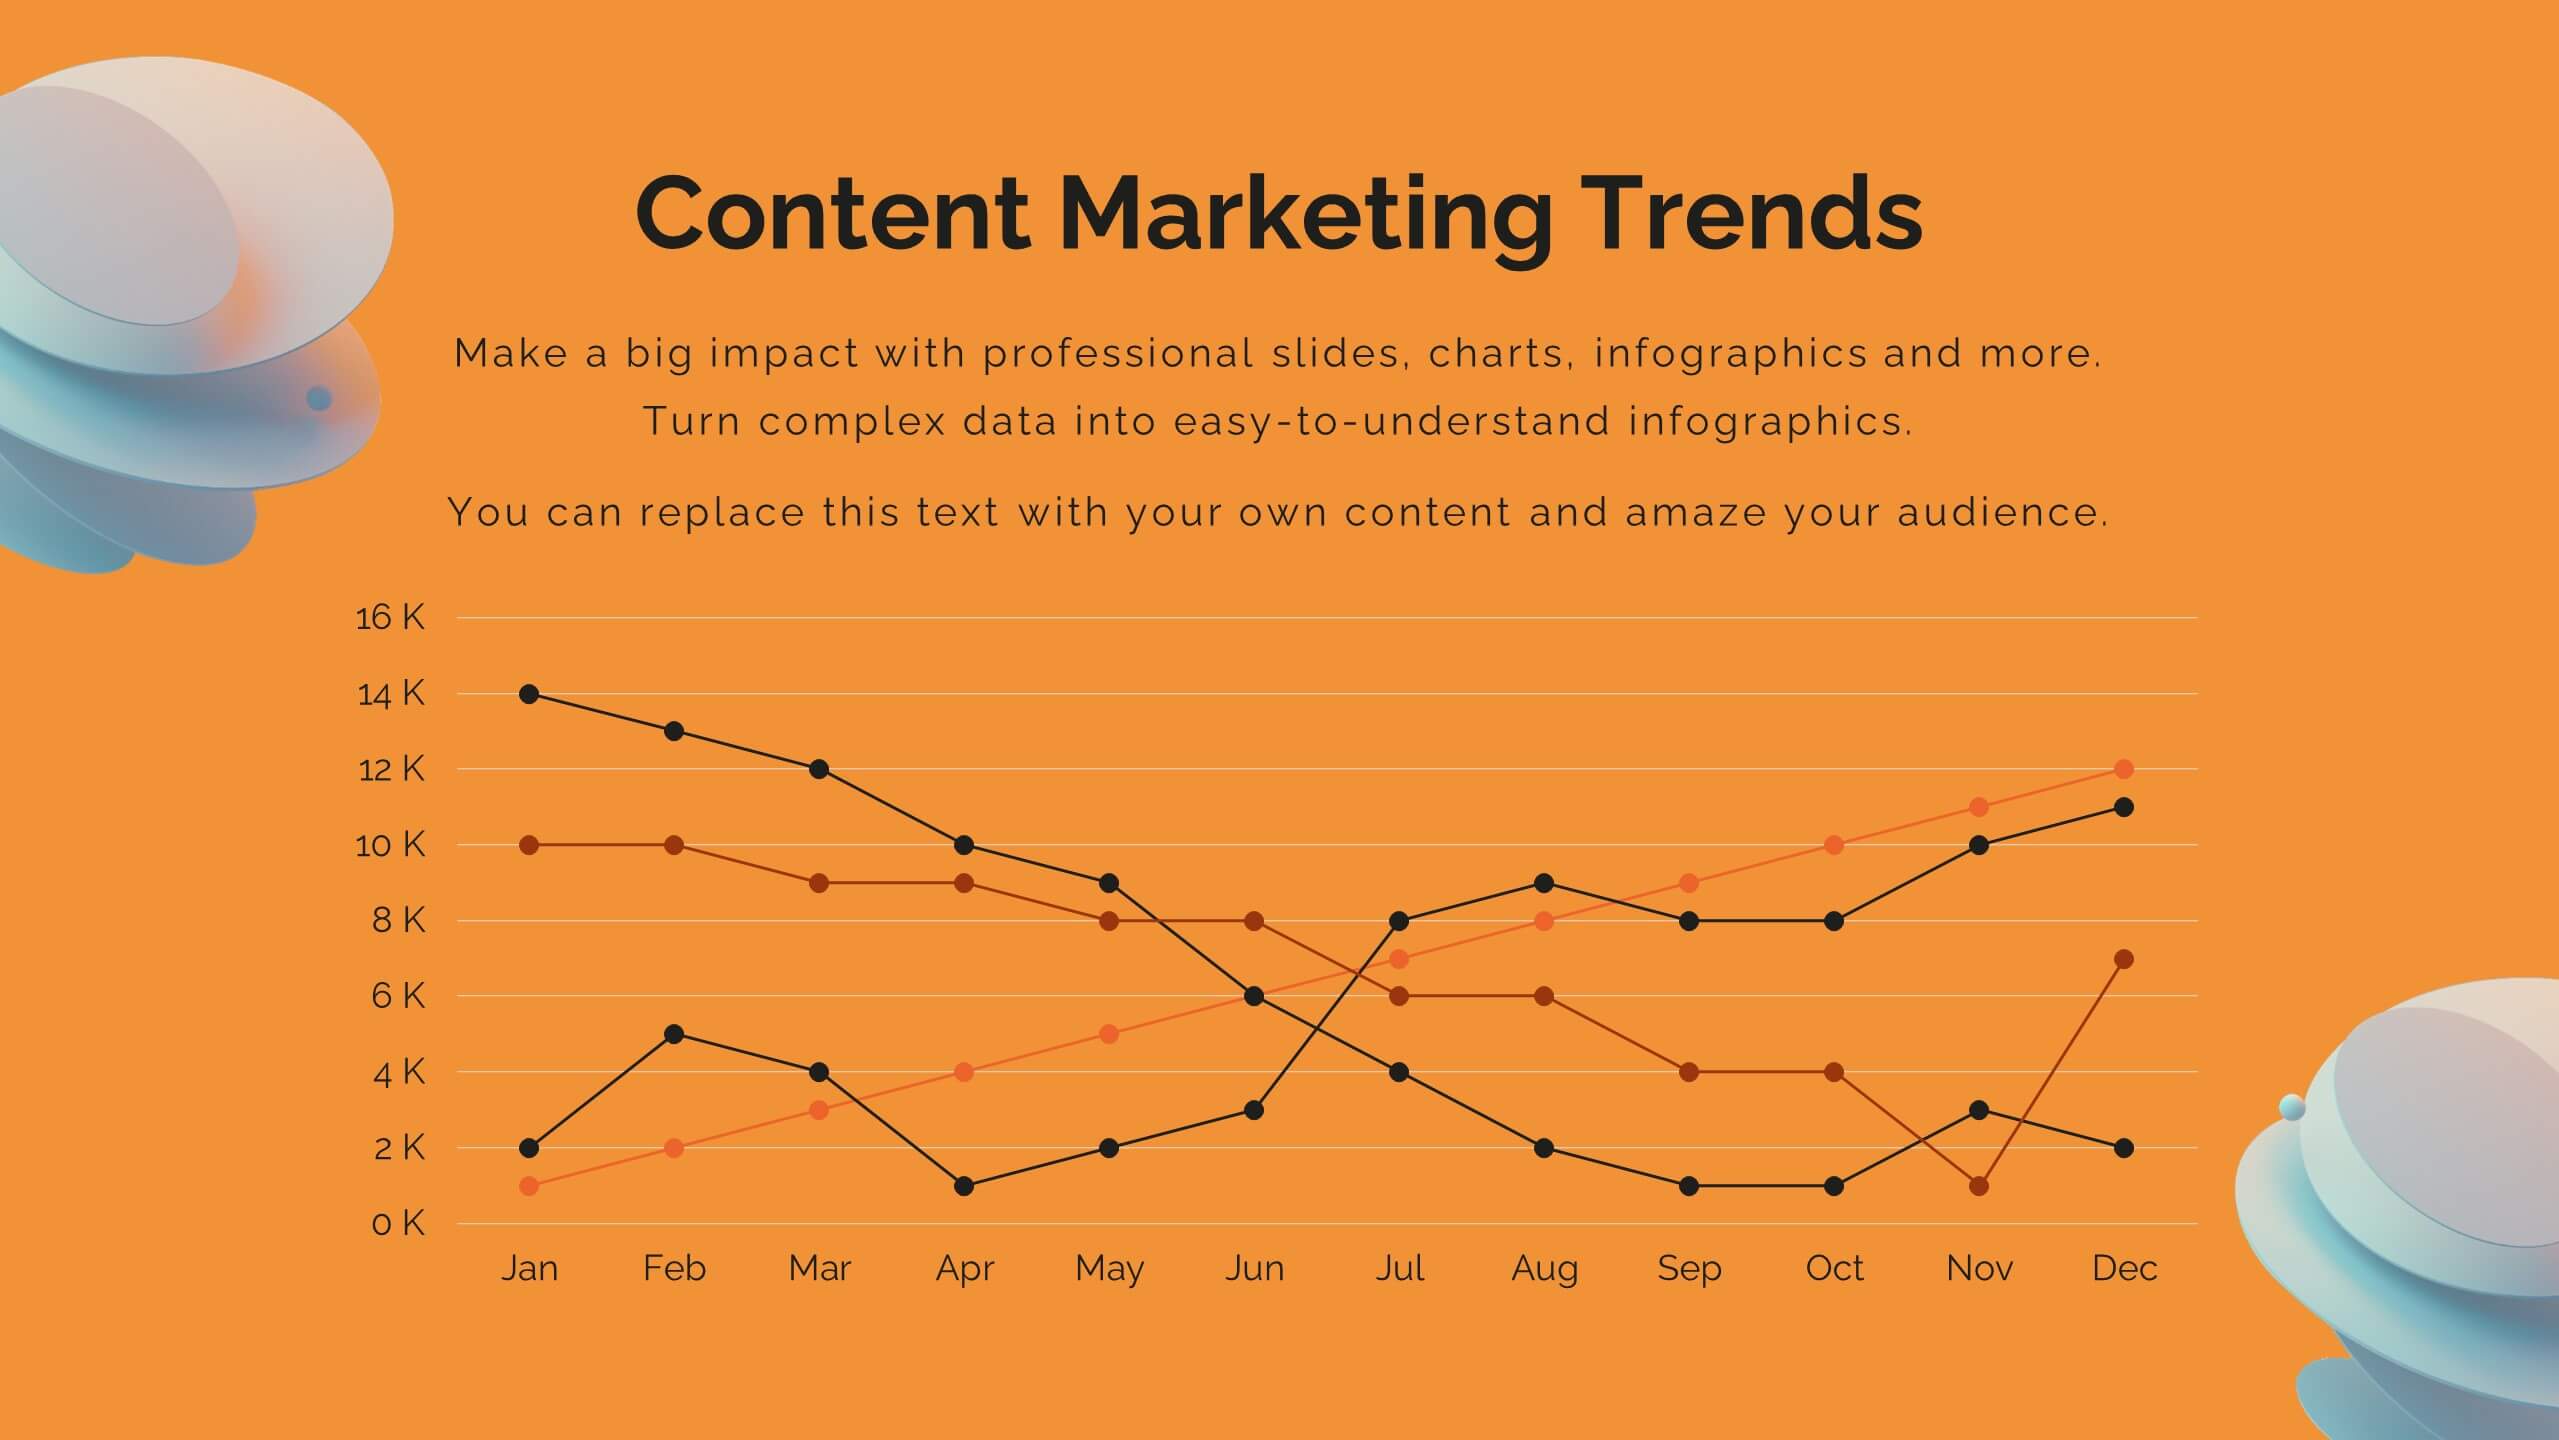
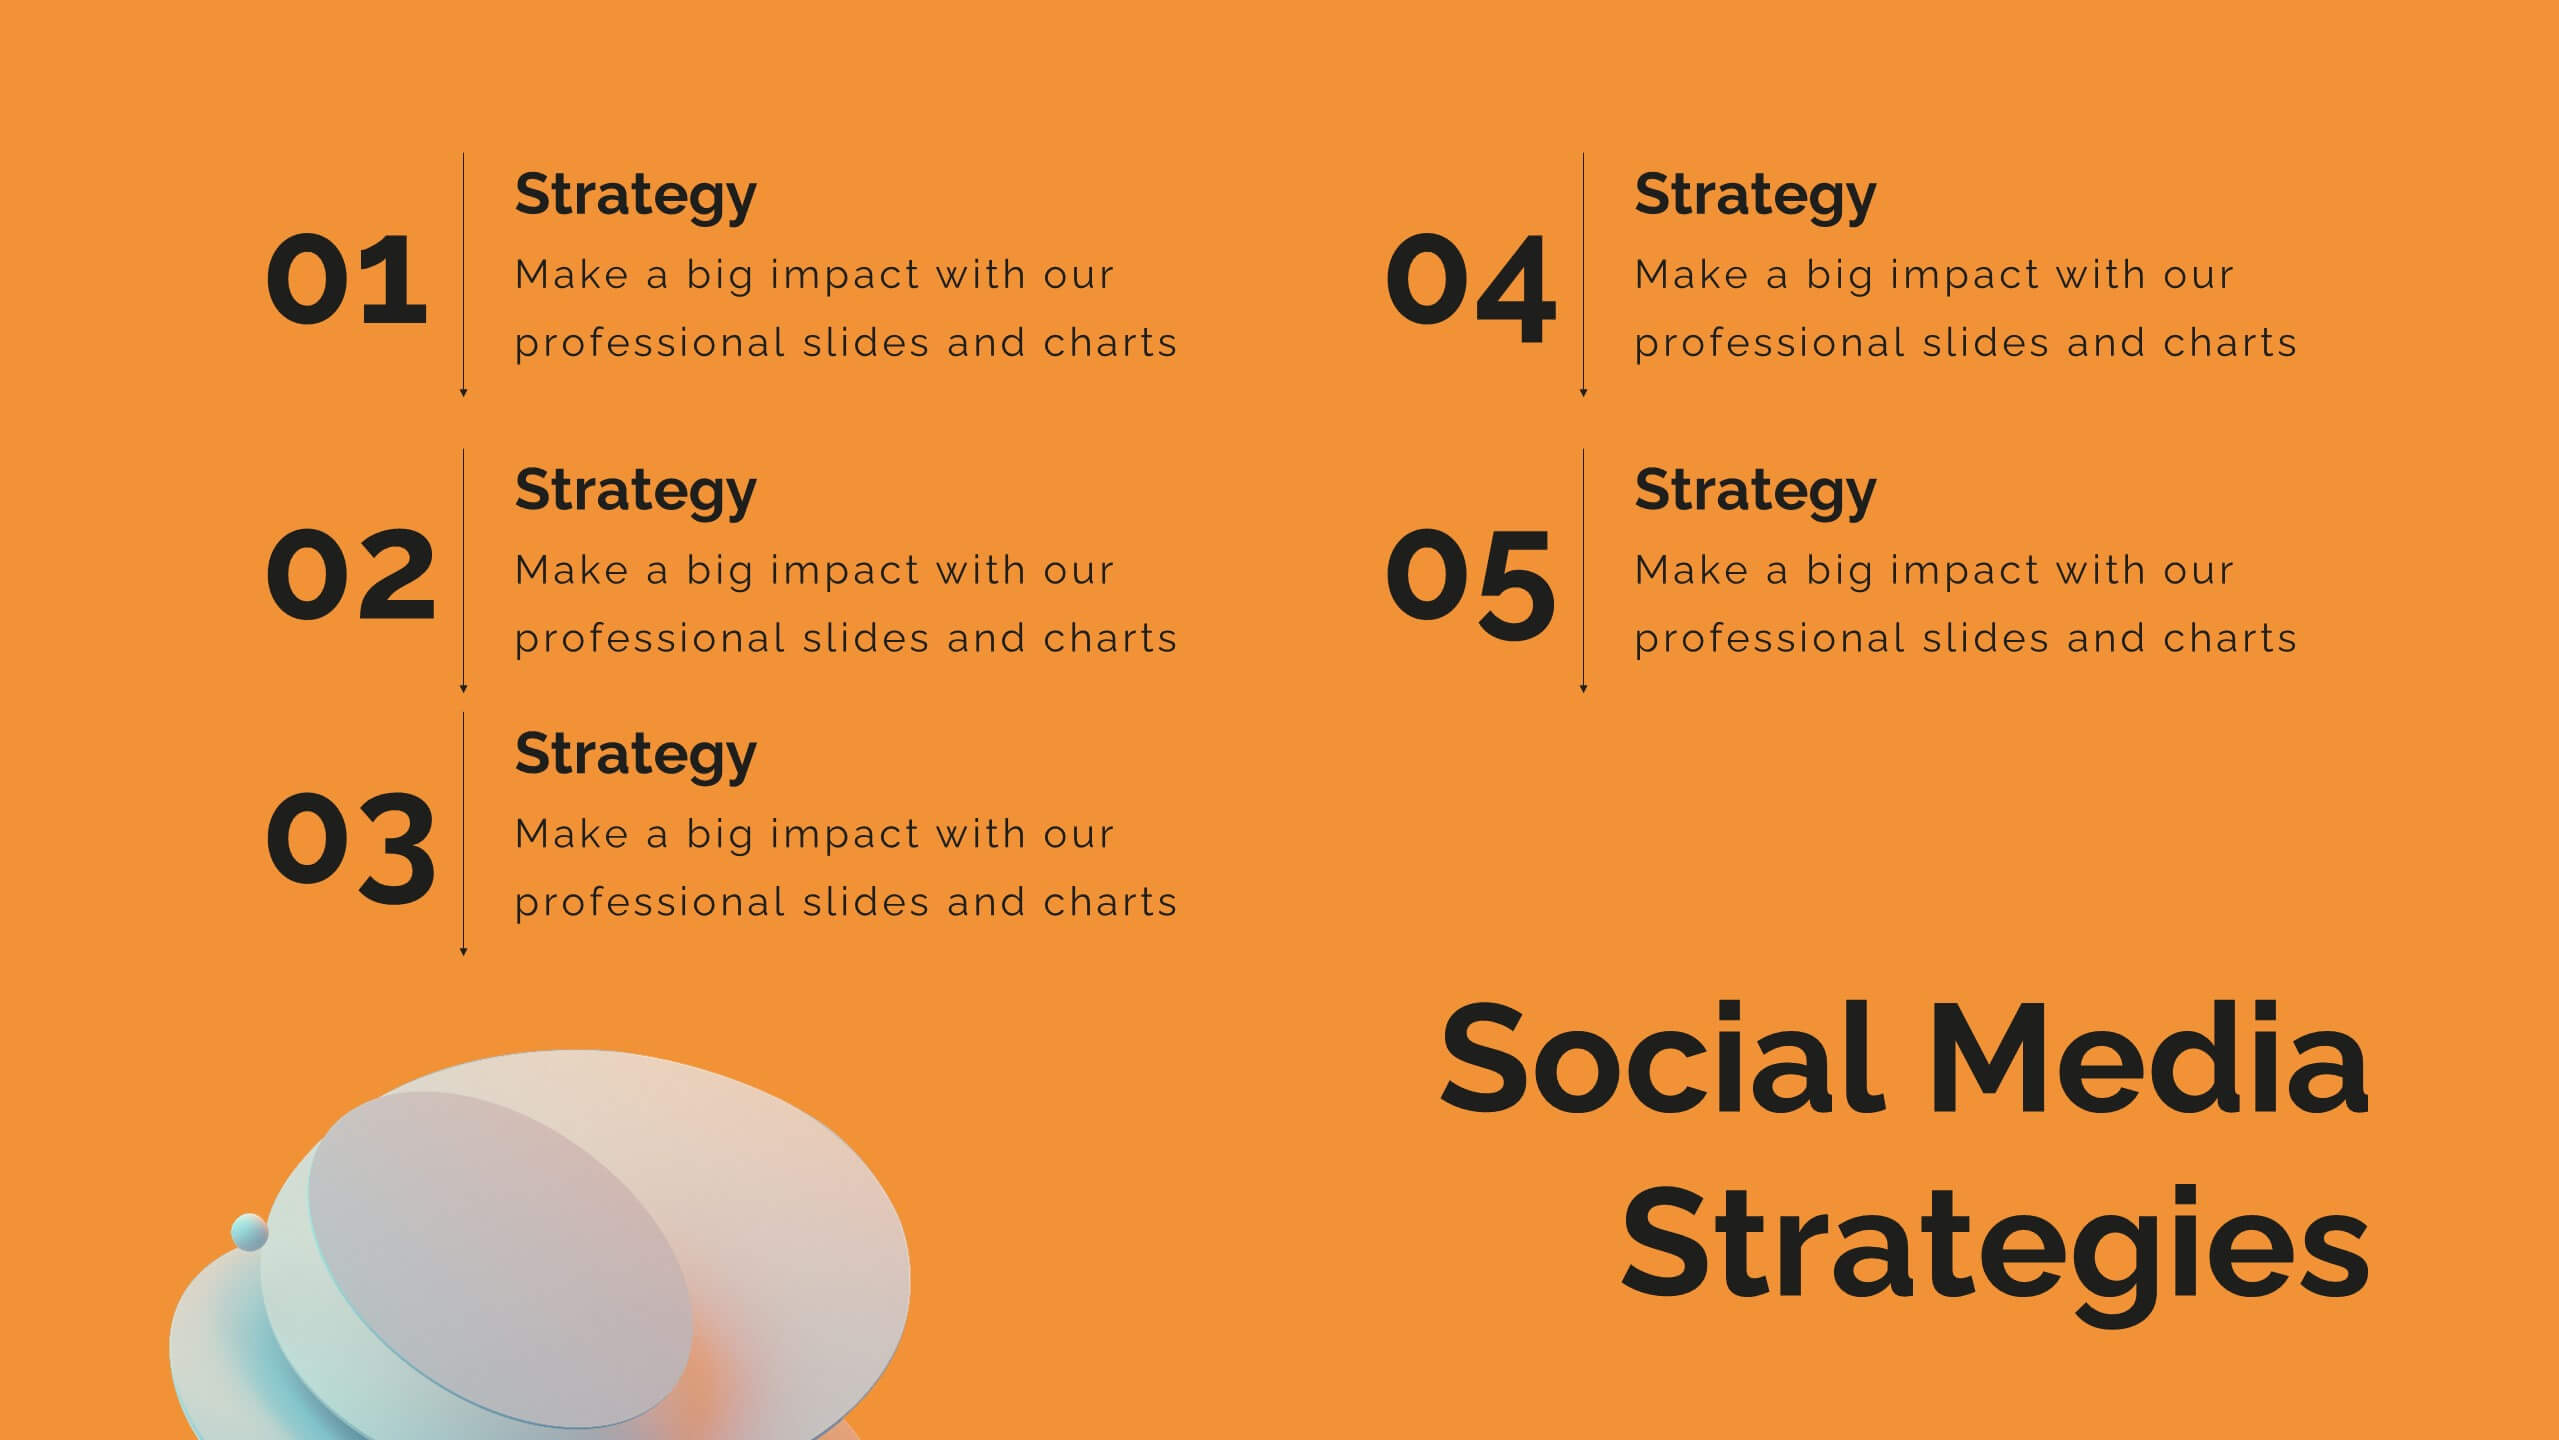
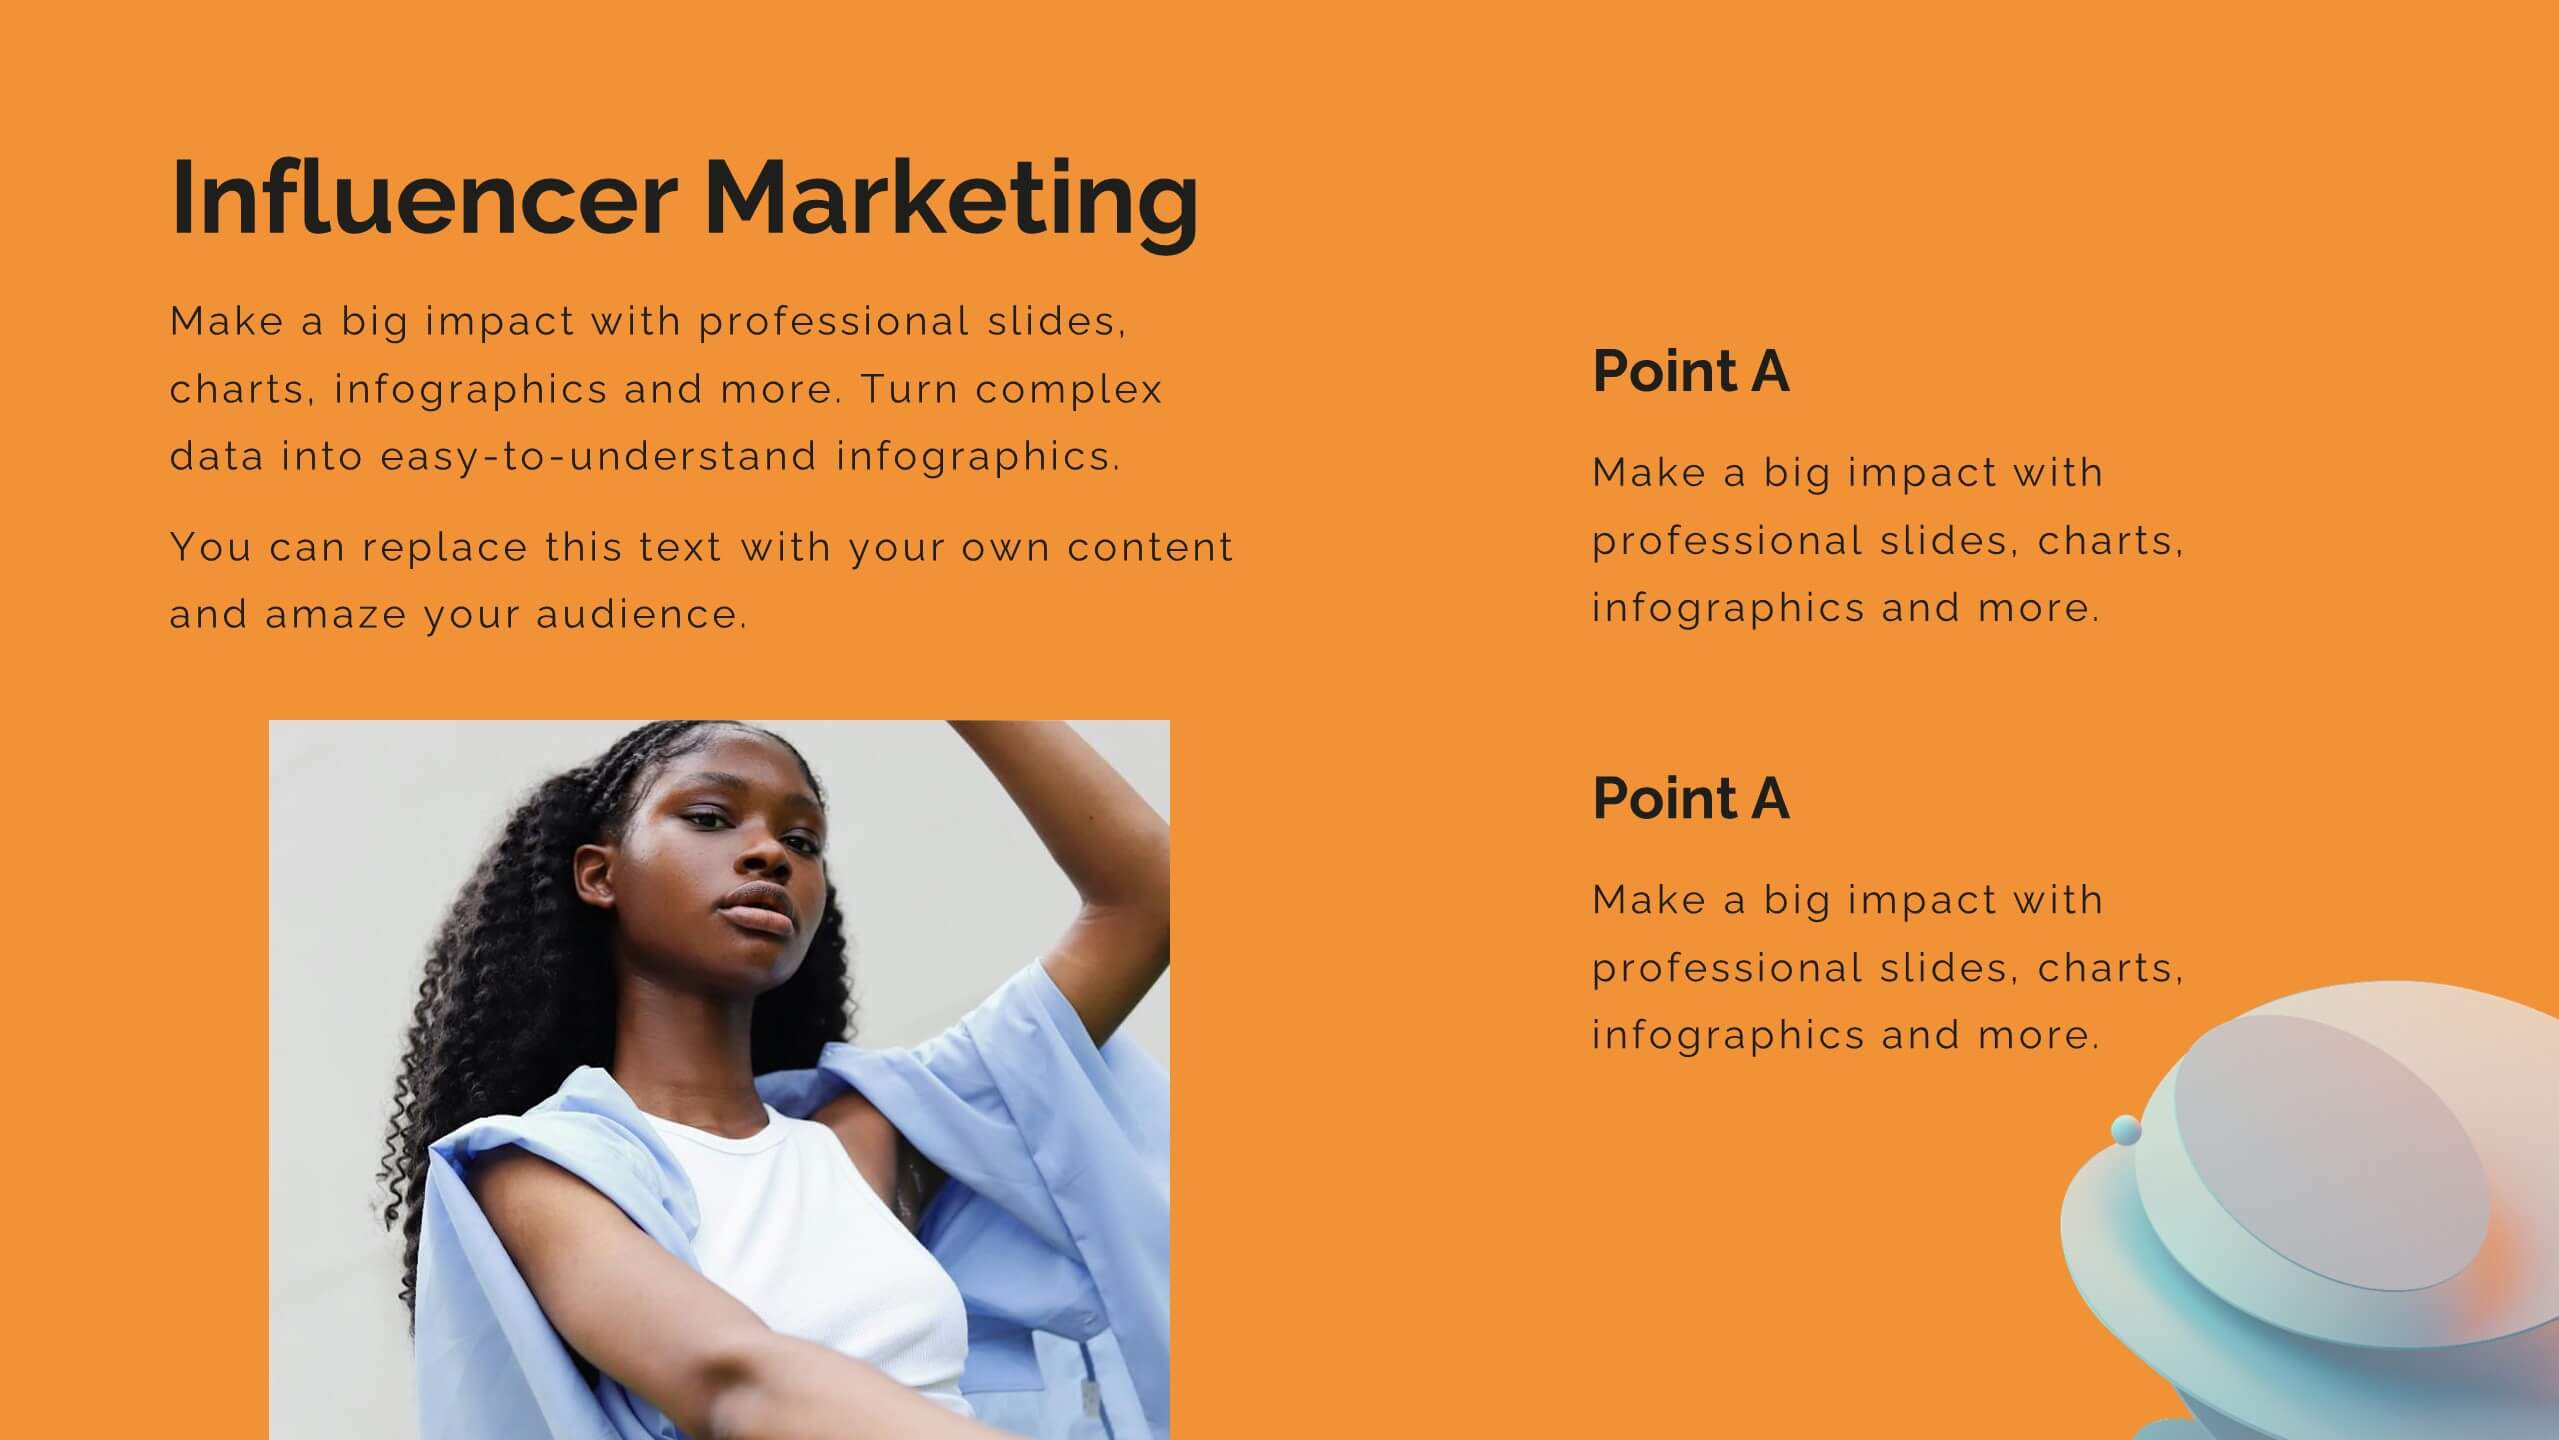
Breeze Content Marketing Pitch Deck Presentation
Elevate your content marketing strategy with this vibrant pitch deck! Perfect for outlining industry trends, consumer behavior, and innovative techniques. Ideal for marketers aiming to impress clients and stakeholders. Compatible with PowerPoint, Keynote, and Google Slides, this template ensures your pitch is engaging, persuasive, and professional. Achieve marketing success today!


2 diapositivas
Minimalist Cover Page Design Presentation
A clean, modern visual instantly sets the tone, giving your audience a polished start before your message even begins. This presentation introduces your content with a bold, minimalist layout that feels intentional and professional. Perfect for business, creative, or academic use. Fully compatible with PowerPoint, Keynote, and Google Slides.


6 diapositivas
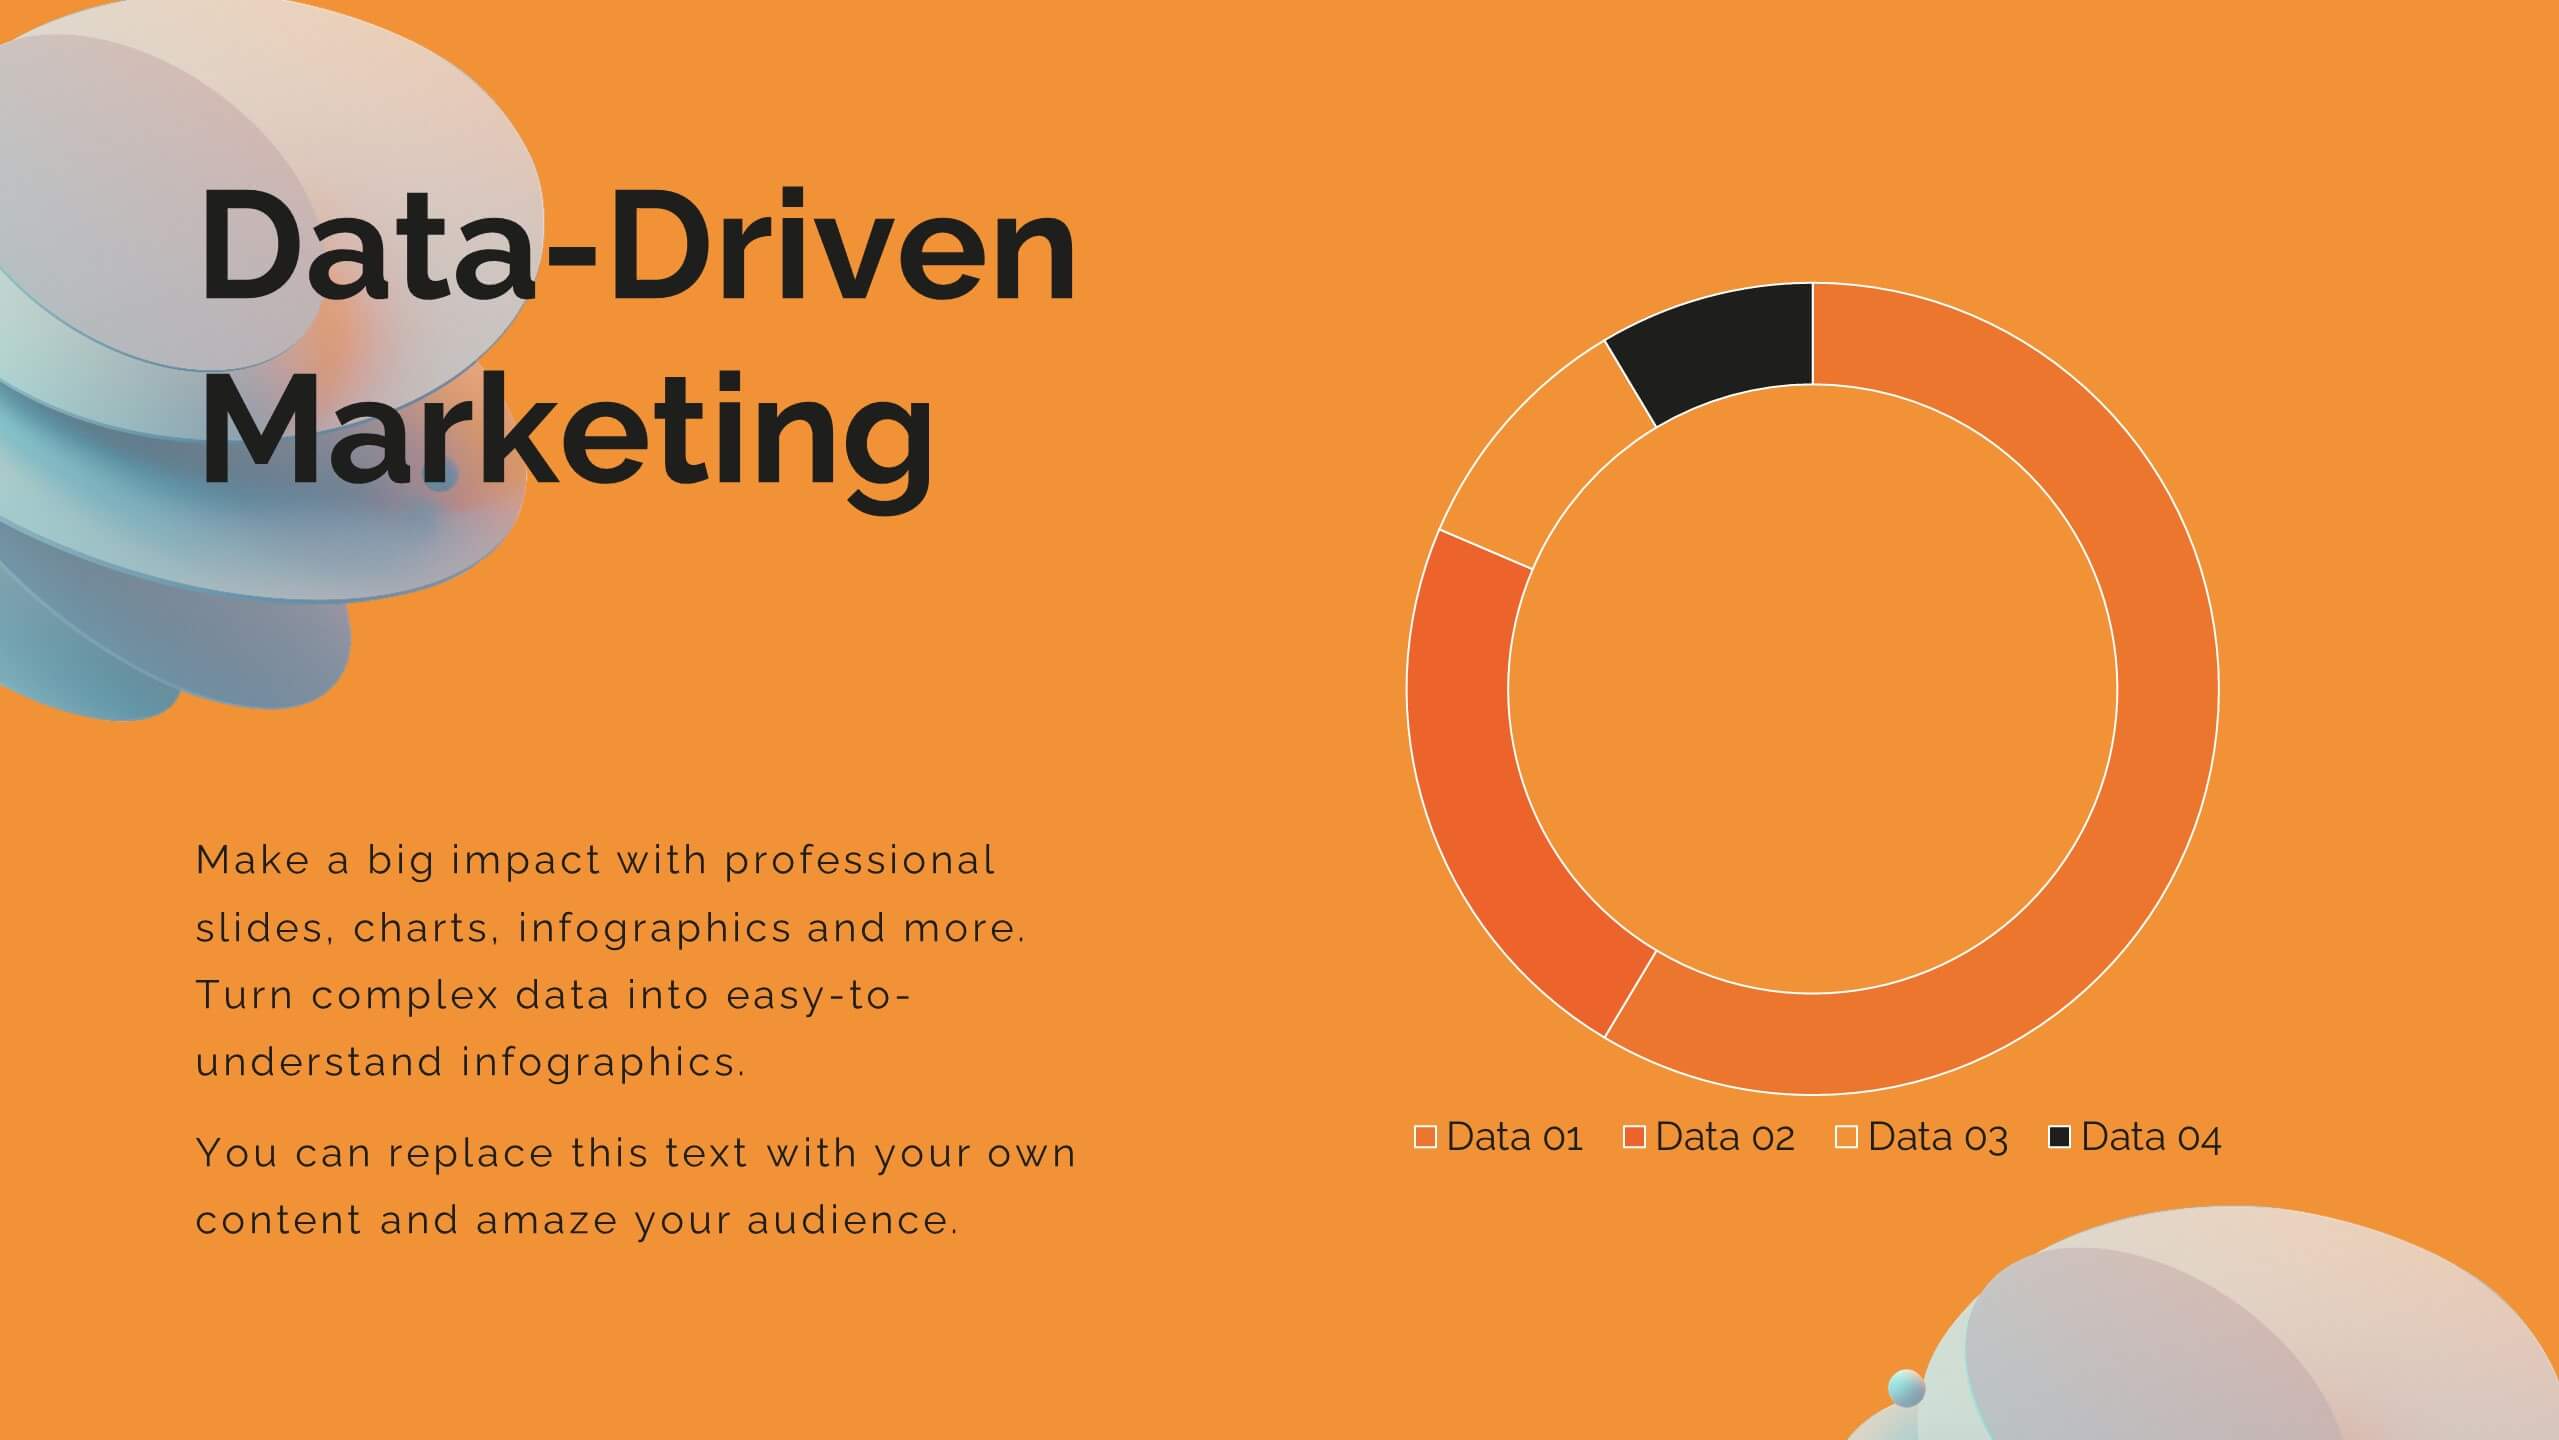
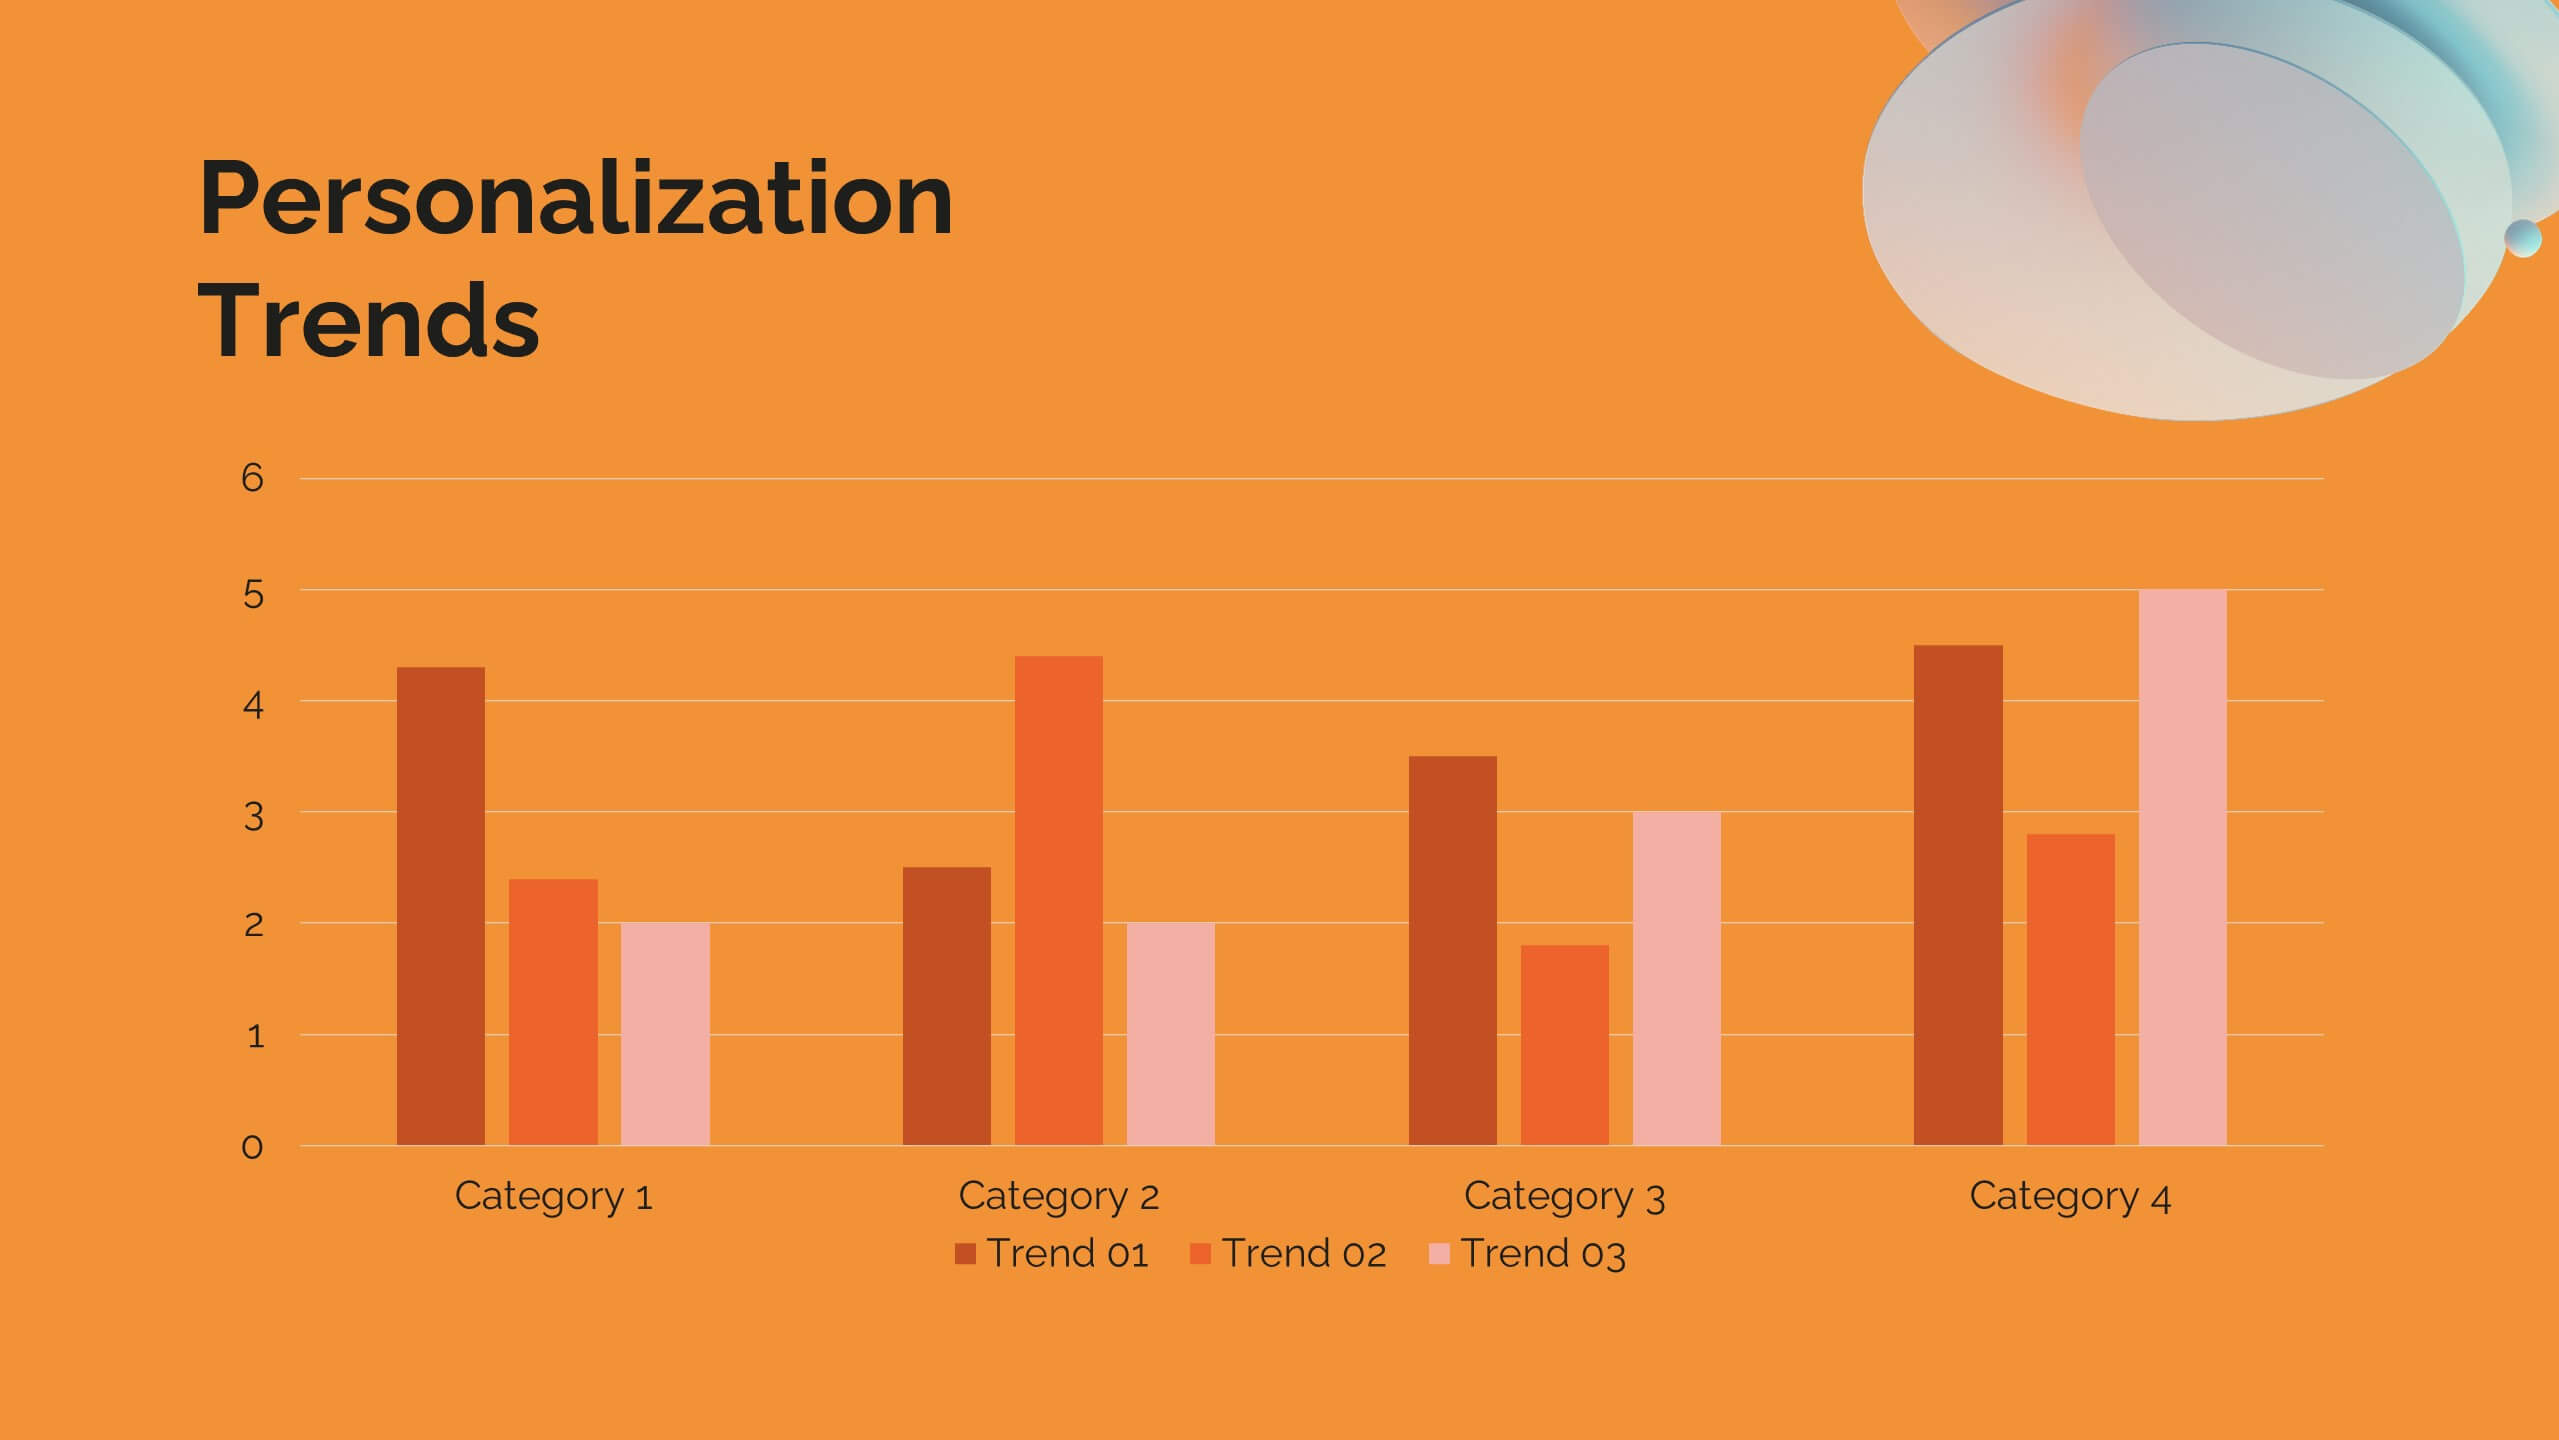
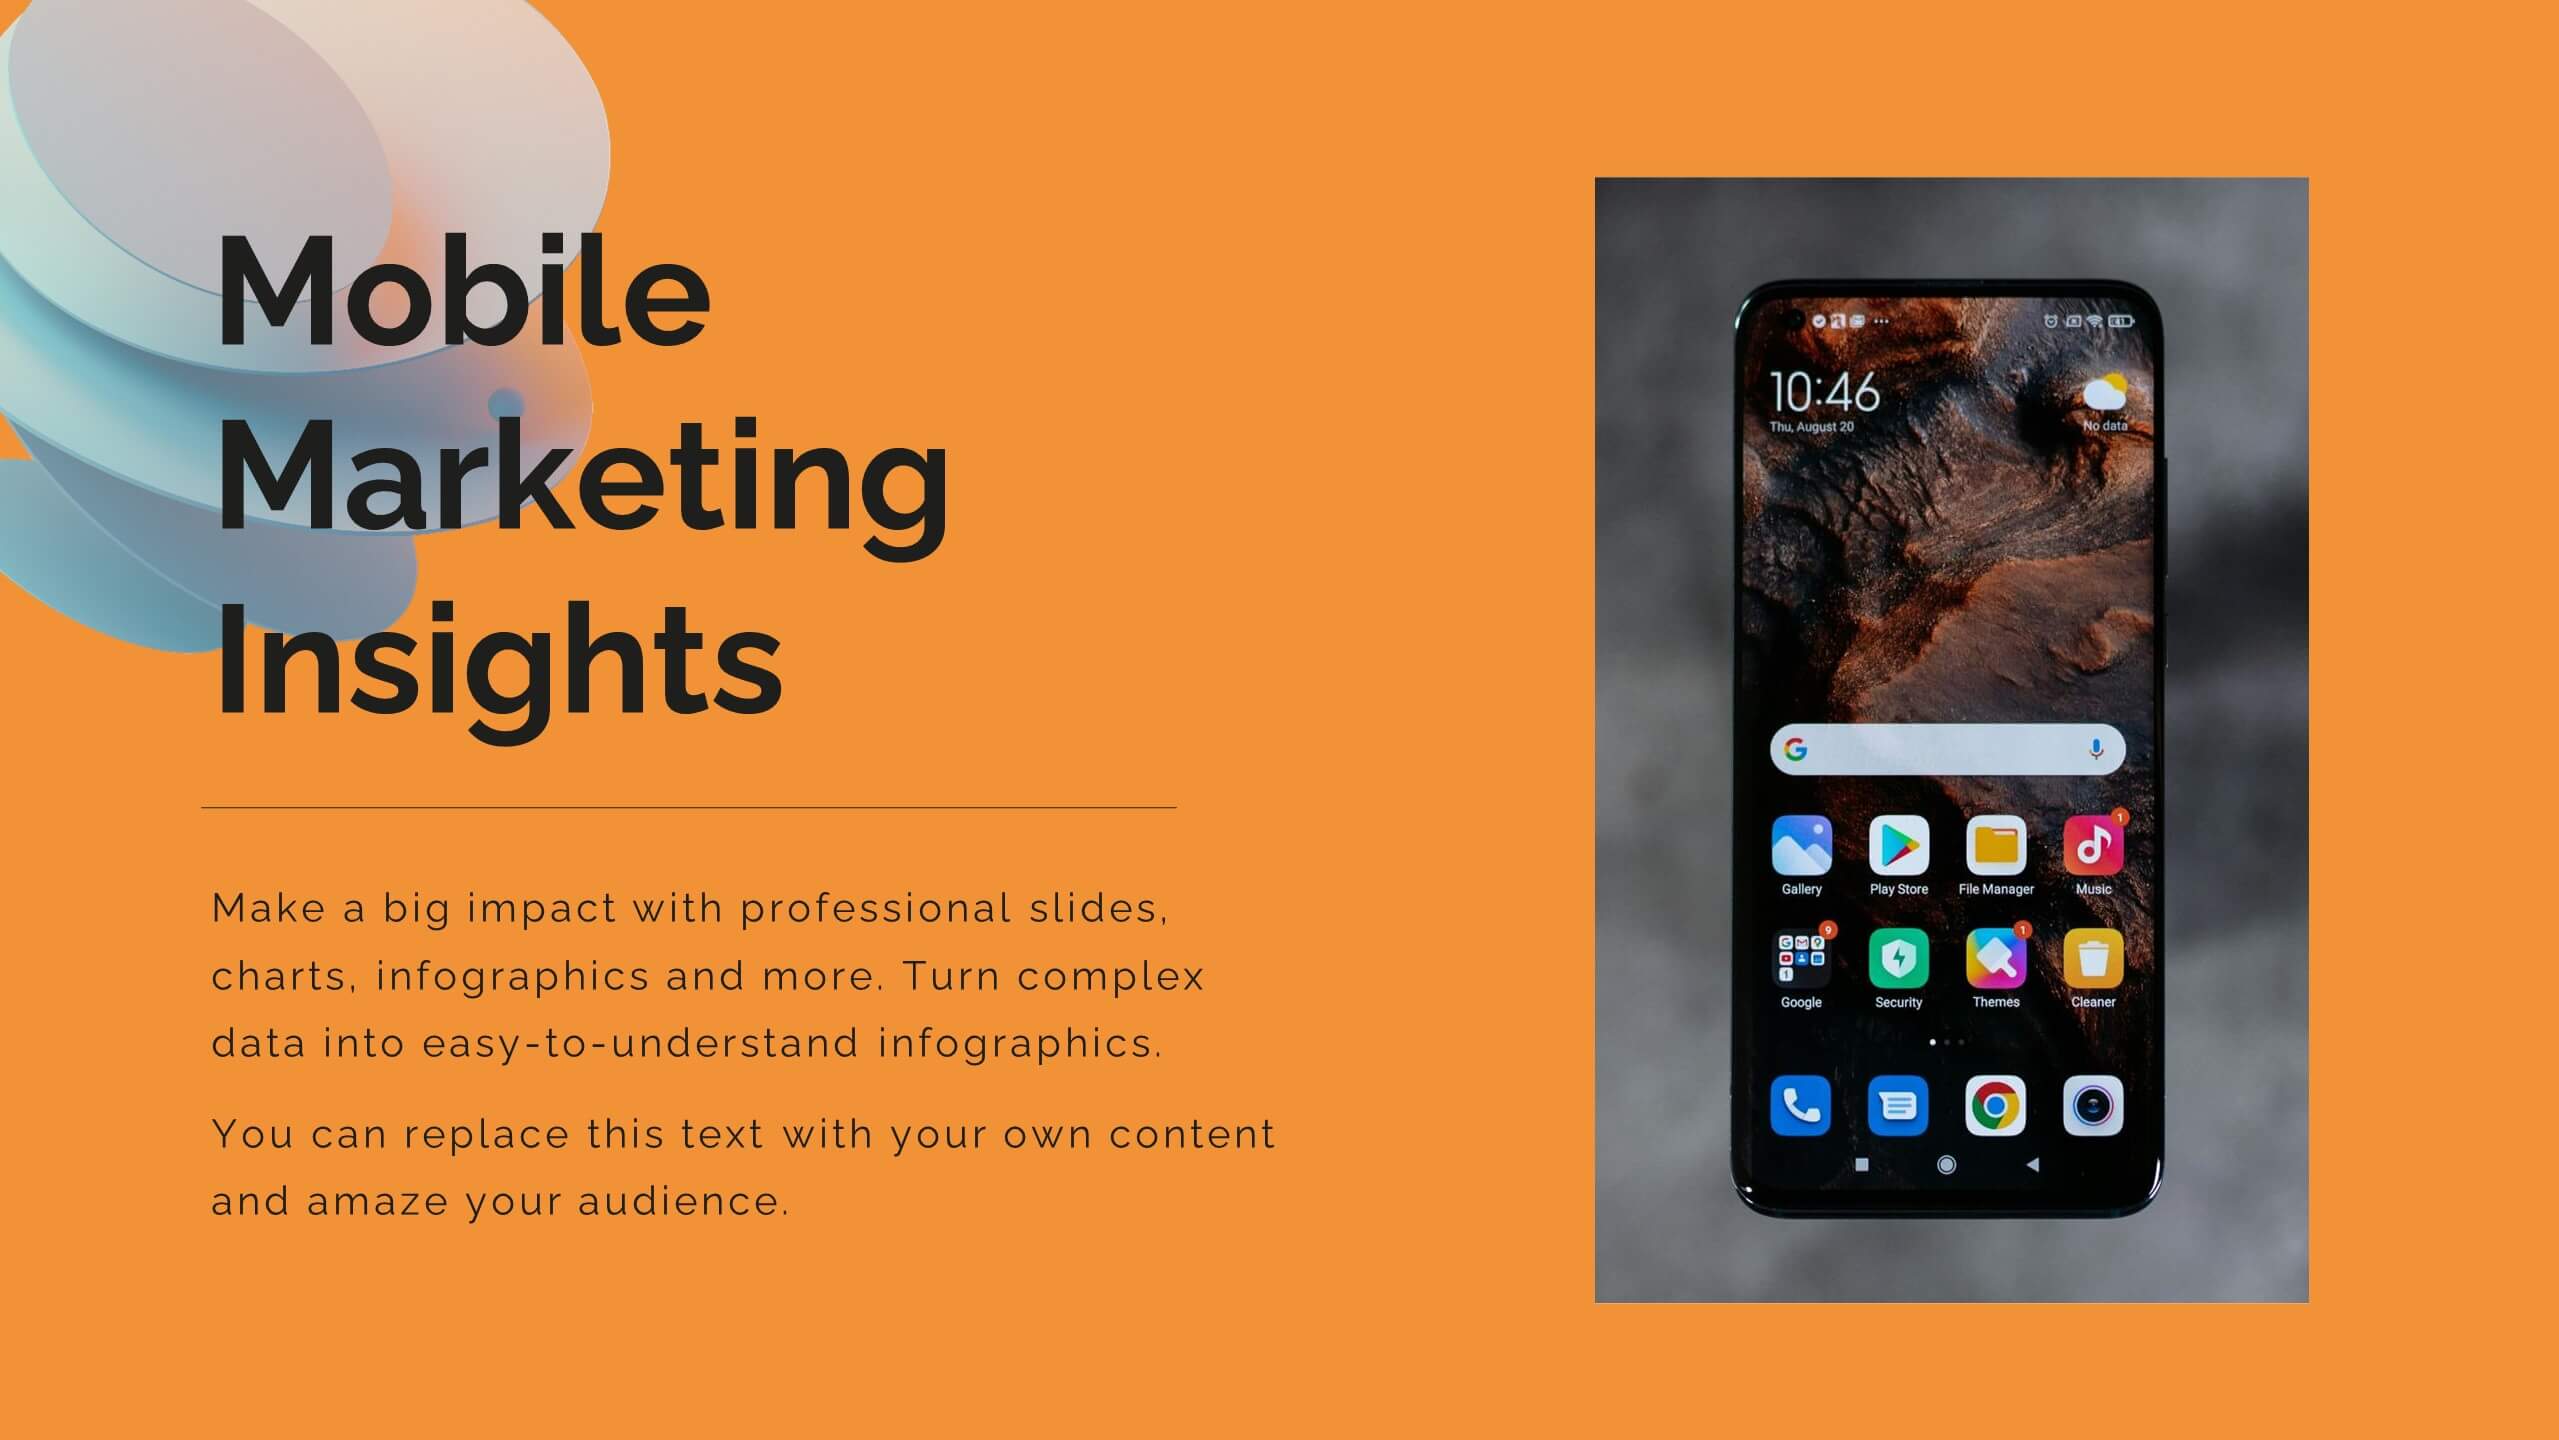
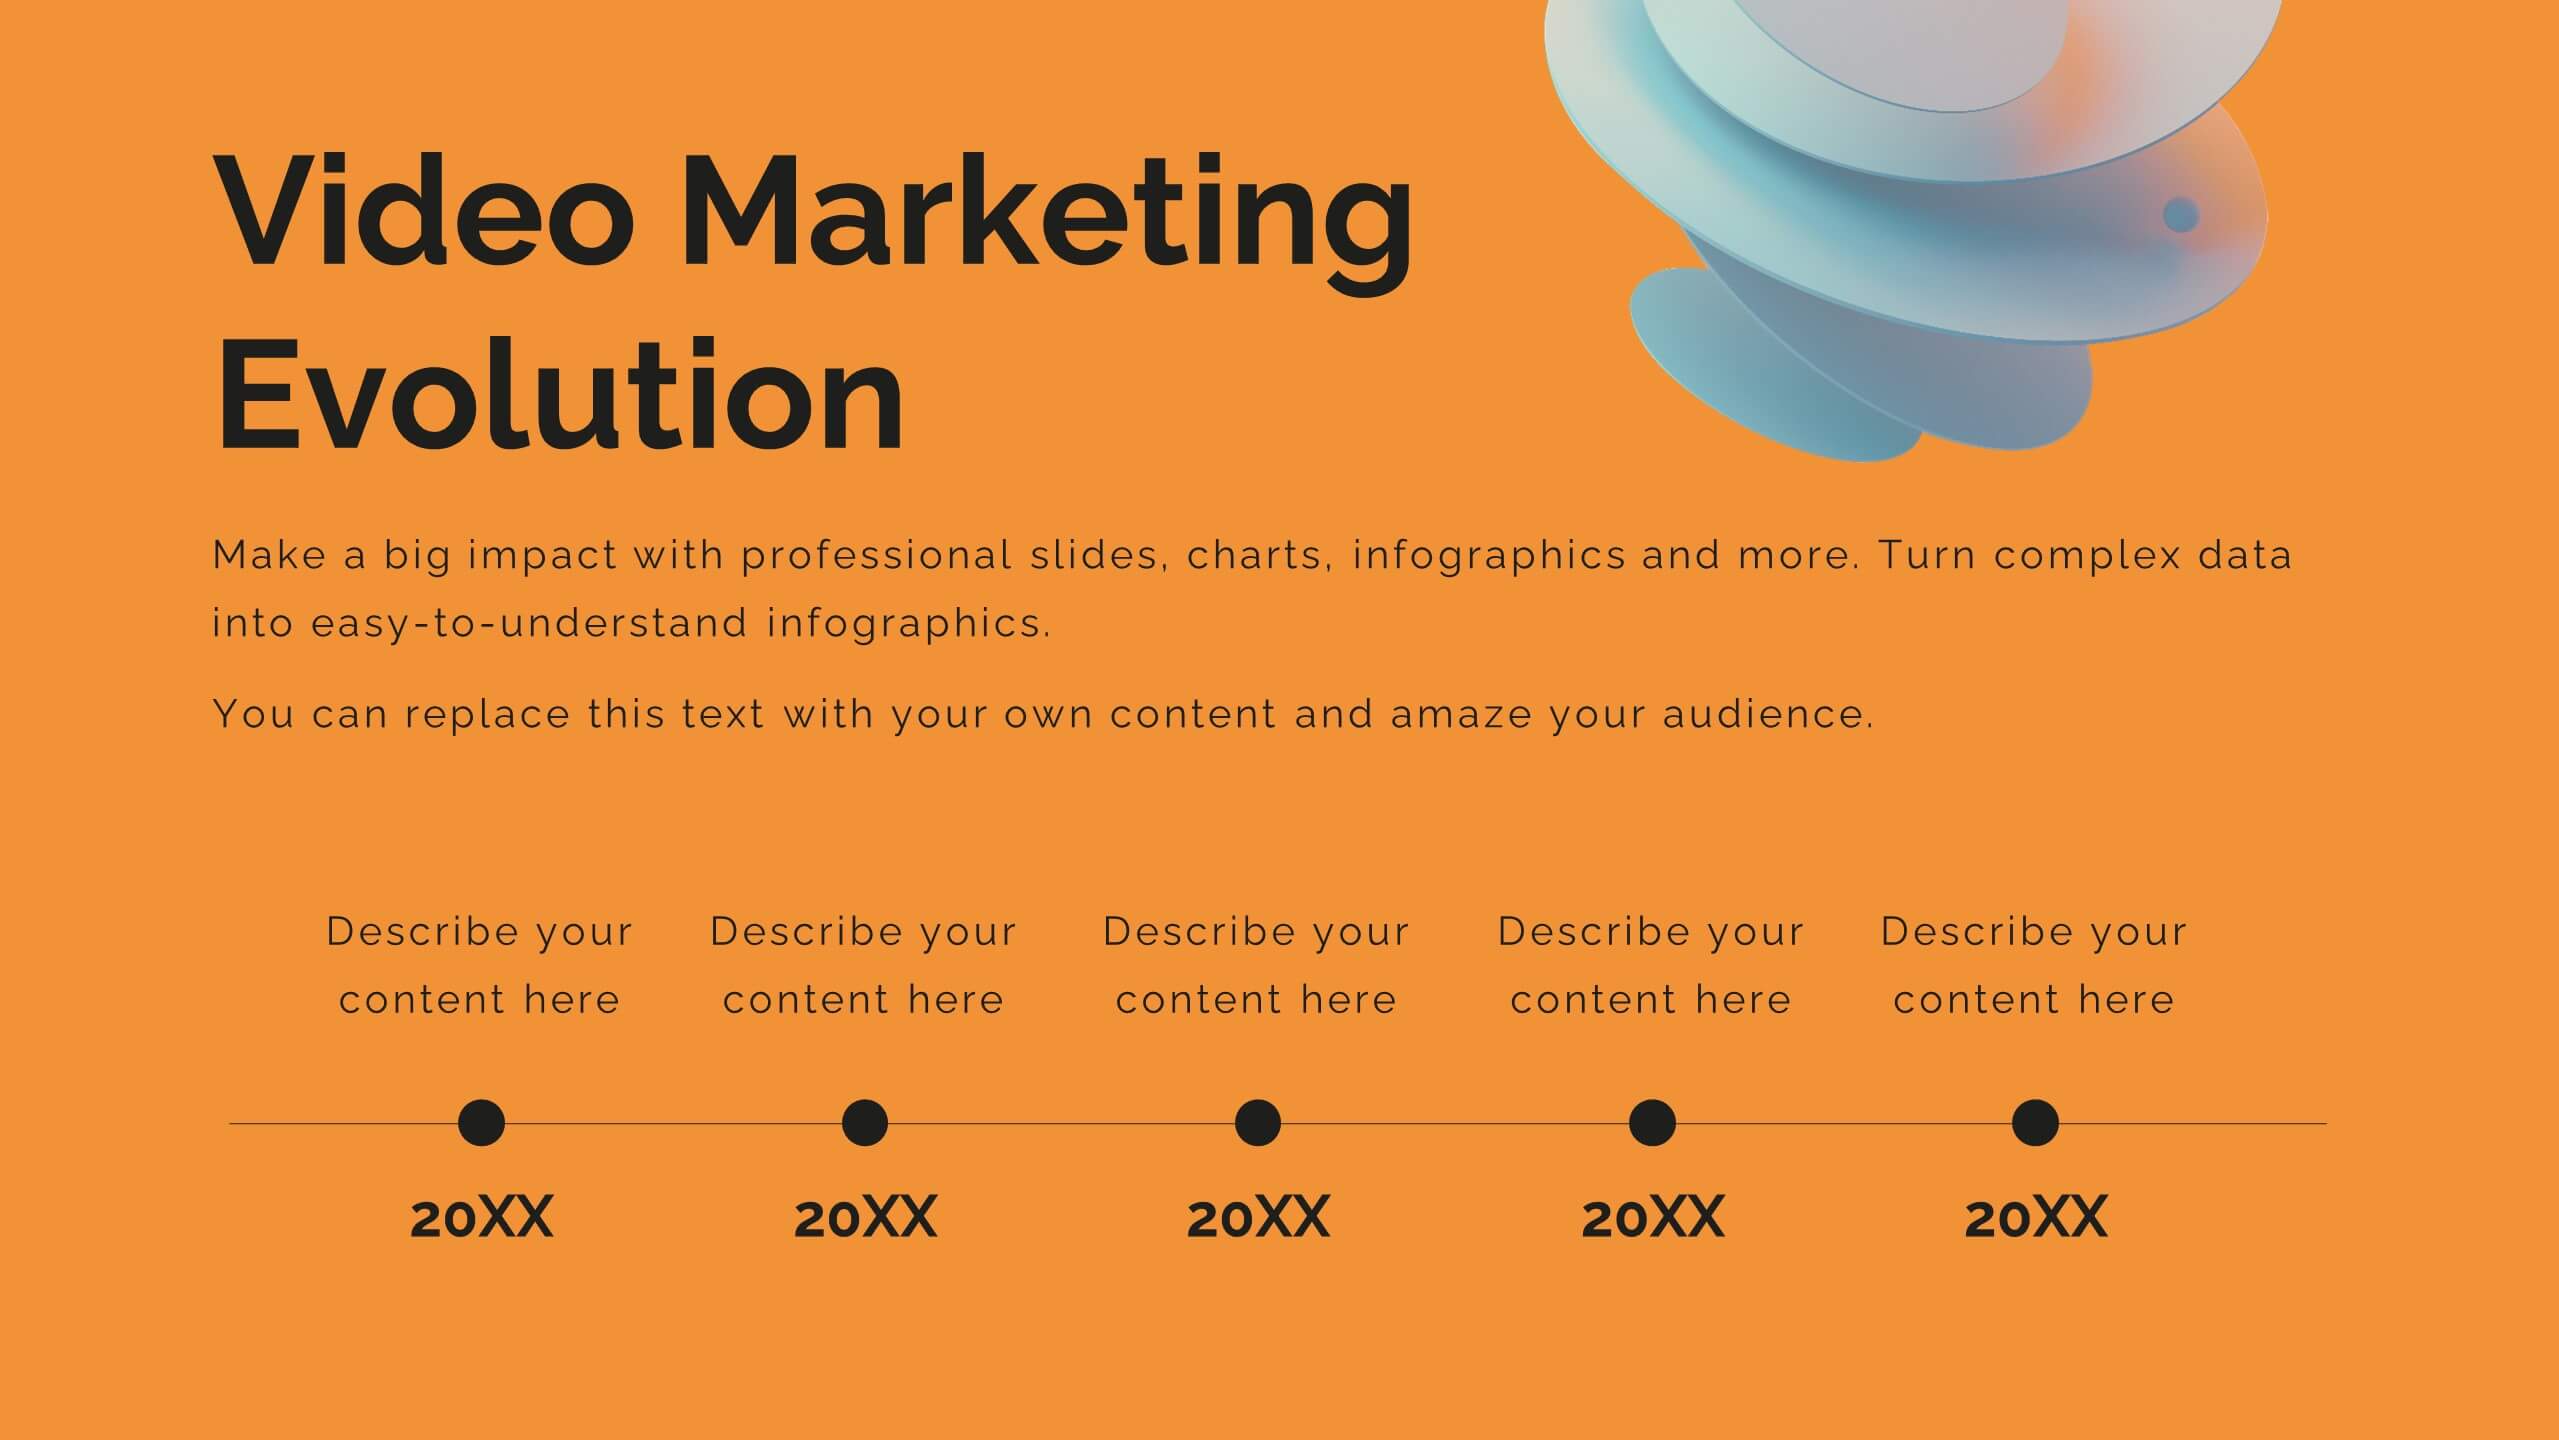
Product Launch Pitch Deck
Make your product debut unforgettable with this dynamic pitch deck slide. Featuring clean visuals, pie chart stats, and a mobile app mockup, it’s ideal for tech startups and innovative brands. Fully customizable in PowerPoint, Keynote, and Google Slides, it's perfect for presenting key product benefits and performance highlights.