


Características


¿Tienes alguna pregunta?
Recomendar


5 diapositivas
Client Engagement Journey Touchpoints
Map out every stage of client interaction with the Client Engagement Journey Touchpoints Presentation. This visual slide template highlights four key customer touchpoints, with a central user icon to emphasize the client-centric approach. Ideal for showcasing brand awareness, first contact, engagement strategies, and conversion steps. Easily customizable in PowerPoint, Keynote, and Google Slides.


7 diapositivas
Business Decision-Making Questions Presentation
Streamline your decision-making process with this engaging and structured presentation slide. Featuring a lightbulb and question mark design, this template effectively illustrates problem-solving and strategic choices in a professional and visually appealing way. Ideal for business strategy, consulting, and brainstorming sessions, it is fully editable, allowing you to customize text, colors, and layout to fit your needs. Compatible with PowerPoint, Keynote, and Google Slides for seamless use.
20 diapositivas
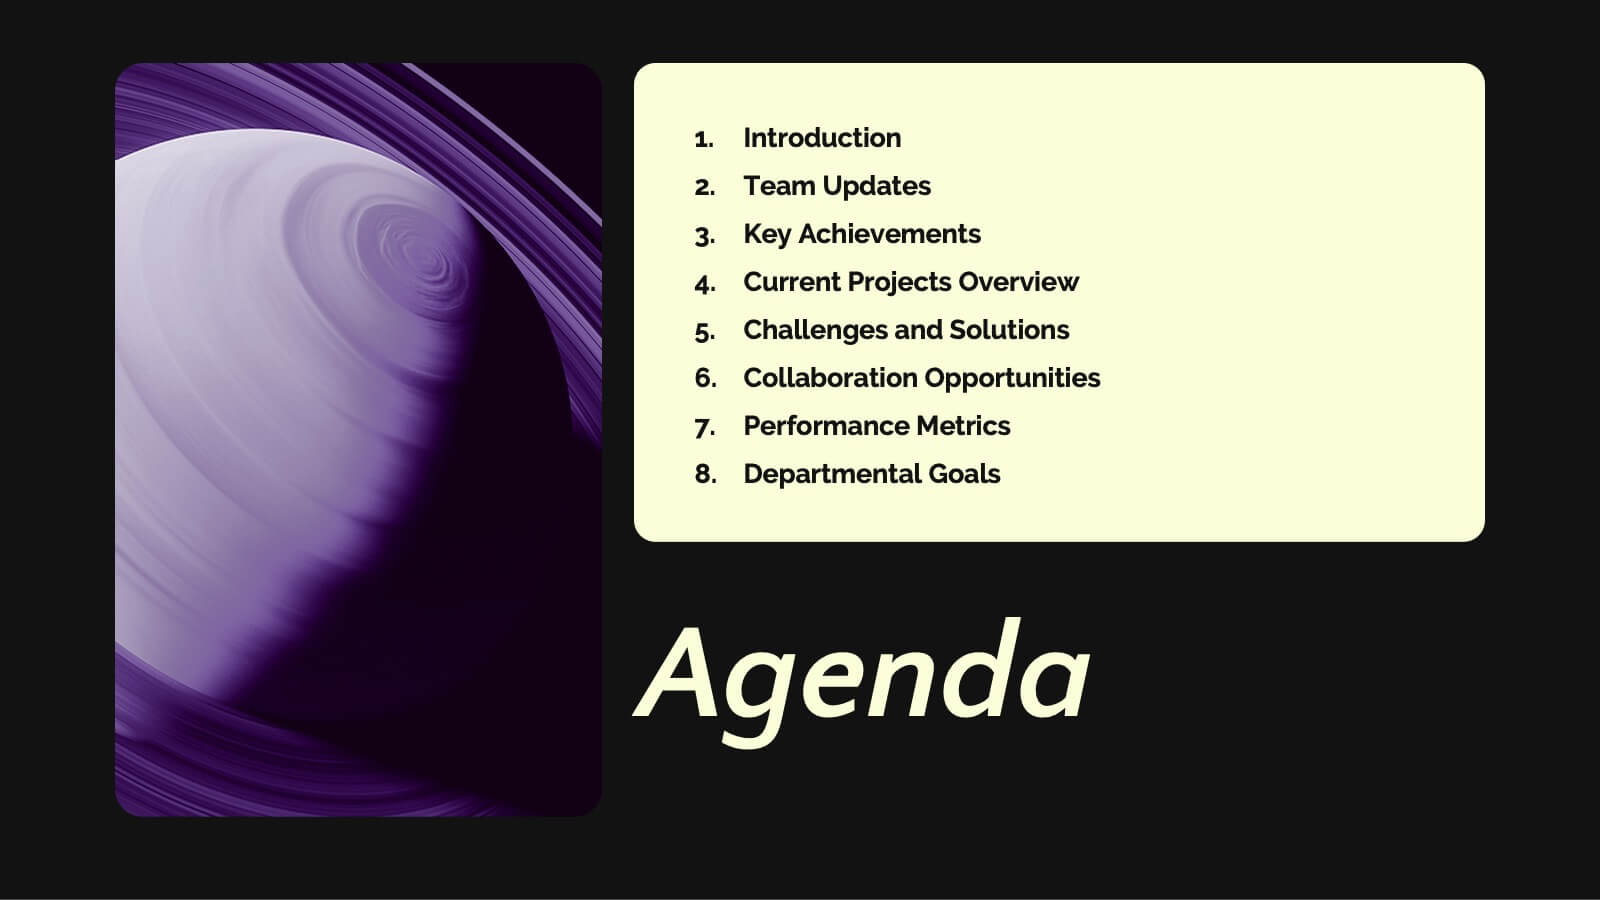
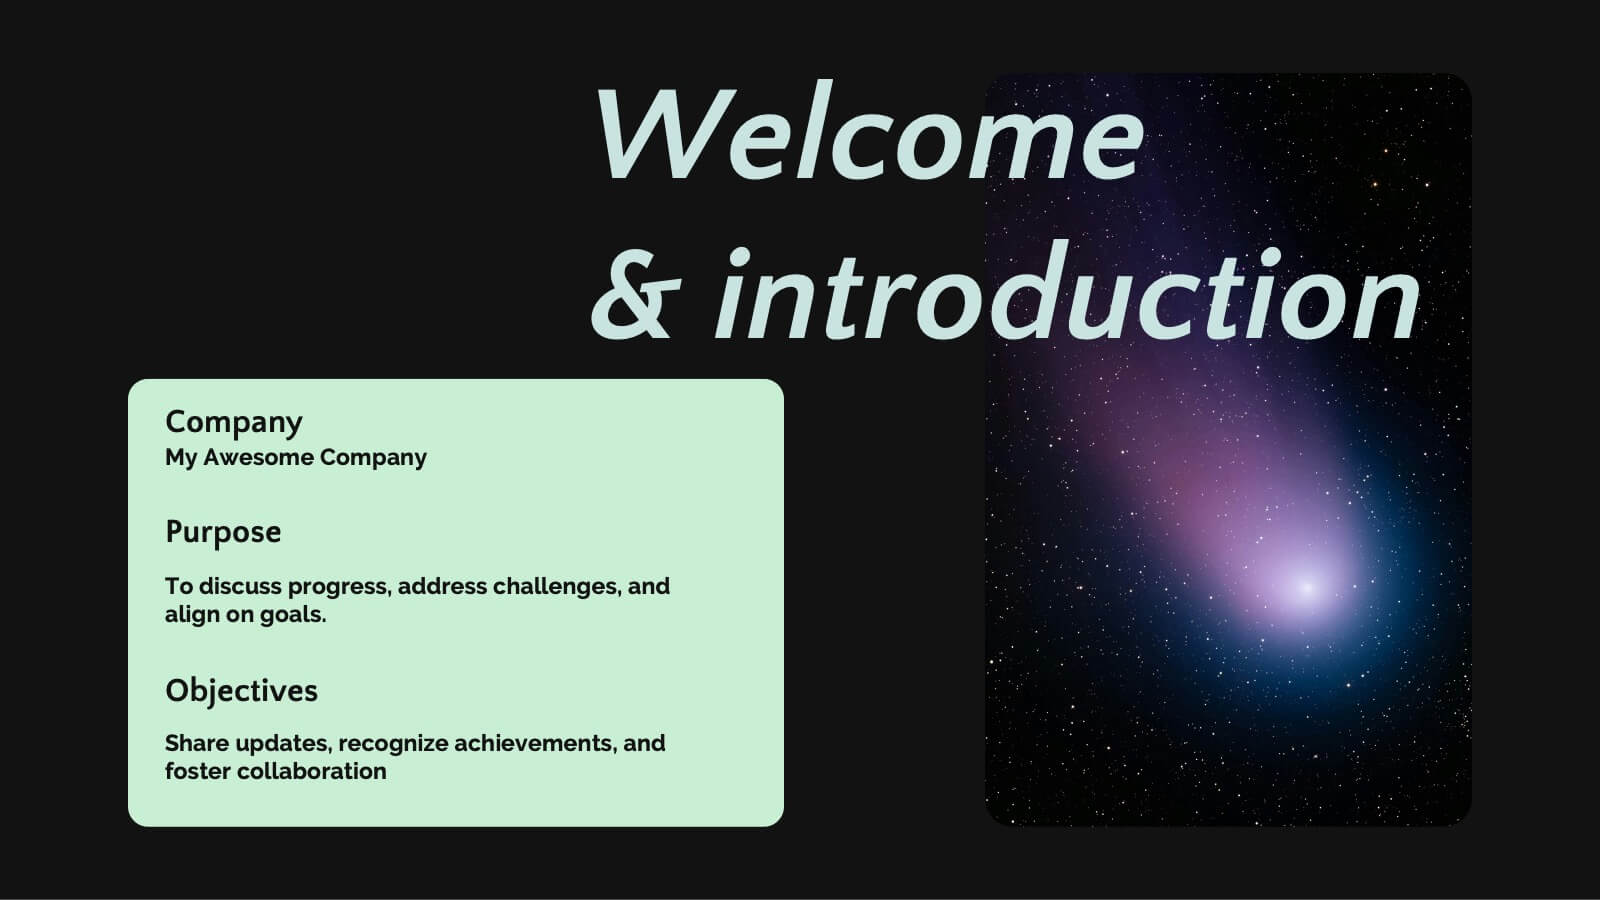
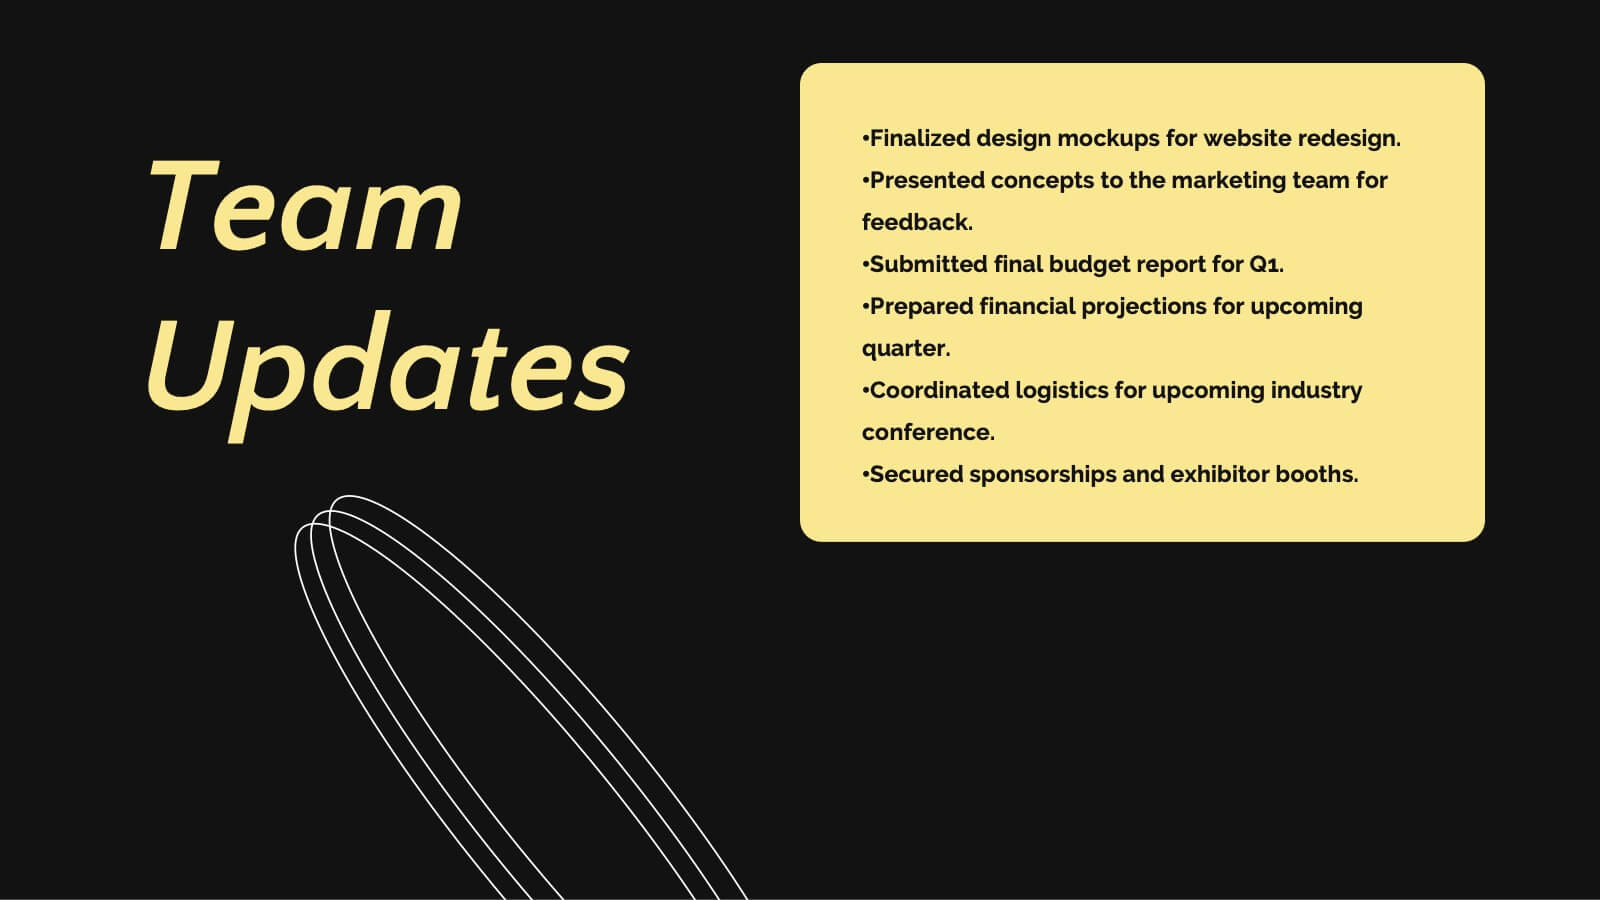
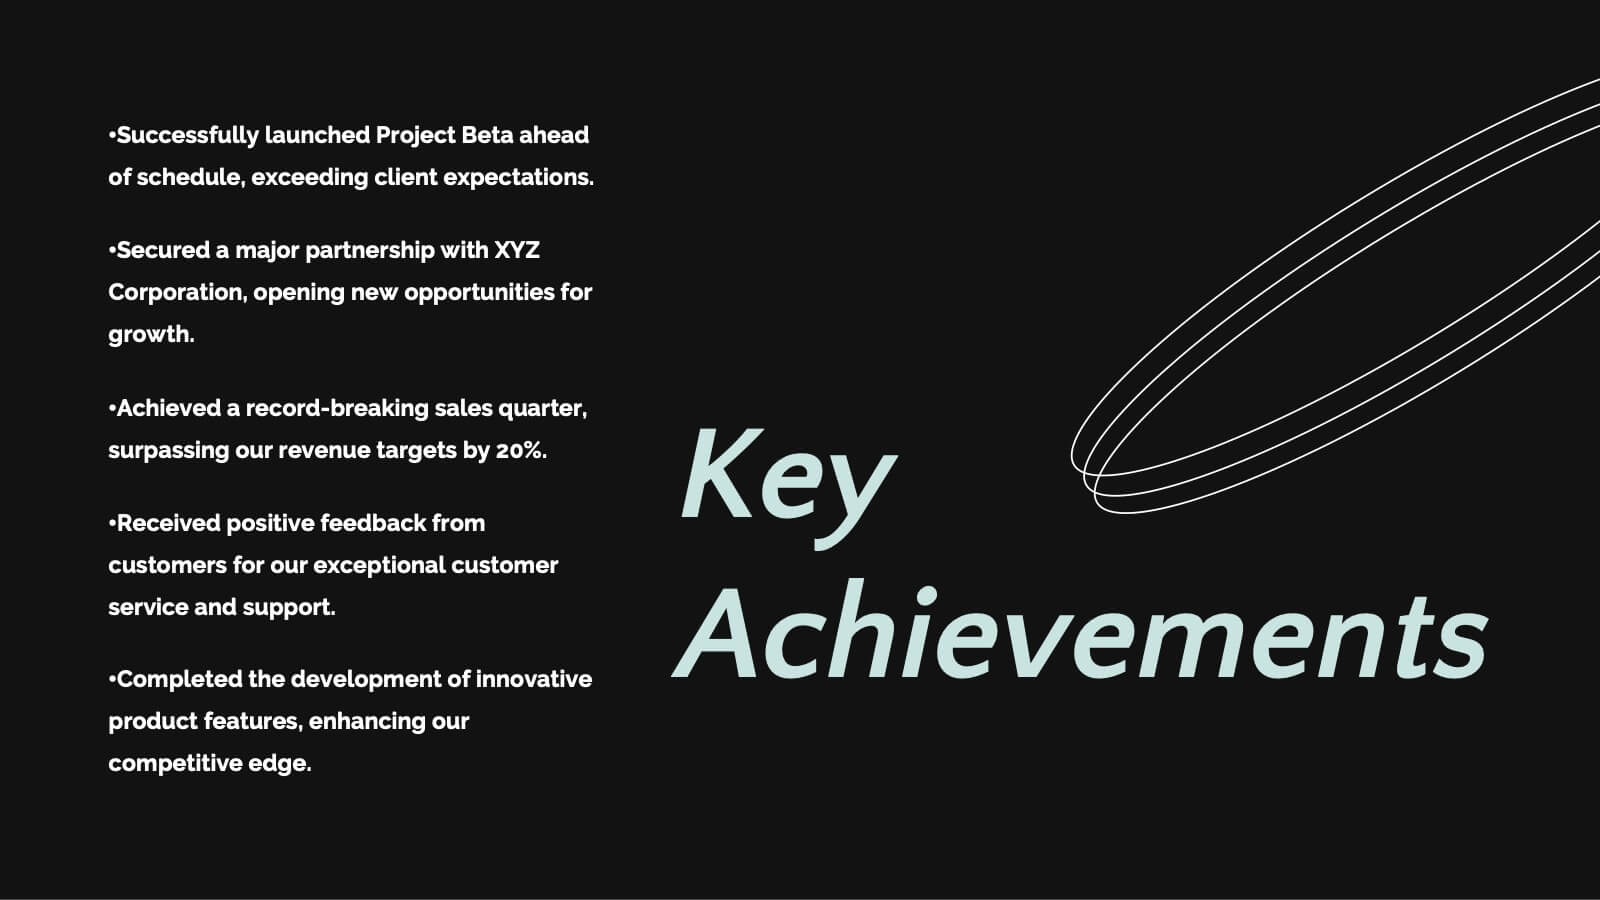
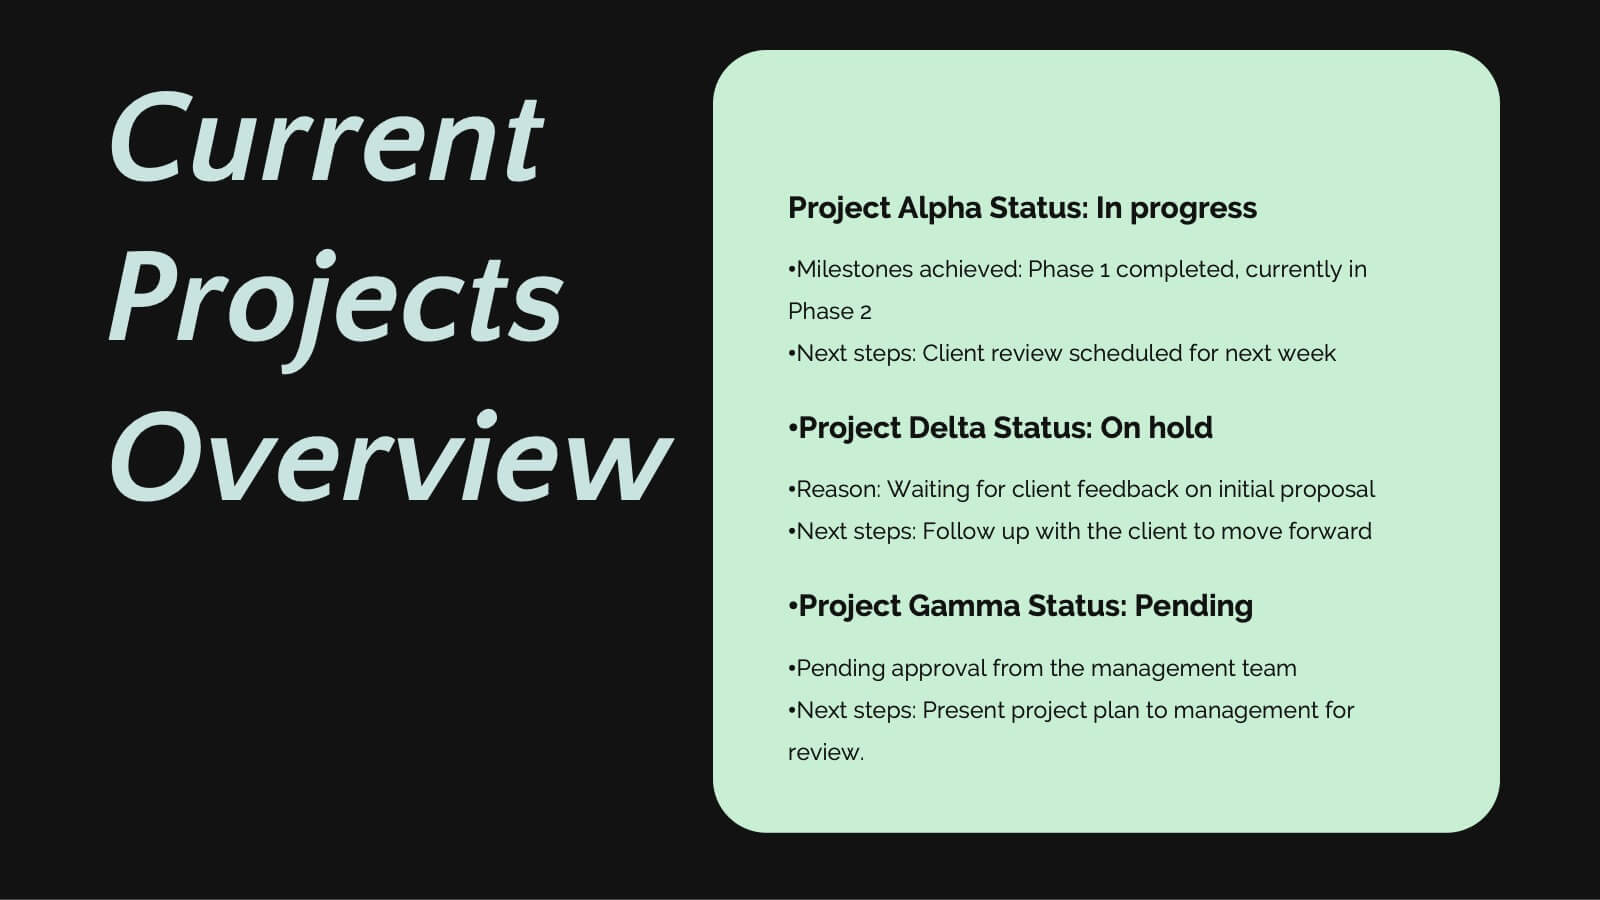
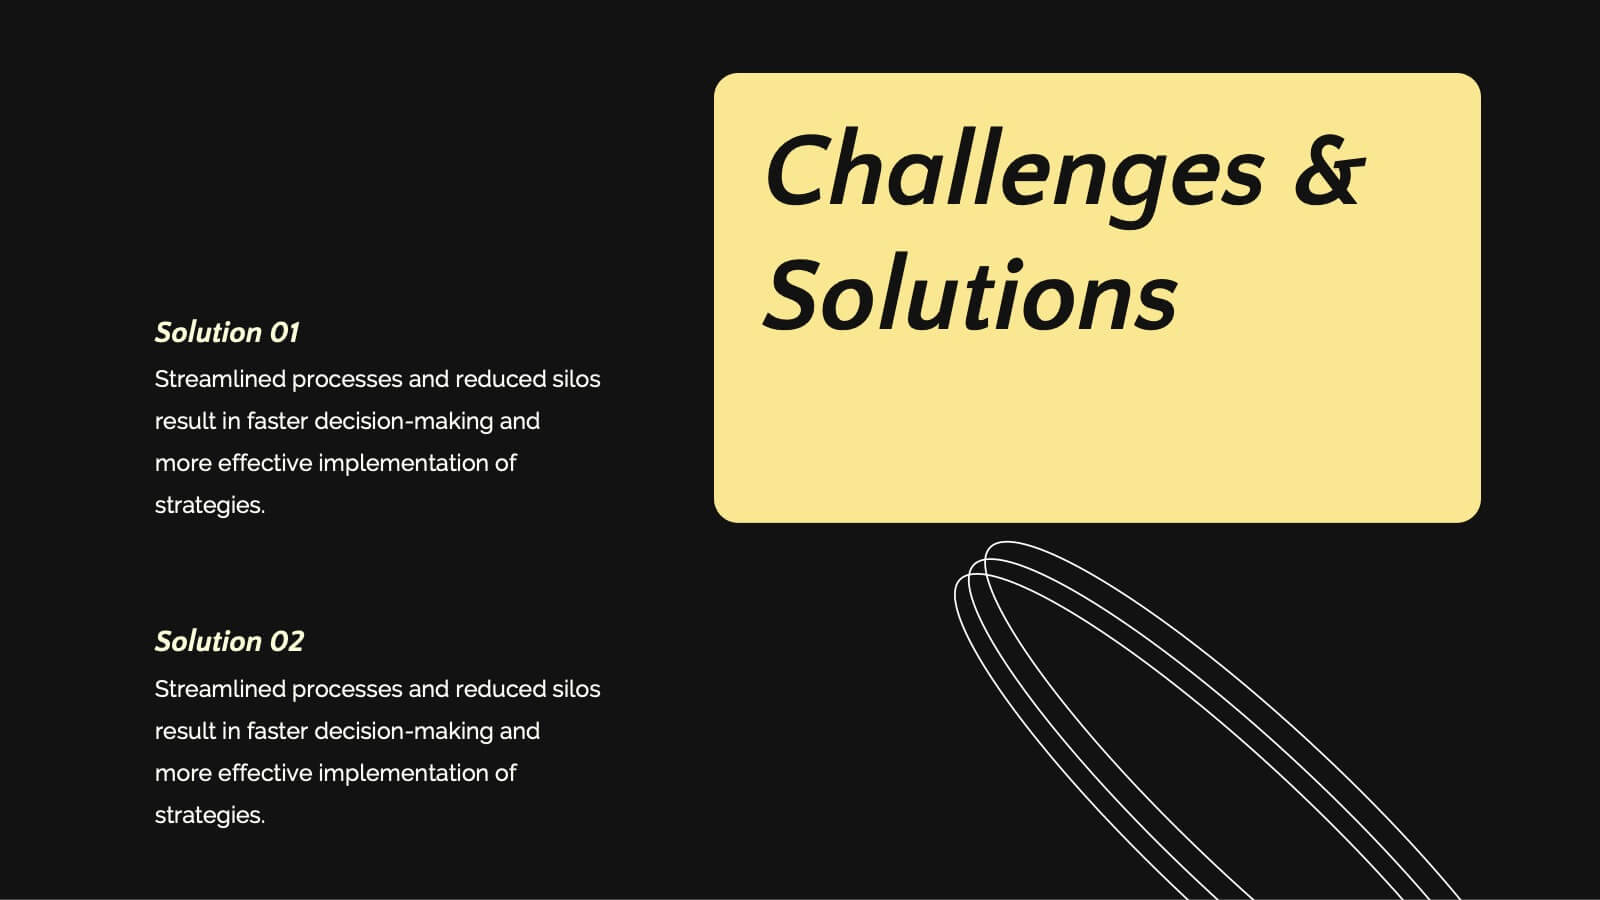
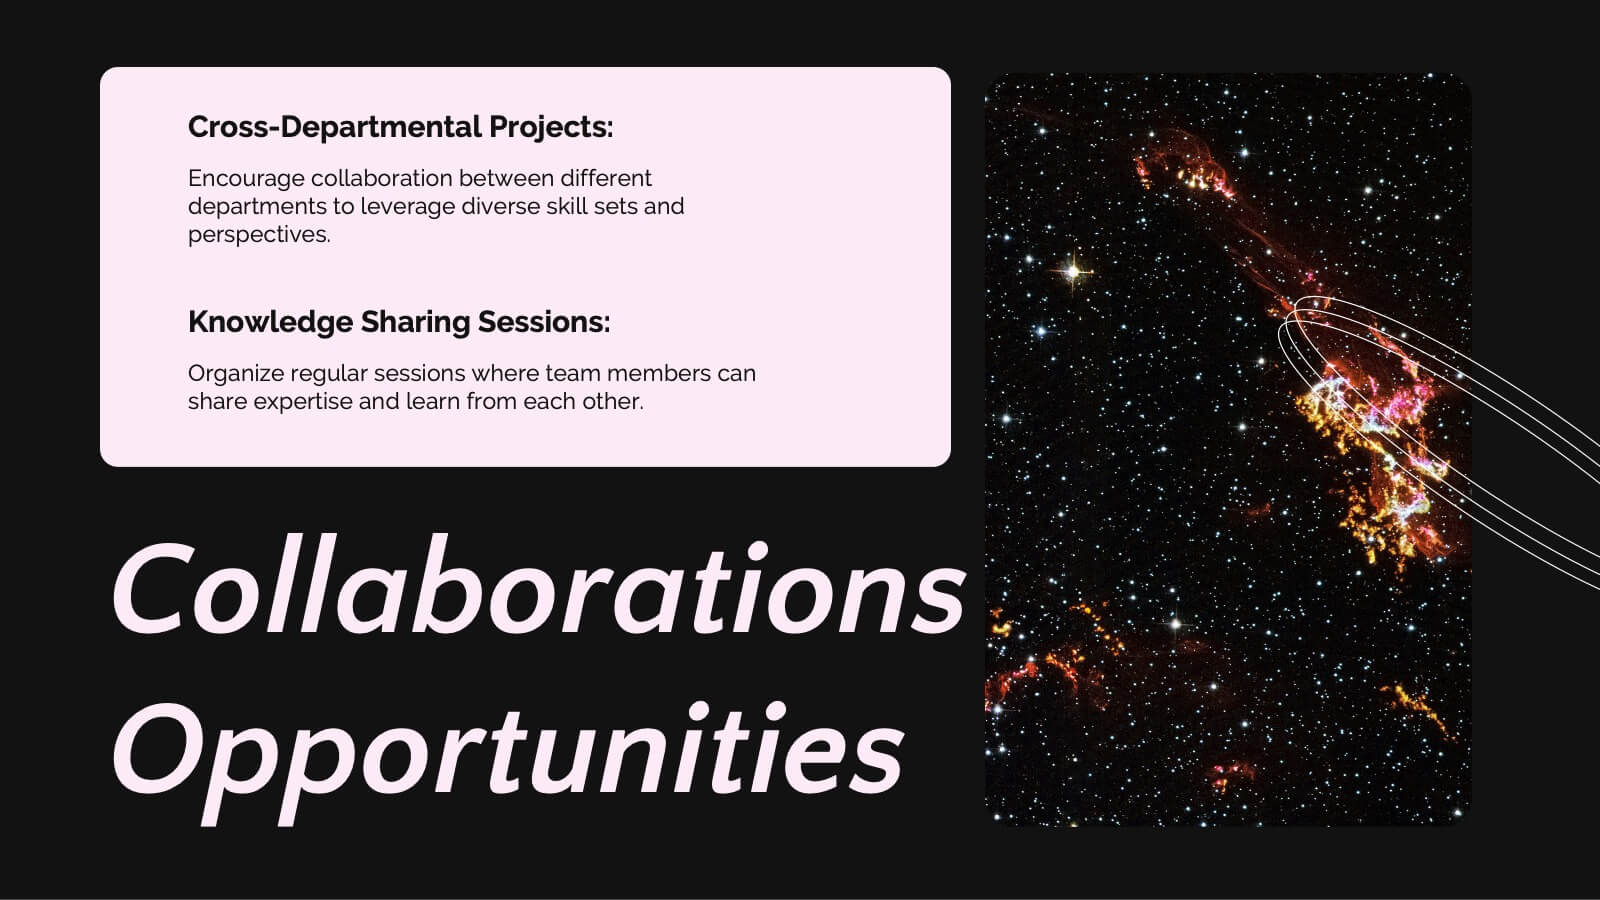
Saturn Business Plan Presentation
Embark on a journey to present your business plan like never before with this stellar presentation template! Perfect for diving deep into key updates, achievements, collaborations, and future goals, it guides your team through essential business strategies and challenges. Compatible with PowerPoint, Keynote, and Google Slides, it offers seamless flexibility and polished professionalism.


6 diapositivas
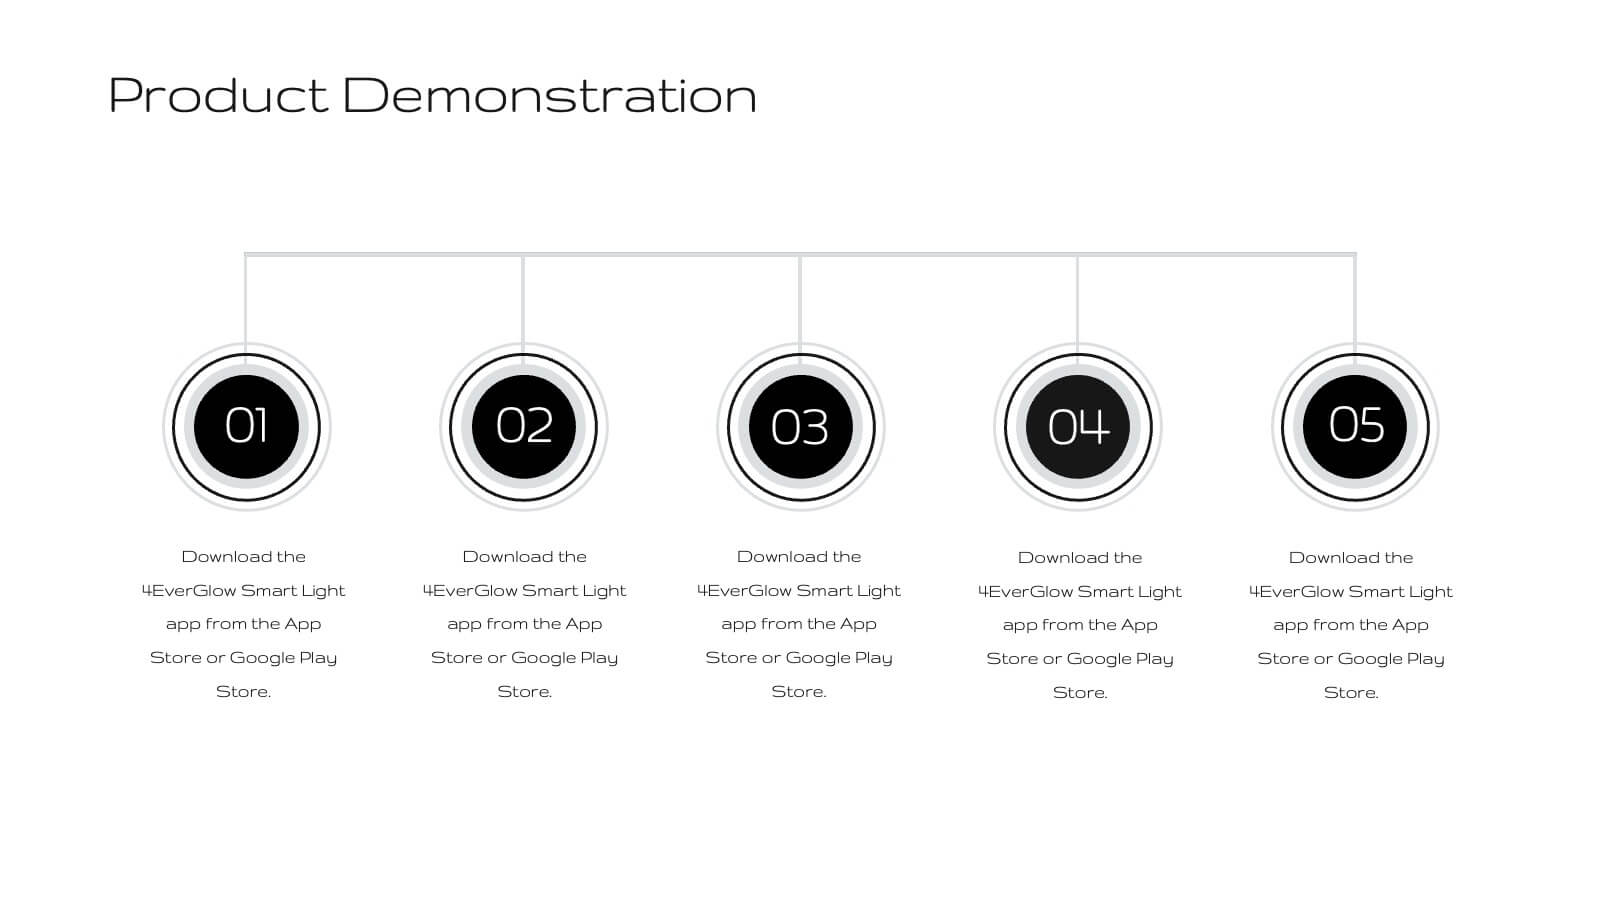
Results & Milestones Shown with Numbers
Track progress and showcase success with the Results & Milestones Shown with Numbers Presentation. This visual timeline highlights five key steps using numbered markers connected by a path—perfect for reporting achievements, product phases, or strategic milestones. Fully editable in PowerPoint, Keynote, and Google Slides.


5 diapositivas
Workplace Safety Guidelines and Protocols Presentation
Prioritize health and hazard awareness with the Workplace Safety Guidelines and Protocols presentation. Featuring a clean visual of a segmented fire extinguisher, this design clearly breaks down safety measures into five customizable steps. Ideal for internal training, HR onboarding, or compliance meetings, each section is paired with editable titles and descriptive placeholders. Communicate procedures like emergency response, equipment use, or safety checklists effectively. Compatible with PowerPoint, Keynote, and Google Slides, this template ensures your team stays informed and aligned.


5 diapositivas
Types of Photography Infographics
There are various types of photography that cater to different subjects, styles, and purposes. These vertical infographics are designed to serve as a comprehensive guide for individuals interested in exploring different genres and styles of photography. These will allow you to provide an overview of different genres and types of photography. They aim to inform viewers about the diverse fields of photography, allowing them to explore various styles and find their areas of interest. Whether used in photography workshops, educational materials, or creative presentations, this template provides valuable insights and inspiration for individuals passionate about the art of photography.
8 diapositivas
Directional Arrow Timeline Flow
Highlight key milestones or project phases with this smooth, flowing arrow timeline layout. Designed for project managers, team leads, and strategists to showcase sequential steps, launch plans, or performance stages. Fully customizable in PowerPoint, Keynote, and Google Slides—change icons, colors, and text to match your brand style.


21 diapositivas
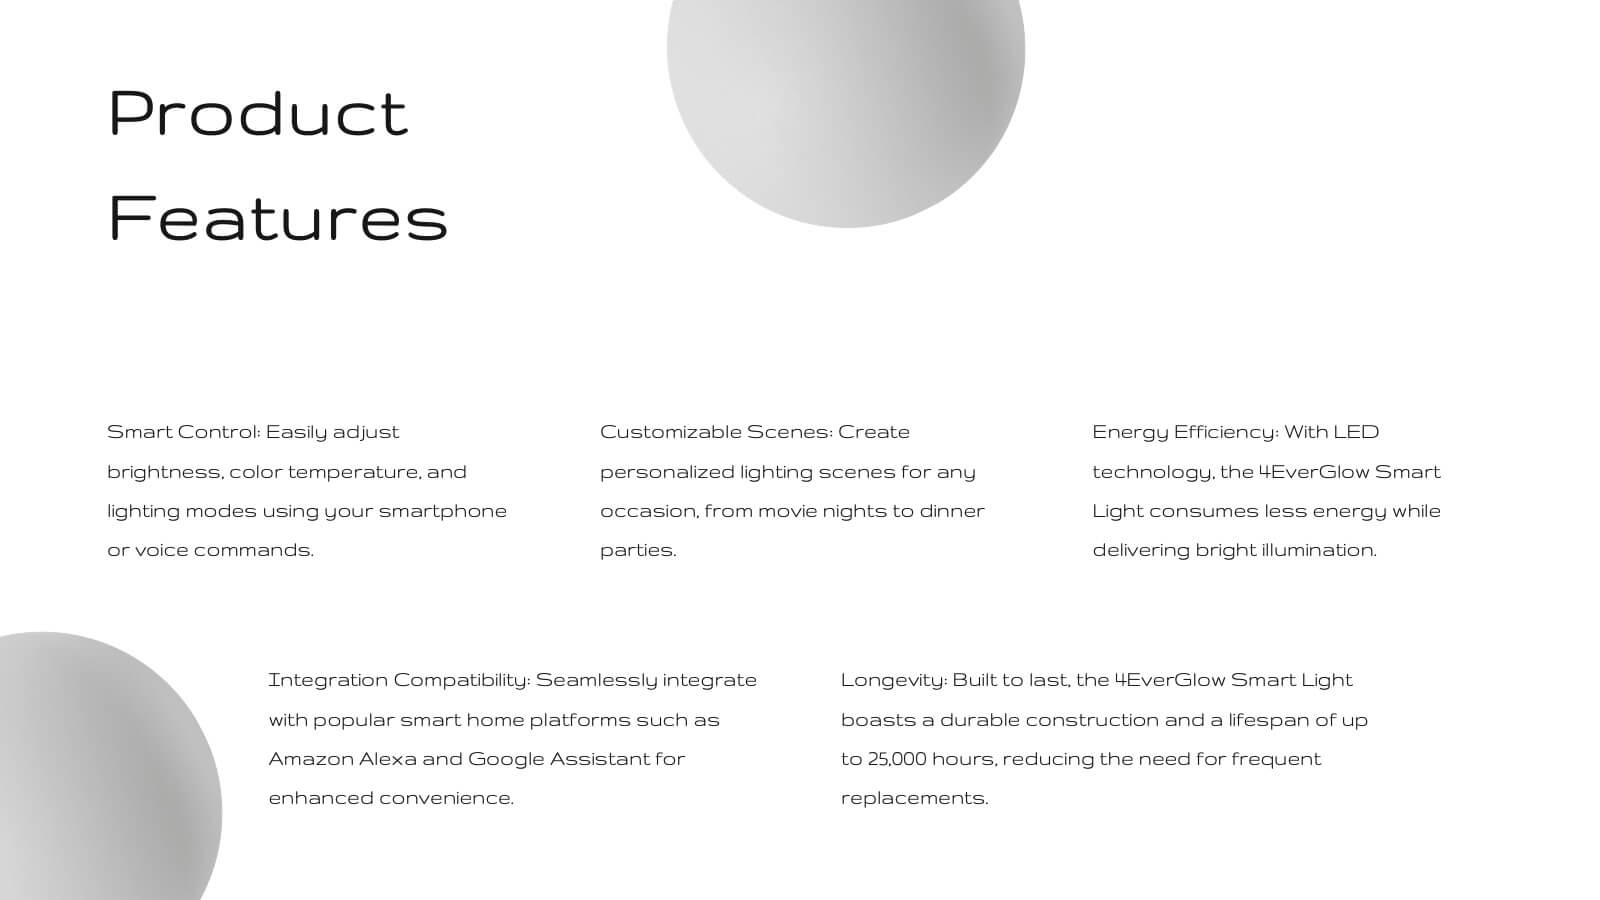
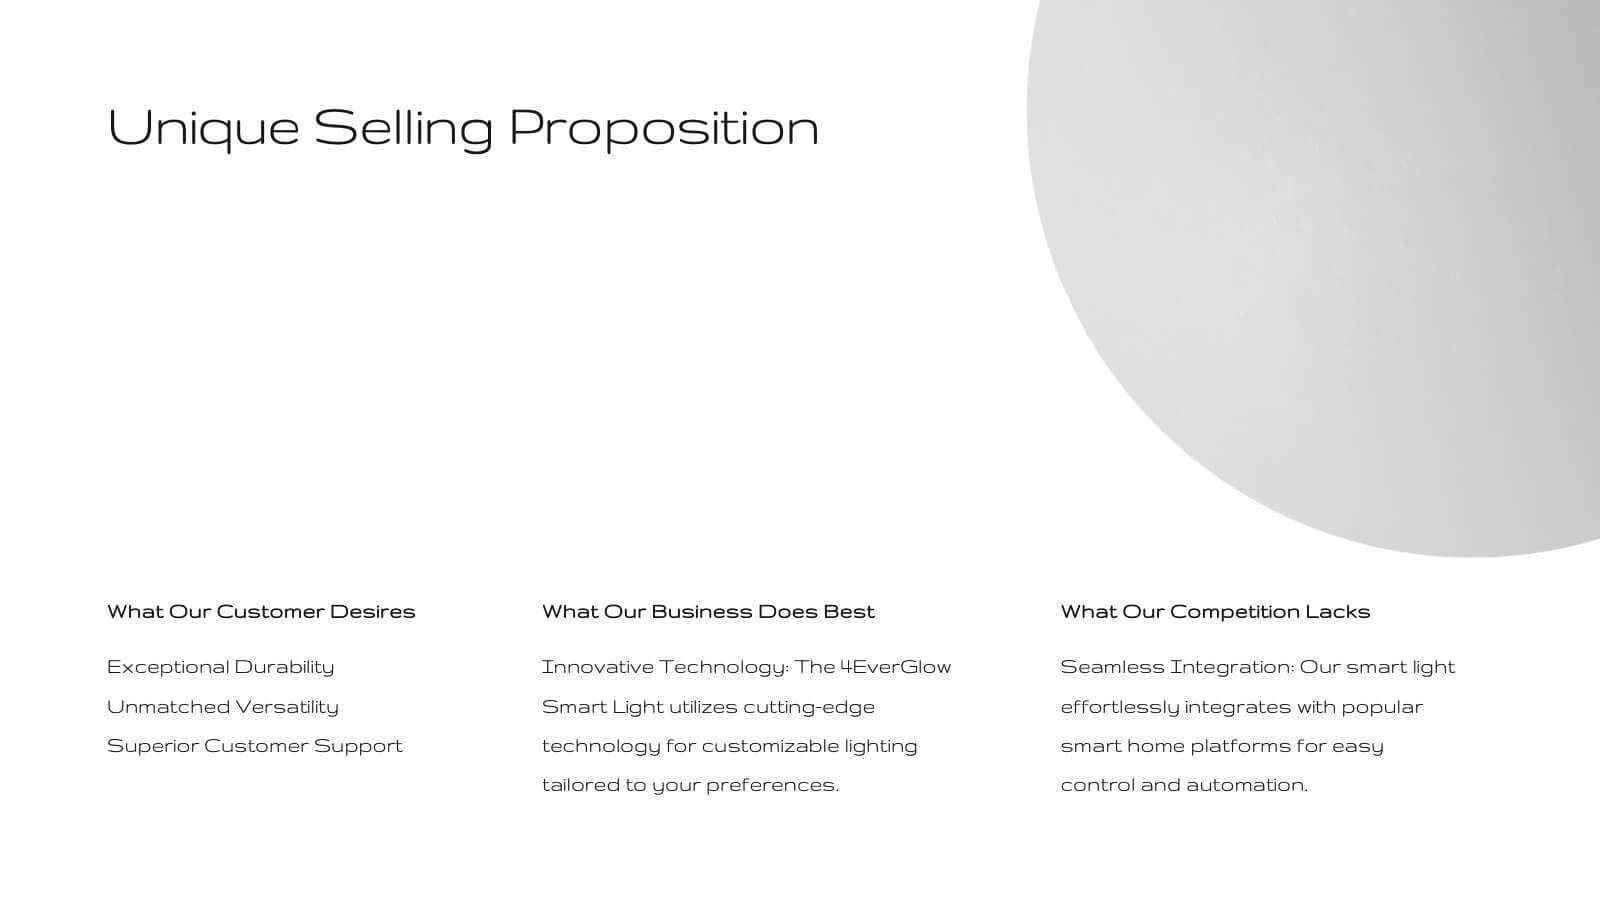
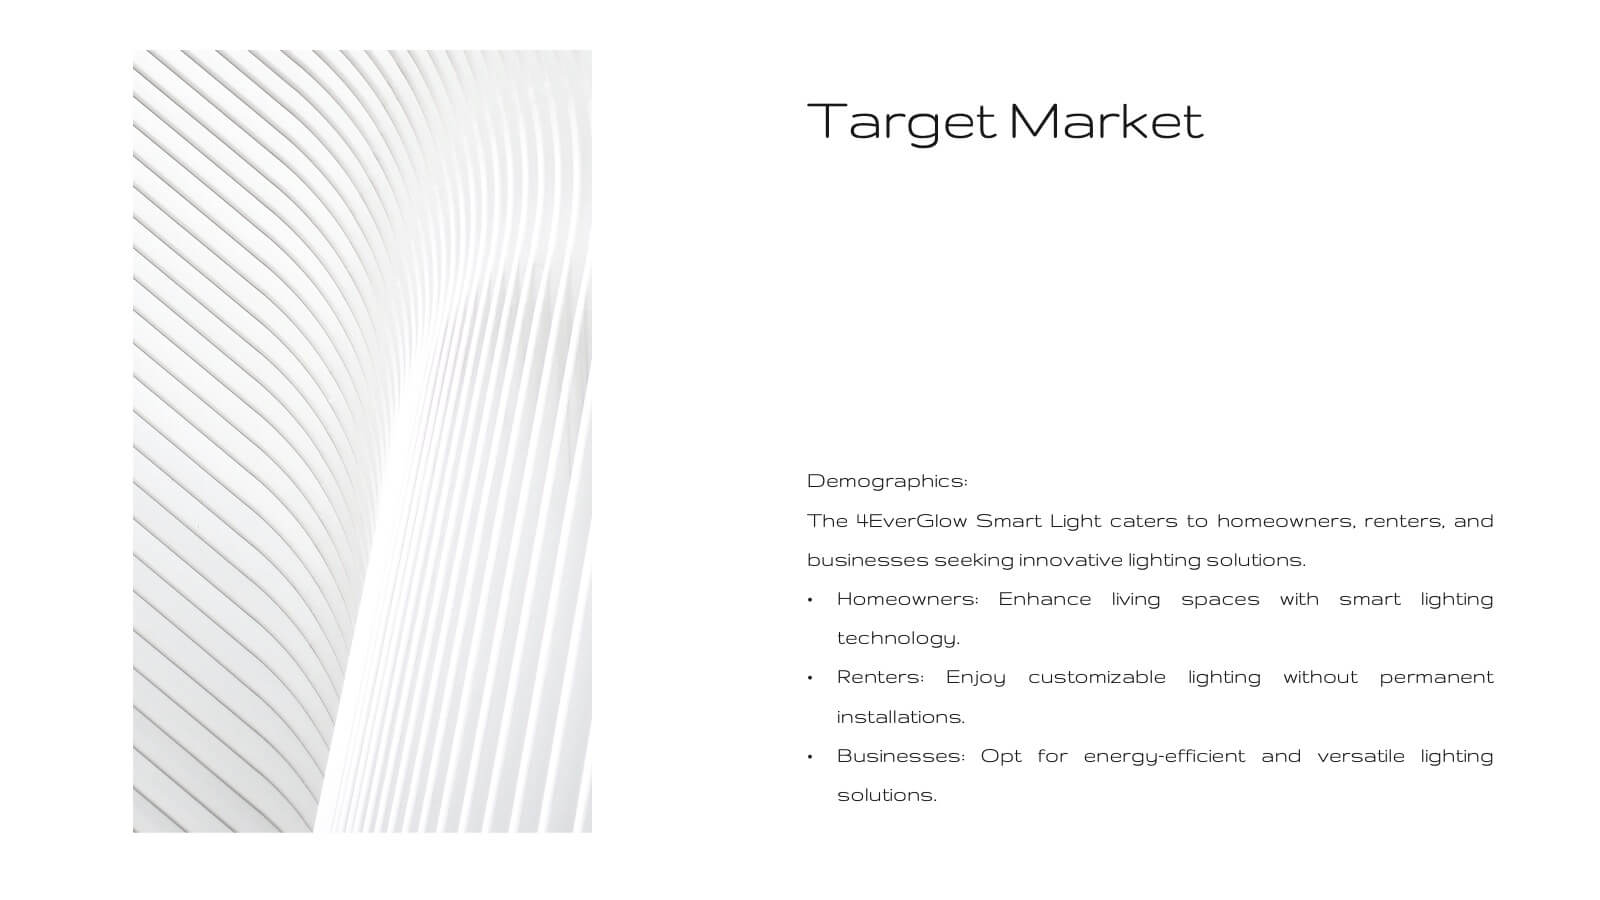
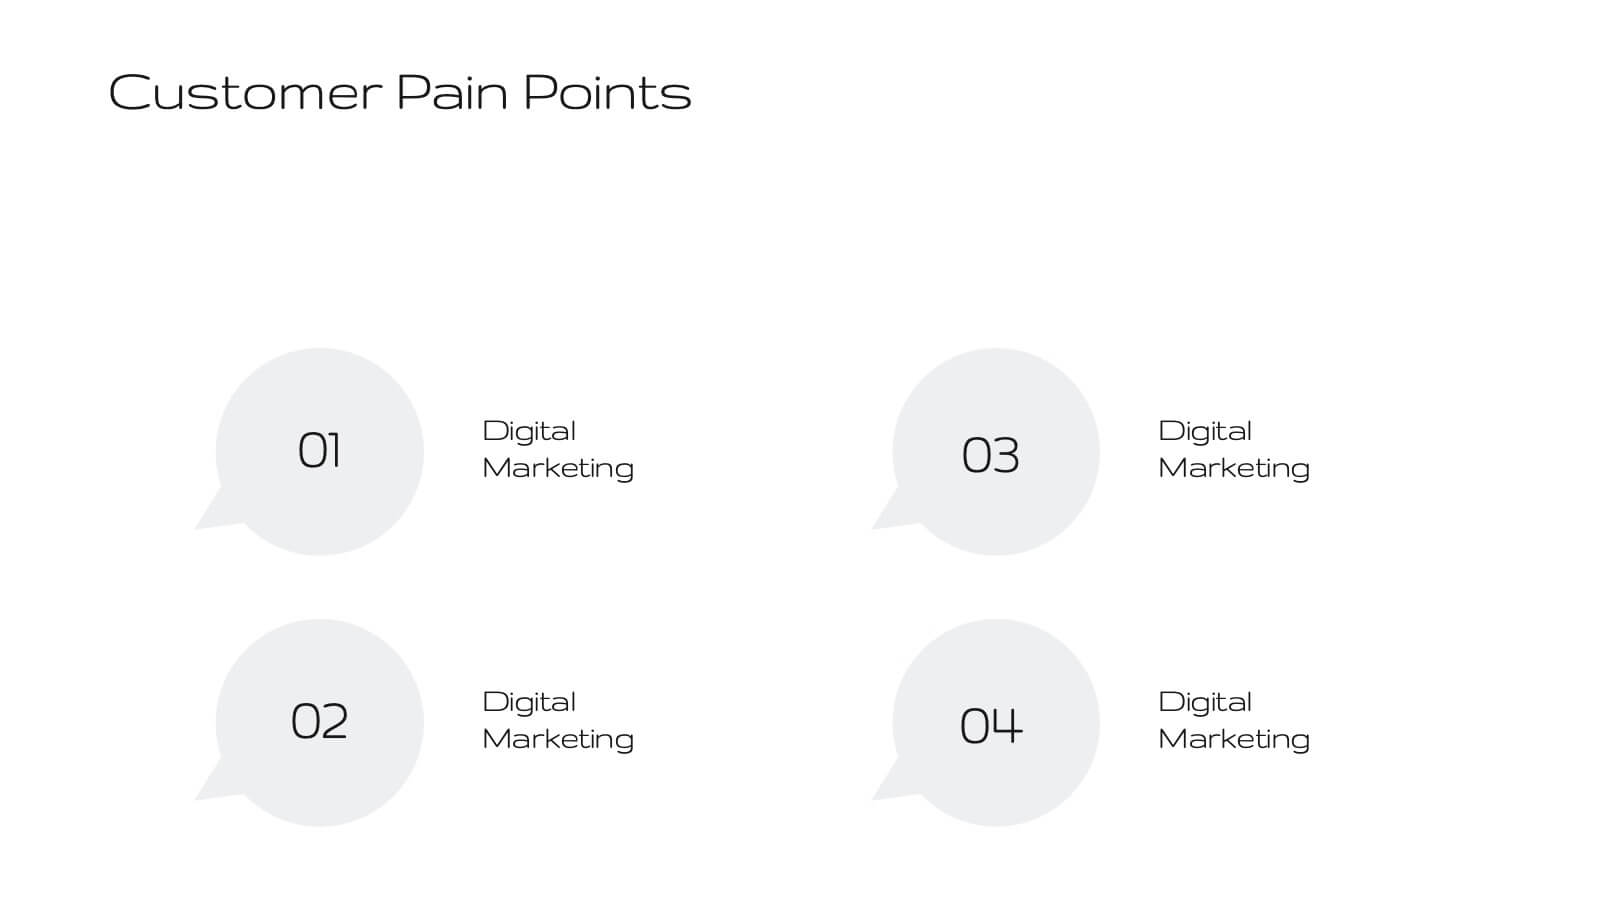
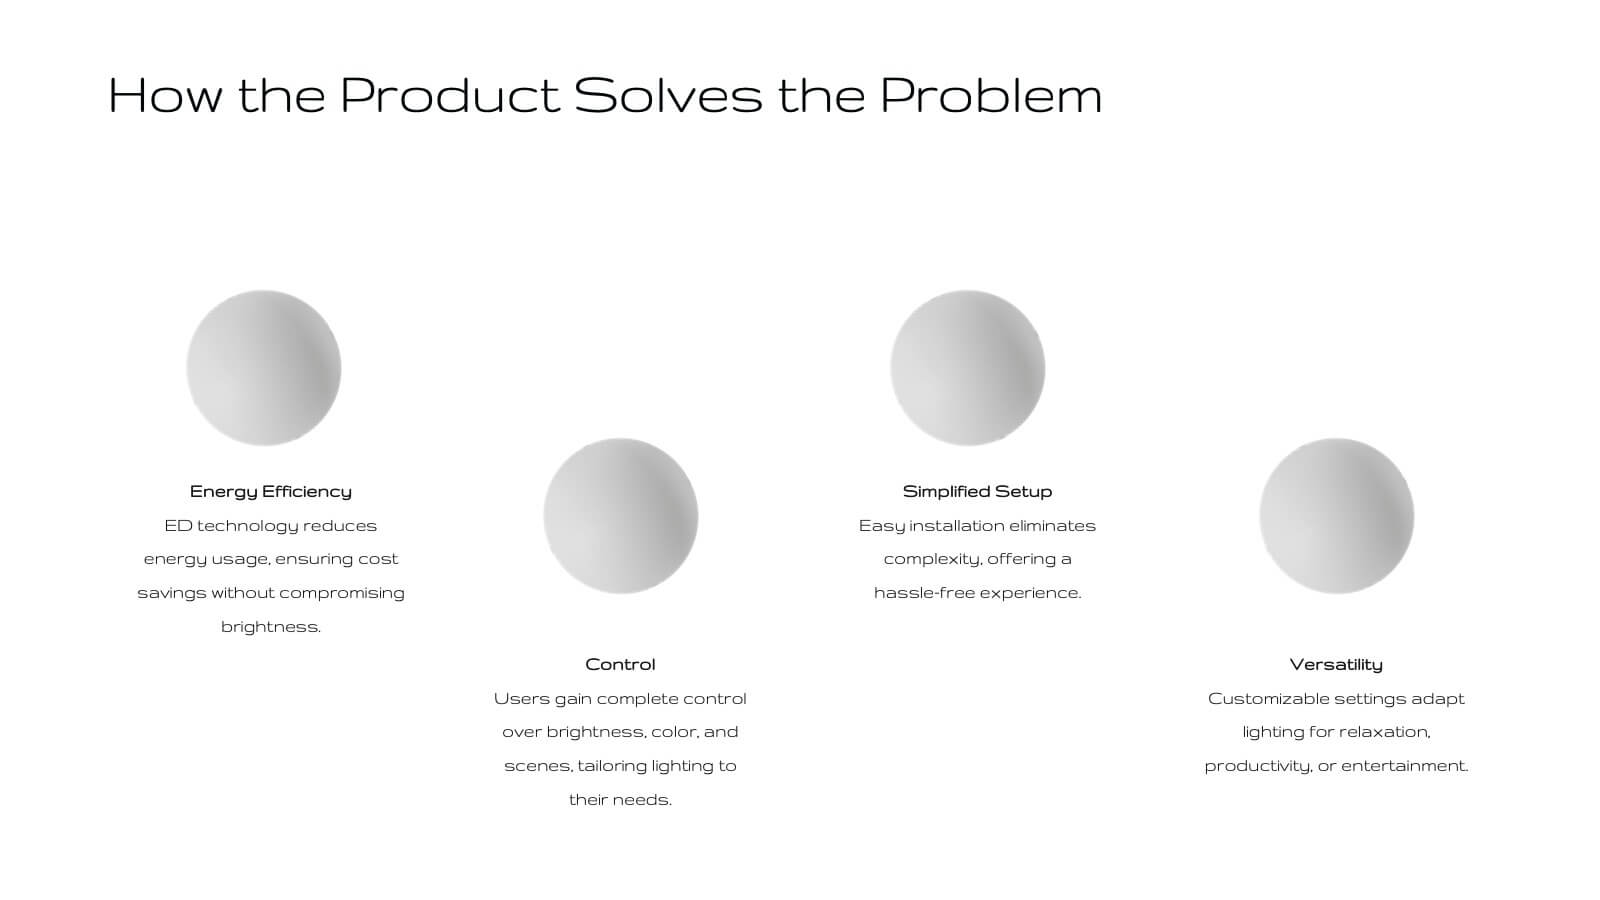
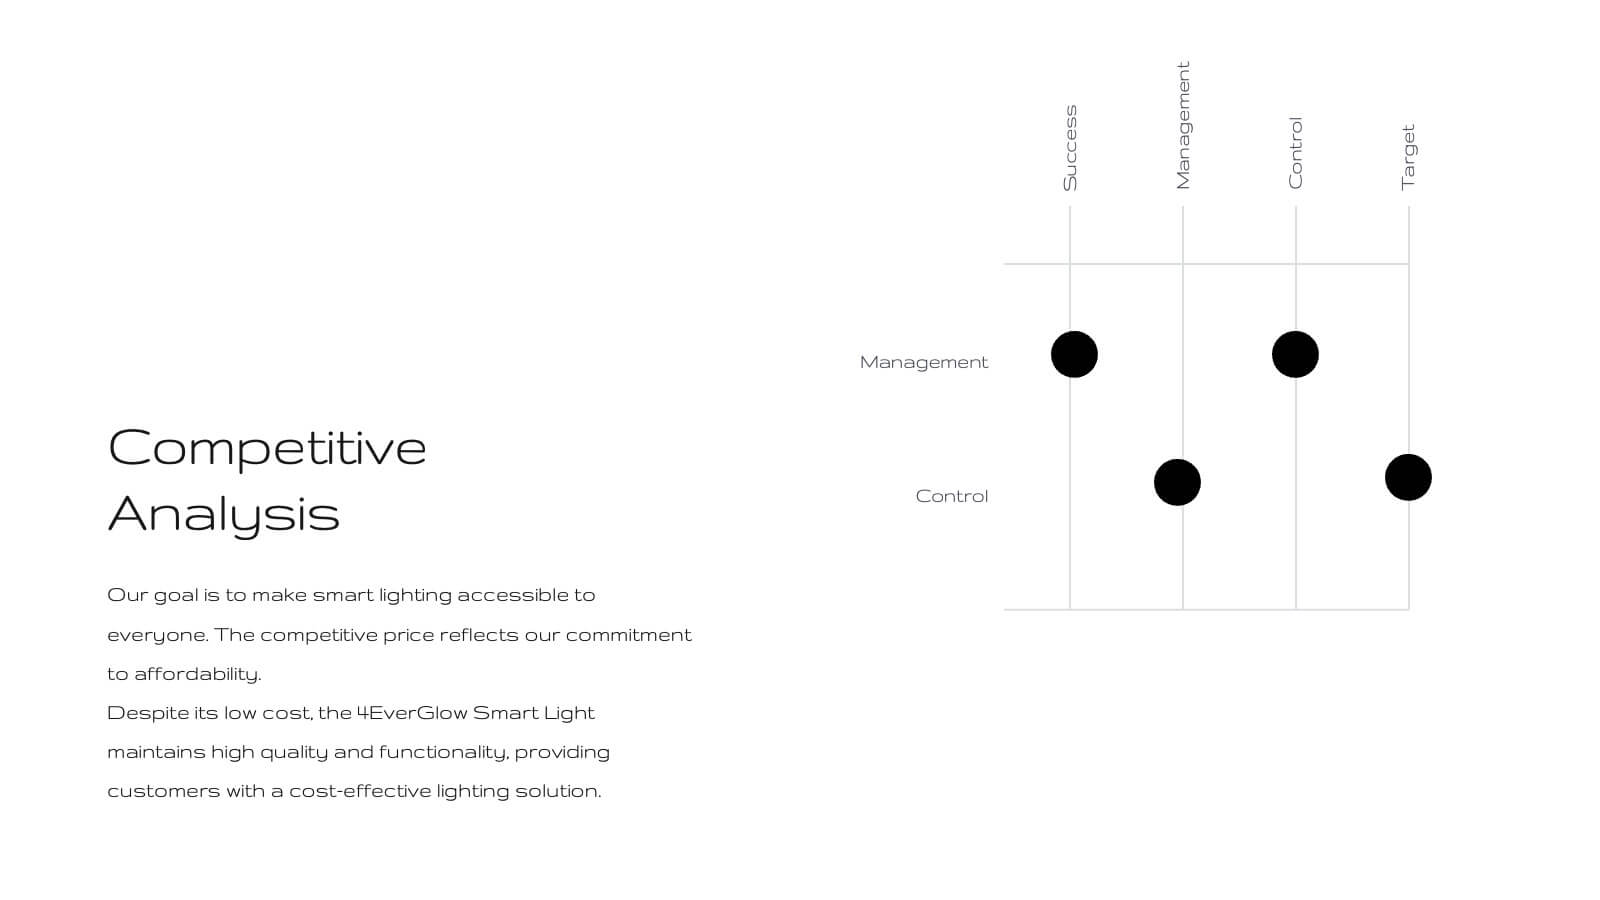
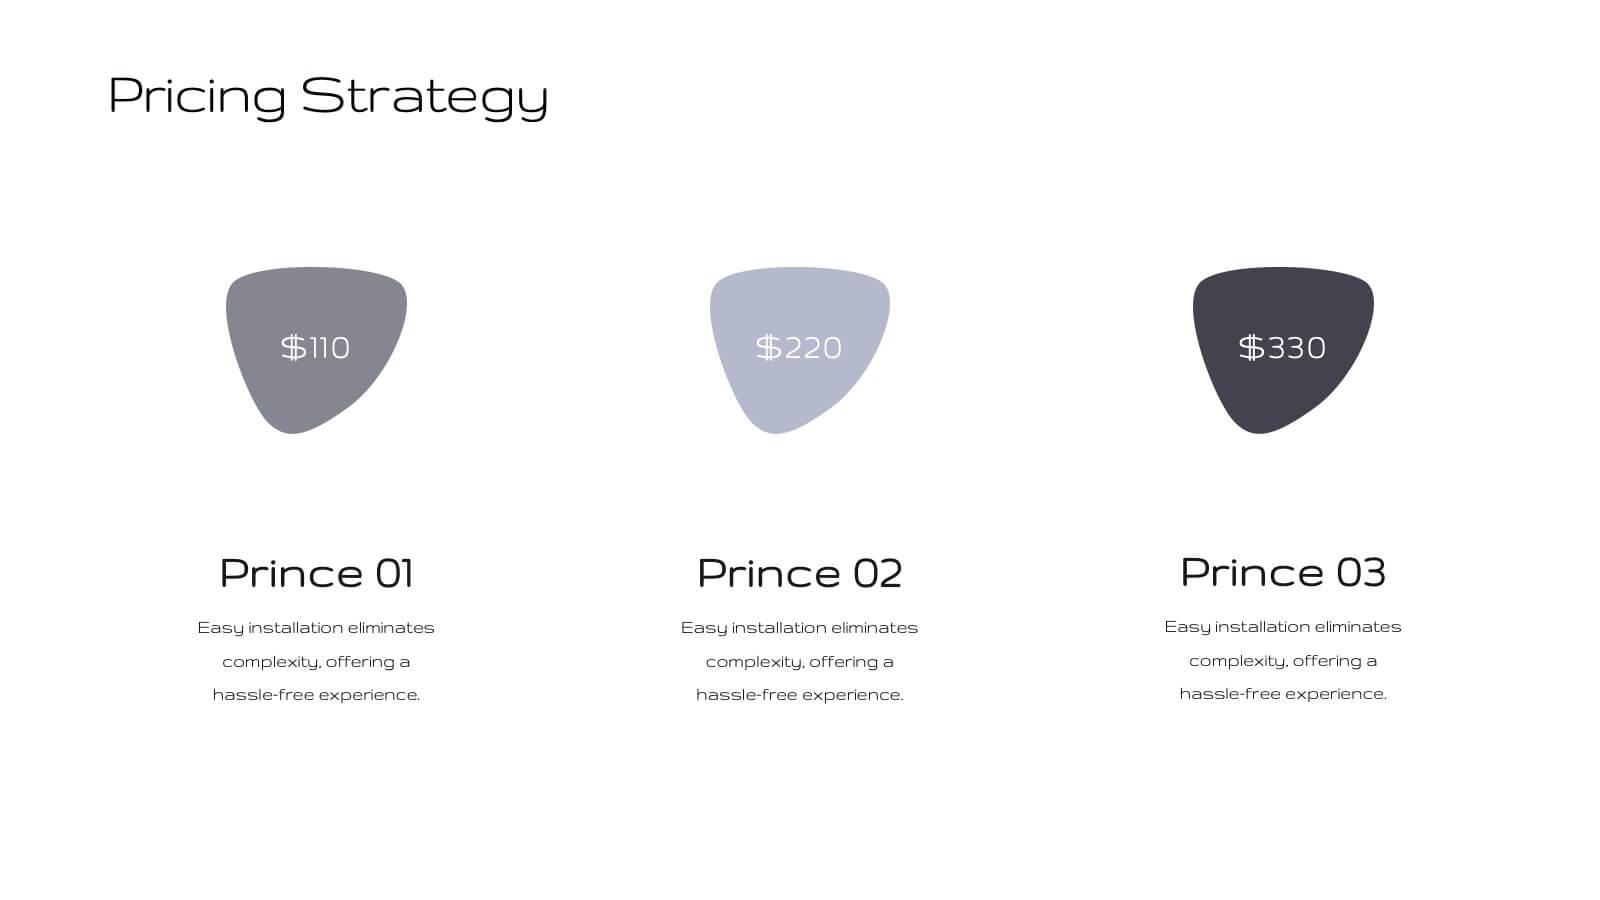
Fortuna Product Development Plan Presentation
Unveil your product's potential with this elegant, minimalist presentation template. Perfect for detailing product development, features, and market strategies, it features a clean design that emphasizes clarity and professionalism. Highlight key aspects like customer pain points, competitive analysis, and pricing strategies to captivate your audience. Compatible with PowerPoint, Keynote, and Google Slides, it ensures seamless presentations on any platform.


8 diapositivas
Success Strategy Triangle Presentation
Craft a winning strategy with the Success Strategy Triangle template. This structured design helps visualize key business components in a step-by-step format, making it ideal for growth planning, decision-making, and performance analysis. Fully customizable and easy to use, it’s compatible with PowerPoint, Keynote, and Google Slides for seamless integration.


5 diapositivas
Workout Motivation Infographics
Finding and maintaining Workout Motivation is a personal journey. These vertical infographics are informative designs that aim to inspire and motivate individuals to maintain an active and healthy lifestyle. This template is perfect for fitness professionals, personal trainers, health coaches, or anyone looking to create engaging content about workout motivation. With its vibrant and dynamic visuals, the template captures the essence of fitness and encourages viewers to embark on their fitness journey. They are designed with eye-catching icons, illustrations, and color schemes that grab attention and make the information easy to understand and remember.


7 diapositivas
Industrial Safety Infographic
Industrial safety, also known as occupational safety, pertains to the management of processes and conditions within industrial settings to ensure the safety, health, and well-being of workers and the general public. This impactful infographic template encapsulates the essentials for fostering a secure and hazard-free industrial environment. Compatible with Powerpoint, Keynote, and Google Slides. The customizable set of icons represents emergency response actions, underlining the need for rapid and efficient responses in critical situations. Build a foundation of safety that fosters a secure and thriving work environment.


6 diapositivas
Data Analysis Statistics Infographic
Data analysis refers to the process of inspecting, cleaning, transforming, and modeling data with the goal of discovering useful information, making informed decisions, and drawing meaningful conclusions. This infographic is an effective way to present complex data and insights in a visually appealing and easily understandable format. The goal of this data analysis Infographic is to make complex data understandable and engaging. By using appropriate visualizations, clear explanations, and an attractive design, you can effectively convey insights to your audience. Compatible with Powerpoint, Keynote, and Google Slides.


7 diapositivas
Transportation & Logistics Infographic PowerPoint Template and Google Slides Theme
A transportation & logistics infographic is a visual representation of information and data related to the movement of goods and people from one place to another. This template can be used to convey complex information about a variety of topics in the transportation and logistics industry. This template includes many graphics, images, and charts to help illustrate your data, and allows you to Input your shipping routes, delivery times, and flow of goods. This template can be used for various purposes, such as educating the public and promoting efficient transportation and logistics practices.


5 diapositivas
Risk Detection Techniques Presentation
Spot potential risks before they escalate with this step-by-step risk detection visual. Featuring ascending block elements and a dynamic layout, this template is ideal for illustrating detection stages or evaluation metrics. Fully editable in PowerPoint, Keynote, and Google Slides—perfect for risk management, audit reports, or compliance presentations.


26 diapositivas
Warm Tones Real Estate Presentation
Create an engaging and inviting Warm Tone Real Estate presentation with this easy to use template. The color scheme of this welcoming template features warm tones to set the mood for a peaceful, natural environment. The cover slide features emerald green and brown, while the next two slides use warmer brown, tan shades, keeping the same theme going. Fully customizable, this template is ready to help you sell and promote properties quickly and easily. This layout is perfect for showcasing properties with a premium feel that’ll inspire confidence in both buyers and sellers alike.


26 diapositivas
Company Profile Simple Duotone Presentation
Introducing our premier company profile presentation template, designed to beautifully encapsulate the essence of your business. Set against a backdrop that transitions from the serene blue sky to a deeper, more intense blue, this template evokes feelings of limitless possibilities and profound depth. This dual-tone theme, with its varying shades of blue, not only emphasizes trust, professionalism, and reliability but also creates an atmosphere of calm and stability, essential attributes for showcasing your company's strengths and accomplishments. Modern in its layout, our template facilitates a structured presentation of your company's history, mission, achievements, and future aspirations. The design intricately merges the visuals of the expansive sky with the profound depth of the darker hue, creating a narrative that speaks of a firm foundation with an eye on soaring to new heights. Perfectly compatible with both PowerPoint and Google Slides, this template offers ease of customization. Whether it's adjusting the content to fit your corporate story or tweaking the design elements, this template offers flexibility and user-friendliness. Dive deep into your company's journey and aspirations with this exquisite blue-themed template. It's not just a presentation; it's a reflection of your company's ethos and vision. Utilize this template to give stakeholders, partners, and employees a p....


10 diapositivas
Customer Survey Feedback Insights Presentation
Highlight key takeaways from your reviews with the Customer Survey Feedback Insights Presentation. This sleek layout uses a vertical timeline with icons and star ratings to present customer input clearly and professionally. Ideal for showcasing survey results, testimonials, or product improvement insights. Fully editable in Canva, PowerPoint, Google Slides, and Keynote.