


Características


¿Tienes alguna pregunta?
Recomendar


6 diapositivas
Corporate Vision and Mission Presentation
Present your company’s purpose with clarity using this Corporate Vision and Mission Presentation. Featuring modern visuals, bold typography, and image placeholders, this layout highlights your strategic goals effectively. Perfect for company profiles, startup decks, or internal briefings. Fully editable in PowerPoint, Keynote, and Google Slides for seamless customization.


12 diapositivas
Milestone Achievement Progress Map Presentation
Visualize progress with clarity using this dynamic Milestone Achievement Progress Map. Each slide combines bar charts and upward arrows to showcase key accomplishments, performance phases, or goal tracking. With three customizable titles and color-coded segments, this layout is perfect for project updates, strategy reviews, or performance recaps. Fully editable in PowerPoint, Keynote, and Google Slides.


5 diapositivas
Business Innovations Strategy Presentation
Bring your next big idea to life with this modern, visually engaging presentation. Perfect for showcasing creative strategies, innovation frameworks, and growth opportunities, it helps you present your concepts with clarity and flow. Fully customizable and compatible with PowerPoint, Keynote, and Google Slides for a smooth professional experience.


7 diapositivas
Sports Bases Infographic
Step up your game with our sports bases infographic! Designed to captivate sports enthusiasts, coaches, trainers, and educators, this vibrant infographic illuminates the aspects of various sports disciplines. With a crisp blue backdrop coupled with dynamic shades of blue and an array of sporty colors, it provides a visual sprint through the key bases of multiple sports. Ideal for coaches aiming to provide a overview to their teams, or educators introducing students to the fundamentals of sports. Compatible with PowerPoint, Keynote, and Google Slides, you can seamlessly integrate it into your presentations and captivate your audience with a sporty edge.


6 diapositivas
Six Sigma Certification Infographics
Explore the world of Six Sigma Certification with our customizable infographic template. This template is fully compatible with popular presentation software like PowerPoint, Keynote, and Google Slides, allowing you to easily customize it to illustrate and communicate various aspects of Six Sigma certification and its benefits. The Six Sigma Certification infographic template offers a visually engaging platform to outline the different levels of certification, the DMAIC methodology, and the impact of Six Sigma on quality improvement within organizations. Whether you're a quality professional, project manager, or someone looking to enhance your process improvement skills, this template provides a user-friendly canvas to create informative presentations and educational materials. Deepen your knowledge of Six Sigma Certification with this SEO-optimized infographic template, thoughtfully designed for clarity and ease of use. Customize it to showcase the certification requirements, training options, project success stories, and the potential for career advancement, ensuring that your audience gains valuable insights into the world of Six Sigma. Start crafting your personalized infographic today to explore the realm of Six Sigma Certification.


4 diapositivas
Mental Health Awareness Presentation
Bright visuals meet deep meaning in this engaging slide, designed to spotlight key facts and insights. This template helps present vital information on emotional well-being, stigma reduction, and support strategies with clarity and empathy. Fully editable and easy to use in PowerPoint, Keynote, and Google Slides for seamless presentation delivery.
7 diapositivas
Project Status Tracking Infographic
For any project manager or team leader, tracking the progress and status of projects is paramount. This project status tracking infographic simplifies this task, offering a visually appealing representation of every project phase. With a predominant palette of white and blue, this design captures attention and imparts clarity. Tailored for project managers, stakeholders, and team members, this infographic acts as a dynamic snapshot of ongoing tasks, completed milestones, and impending deadlines. Designed for seamless use with PowerPoint, Keynote, and Google Slides, it's your ultimate tool for effective project communication.


7 diapositivas
SEO Agency Infographic
A Search Engine Optimization (SEO) agency is a company or organization that provides specialized services aimed at improving a website's visibility in search engines like Google, Bing, and Yahoo. The primary goal of this infographic is to help businesses increase their online presence and drive more organic traffic to their website, ultimately leading to higher visibility, increased website visitors, and potential customers. Compatible with Powerpoint, Keynote, and Google Slides. This vibrant, energetic template is tailor-made for the modern-day digital warrior, ready to conquer the realm of online visibility.
22 diapositivas
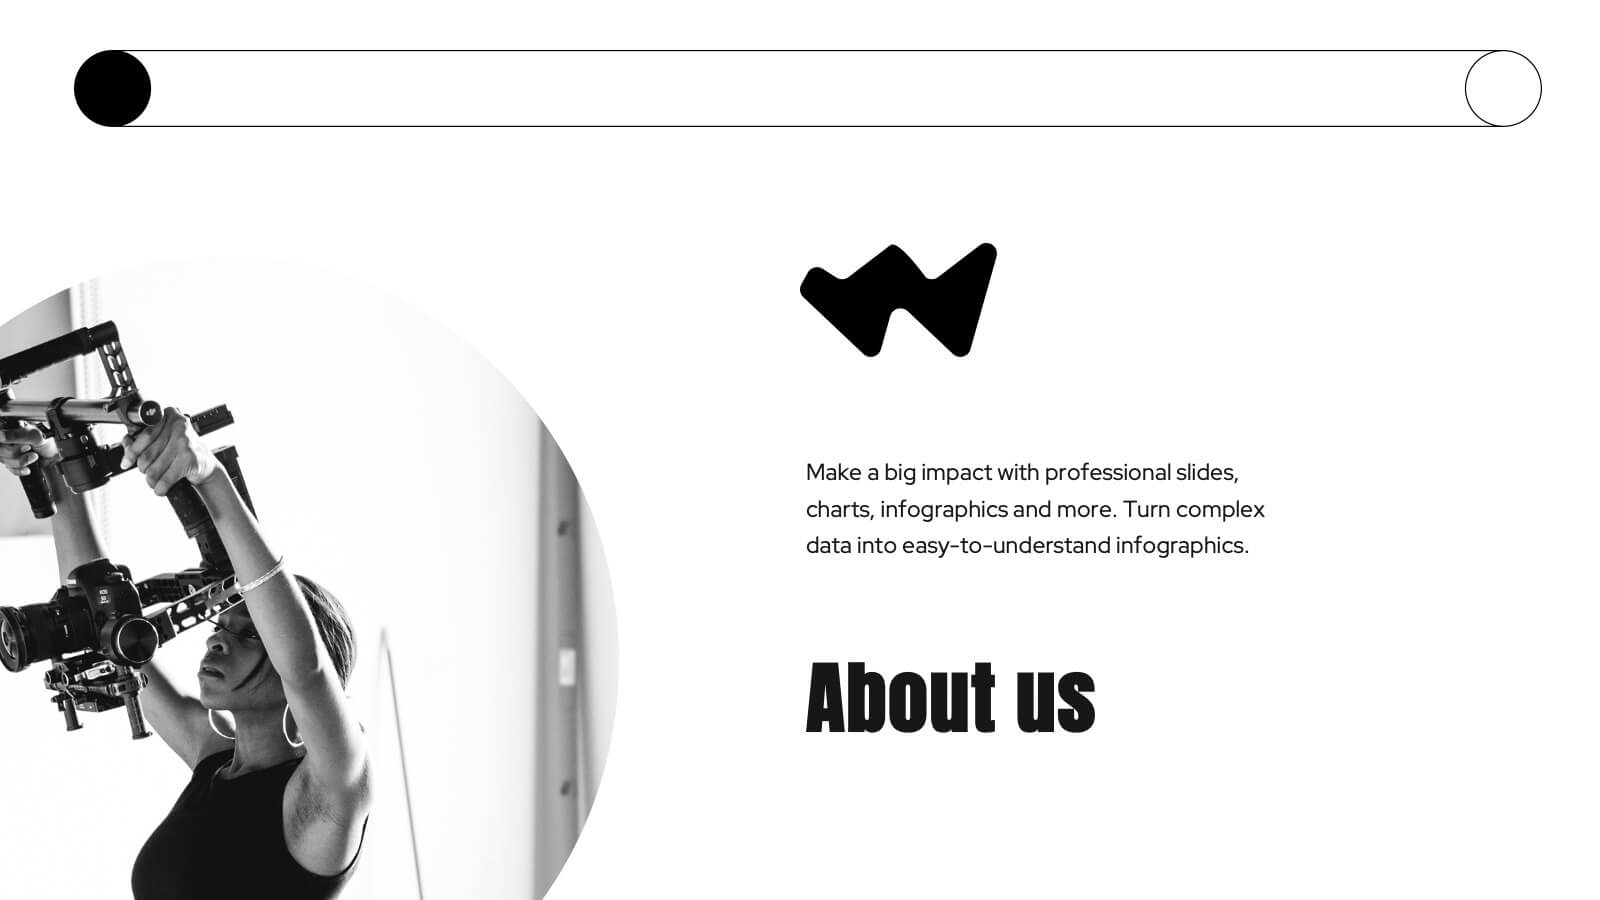
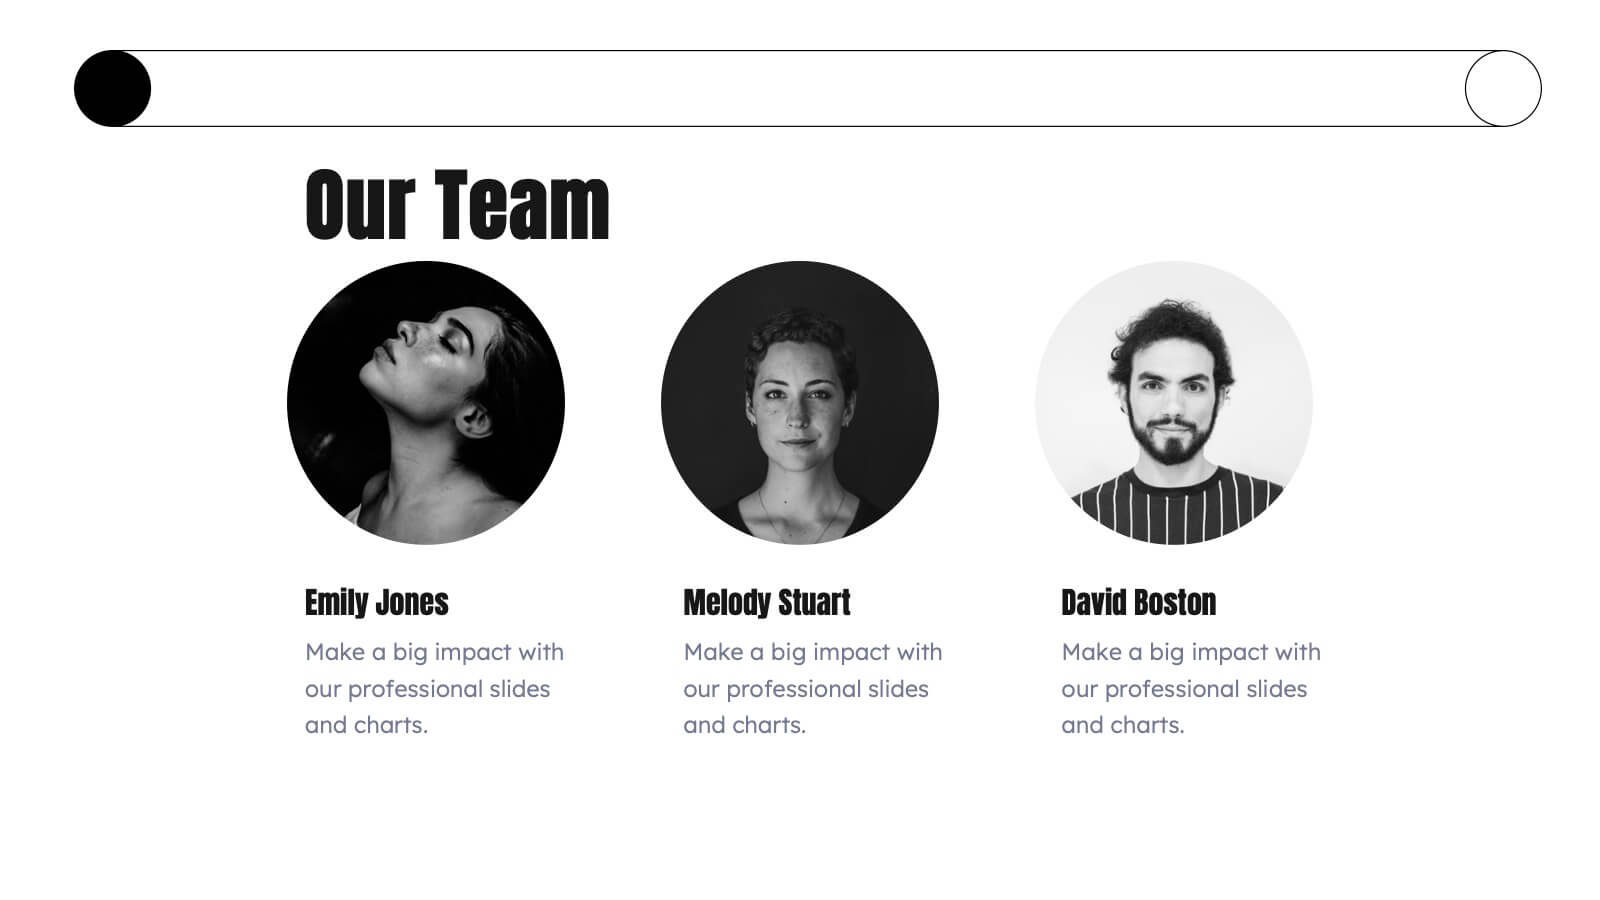
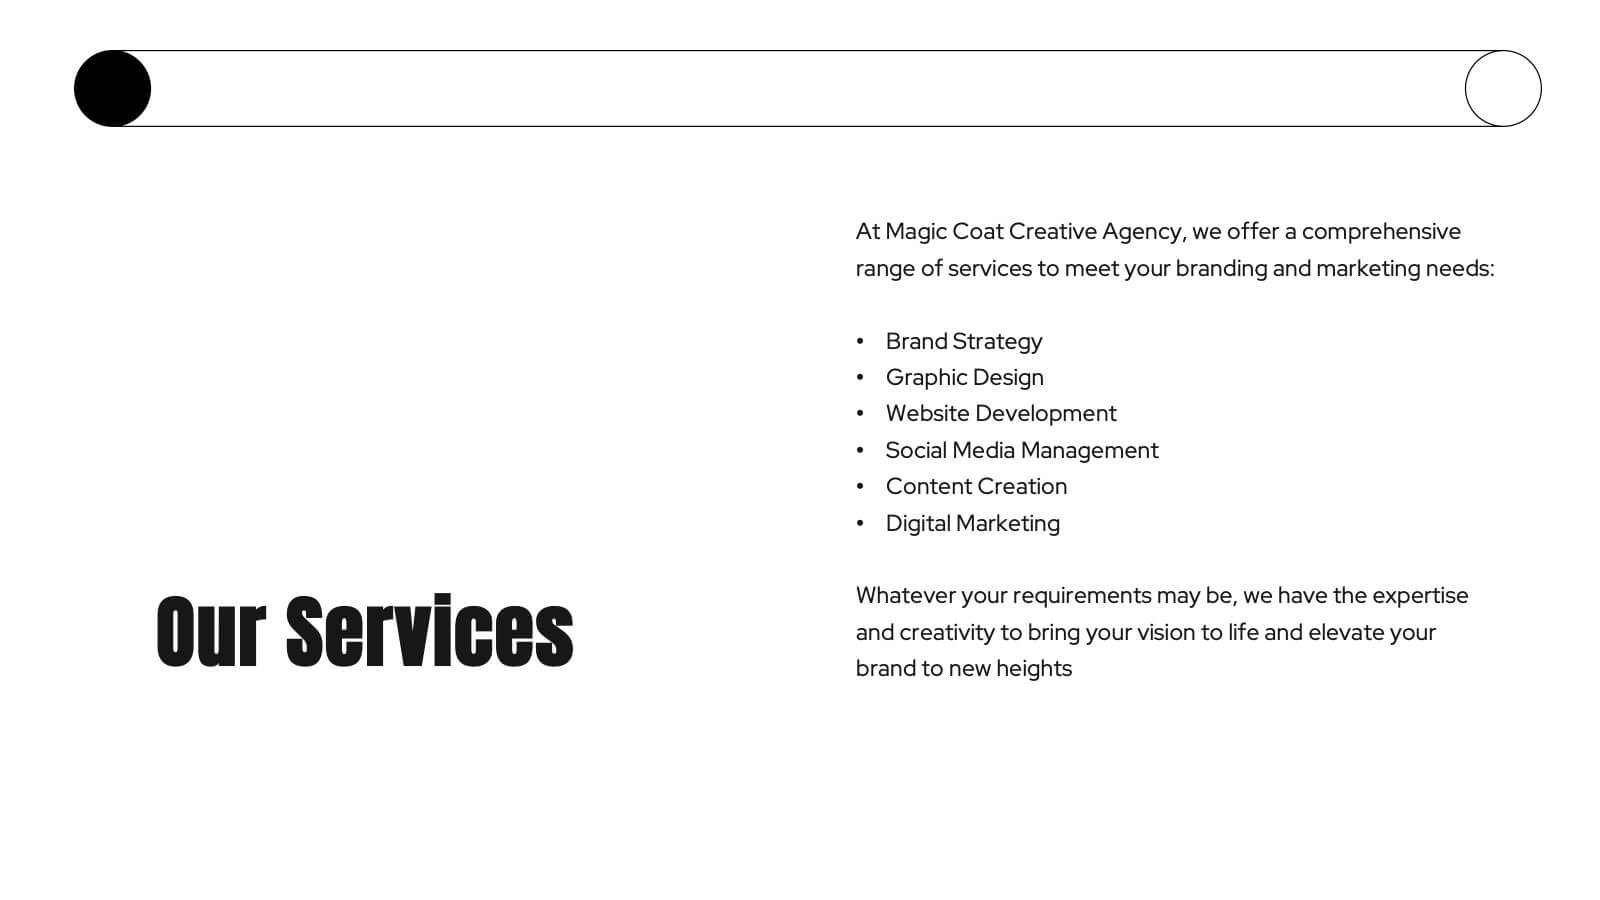
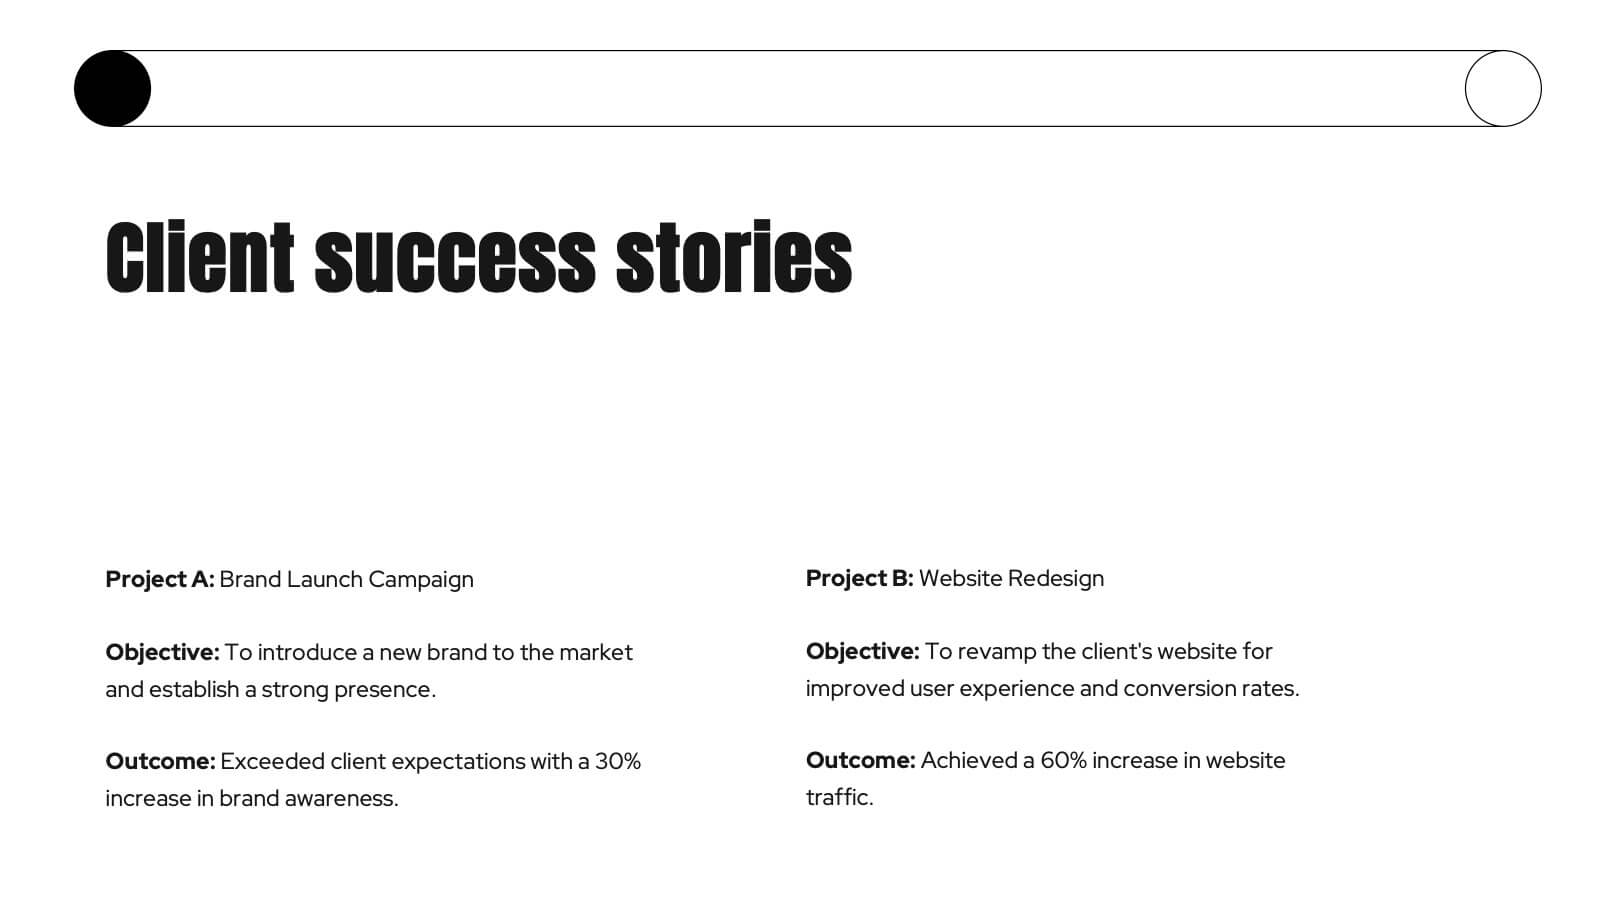
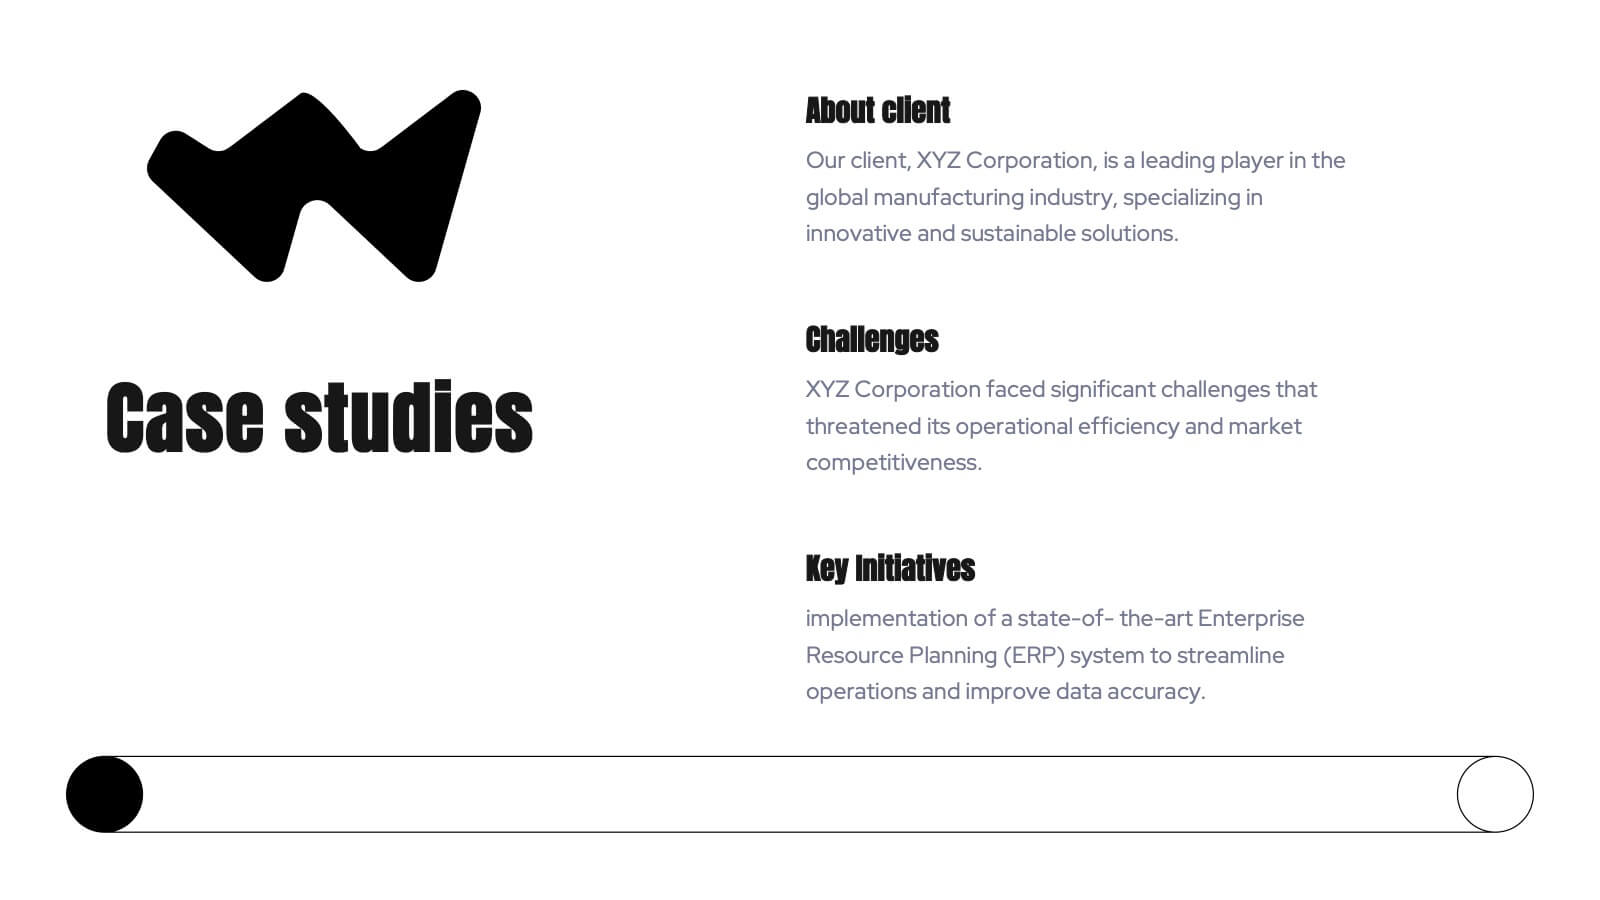
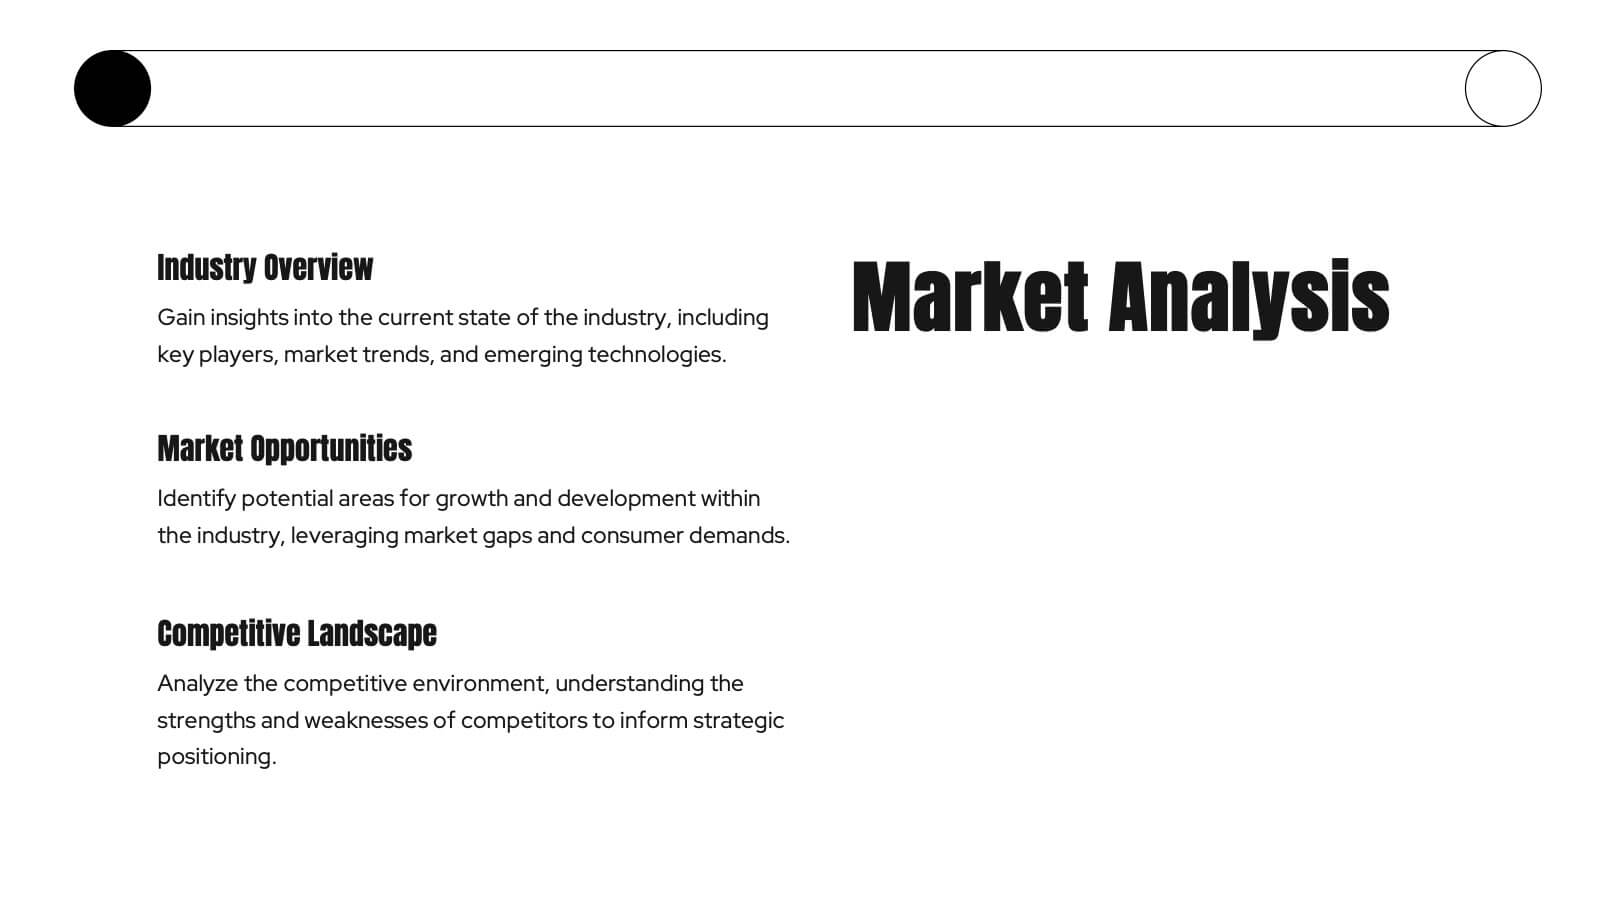
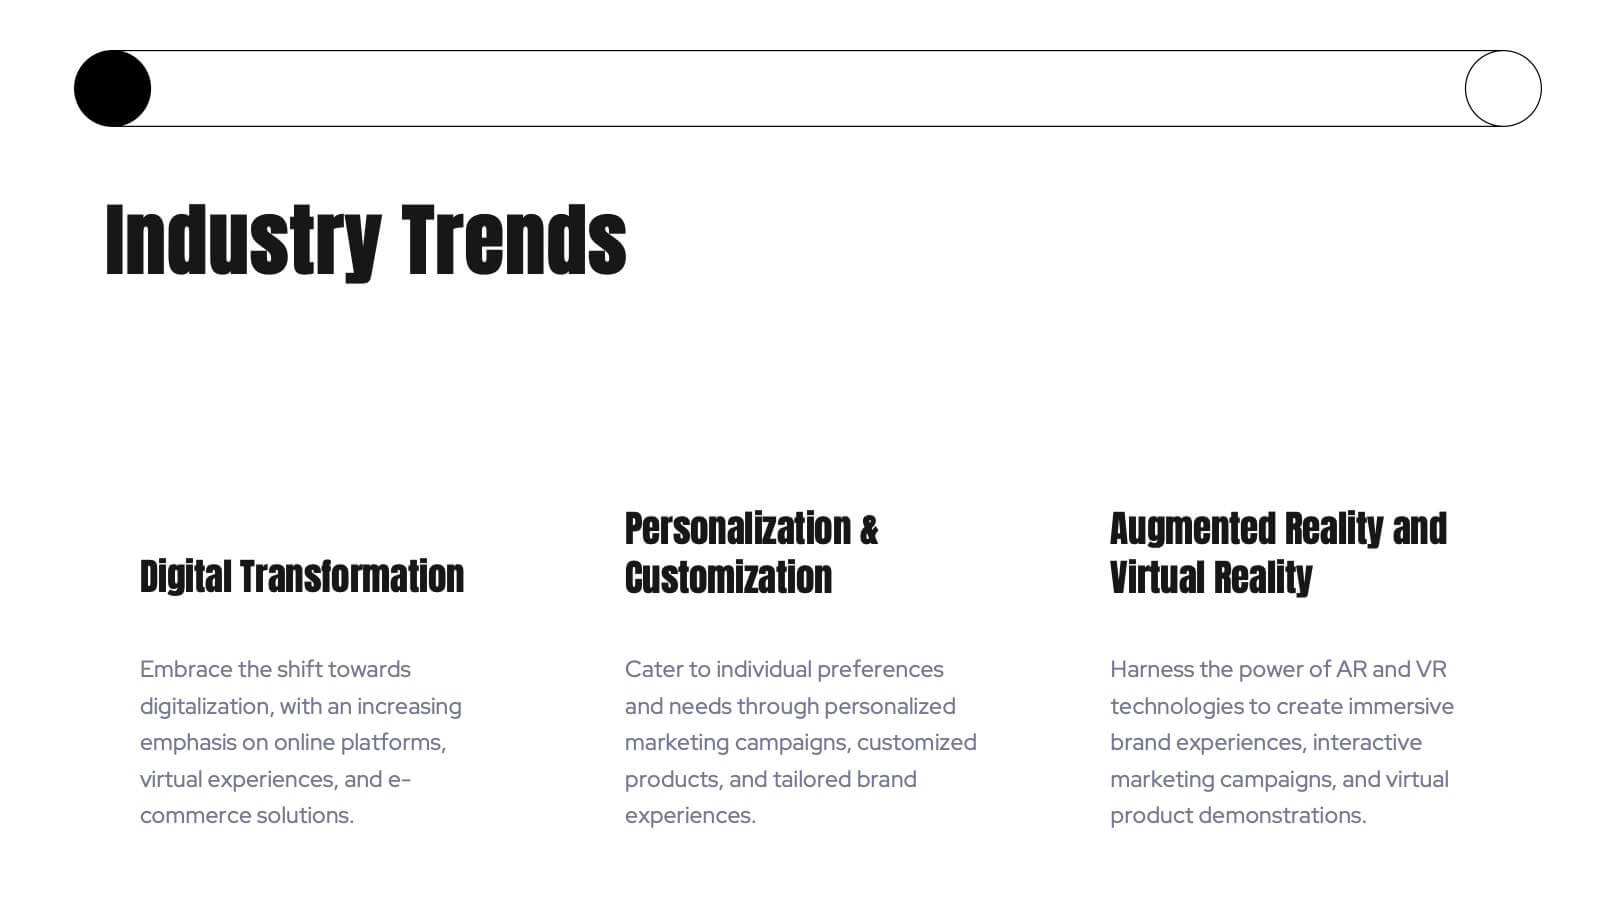
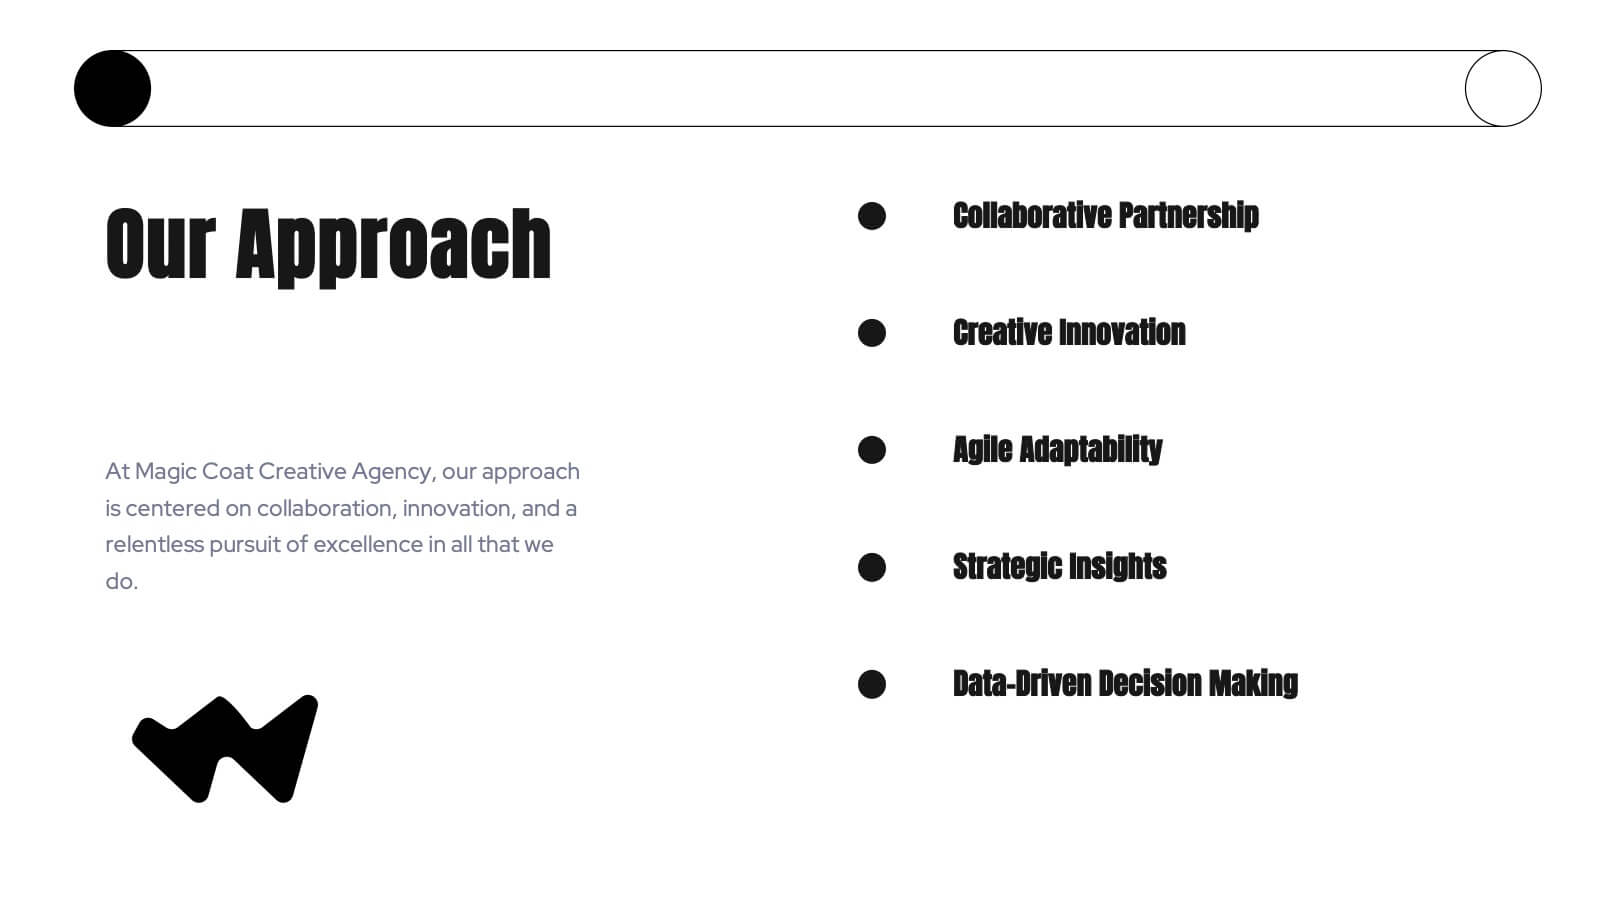
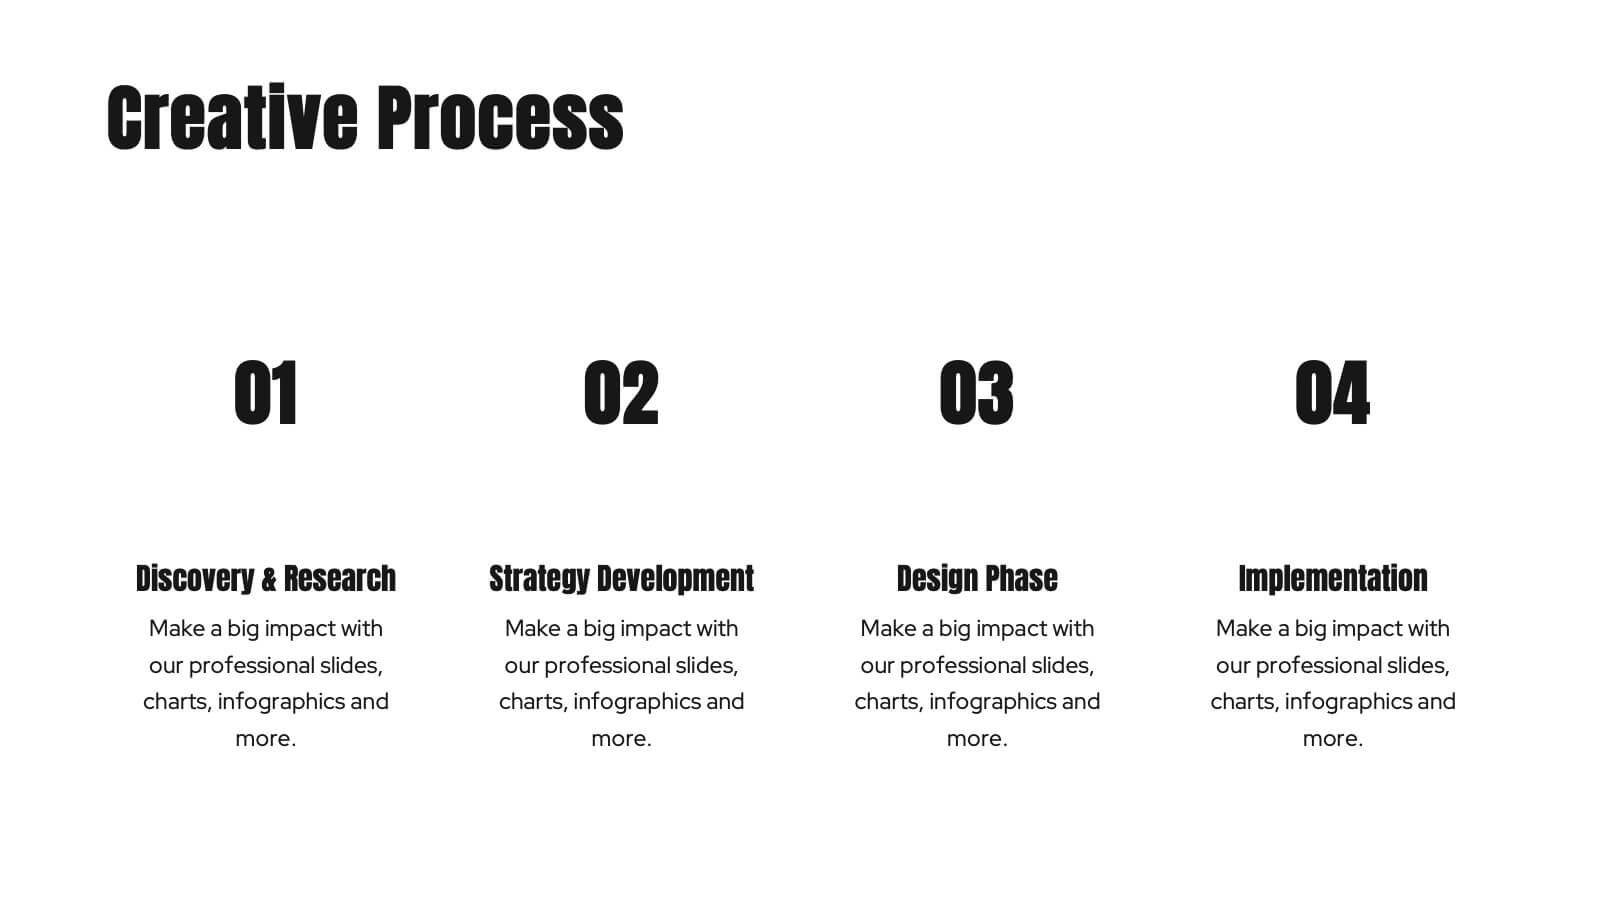
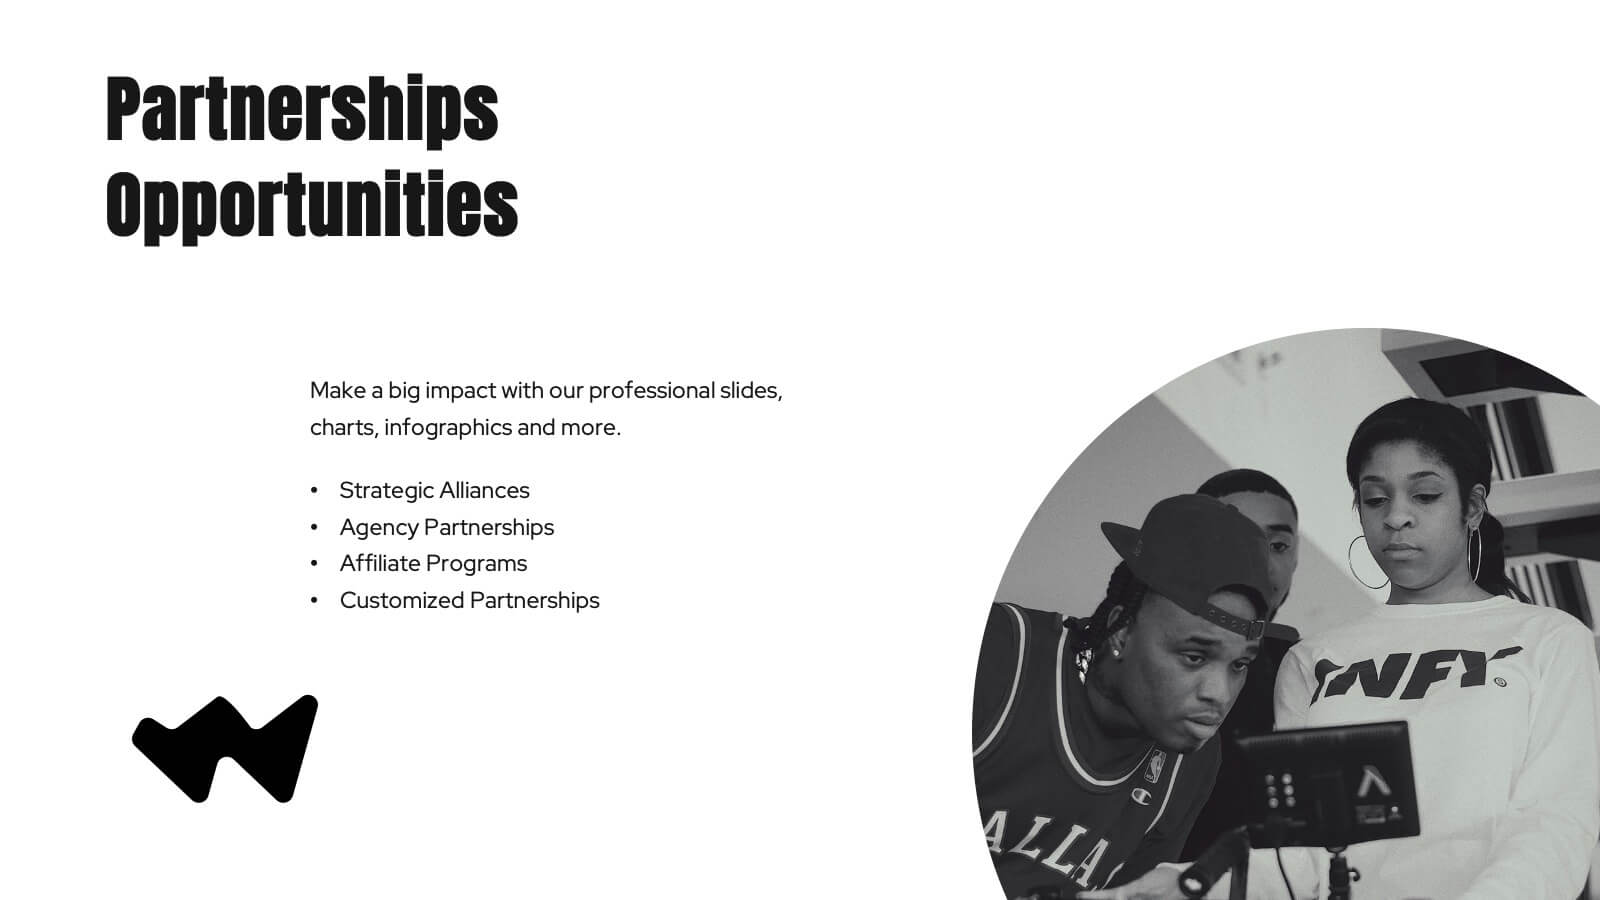
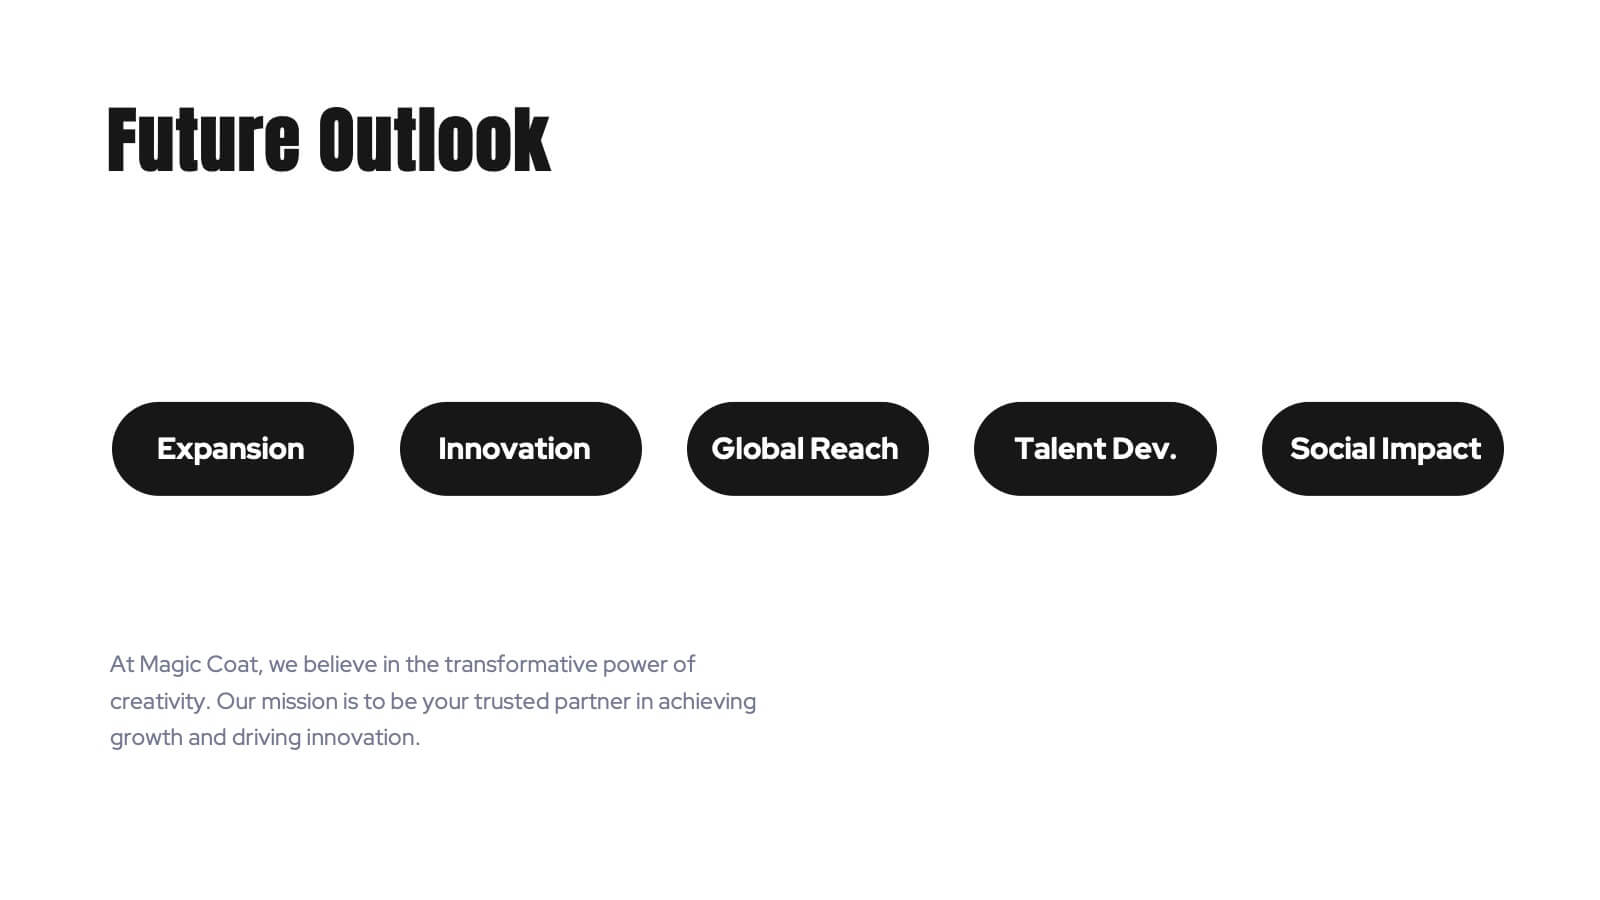
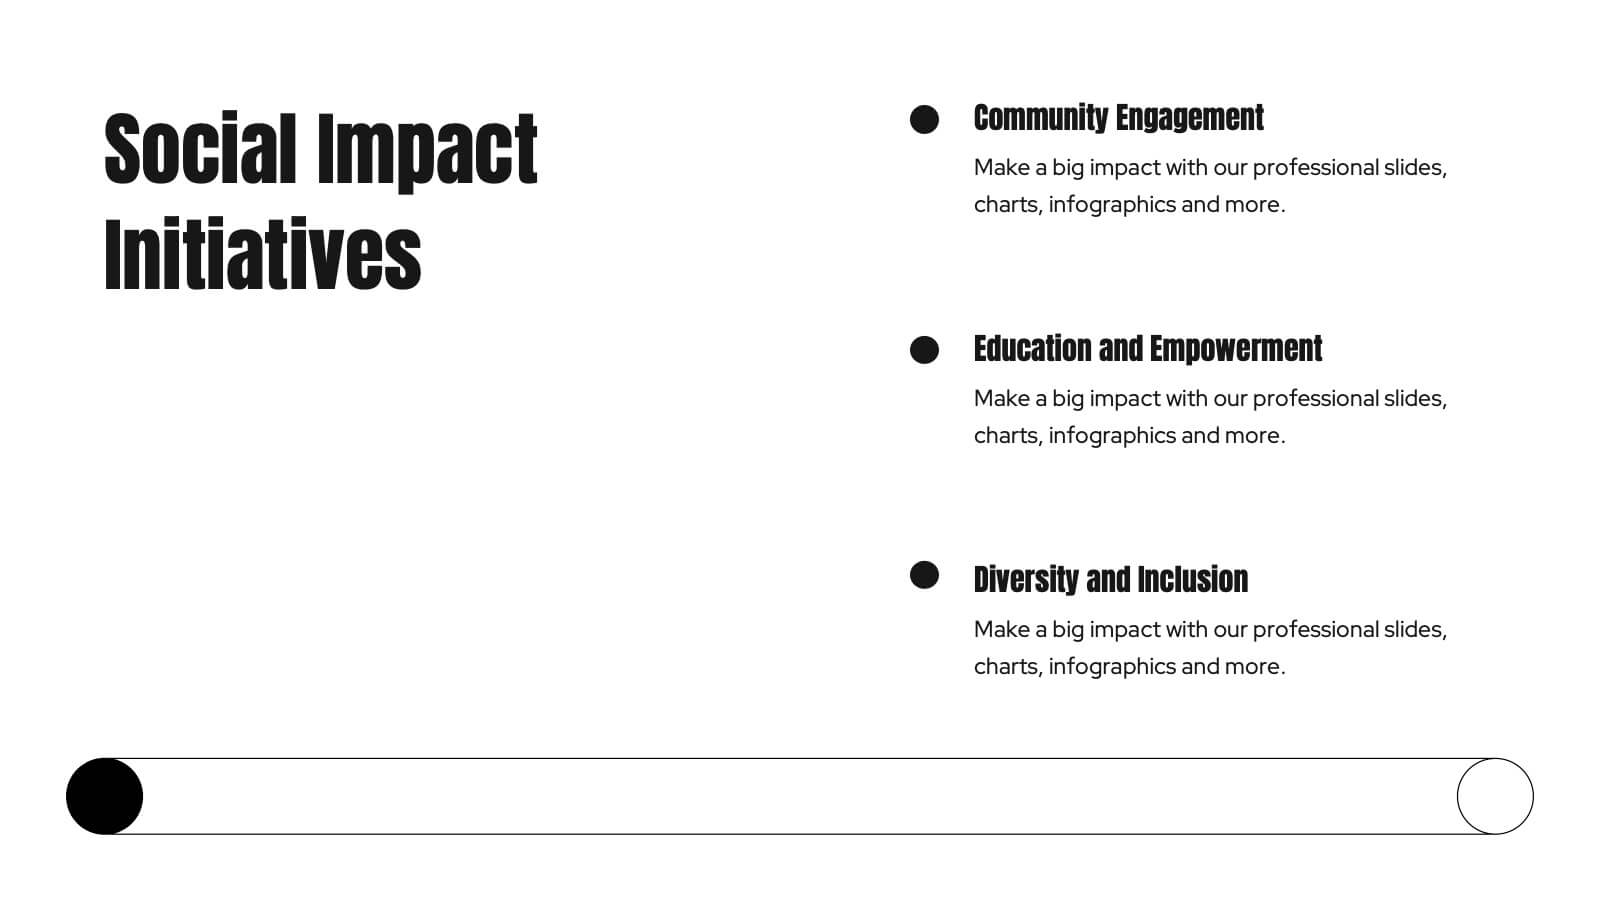
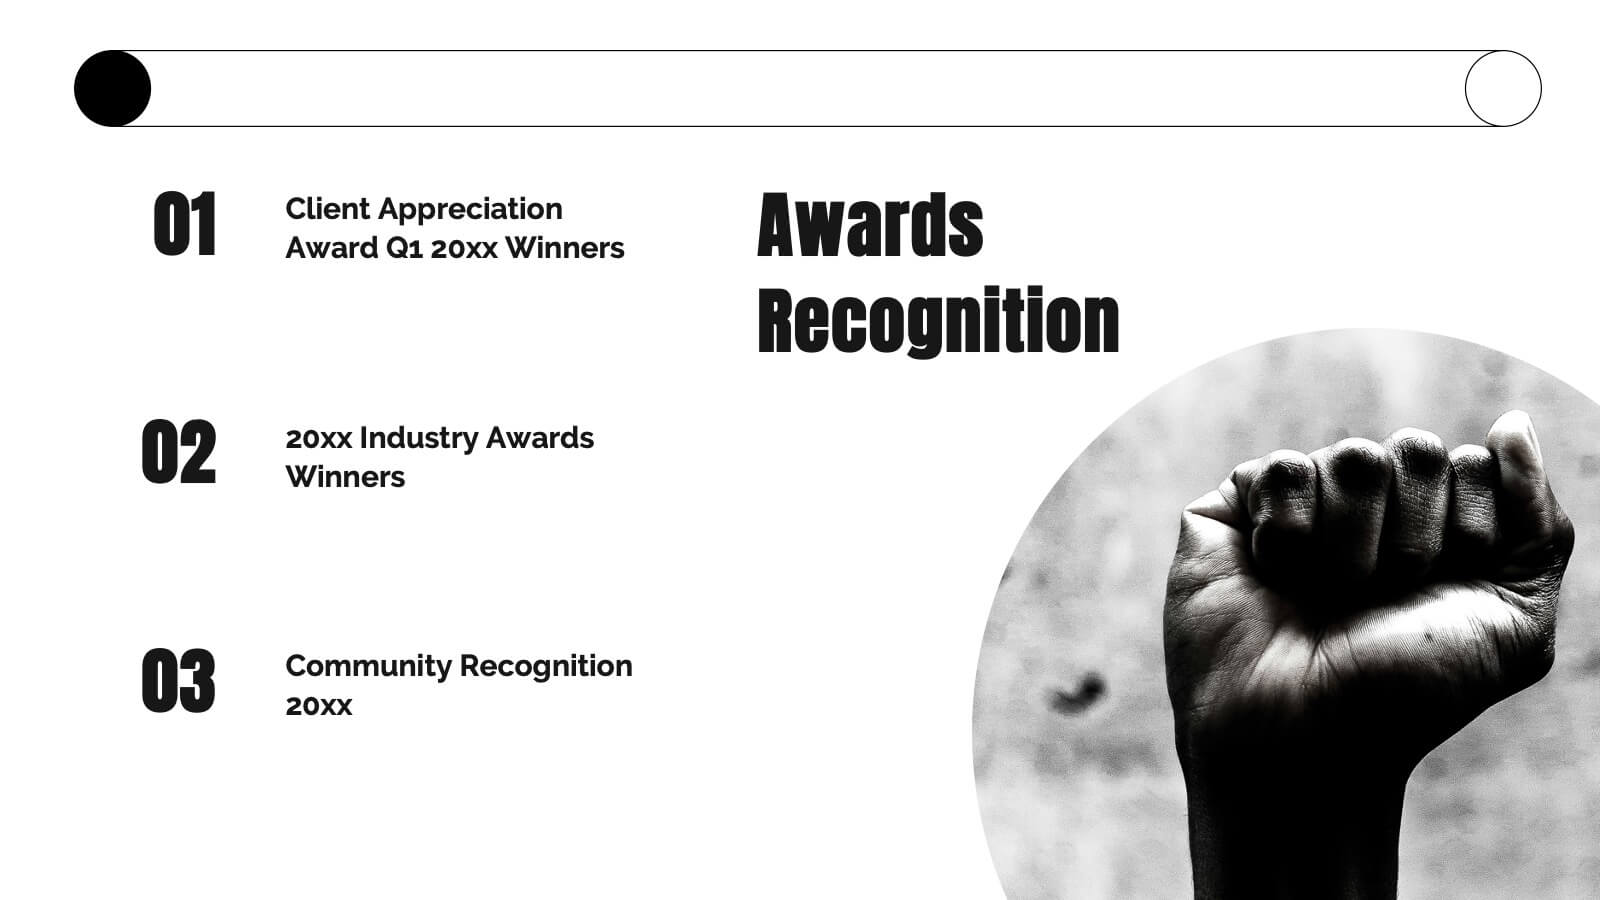
Kraken Agency Portfolio Presentation
This agency portfolio template showcases your agency's work and expertise with a sleek, modern design. It features slides for client success stories, case studies, services, market analysis, and creative process. Perfect for demonstrating your team’s skills and approach. Compatible with PowerPoint, Keynote, and Google Slides for easy customization and presentation.


4 diapositivas
Mirror Data Distribution Butterfly Format Presentation
Present side-by-side comparisons with clarity using the Mirror Data Distribution Butterfly Format Presentation. This layout helps visualize balanced data sets, performance comparisons, or goal vs. outcome metrics with mirrored bars and intuitive icons. Fully customizable in Canva, PowerPoint, Google Slides, and Keynote to match your brand's aesthetic and message.


5 diapositivas
SEO and Funnel Tactics in Marketing Presentation
Showcase your digital strategy step-by-step with the SEO and Funnel Tactics in Marketing Presentation. Designed with a layered visual layout, this template helps you highlight up to five key stages of your marketing funnel—from awareness to conversion. Fully customizable in PowerPoint, Canva, Keynote, and Google Slides.


7 diapositivas
Advanced Education Infographics
The "Advanced Education" infographic template is a sophisticated and visually engaging resource, designed meticulously for PowerPoint, Keynote, and Google Slides. This template is an invaluable tool for educators, administrators, and policy makers aiming to present complex educational frameworks, advanced curriculum details, and innovative learning methodologies. The template expertly encapsulates the essence of advanced education, highlighting specialized programs, cutting-edge research opportunities, and pathways for academic excellence. It's organized to showcase the breadth and depth of advanced educational offerings, making it perfect for academic conferences, institutional presentations, or educational policy discussions. The design is as intellectually stimulating as the content it represents, with a color scheme that is both elegant and conducive to a learning environment. This not only enhances the visual appeal of the presentation but also aligns with the advanced and scholarly nature of the content. Whether used in a university setting, a professional development seminar, or a policy briefing, this template ensures that the value and intricacies of "Advanced Education" are communicated with sophistication, clarity, and visual impact.


5 diapositivas
Cloud Computing for Business Presentation
Present your cloud strategy with clarity using this modern five-point diagram. Each cloud icon is linked to a central device, symbolizing data flow, security, storage, and infrastructure services. Ideal for IT presentations, cloud migration plans, or SaaS workflows. Fully editable in PowerPoint, Keynote, and Google Slides.


6 diapositivas
Career Goals Infographic
Career goals refer to the professional objectives and aspirations that individuals set for themselves to achieve in their chosen careers. This infographic template serves as a powerful tool for individuals to map out their career aspirations, create a clear roadmap, and communicate their goals effectively. This template is designed to articulate and communicate your career aspirations and goals. This infographic provides a clear and organized overview of career objectives, steps for achieving those goals, and key milestones along the way. Compatible with Powerpoint, Keynote, and Google Slides.


4 diapositivas
Performance Gap Analysis Diagram Presentation
Bridge the gap between current and desired performance with this strategic diagram. Featuring a split-path layout and central bridge graphic, this template helps visualize obstacles, goals, and solutions. Ideal for strategy teams, consultants, and analysts. Fully editable in PowerPoint, Keynote, and Google Slides—clear, impactful, and easy to customize.


6 diapositivas
Real Estate Classes Infographic
Real estate classes are educational programs or courses that provide individuals with the knowledge and skills needed to succeed in the real estate industry. This infographic template provides an overview of different types of real estate classes and what real estate is. This is designed to help individuals interested in the real estate industry understand the various educational opportunities available to them. Help your audience make informed decisions about their educational journey in the real estate field. Fully customizable and compatible with Powerpoint, Keynote, and Google Slides.
21 diapositivas
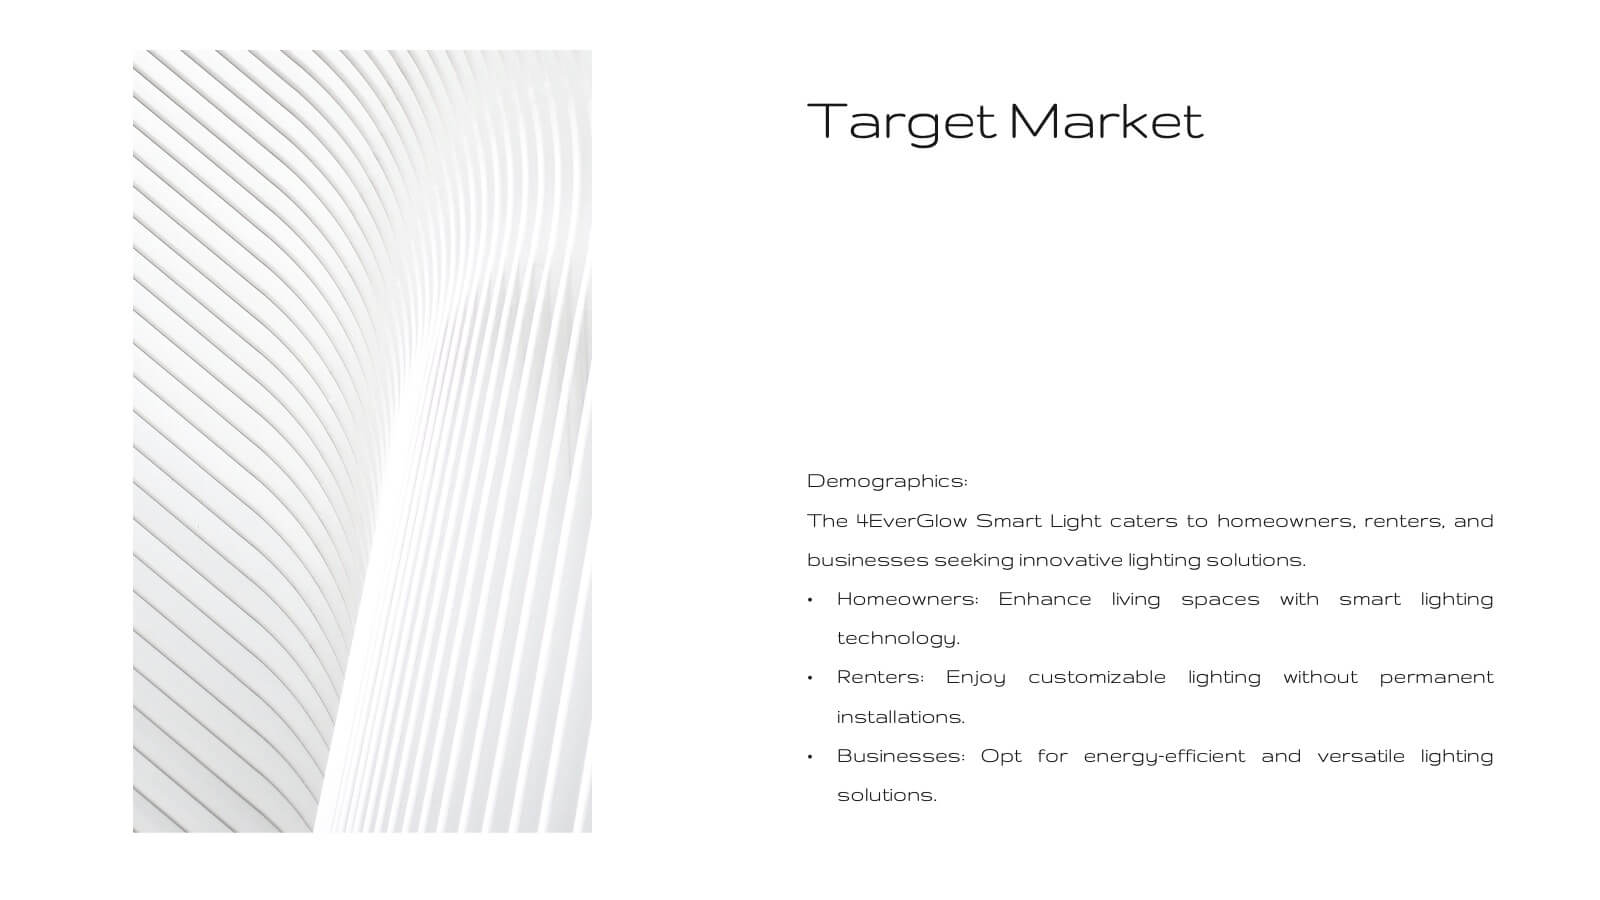
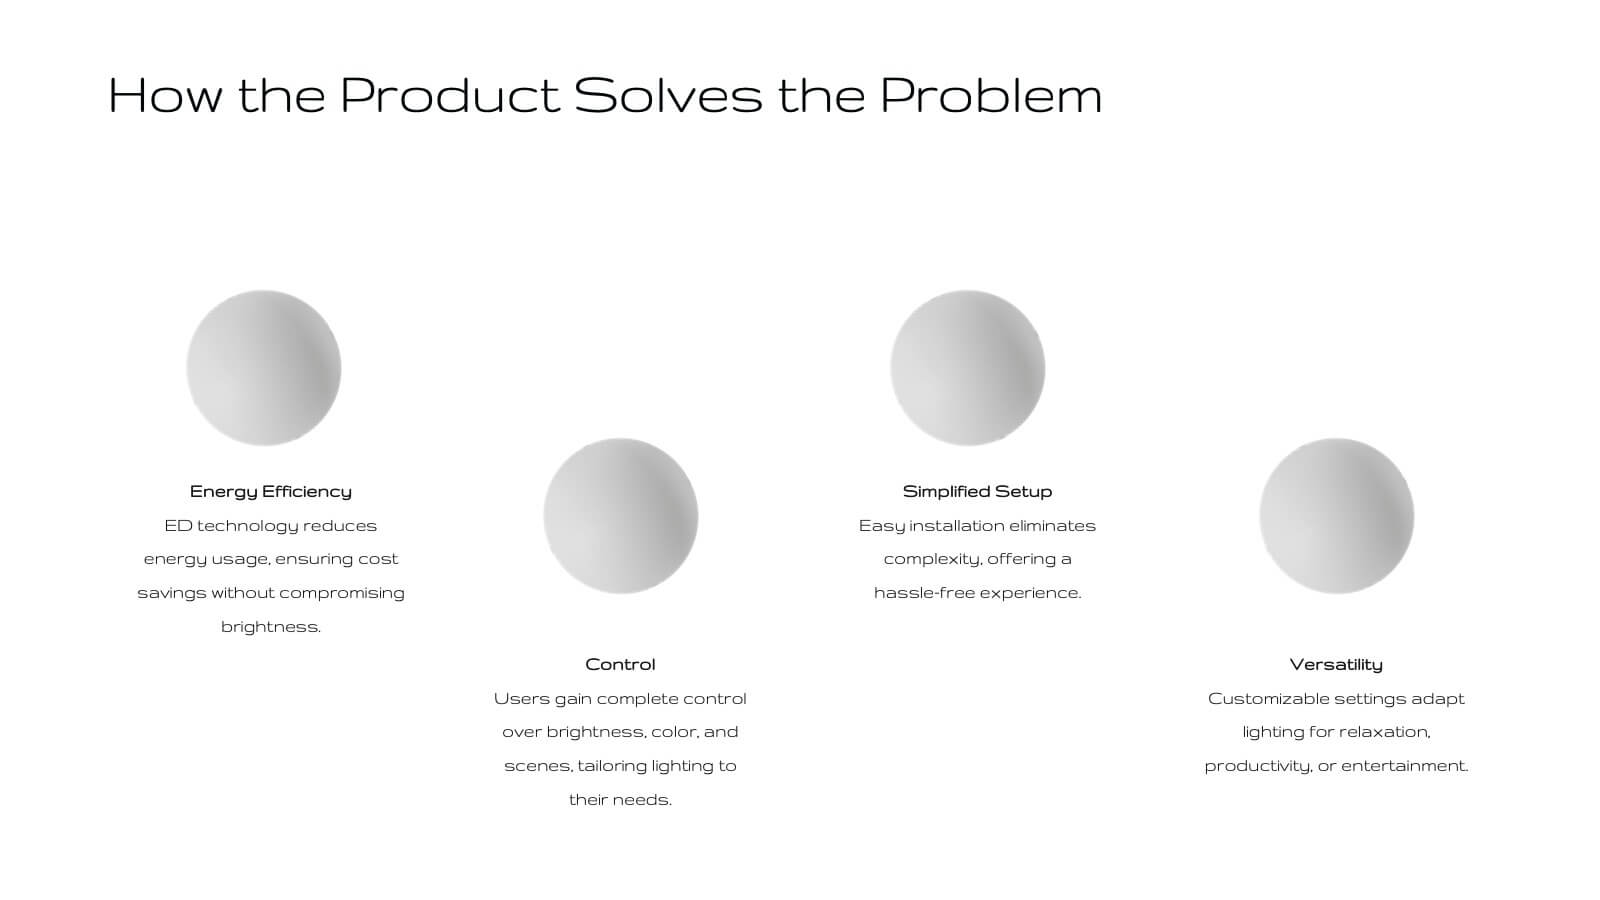
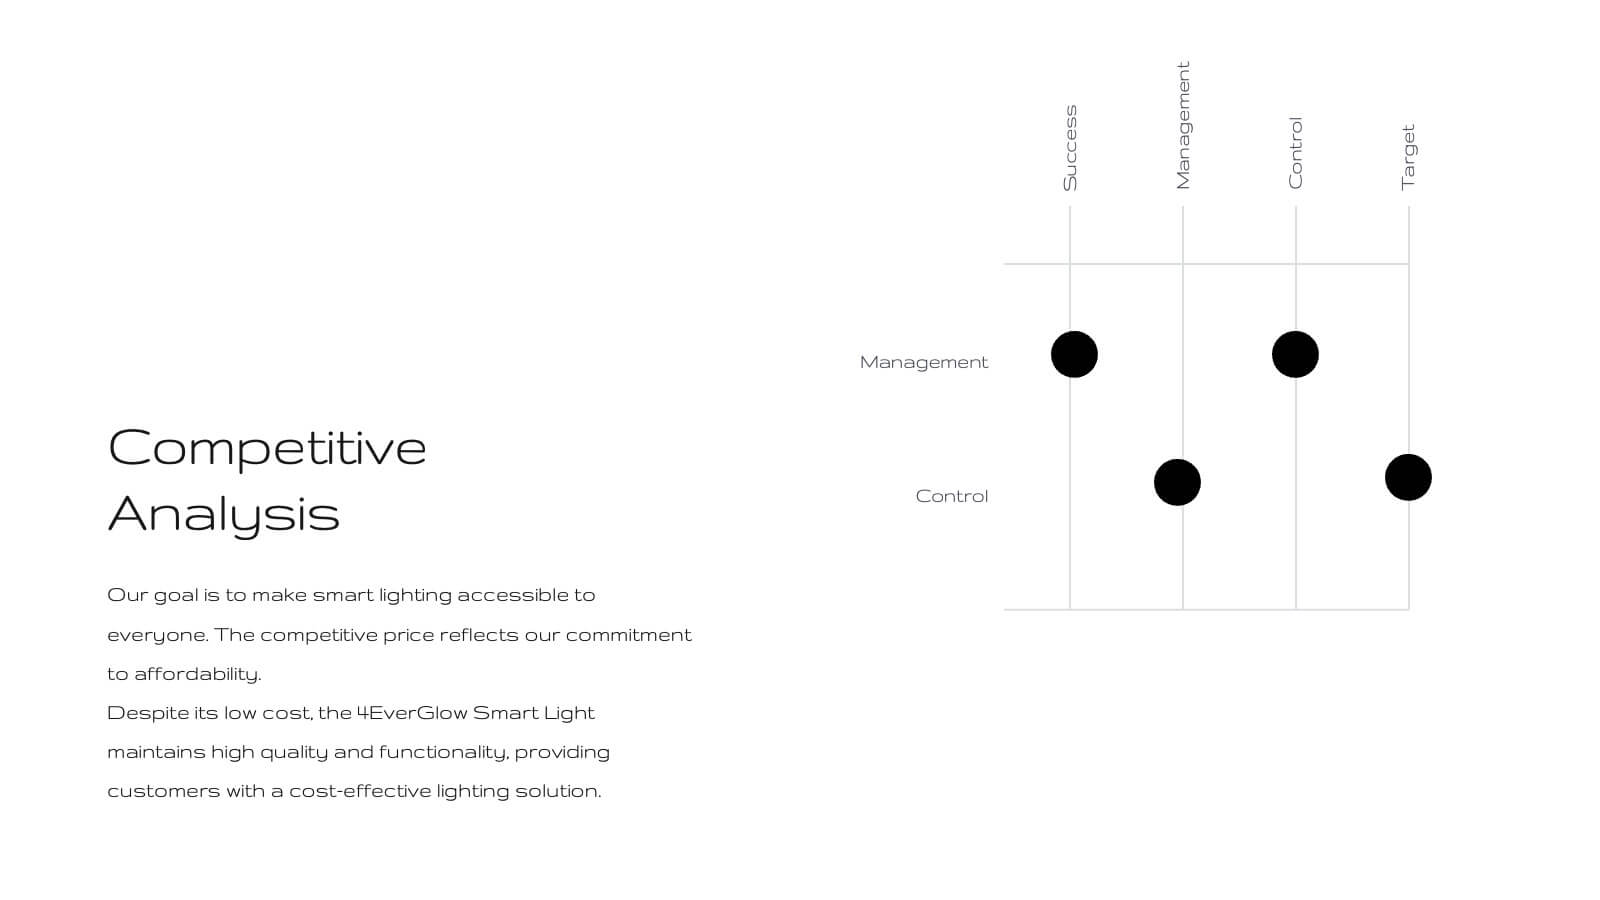
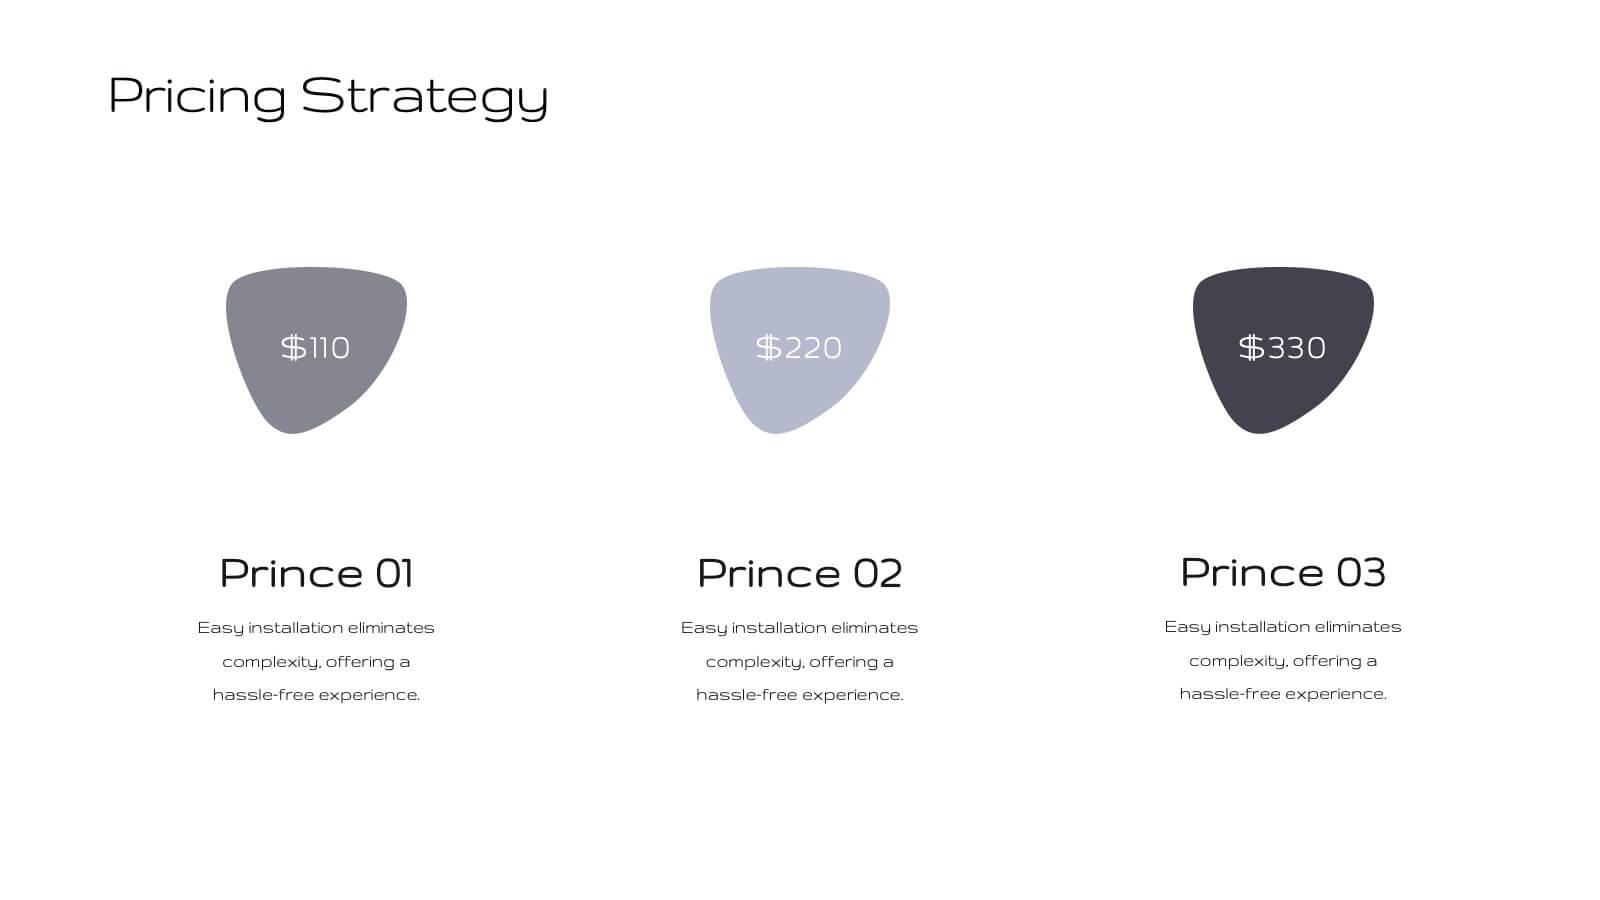
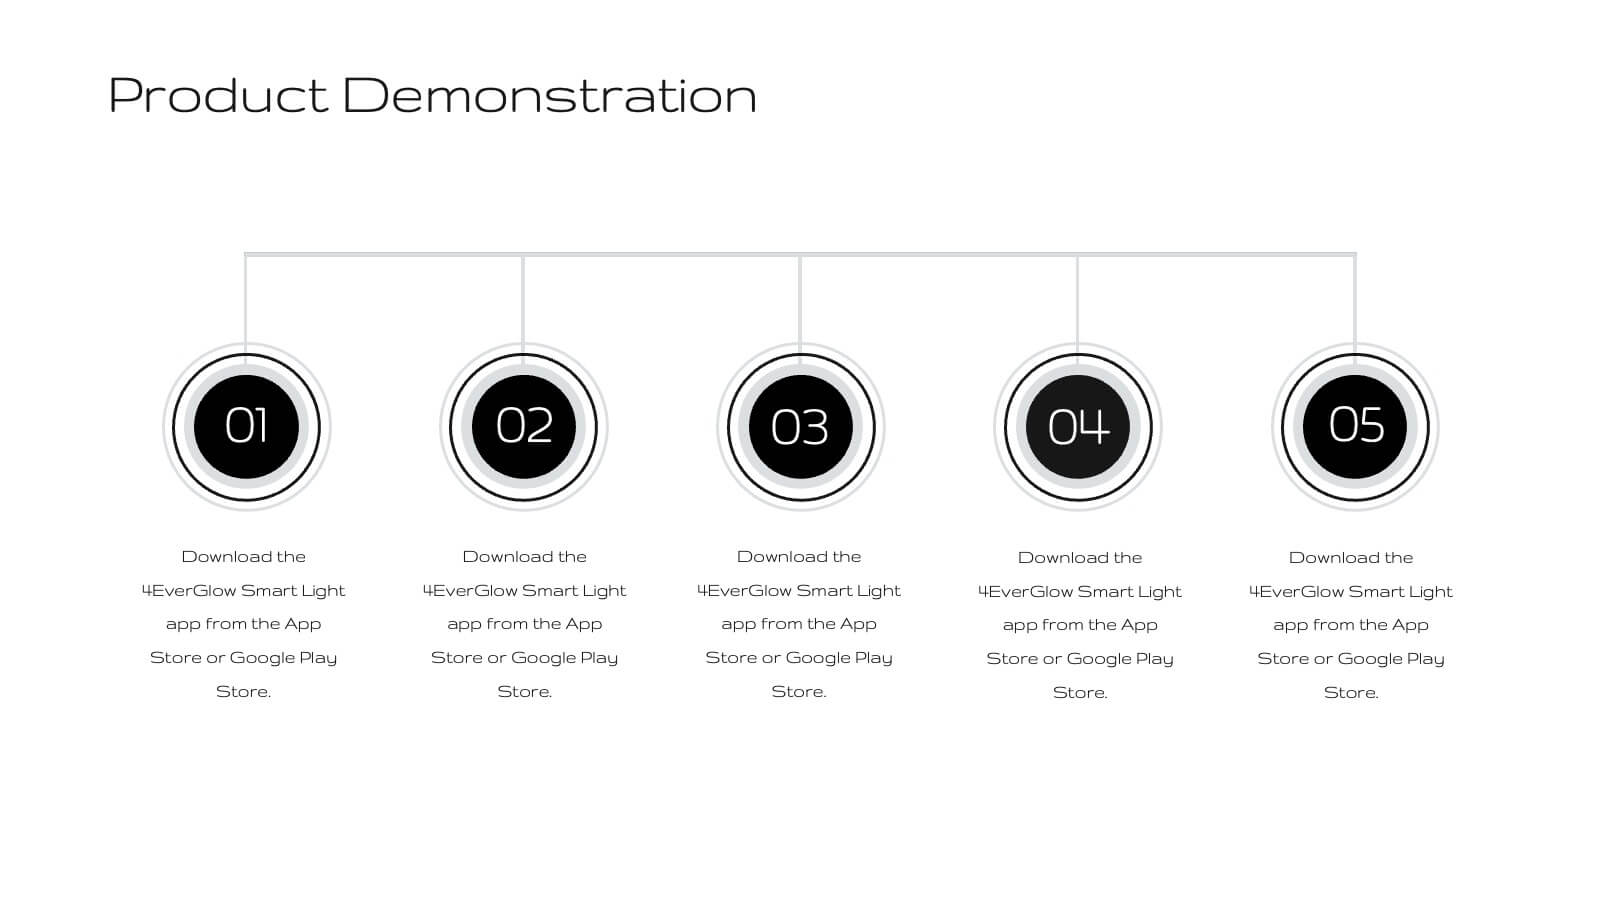
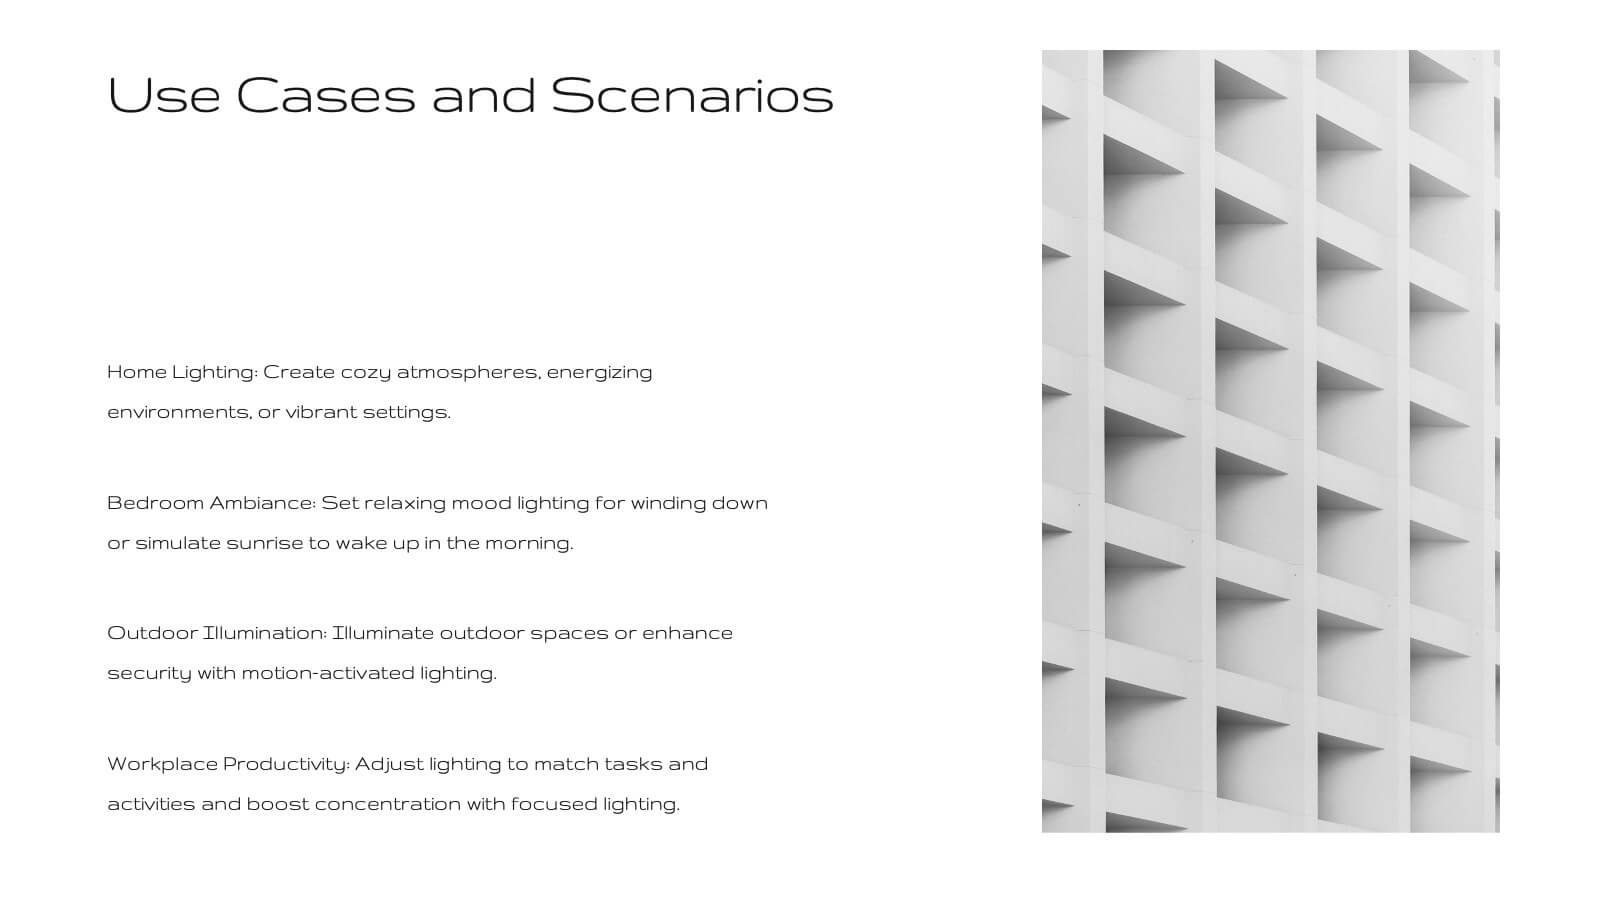
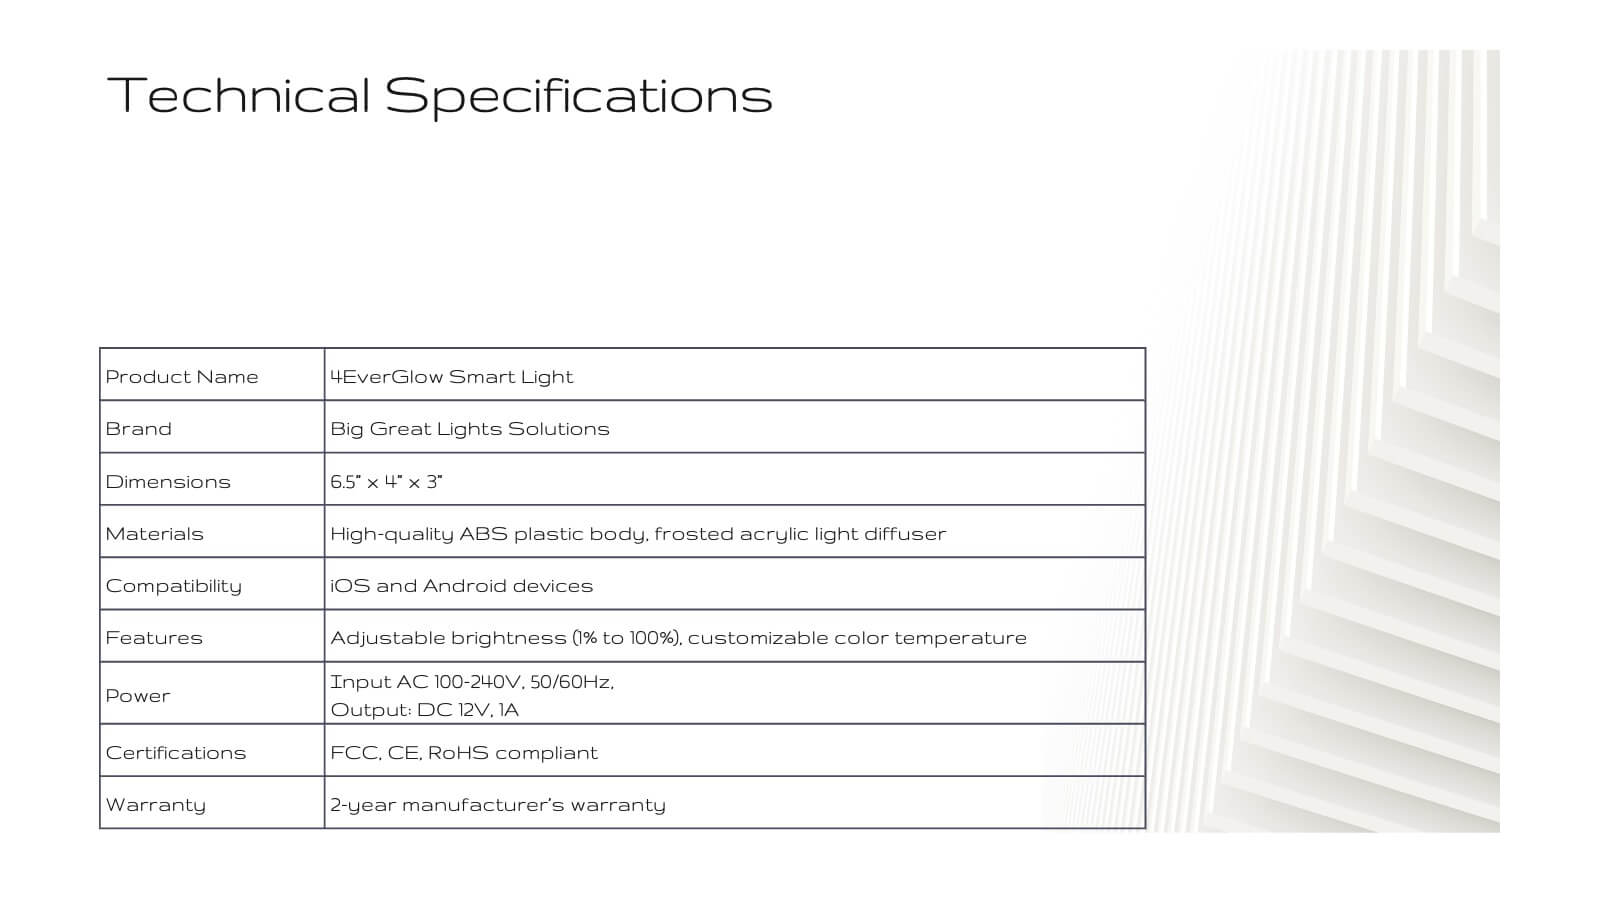
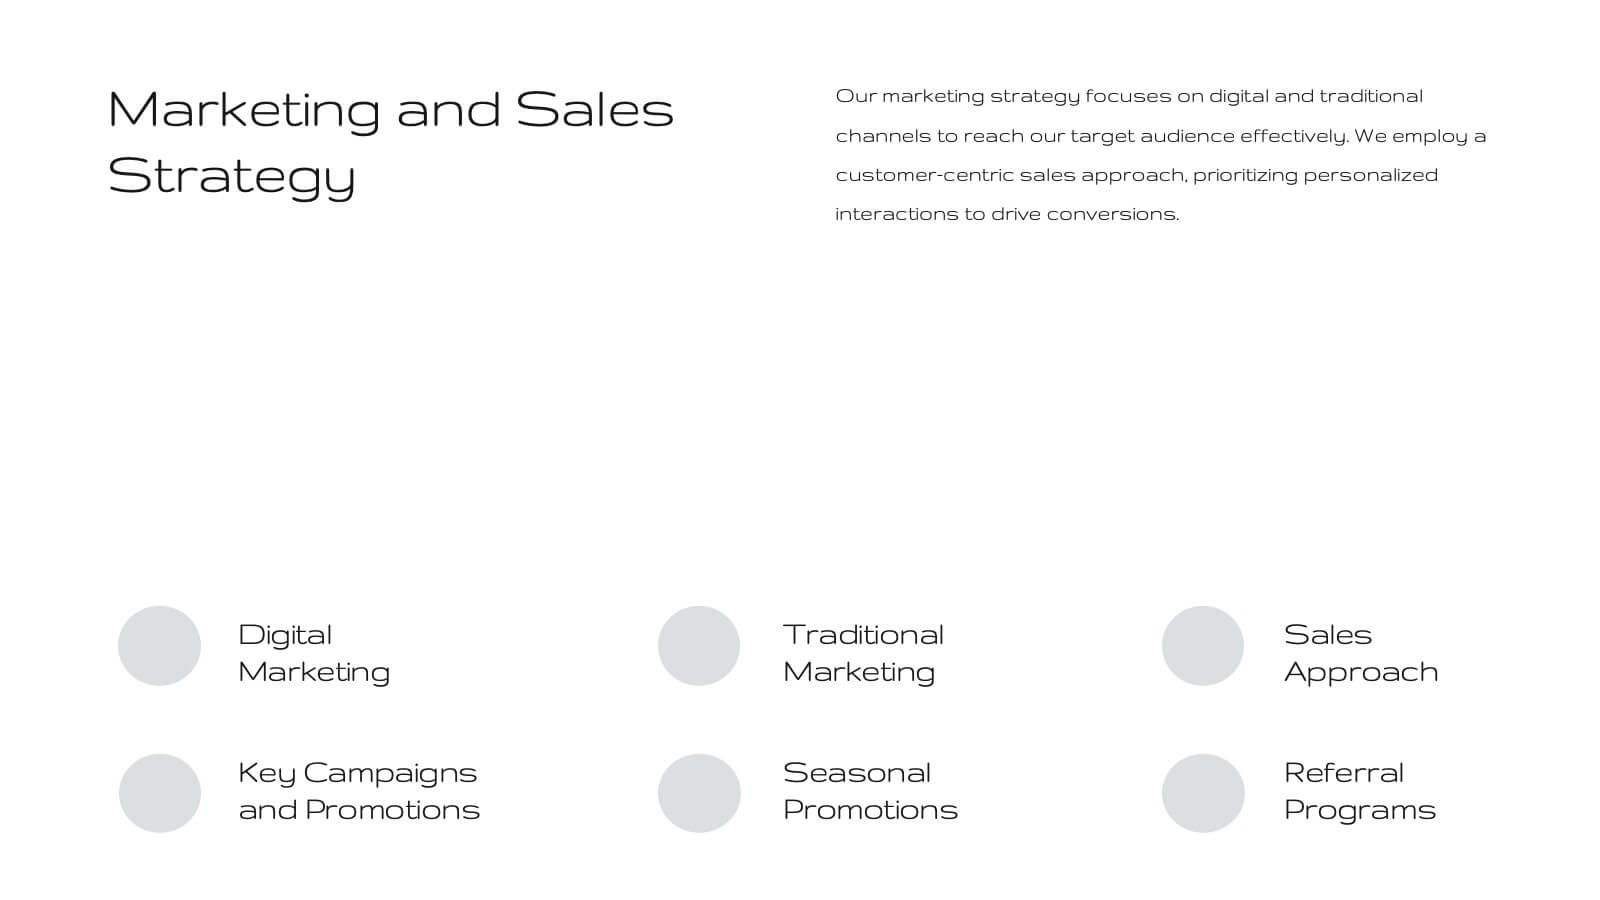
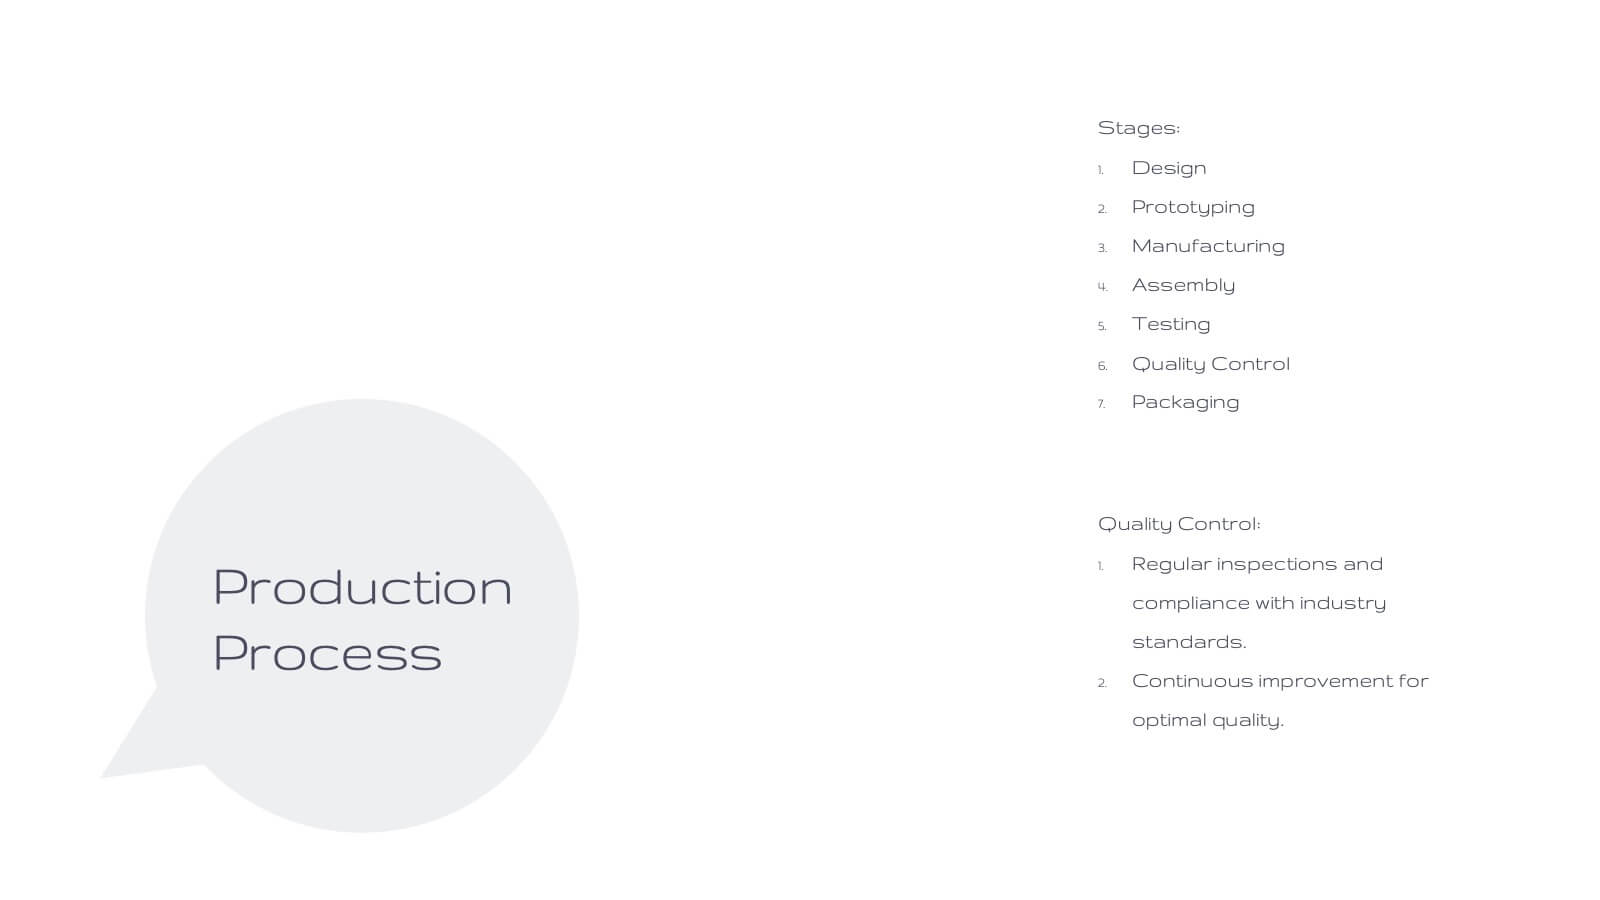
Fortuna Product Development Plan Presentation
Unveil your product's potential with this elegant, minimalist presentation template. Perfect for detailing product development, features, and market strategies, it features a clean design that emphasizes clarity and professionalism. Highlight key aspects like customer pain points, competitive analysis, and pricing strategies to captivate your audience. Compatible with PowerPoint, Keynote, and Google Slides, it ensures seamless presentations on any platform.