


Características


¿Tienes alguna pregunta?
Recomendar


2 diapositivas
Detailed Buyer Profile Analysis Layout Presentation
Showcase a clear snapshot of your customer insights with this Detailed Buyer Profile Analysis Layout. This modern slide helps you outline bios, goals, and key traits using labeled icons, progress bars, and a visual profile section. Ideal for marketing teams, persona development, and product targeting. Fully editable in PowerPoint, Keynote, and Google Slides.


4 diapositivas
Product Launch Schedule Timeline Presentation
Showcase your product rollout with this vertical rocket-themed timeline. Ideal for startups, marketing teams, or product managers, it highlights four key stages with icons and editable text. The cloud-based design adds visual flair while maintaining clarity. Fully customizable in PowerPoint, Keynote, and Google Slides to suit your launch plan.


6 diapositivas
Visual Resource Allocation Gantt
Easily map out team workload over time with the Visual Resource Allocation Gantt Presentation. This slide helps you assign tasks across monthly intervals, track resource distribution, and identify scheduling conflicts. Perfect for project managers, department heads, and HR planners aiming to balance capacity and timelines. Fully editable in PowerPoint, Keynote, and Google Slides.


5 diapositivas
Importance of Sex Education Infographics
Sex Education is an important aspect of human development, but it can be a difficult topic to discuss. It is important for individuals to be knowledgeable about their own bodies and health, as well as understand healthy relationships and consent. These Infographics are visual tools designed to illustrate the need for sex education in schools and society. This template includes statistics, data, and facts about the benefits of sex education, including reducing the risk of sexually transmitted infections and unintended pregnancies, promoting healthy relationships, and empowering young people to make informed decisions about their sexual health.


26 diapositivas
Dante Presentation Template
Featuring our new Dante Sportswear template this is a great way to present your products and ideas in an attractive, easy-to-read and easily understanding presentation. It includes all the elements you need to create a marketing presentation with style that will stand out. This template has plenty of space for displaying statistics and other data with images that complement your product/service information. You can use this template for valuable sportswear content or information to educate or entertain your audience. This template is fully and easily editable in powerpoint as well!


5 diapositivas
Cognitive Psychology Framework Presentation
Unlock insights in the most visual way possible with this bold, brain-powered slide! This presentation template helps simplify complex ideas behind how we think, reason, and remember—perfect for research, education, or team workshops. Fully customizable and compatible with PowerPoint, Keynote, and Google Slides for seamless editing across platforms.


21 diapositivas
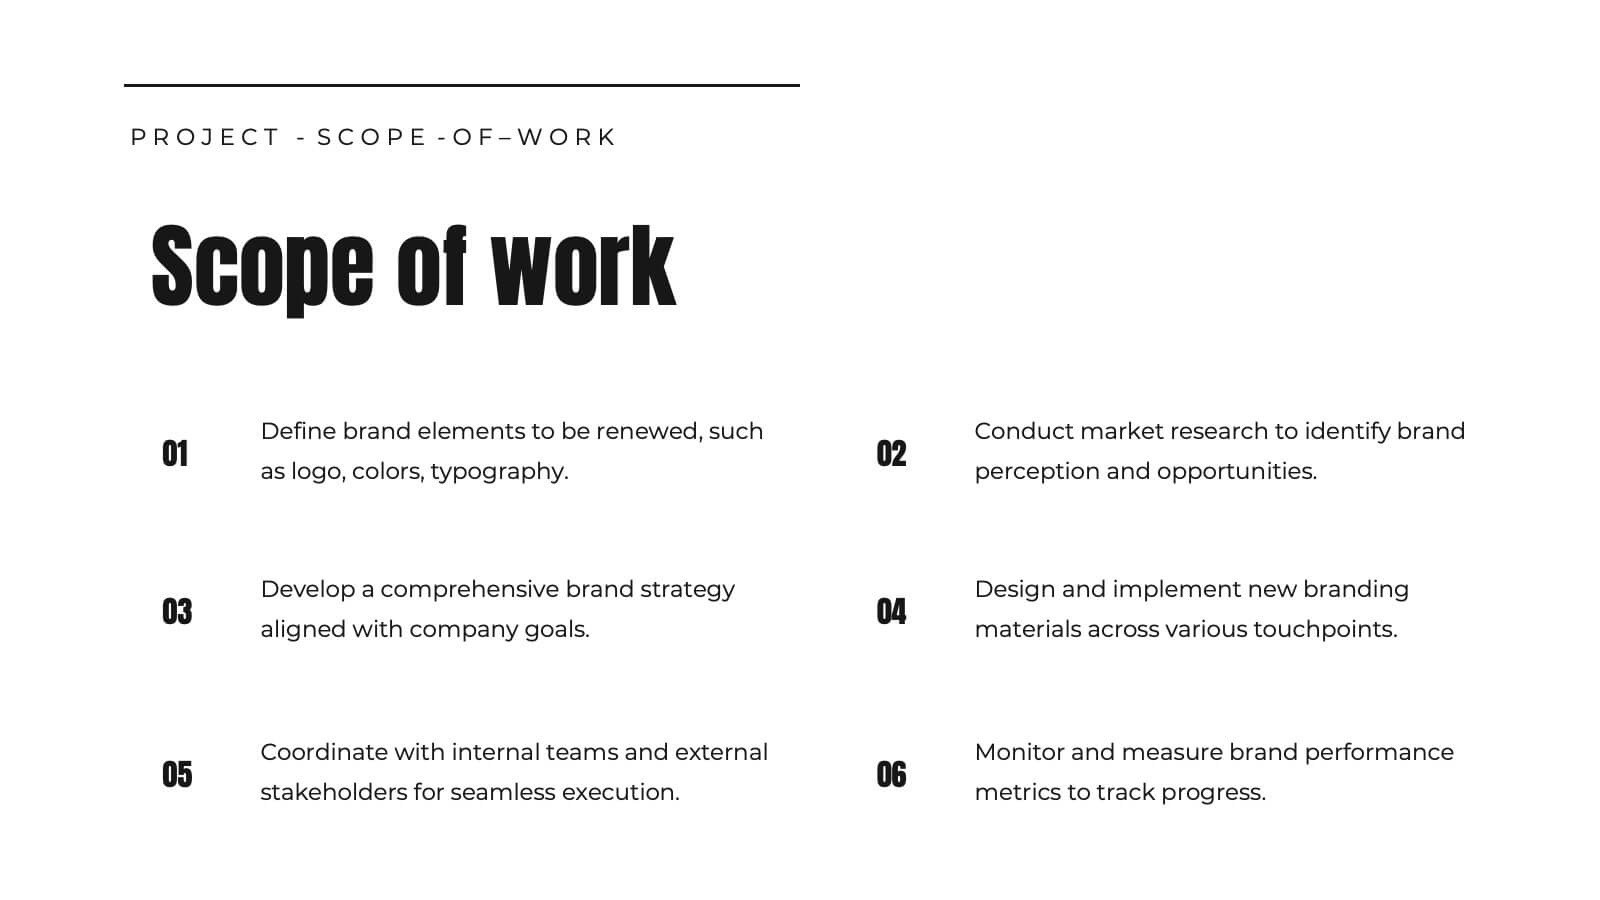
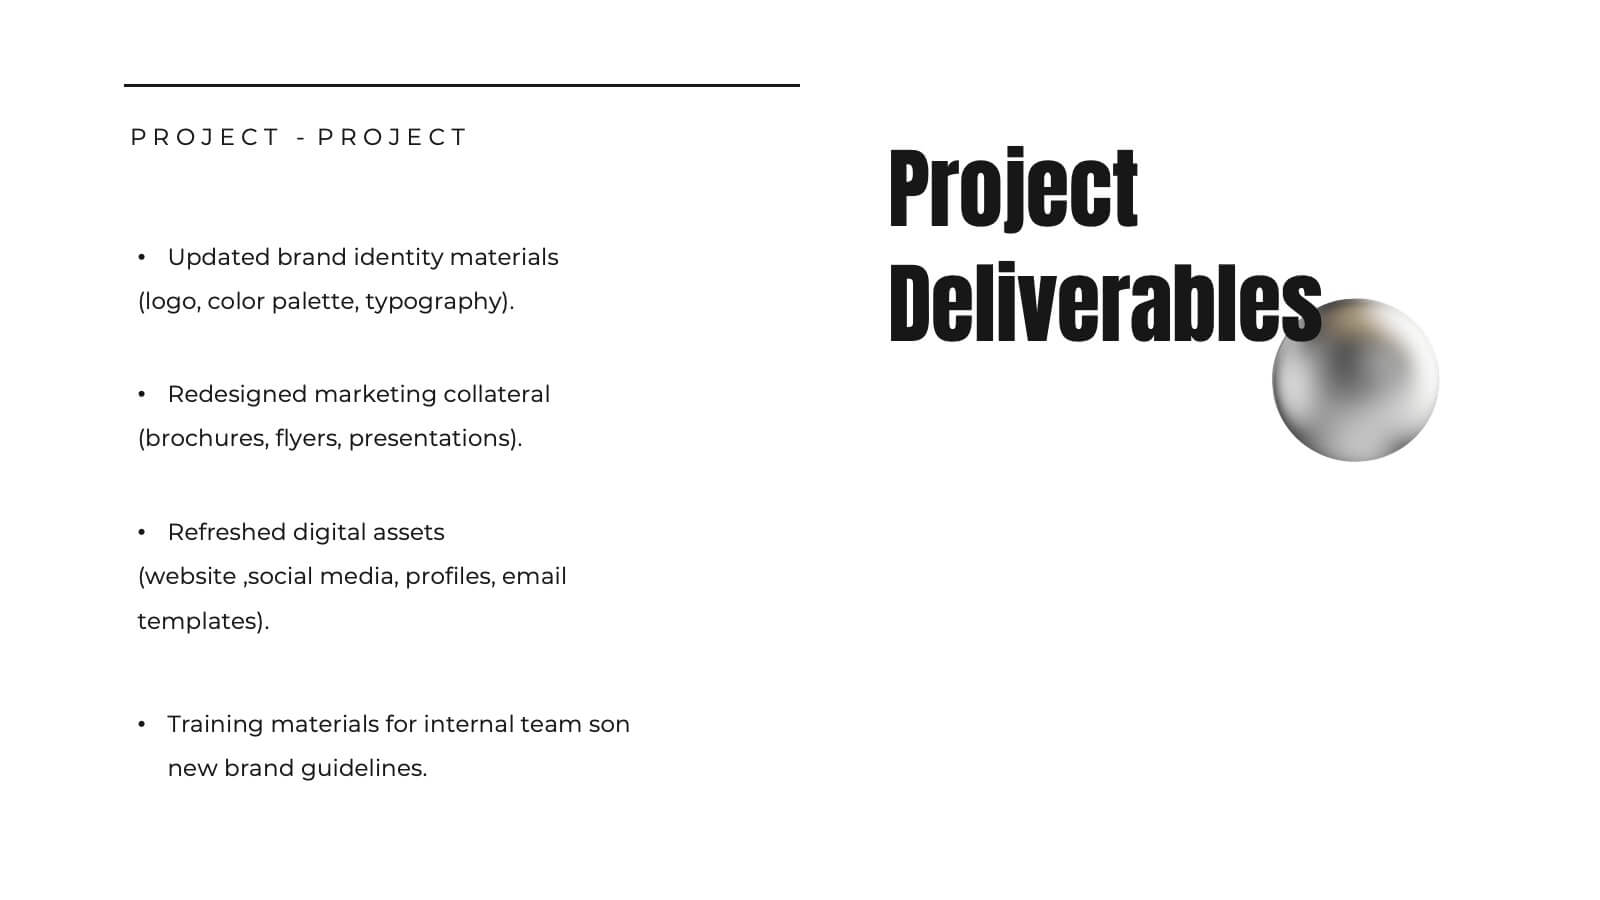
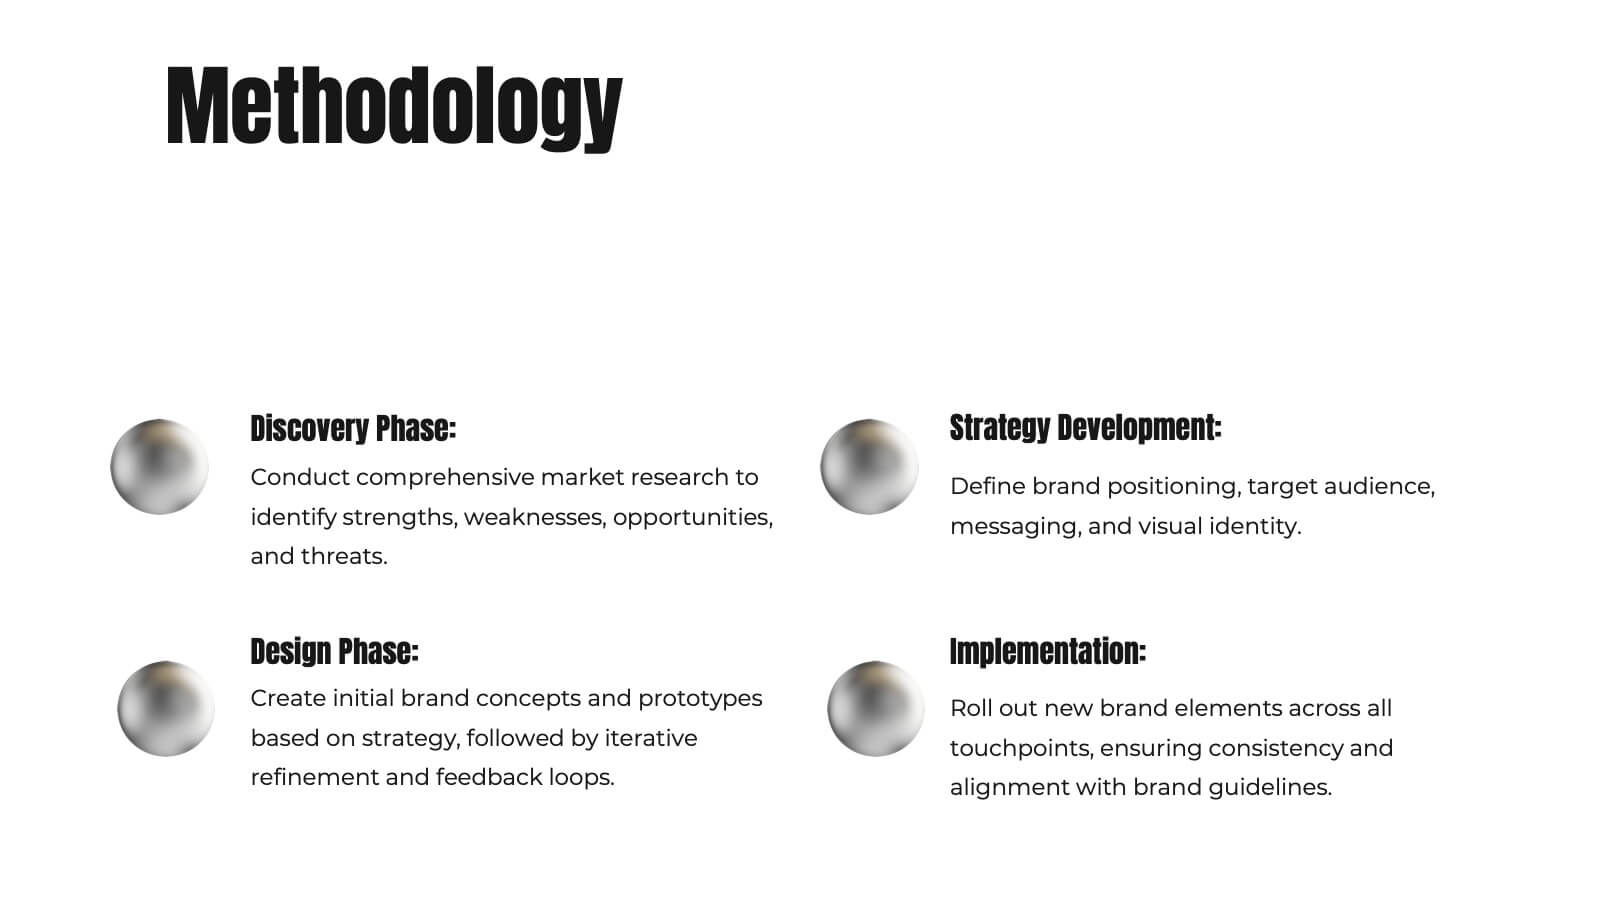
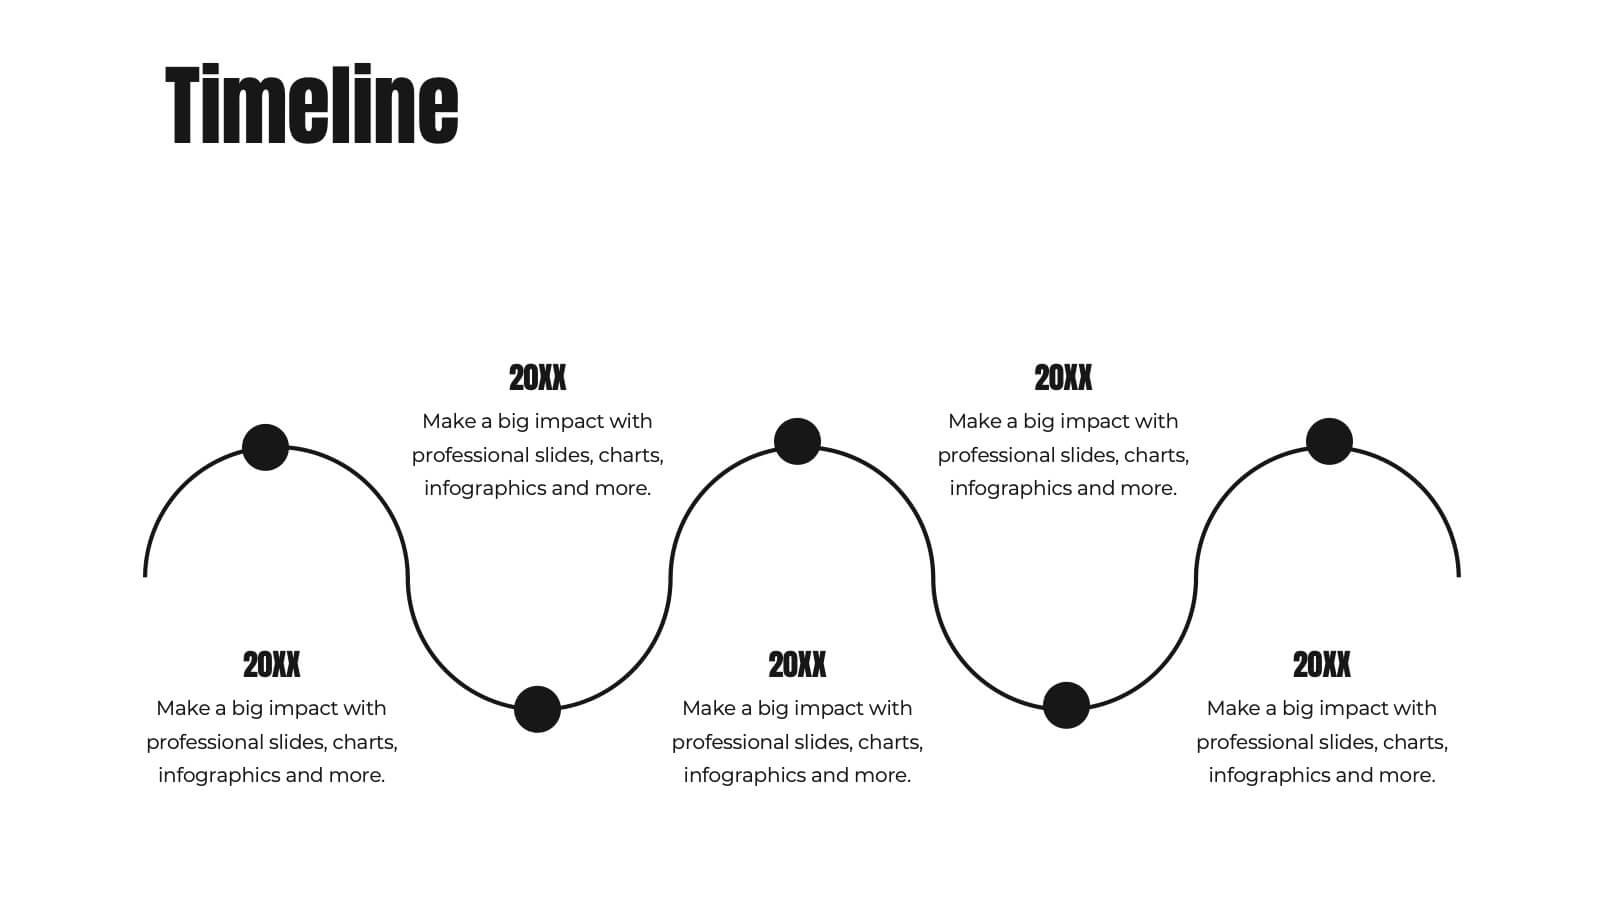
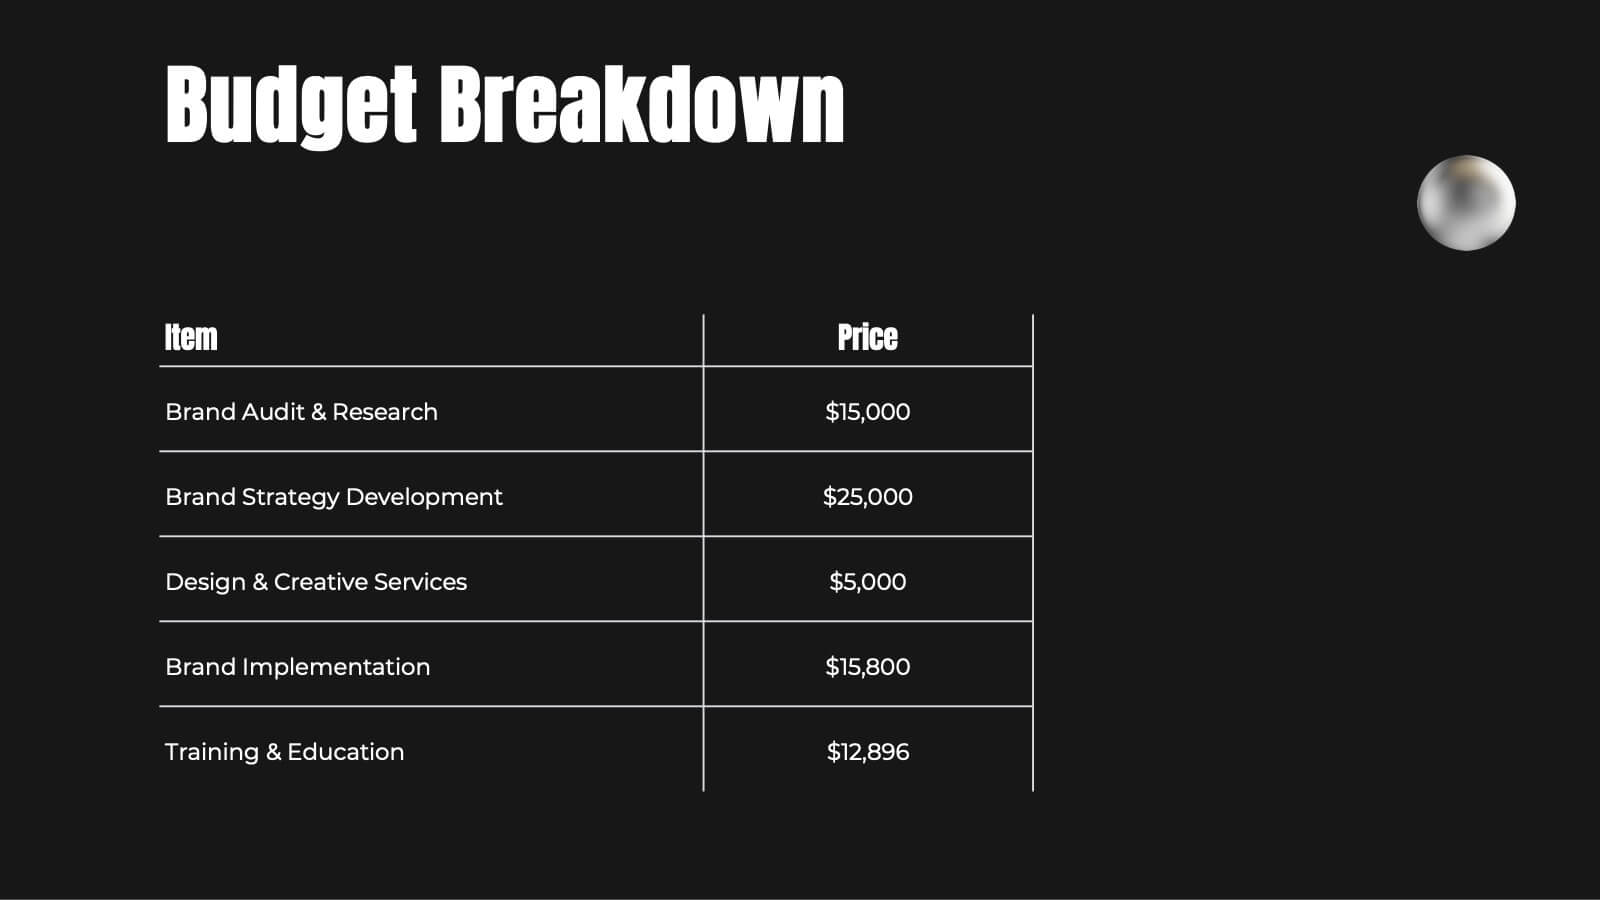
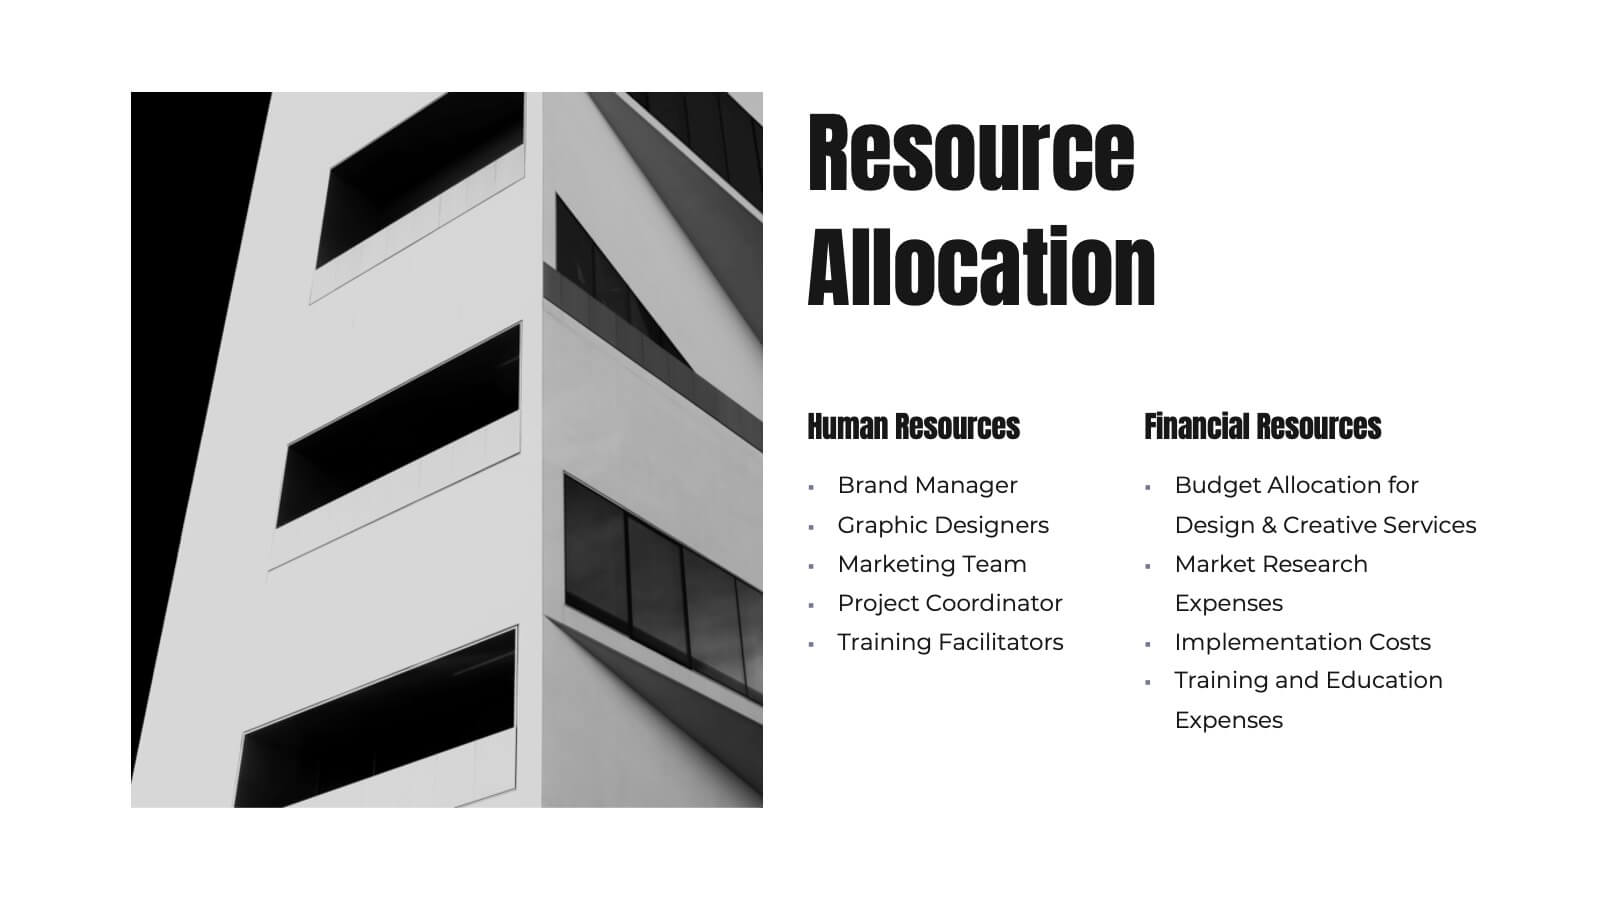
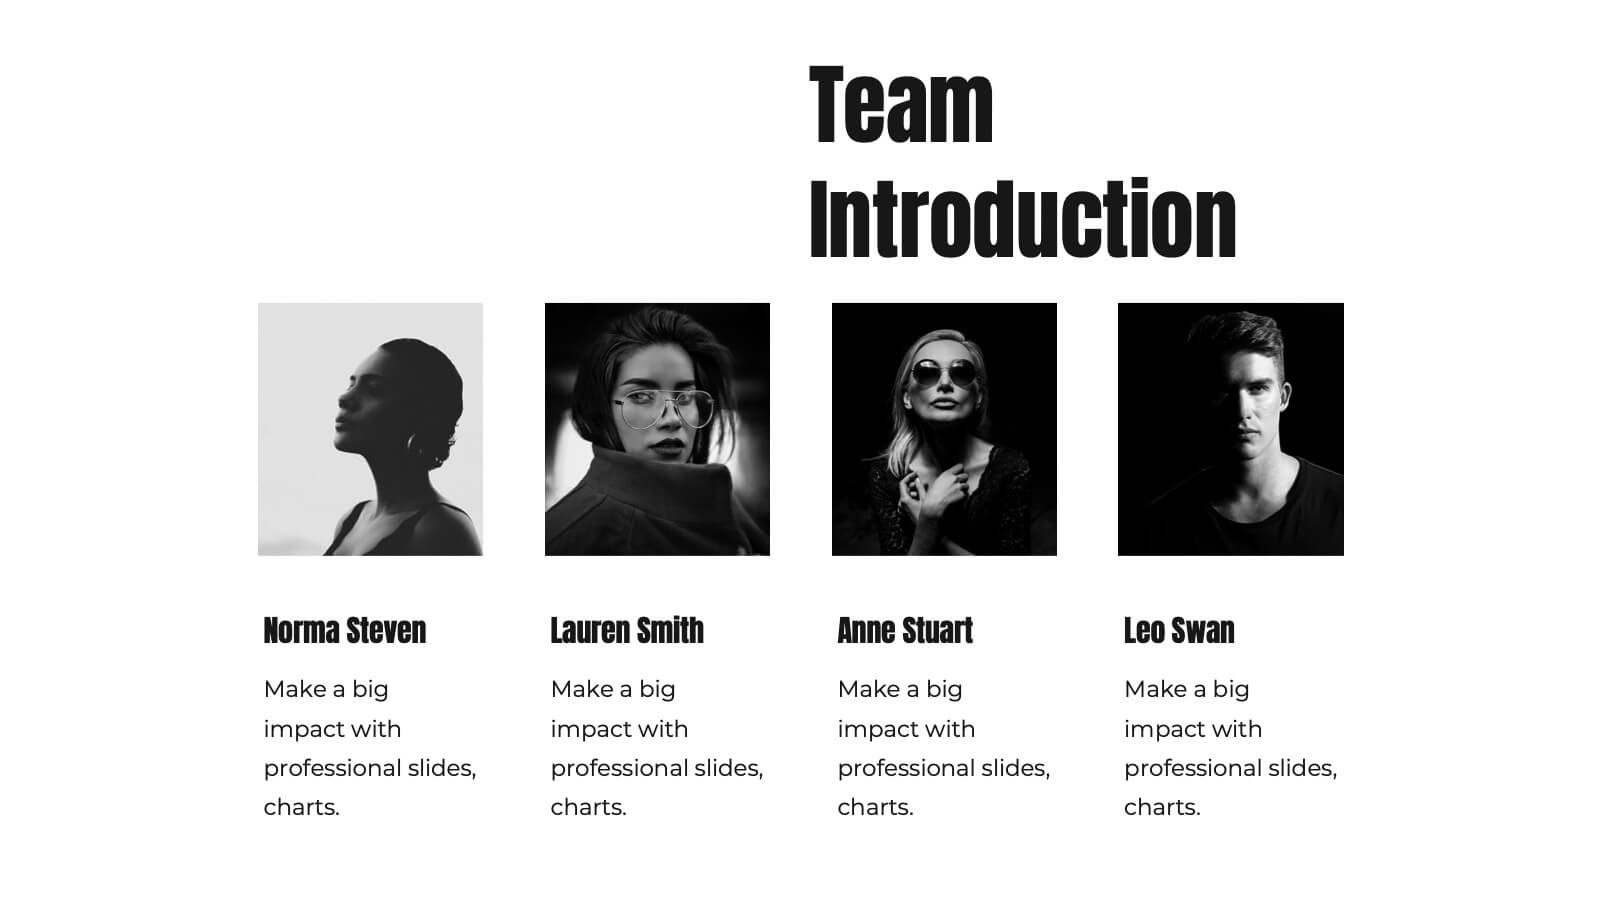
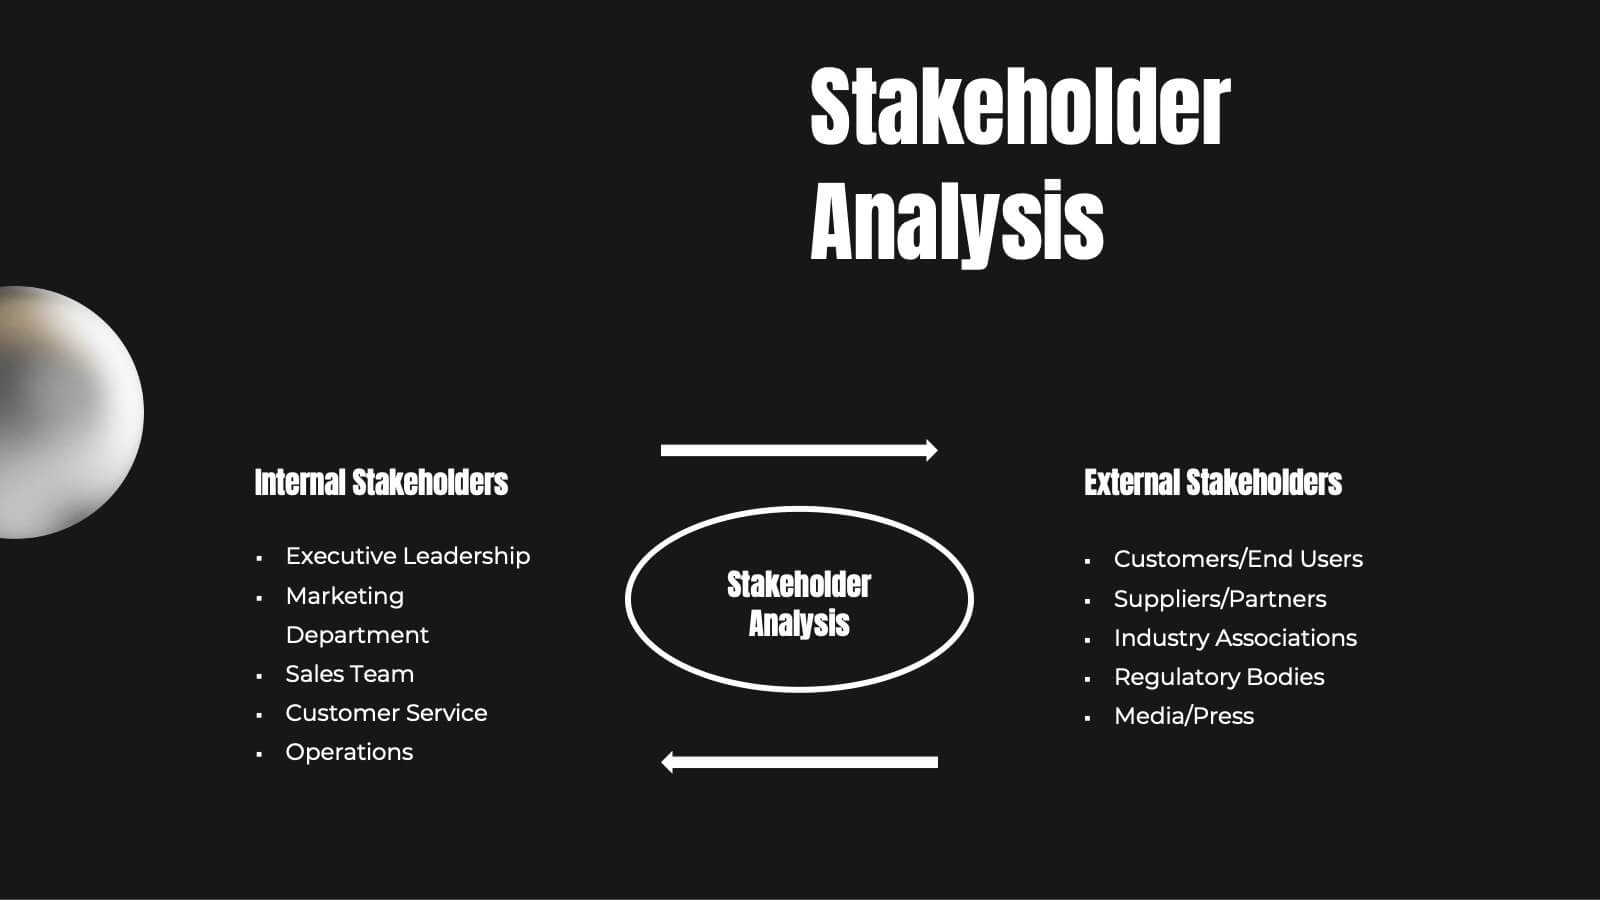
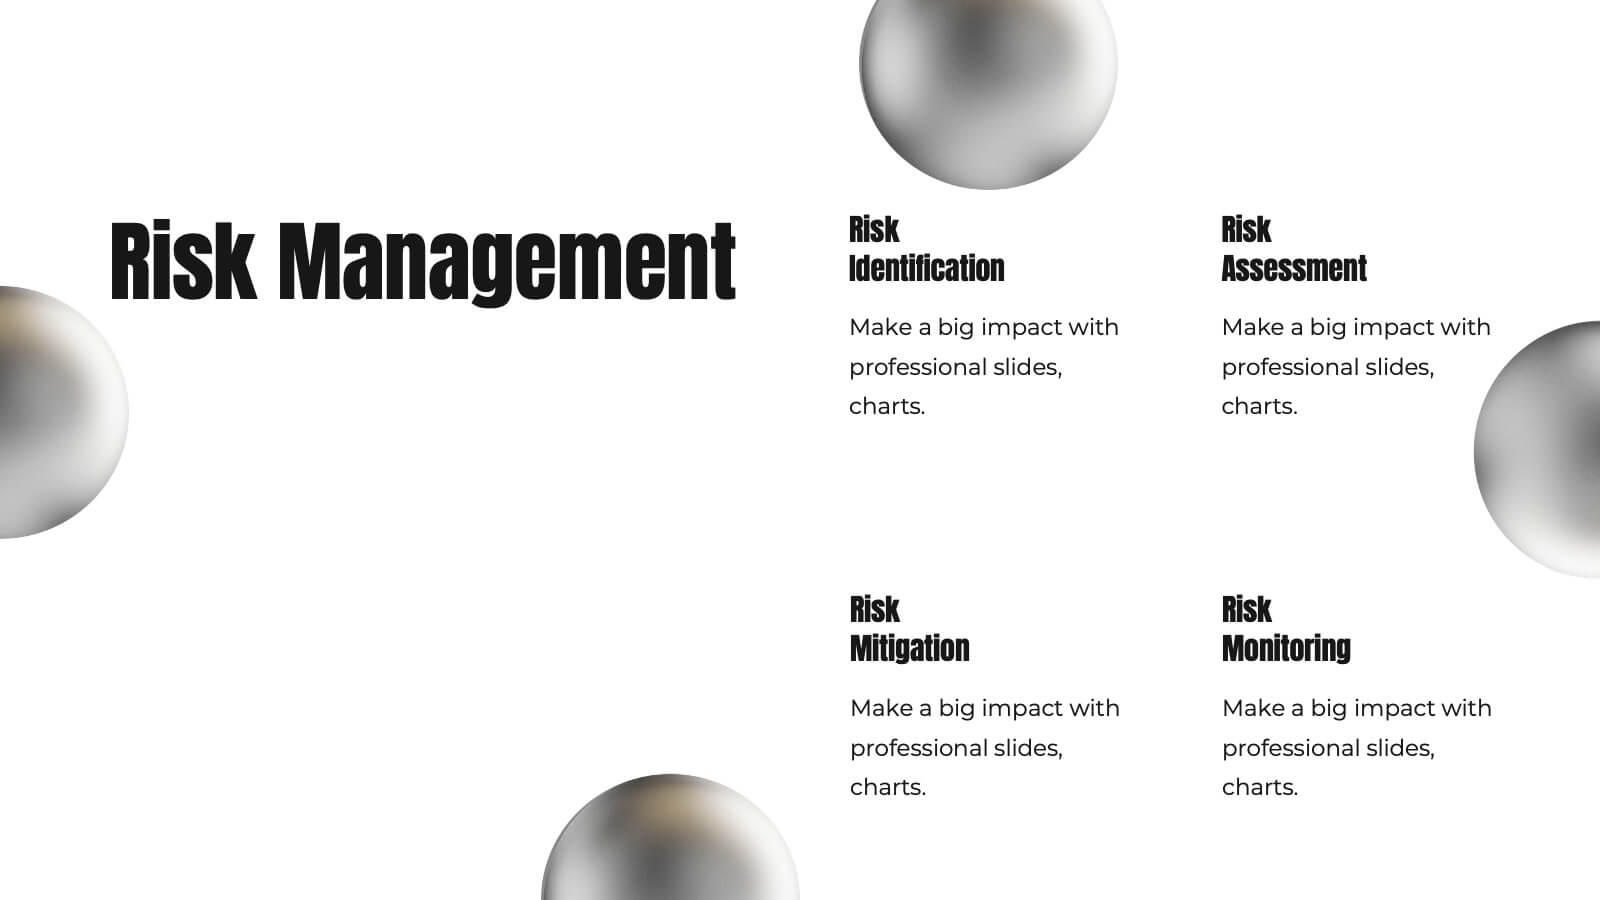
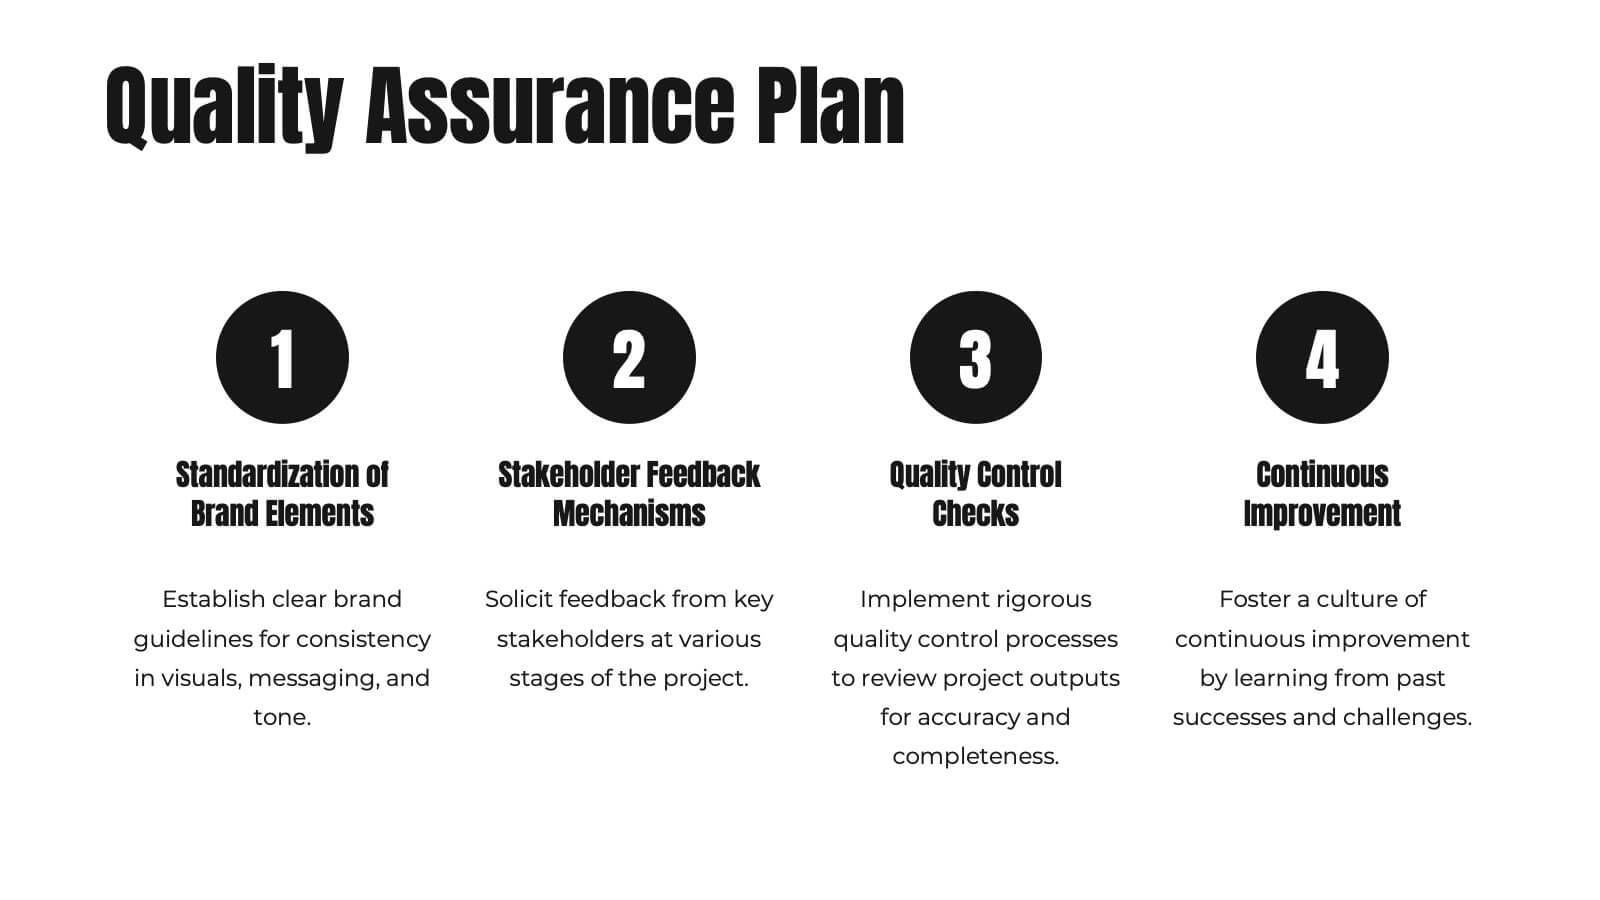
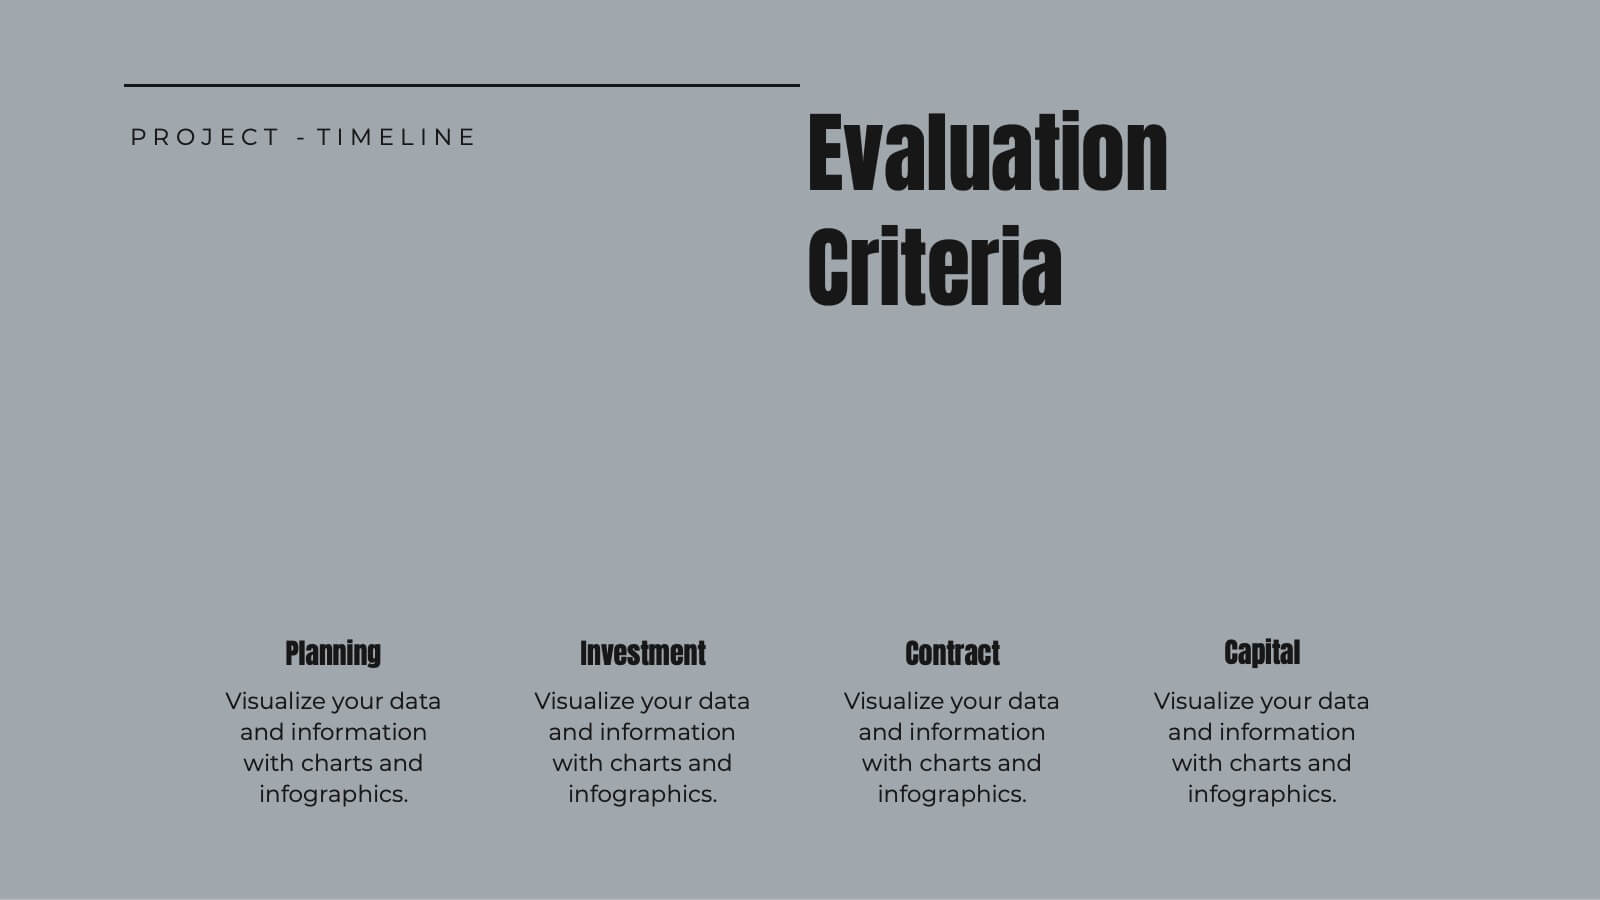
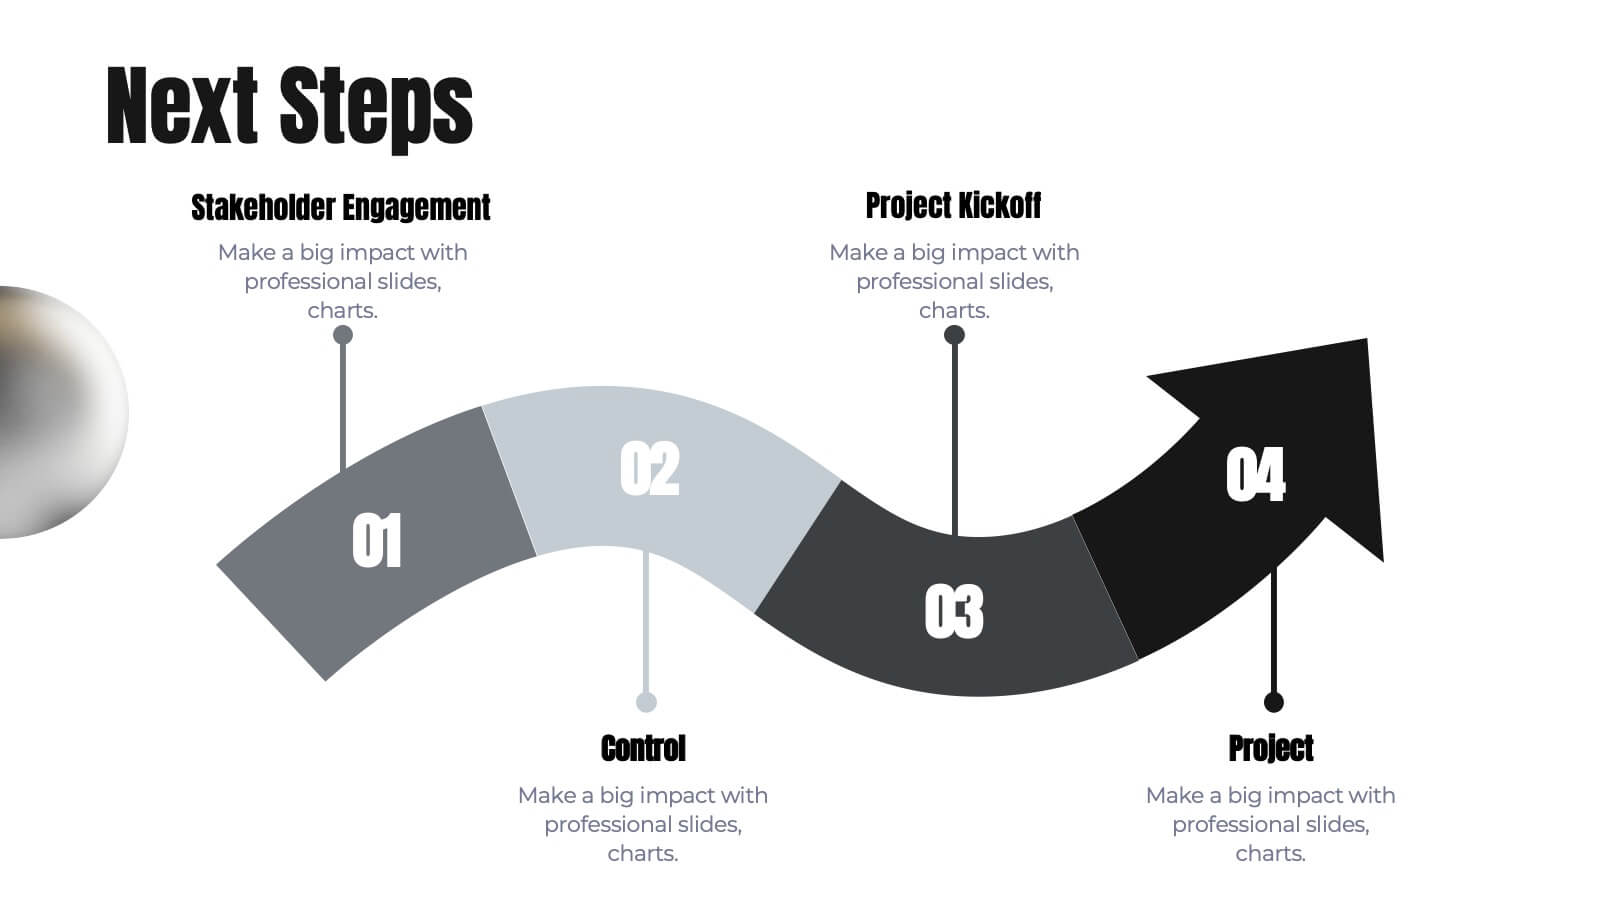
Janus Project Timeline Presentation
Craft a seamless project plan with this sleek and professional presentation template! Designed to guide you through every step, from project overview and scope of work to risk management and resource allocation, this template covers all the essentials. It's perfect for keeping your team on track with clear deliverables, timelines, and evaluation criteria. Compatible with PowerPoint, Keynote, and Google Slides for effortless presentations.


26 diapositivas
Rob Presentation Template
The Rob template is a presentation with an elegant and clean look. This template uses mostly a white and black color scheme, with the background image being a marble design to give a more sophisticated look. The presentation uses a lot of images to communicate. This template has slides dedicated to displaying photograph this is a great presentation to use if you have photos that you want to make a statement. It offers a bold design that is visually pleasing to the audience and encourages them to pay close attention. The template includes all the components needed for a successful presentation.


6 diapositivas
SEO Consulting Infographics
The "SEO Consulting" infographic template is designed for PowerPoint, Keynote, and Google Slides, making it a valuable resource for SEO consultants, digital marketing professionals, and business owners. This template is crafted to effectively communicate the essentials of SEO in a professional and engaging manner. Featuring key elements of SEO such as optimization strategies, keyword research, and website traffic analysis, the template is structured to simplify the complex aspects of SEO. This makes it an ideal tool for presentations aimed at educating clients or team members about the nuances of search engine optimization and its impact on digital marketing. The design of the template is modern and business-oriented, with a color scheme that includes shades of blue, green, and gray. This professional yet engaging aesthetic ensures that the presentation is not only informative but also visually appealing. Whether used in client meetings, training sessions, or marketing seminars, this template is sure to enhance the understanding and appeal of SEO consulting services.


7 diapositivas
Supply Chain Process Mapping Presentation
Streamline your logistics and operations presentations with the Supply Chain Process Mapping Presentation. Featuring a linked-chain visual, this editable template is ideal for outlining each step in your supply flow—from sourcing to delivery. Highlight dependencies, bottlenecks, or key stages with customizable color coding. Fully compatible with PowerPoint, Keynote, and Google Slides.


5 diapositivas
Risk Management Bowtie Diagram Layout Presentation
Visualize risk pathways with clarity using the Risk Management Bowtie Diagram Layout Presentation. This design helps illustrate cause-and-effect relationships around a central risk event, making it ideal for identifying threats, controls, and consequences. Fully editable and easy to adapt in Canva, PowerPoint, Google Slides, and Keynote.


26 diapositivas
Abstract Technology Presentation
Artificial intelligence is helping to drive the future and make it better, it has the potential to transform how we live and work. This is a detailed presentation template for artificial intelligence technology, with an abstract design and chart slides that can be used to demonstrate how this technology works. This template will help you inform your audience about what artificial intelligence is. Easy to edit and customize, this template will allow you to create your own story around the concept of artificial intelligence, while still presenting your information in an organized format.


6 diapositivas
Business Challenges and Solutions Presentation
Address challenges with strategic solutions using this Business Challenges and Solutions template. Featuring a clear side-by-side layout, this design helps visualize business obstacles and their corresponding solutions for effective decision-making. Perfect for problem-solving discussions, strategy meetings, and brainstorming sessions, this template ensures your content remains structured and impactful. Fully customizable for PowerPoint, Keynote, and Google Slides.


26 diapositivas
Adlyn Presentation Template
Making low-calorie foods a part of your daily diet protect against the risk of heart disease, diabetes, and cancer. They make you feel full while reducing the daily calorie intake, which can help with weight loss. The Adlyn template is a concise, easy-to-use template that’s designed to help you inform your audience on the importance of low-calorie foods. This template is perfect for site builders, food bloggers, and writers looking to create informative content on food facts and healthy living. Using Adlyn you can add daily tips about nutrition and exercise along with a list of healthy foods.


4 diapositivas
Colorful Workflow Process Chart Presentation
Bring your workflow to life with a vibrant, easy-to-follow layout that makes every stage feel connected and purposeful. This presentation helps you map processes, explain team roles, and simplify complex steps using a clean, visual flow. Fully compatible with PowerPoint, Keynote, and Google Slides.


6 diapositivas
Travel Tips Infographic
By following travel tips, you can enhance your travel experience, mitigate potential challenges, and make the most of your adventures. This infographic template is designed to provide travelers with essential tips and guidelines for a successful and enjoyable trip. Whether you're planning a vacation, business trip, or backpacking adventure, this infographic offers valuable information to help you make the most out of your travel experience. This template is a valuable tool for enhancing travel experiences and ensuring a smooth and memorable trip. Compatible with Powerpoint, Keynote, and Google Slides.


26 diapositivas
Natlea Presentation Template
Need help presenting your next travel destination? This template is a unique and sophisticated way to present your travel destination. The Natlea travel template is a fun, surprisingly sophisticated and easy to use template that allows you to list all the details of your trip. With bold colors, charts, budget slides and venn diagrams this template has it all. It's simple yet fun design makes it stand out and at the same time keep your audience engaged. This is the perfect choice for marketers, tourism professionals or anyone who needs to make a great looking presentation on their next trip.