


Características


¿Tienes alguna pregunta?
Recomendar


10 diapositivas
Customer Satisfaction and Smile Rating Presentation
Visualize customer experience in a clear and engaging way with this Customer Satisfaction and Smile Rating slide. Featuring a vertical feedback meter and 5 customizable rating levels, this template is ideal for highlighting user sentiment, service evaluations, or feedback summaries. Perfect for performance reviews, UX reports, or NPS breakdowns. Compatible with PowerPoint, Keynote, and Google Slides.


21 diapositivas
Kinetic Startup Funding Proposal Presentation
Get ready to impress potential investors with the Kinetic Startup Funding Proposal template! This dynamic and modern template is designed to help you present your startup's vision, mission, and growth potential in the most compelling way possible. From introducing your team and services to highlighting your unique value proposition and business model, every slide is crafted to showcase your startup's strengths. The template includes sections for market analysis, customer needs, and pain points, ensuring your presentation is data-driven and focused on solving real problems. With slides dedicated to your marketing strategy, sales channels, and financial overview, you can provide a comprehensive plan for success. The sleek design, combined with easy-to-edit slides, allows you to customize the presentation to reflect your startup's brand identity. Whether you're pitching to angel investors or venture capitalists, the Kinetic Startup Funding Proposal template will help you stand out and secure the funding you need. Compatible with PowerPoint, Keynote, and Google Slides, this template is your key to delivering a winning pitch.


6 diapositivas
Strategic Objective Planning Presentation
Present your Strategic Objective Planning with this powerful, chess-themed presentation template. Highlight competitive strategies, goal alignment, and decision-making with visually engaging chess piece graphics. Ideal for corporate strategy, business planning, and leadership presentations. Compatible with PowerPoint, Keynote, and Google Slides.


3 diapositivas
Strategic Planning and Business Model Presentation
Present your business roadmap with clarity using this Strategic Planning and Business Model slide. Featuring a modular grid layout, it allows you to break down initiatives, objectives, and action items into digestible segments. Perfect for business strategy sessions, planning workshops, or executive reports. Fully editable in PowerPoint, Canva, and Google Slides.


5 diapositivas
Team Role Distribution Matrix Presentation
Clarify responsibilities and improve collaboration with the Team Role Distribution Matrix Presentation. This RACI-style slide helps visualize team accountability across multiple tasks, making it ideal for project management, cross-functional teams, or workflow planning. Each layout option includes clearly labeled roles and color-coded responsibilities: Responsible, Accountable, Consulted, and Informed. Fully editable in Canva, PowerPoint, Keynote, and Google Slides.


6 diapositivas
Root Cause Analysis of Key Problems Presentation
Get to the heart of business issues with this Root Cause Analysis of Key Problems presentation. This template helps you break down complex challenges into actionable components: Who, What, When, Where, Why, and How. Clean, color-coded arrows ensure clarity. Ideal for strategic reviews and process optimization. Fully editable in Canva, PowerPoint, and Google Slides.


7 diapositivas
Time Management Goal Infographic
Time management is the process of organizing and planning how to divide your time between specific activities effectively and efficiently to achieve desired goals or outcomes. This infographic template is designed to empower you in mastering time, optimizing productivity, and seizing the day. This infographic provides a visually striking way to illustrate time management strategies, tips, and hacks for anyone looking to make the most of their time. Fully customizable and compatible with Powerpoint, Keynote, and Google Slides. This showcases time-bound tasks, emphasizing the importance of setting deadlines and managing tasks within periods.


6 diapositivas
Market Share Analysis Pie Chart
Clearly communicate competitive positioning with this market share pie chart layout. Ideal for showcasing data segments such as revenue splits, customer base percentages, or geographic market distribution. Each pie chart highlights a distinct insight, with editable text and values. Compatible with PowerPoint, Keynote, and Google Slides.


19 diapositivas
Kinetic Sales Forecast Presentation
Forecast your sales with style using this vibrant template! Perfect for detailing company overview, sales process, team, and strategy. Includes sections for case studies, pricing, and future opportunities. Ideal for sales teams to impress stakeholders. Compatible with PowerPoint, Keynote, and Google Slides.


5 diapositivas
Six Sigma DMAIC Process Flow Presentation
Streamline your process improvement with this Six Sigma DMAIC Flow template. Visually organize each stage—Define, Measure, Analyze, Improve, Control—using clean, professional layouts. Perfect for Lean Six Sigma projects, quality control, and operational excellence. Fully customizable in PowerPoint, Keynote, and Google Slides for versatile team presentations and process reviews.


8 diapositivas
7-Step Business Process Presentation
Streamline your workflow with this 7-Step Business Process template. Perfect for illustrating step-by-step strategies, milestones, and project phases. Easily customizable with editable colors, icons, and text to fit your brand. Enhance presentations with a professional, clean layout. Compatible with PowerPoint, Keynote, and Google Slides for seamless integration.


21 diapositivas
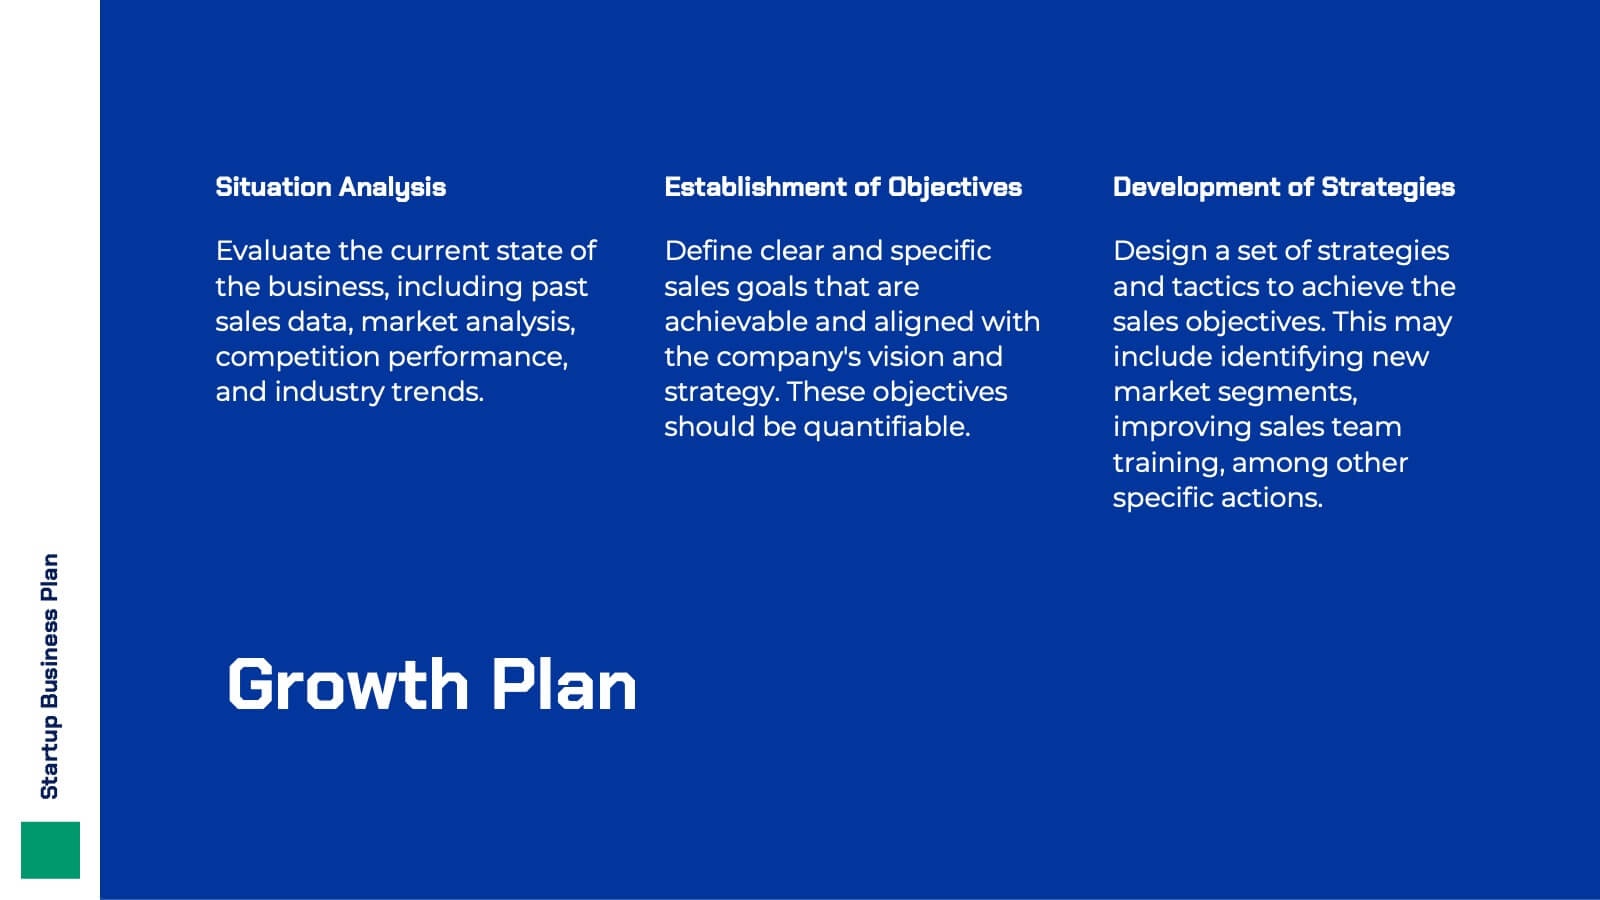
Hyperluma Startup Business Plan Presentation
Launch your vision with this startup business plan template, crafted to communicate your mission, market potential, and growth strategy with clarity and impact. Covering customer needs, unique value propositions, and financial projections, it’s ideal for entrepreneurs and founders. This template is compatible with PowerPoint, Keynote, and Google Slides, ready to fuel your startup’s journey.


26 diapositivas
Flyx Presentation Template
Flyx is a perfect modern template for you that is very easy to use. This template has a simple, clean, and basic design with high quality illustrations. It can be used for small businesses to large corporate companies and personal use as well. The design is minimal with white and different colors giving it a fresh look. Flyx is easy to edit and is perfect for branding presentations, you can change the colors with just one simple click. Pictures and charts are also made for easy editing as well as easy readability without too much confusion on reading. This template is easy to use and high quality making it suitable for all types of businesses. It is easy to create this modern and bold presentation that will deliver your message with an impact.


20 diapositivas
Alchemy Sales Forecast Presentation
Elevate your sales strategy with this sleek and modern sales forecast presentation template. Featuring sections for sales objectives, pricing strategies, performance metrics, and future opportunities, it’s perfect for teams aiming to analyze and plan effectively. Fully compatible with PowerPoint, Keynote, and Google Slides for seamless professional presentations.


10 diapositivas
Revenue Growth Strategies and Metrics Presentation
Highlight your key success drivers with the Revenue Growth Strategies and Metrics Presentation. This upward arrow-based layout is perfect for showcasing growth phases, financial KPIs, or strategic revenue initiatives. Clean, professional, and fully editable in PowerPoint, Keynote, and Google Slides—ideal for business reviews, sales pitches, and quarterly updates.


4 diapositivas
Business Plan in 4 Clear Steps
Break down your business strategy into four simple, actionable stages with this bold, visual template. Featuring a colorful quadrant layout inside a professional case graphic, it's perfect for business plans, roadmaps, or project overviews. Easily editable in PowerPoint, Keynote, and Google Slides.


5 diapositivas
Data Entry Infographics
Dive into the intricate world of information management with our data entry infographics. Cast in shades of blue, warm orange, and an array of inviting colors, this vertically styled template is a boon for business analysts, administrative assistants, and database managers. The design, punctuated with relevant graphics, icons, and strategic image placeholders, simplifies complex data narratives. It serves as a visual anchor, ensuring information accuracy and efficiency. This essential tool is instrumental for professionals striving to maintain data integrity while elucidating critical entry processes, thereby fostering a streamlined workflow.