


Características


¿Tienes alguna pregunta?
Recomendar


26 diapositivas
Corporate Social Responsibility (CSR) Presentation
Reinforce your commitment to positive impact with our Corporate Social Responsibility (CSR) presentation template, compatible with PowerPoint, Keynote, and Google Slides. This template is expertly crafted for businesses and organizations looking to present their CSR initiatives, environmental efforts, and community engagements. It features a professional yet inviting design with green accents to symbolize the commitment to sustainability. The template offers a variety of slide types to cover all aspects of your CSR strategy. Use 'process infographics' to outline your sustainable practices, 'mind map infographics' to explore the impact of your activities, and 'chart slides' to present your social and environmental achievements quantitatively. Our CSR template is not just for presentations; it's a statement of your organization's values and dedication to making a difference. Download it now to communicate your CSR goals and actions with clarity and inspire your stakeholders to join you in driving change for a better world.


6 diapositivas
Milestones Technologies Infographics
Highlight significant milestones in technology with our Milestones Technologies infographic template. This template is fully compatible with popular presentation software like PowerPoint, Keynote, and Google Slides, allowing you to easily customize it to showcase pivotal moments and achievements in the world of technology. The Milestones Technologies infographic template offers a visually engaging platform to chronicle and celebrate key technological advancements, innovations, and breakthroughs throughout history. Whether you're a tech enthusiast, educator, or simply interested in technological progress, this template provides a user-friendly canvas to create informative presentations and educational materials. Deepen your appreciation for the impact of technology with this SEO-optimized Milestones Technologies infographic template, thoughtfully designed for clarity and ease of use. Customize it to highlight milestones across various fields, from computing and telecommunications to space exploration and biotechnology, making it a valuable resource for sharing the history of technology with your audience. Start crafting your personalized infographic today to explore the remarkable journey of technological progress.


6 diapositivas
Create Challenge Infographic
Challenges are obstacles, difficulties, or problems that individuals, organizations, or societies face while trying to achieve their goals or navigate through various situations. This infographic template involves visually presenting a specific challenge, its context, and possible solutions in an informative way. Summarize the key takeaways from the infographic, emphasizing the importance of addressing the challenge and implementing the suggested solutions. An effective challenge infographic can be used for educational purposes, presentations, or as a reference guide to help individuals and teams overcome challenges in a structured and informed manner.


22 diapositivas
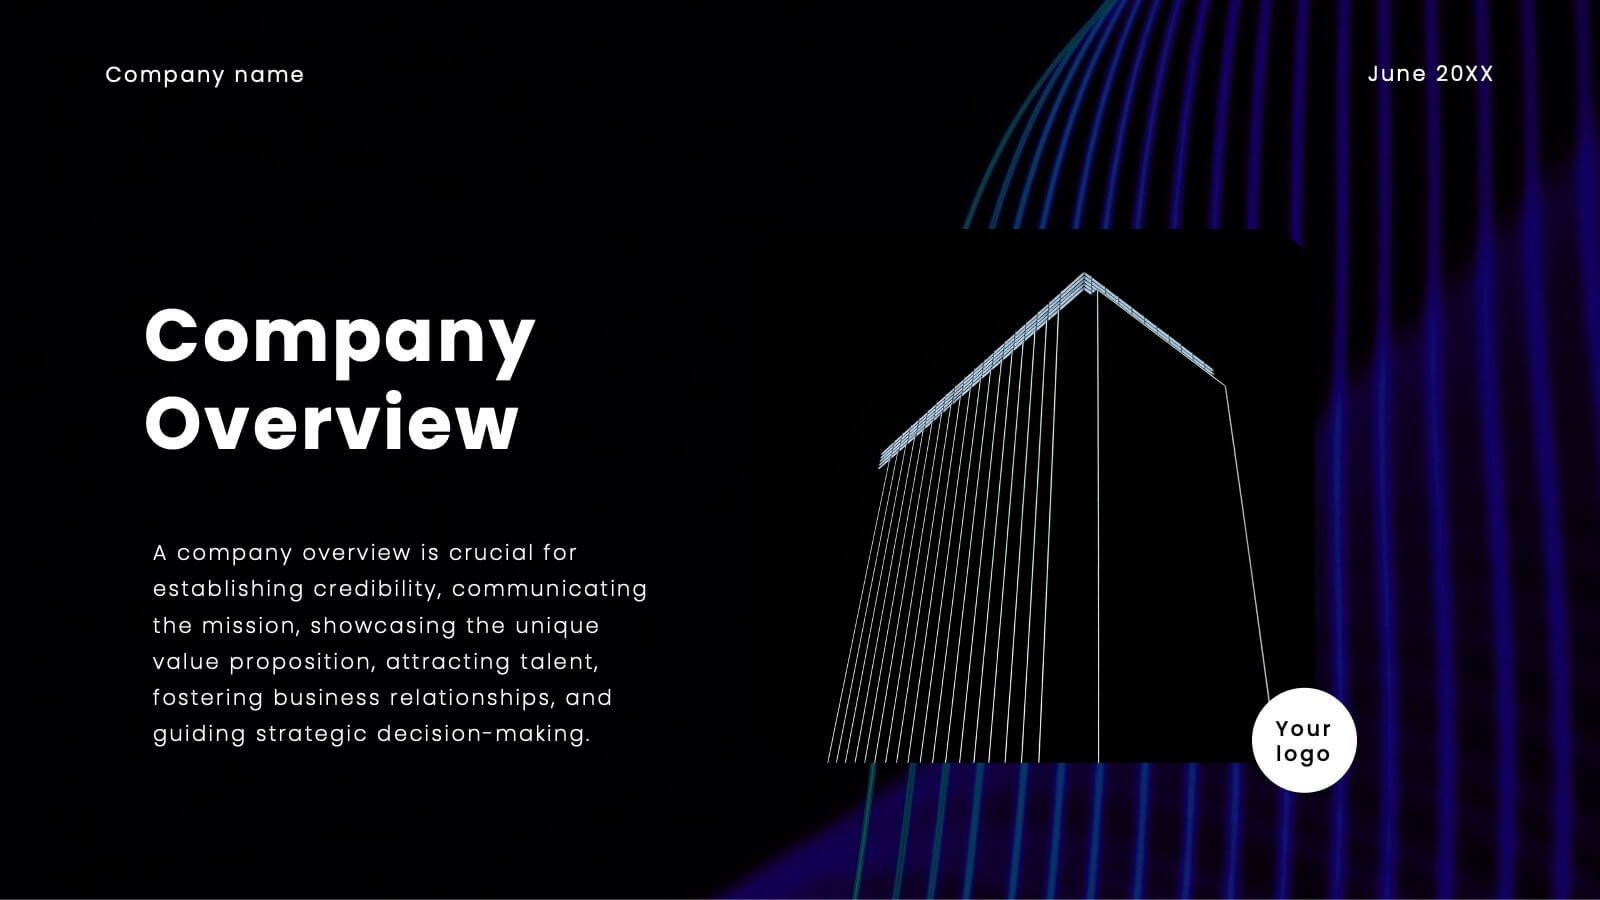
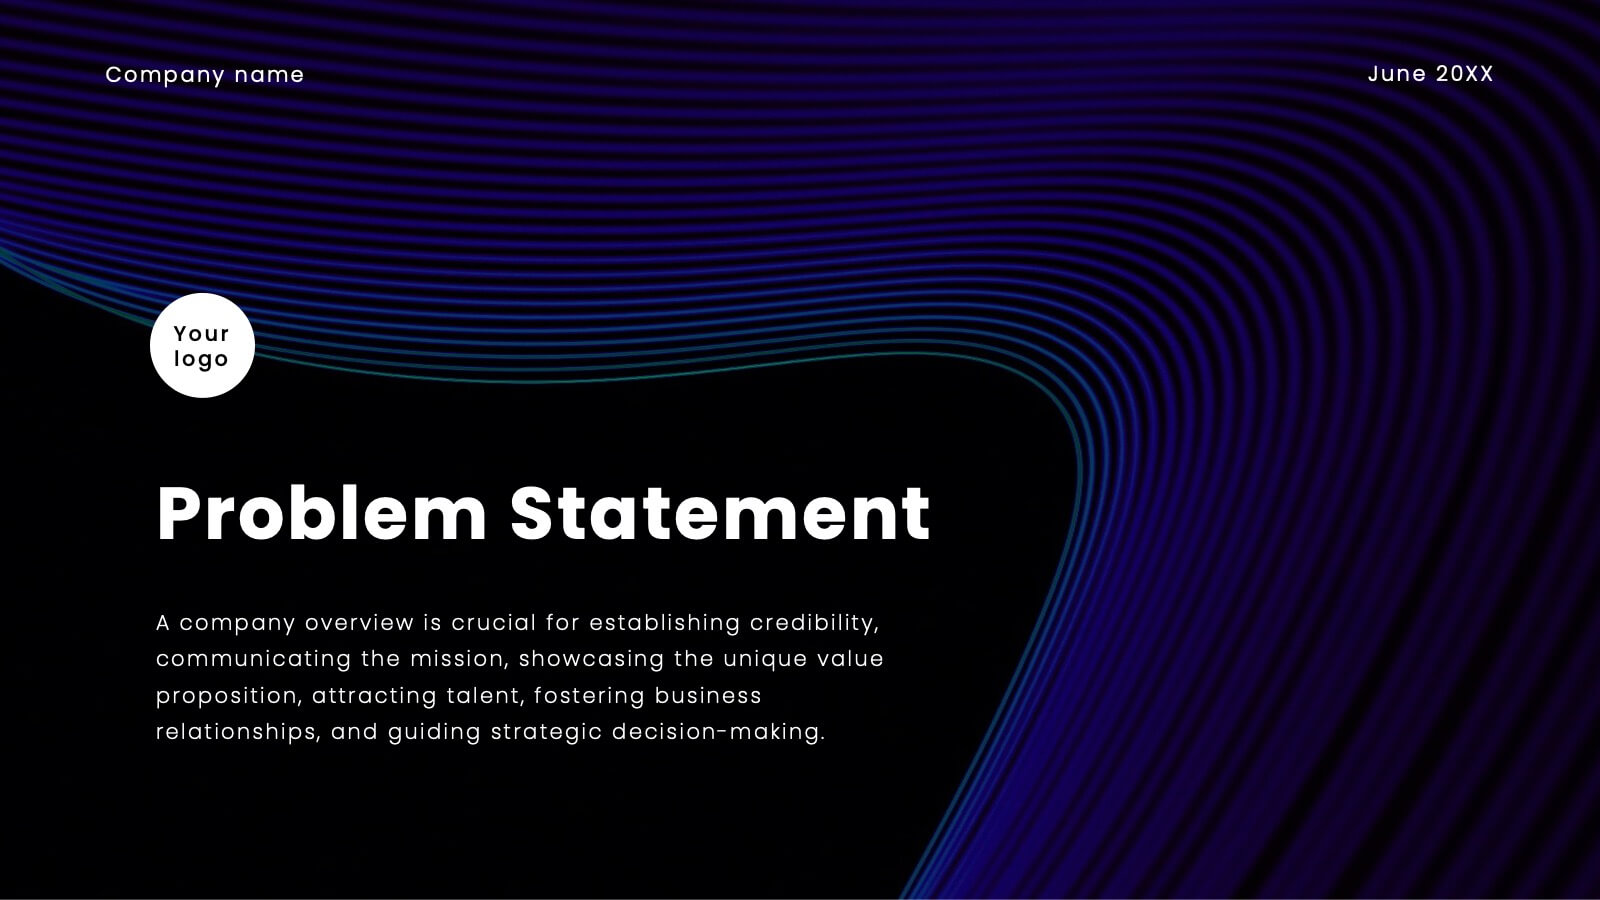
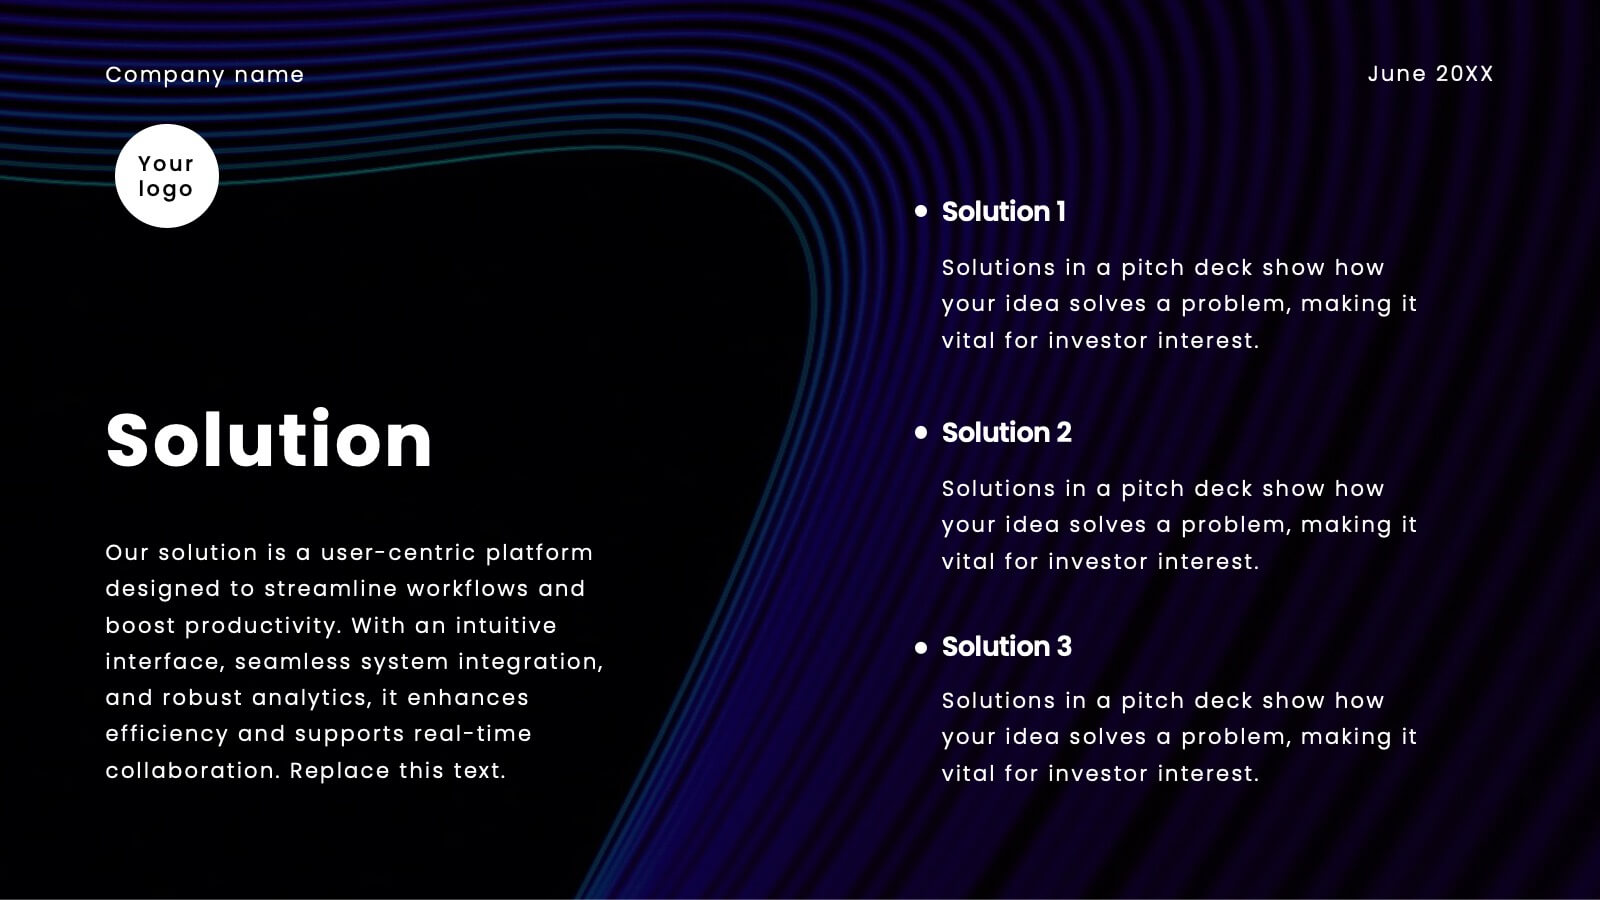
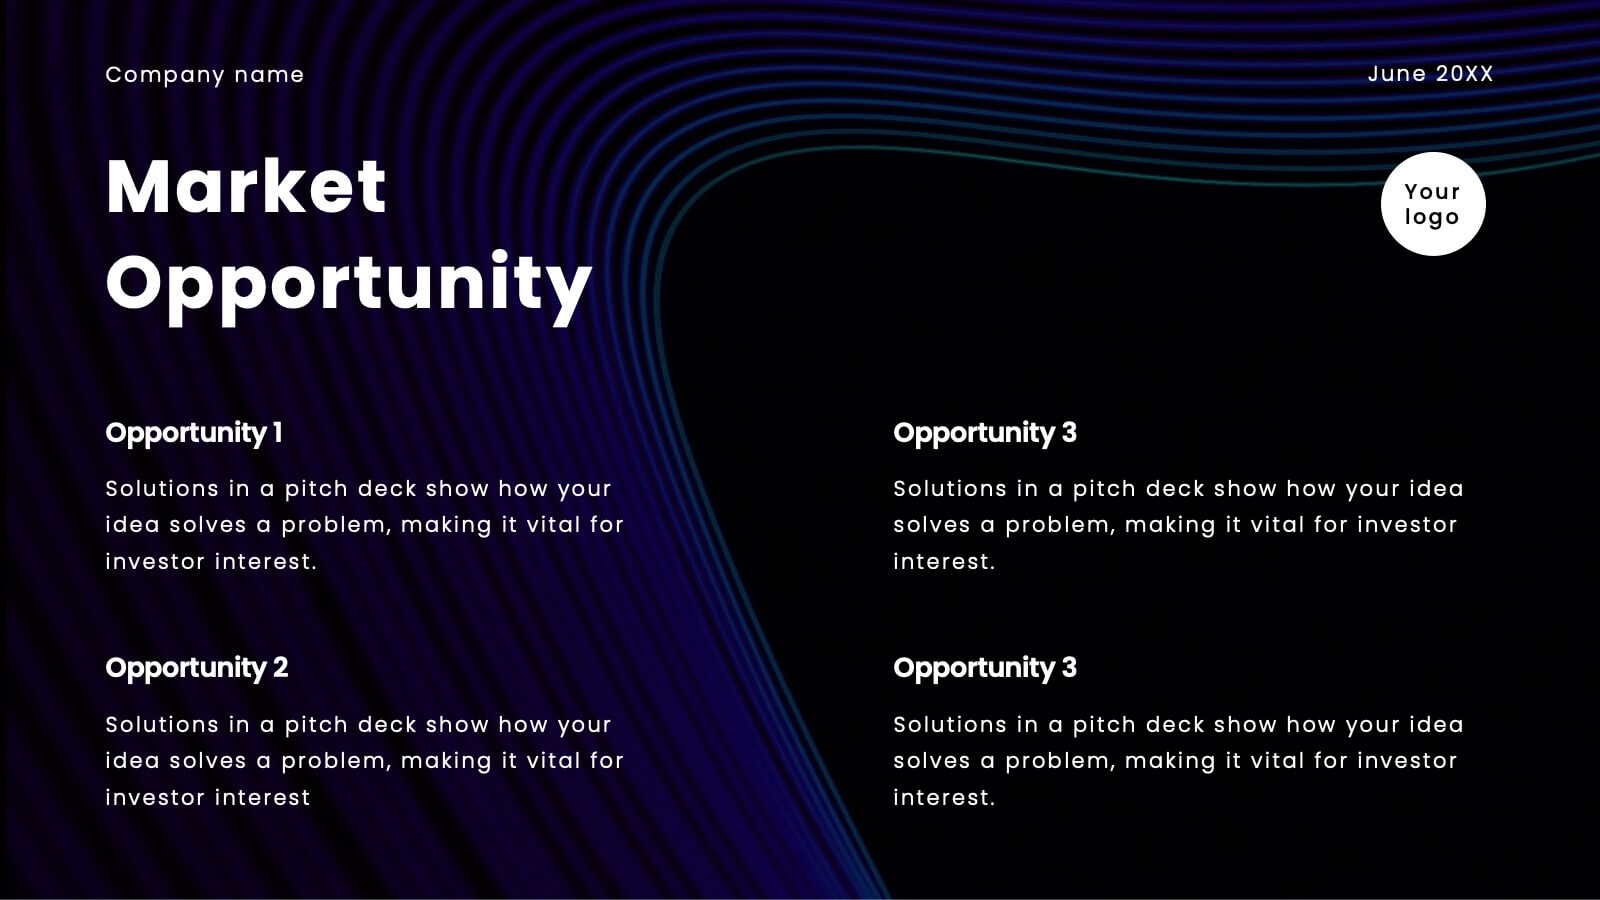
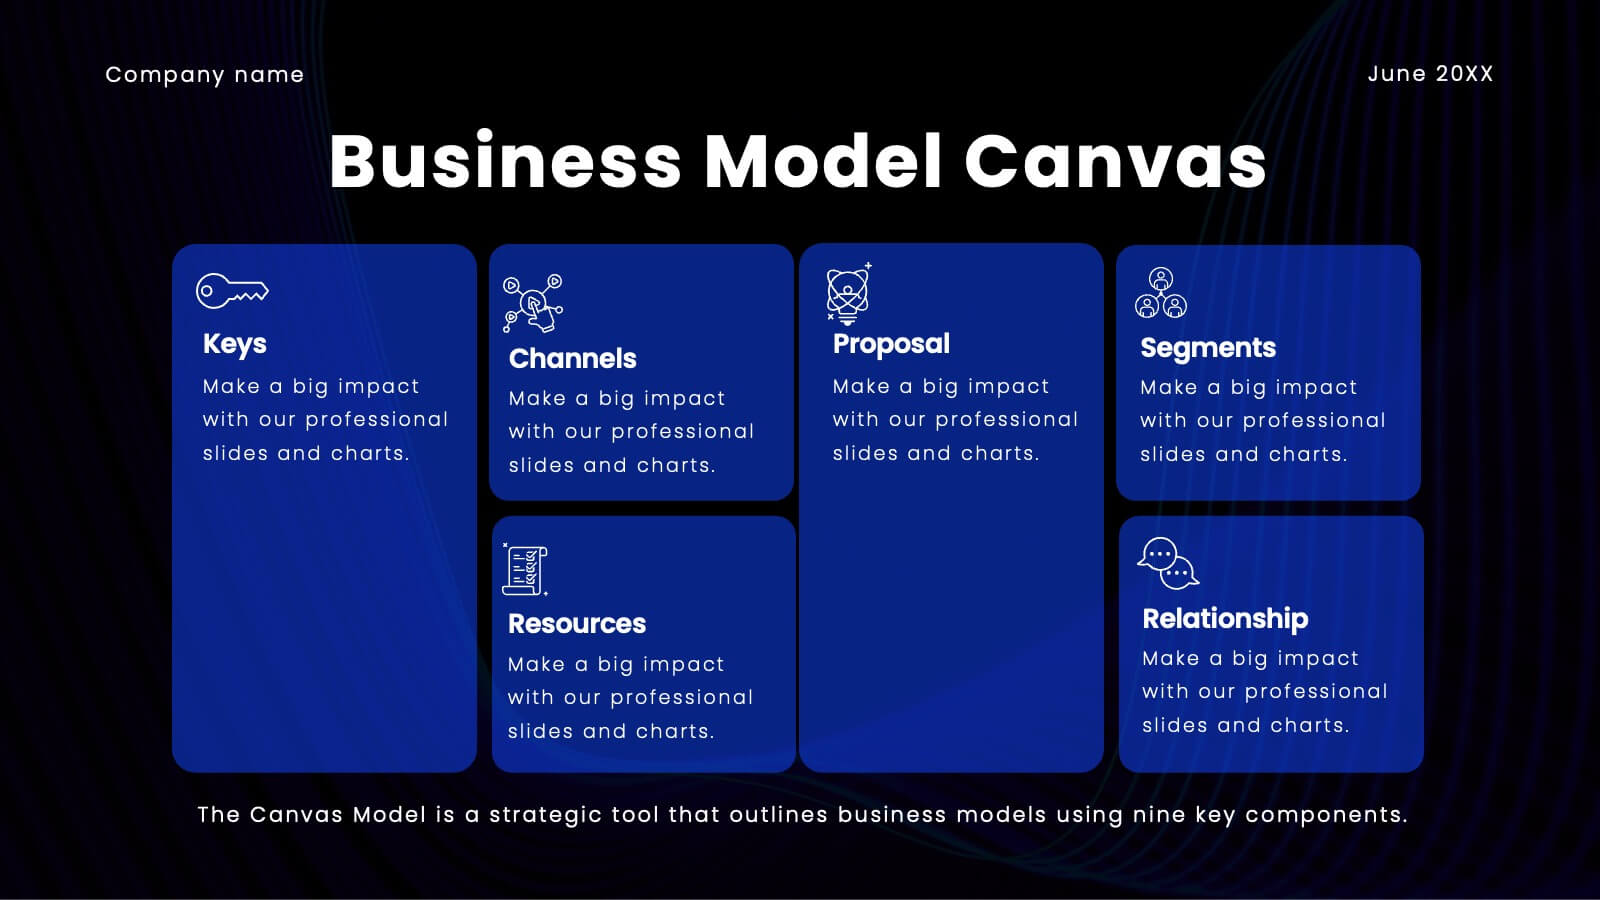
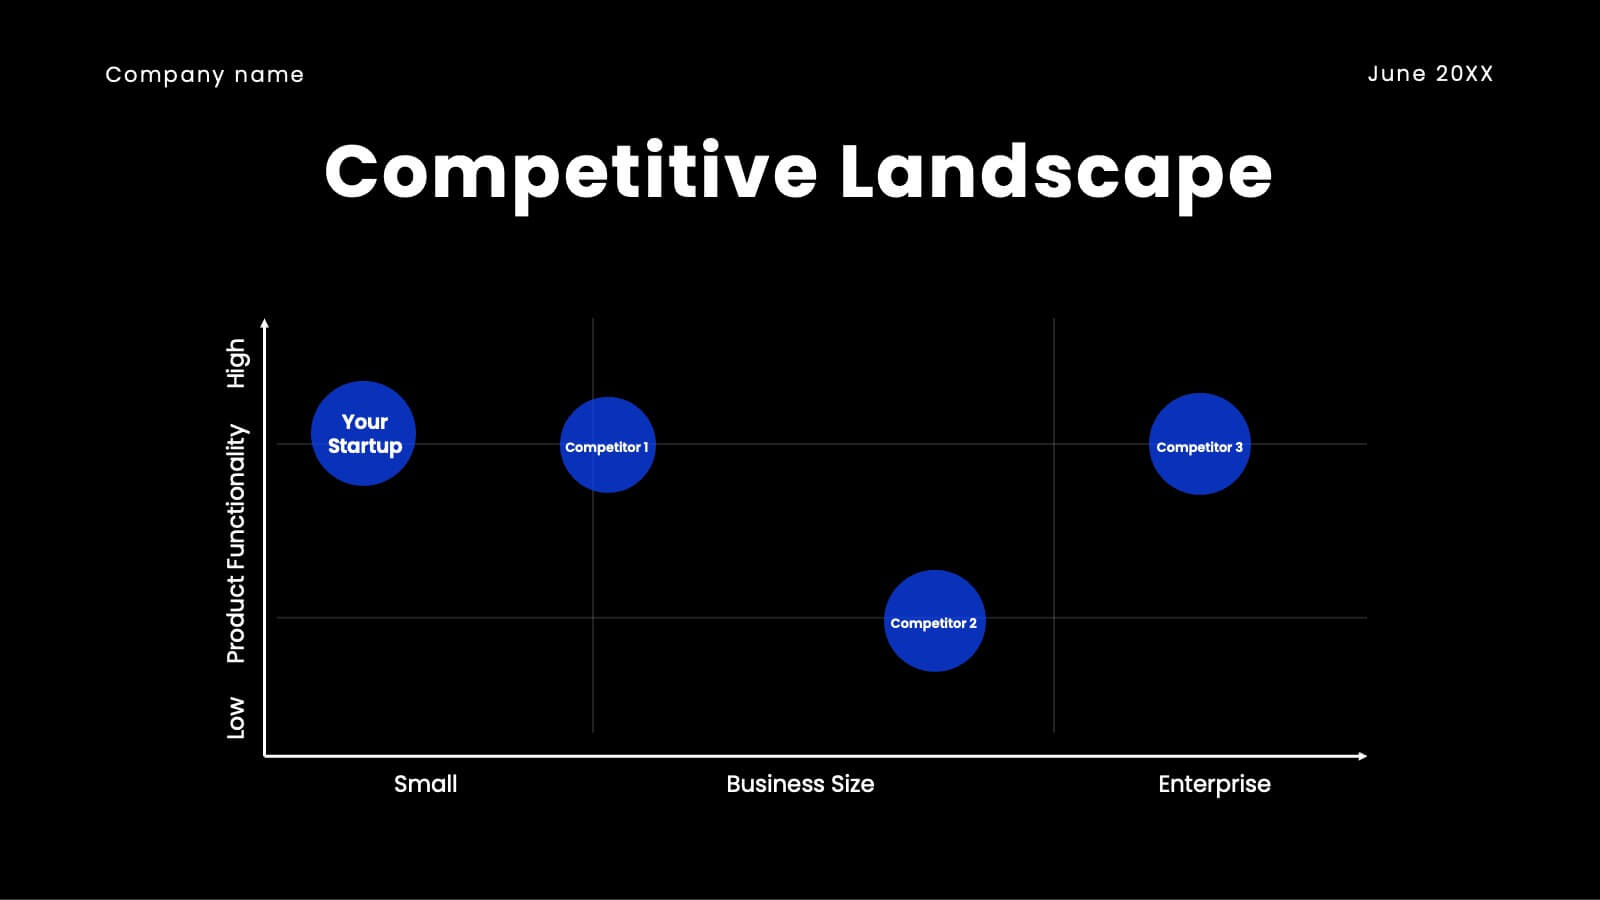
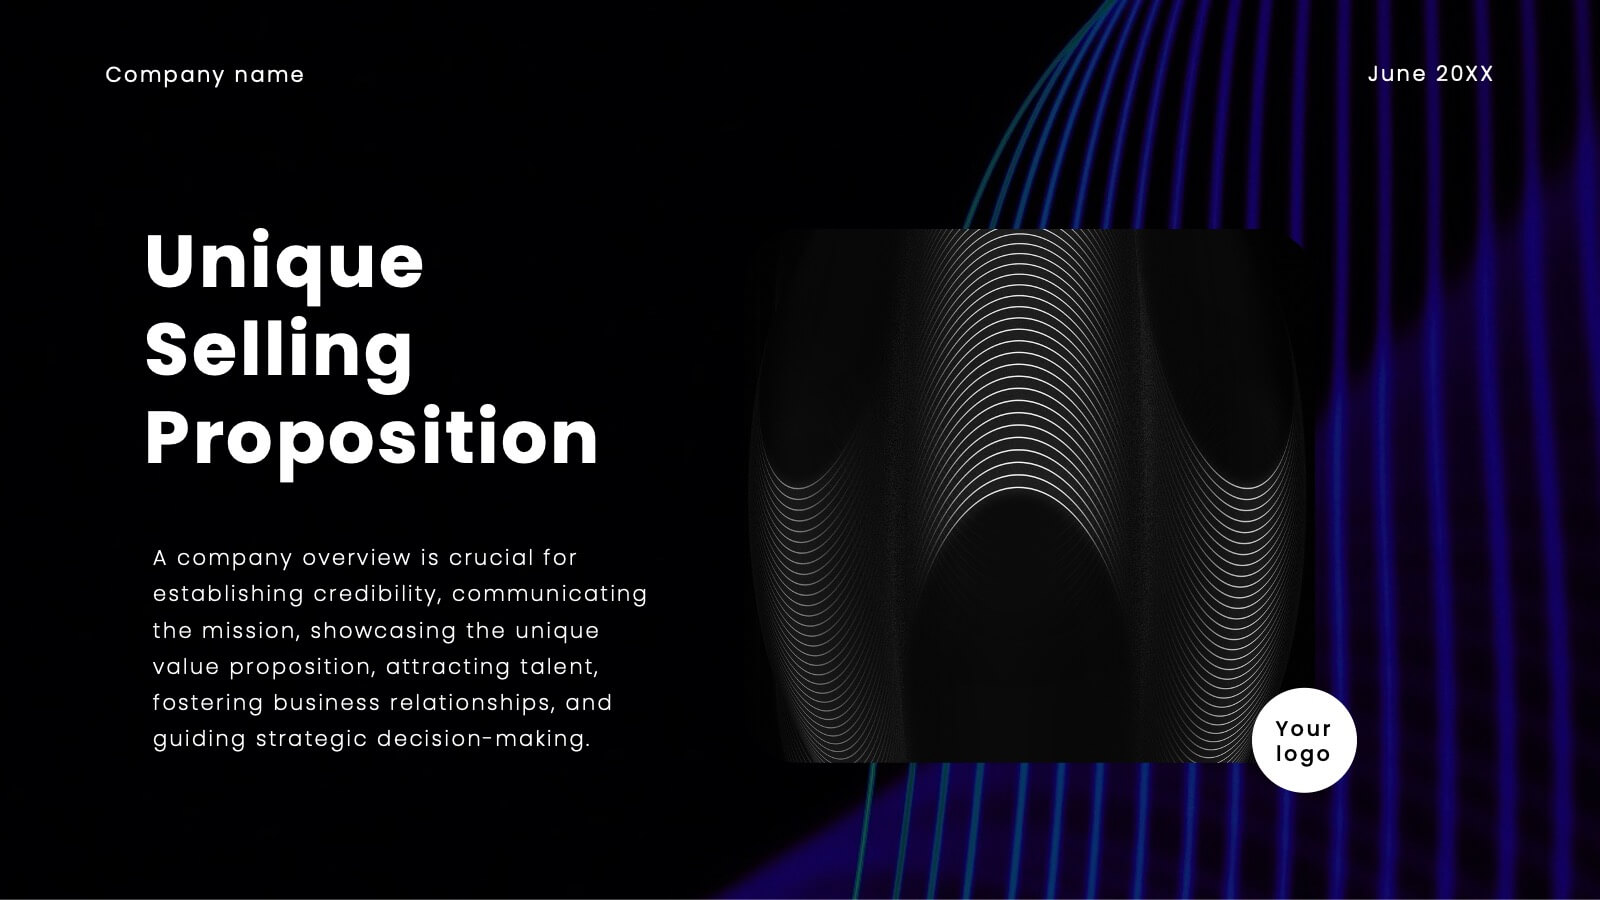
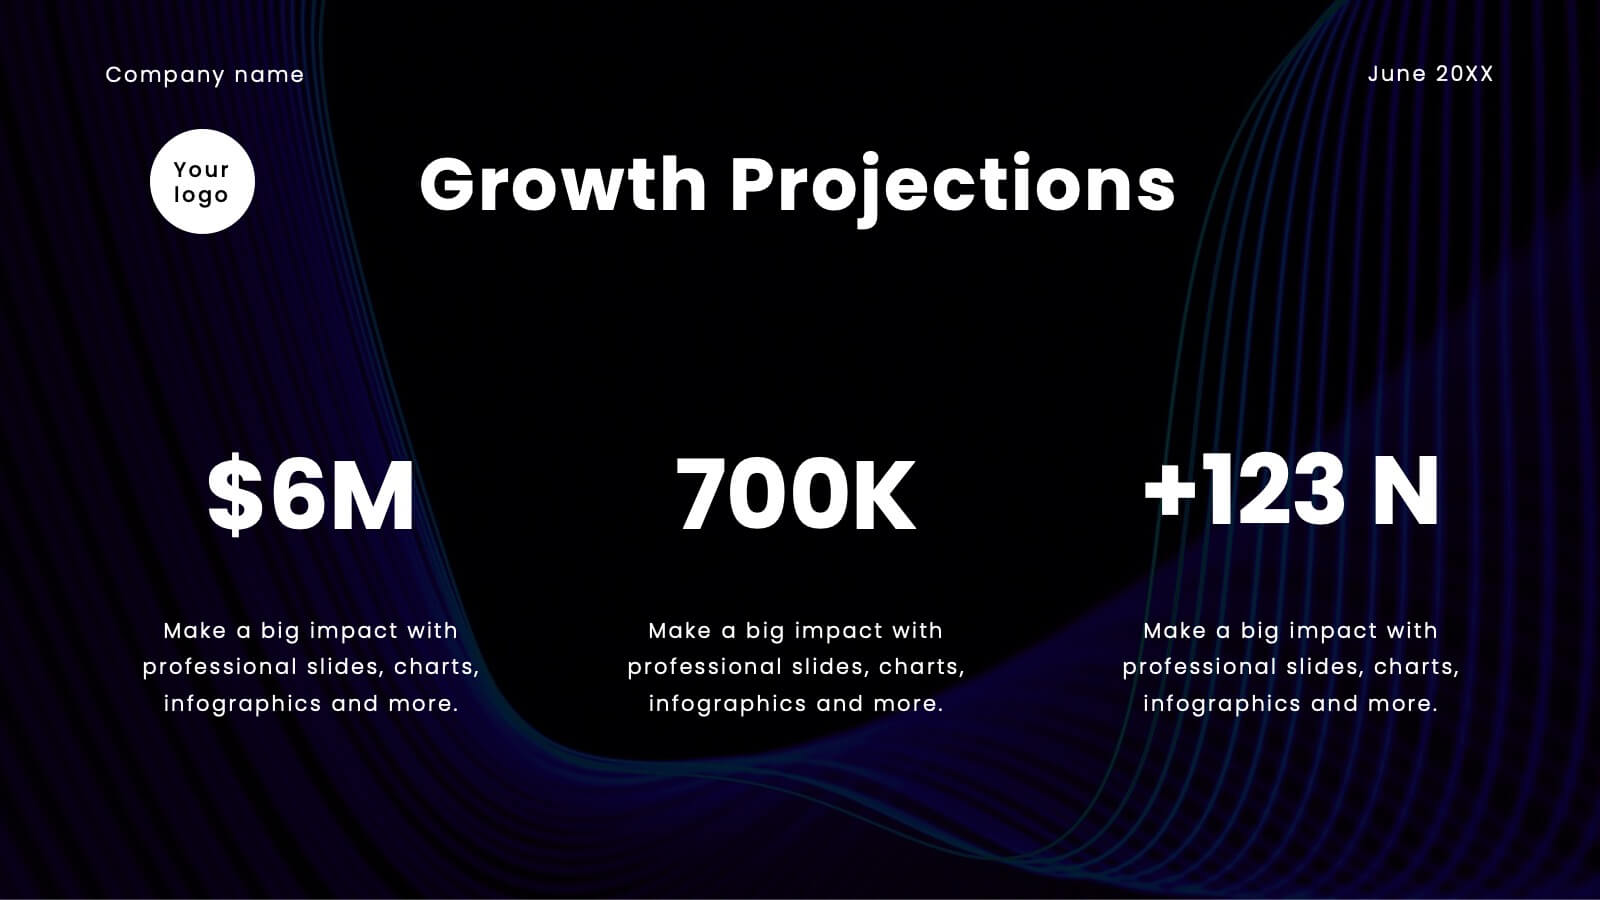
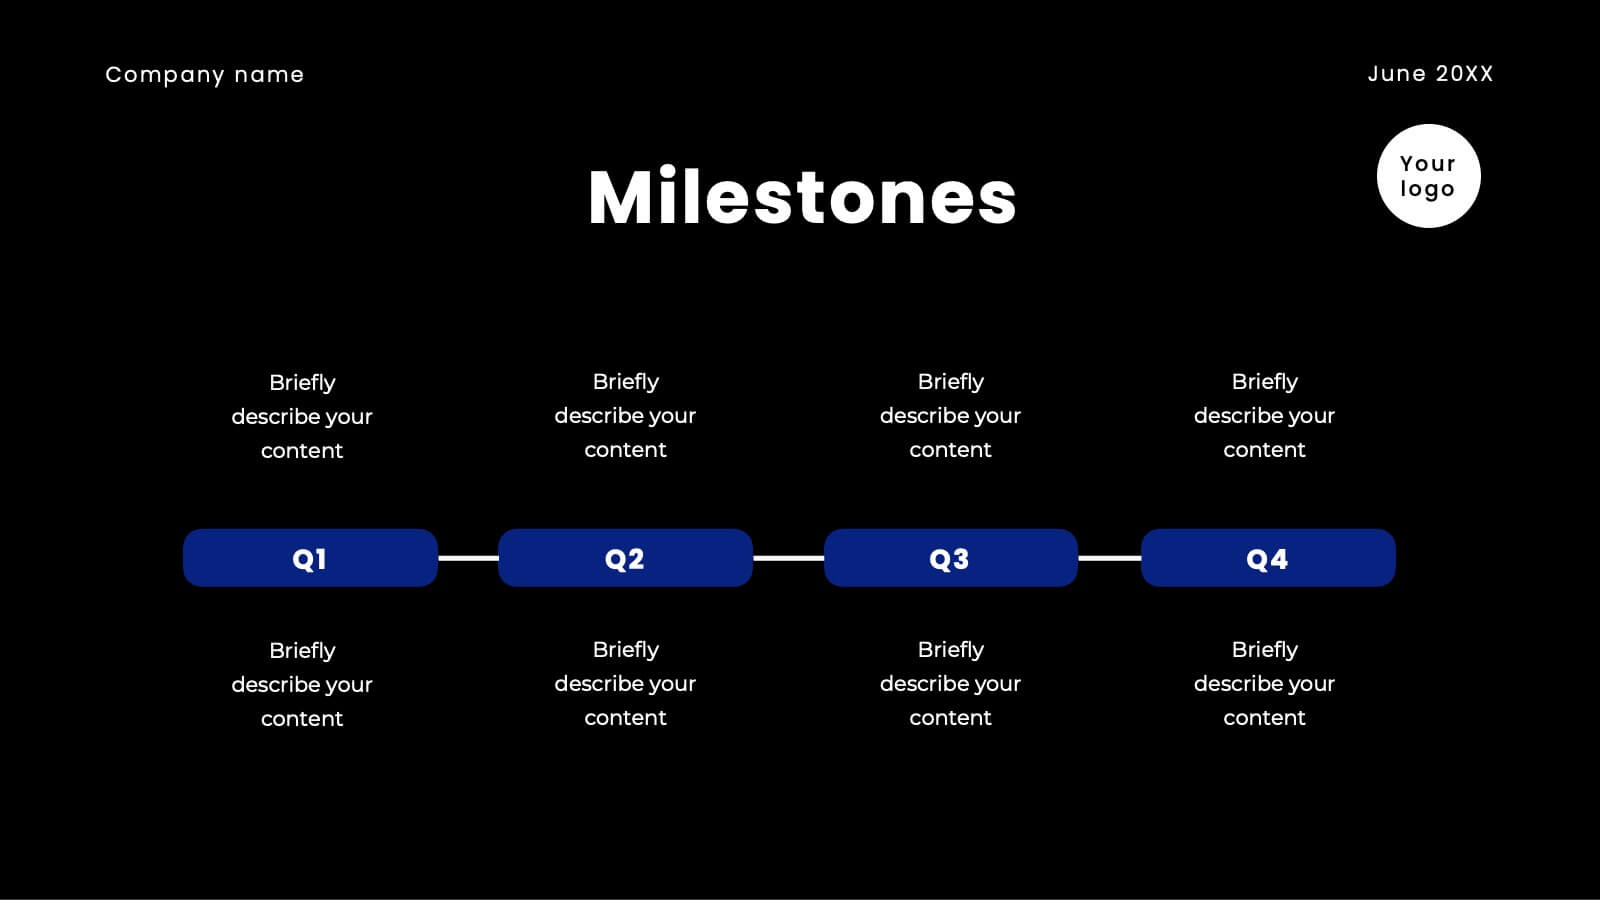
Jolt Business Idea Pitch Deck Presentation
Prepare to electrify your audience with a pitch deck that’s nothing short of spectacular! This high-impact template is designed to captivate, engage, and persuade your stakeholders with every slide. It’s more than just a presentation; it’s your gateway to showcasing your company’s unique value proposition, innovative solutions, and future growth potential in a way that’s visually stunning and incredibly compelling. From the moment you unveil your company overview to the final slide on financials and funding requirements, this template ensures your pitch is memorable, powerful, and impossible to ignore. The sleek, modern design highlights your strategic vision, competitive advantages, and market opportunities, making a bold statement that you’re ready to lead the future. Compatible with PowerPoint, Keynote, and Google Slides, this pitch deck template is your ultimate tool for turning heads and securing buy-in from investors, partners, and clients alike!


7 diapositivas
Governance Infographics Presentation Template
Our Governance Infographic is designed to present complex information in an easy-to-understand format that is accessible to a wide audience. This template gives you the opportunity to create an infographic that is easy on the eye, but thorough and detailed enough to make sure all the points are covered. This template includes 7 slides that present a comprehensive framework for monitoring and evaluating a company's governance, risk management, and compliance programs. Packed with great content, this presentation tells the story of your governance system. Get started easily by adding your text!


21 diapositivas
Ecliptica Design Strategy Proposal Presentation
Elevate your design strategy proposals with this clean and professional presentation template. Featuring a structured layout, it covers essential sections like design briefs, target audience analysis, concept development, and final presentation deliverables. Visuals such as wireframes, design process breakdowns, and project timelines help convey your creative ideas effectively. With placeholders for typography, color schemes, and visual direction, this template is tailored for creative professionals, agencies, and designers. Easily adaptable to suit your branding needs, it's compatible with PowerPoint, Google Slides, and Keynote for seamless customization and presentation. Perfect for pitching new strategies or showcasing your design process.


5 diapositivas
Defining Target Market and Audience Presentation
Identify and segment your ideal customer base with this visually structured pyramid slide. Designed to represent layered audience demographics or buyer personas, each level allows space for detailed insights and strategy alignment. The accompanying icons and side labels enhance clarity and storytelling for marketing, branding, or campaign planning presentations. Fully editable in PowerPoint, Keynote, and Google Slides to fit your branding and messaging needs.


4 diapositivas
Highlighting Key Business Benefits Presentation
Unlock your brand's value with the Highlighting Key Business Benefits Presentation. This modern slide layout uses a visual key concept to emphasize four essential advantages, helping your audience quickly grasp your core offerings. Ideal for sales pitches, service overviews, or value proposition discussions. Fully editable and compatible with PowerPoint, Keynote, and Google Slides.


6 diapositivas
Business Performance Pie Chart
Visualize your key metrics clearly with this pie chart-style performance layout. Designed for business reviews and strategic updates, it breaks down five data categories into easy-to-read segments. Ideal for quarterly performance slides, team dashboards, and KPI tracking. Fully editable in PowerPoint, Keynote, and Google Slides.


6 diapositivas
Quarterly Sales Overview Presentation
Bring your numbers to life with a clear, colorful layout that makes quarterly progress instantly easy to understand. This presentation helps you break down trends, compare performance across quarters, and highlight key insights with simple bar visuals. Perfect for reports and meetings, and fully compatible with PowerPoint, Keynote, and Google Slides.


8 diapositivas
Brainstorming Visualization
Spark creativity with the Brainstorming Visualization Presentation—a dynamic diagram built to energize your ideation process. Featuring a lightning bolt cloud as the central symbol, this layout radiates out to four key thought nodes, each with space to highlight insights, solutions, or topics. Ideal for team ideation, strategic planning, or mind mapping. Fully editable in PowerPoint, Keynote, and Google Slides.


5 diapositivas
Marijuana Industry Infographics
The Marijuana Industry refers to the cultivation, production, distribution, and sale of marijuana or cannabis-related products. These vertical infographics are designed to provide an overview of the marijuana industry. They offer a comprehensive look at the various aspects of the industry, including its history, growth, legalization, medical and recreational uses, and more. Inform and educate your viewers about the various aspects of the marijuana industry. Present data, trends, and insights related to the industry. This template is an effective tool for presenting key information about the marijuana industry in a visually engaging manner.


8 diapositivas
Social Media Strategy Presentation
The "Social Media Strategy Presentation" template is designed to outline effective social media strategies using a clear, visually appealing layout. This template segments essential components of a social media plan into categorized blocks, each designated for a specific platform or strategy component such as Facebook, Instagram, Twitter, and TikTok. The design includes icons that visually represent each platform, enhancing readability and engagement. This layout is ideal for digital marketers, social media managers, or businesses presenting their social media plans internally or in client meetings, ensuring each segment of their strategy is communicated clearly and effectively.


6 diapositivas
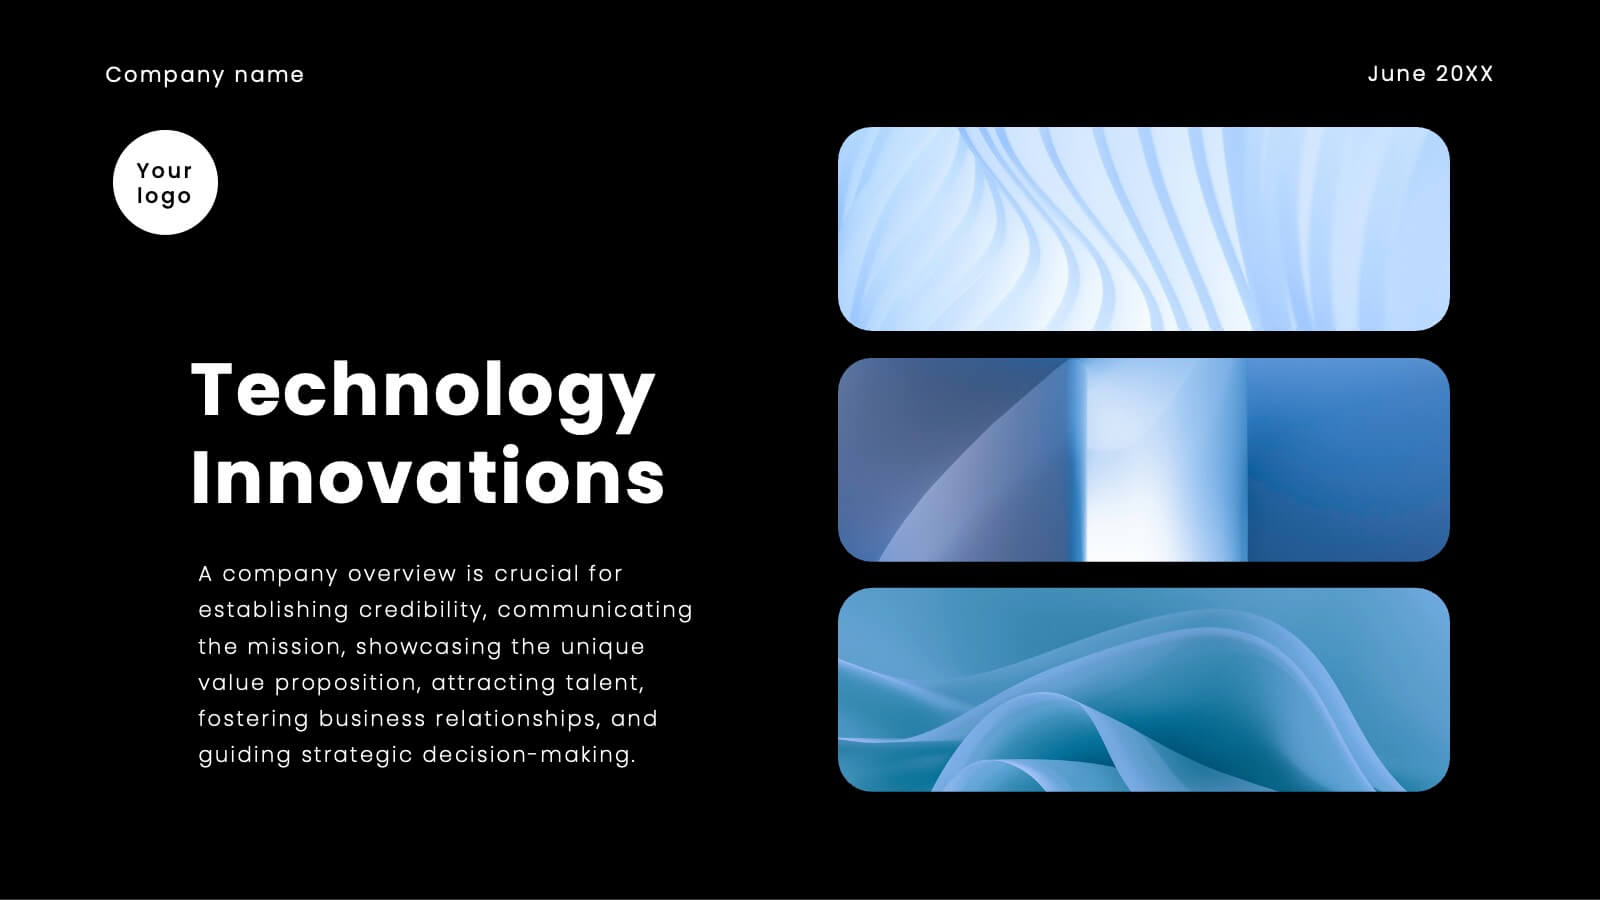
Technology Trends Overview Presentation
Step into the future with a sleek visual that maps out emerging ideas in a way anyone can follow. This presentation helps you break down key innovations, highlight major shifts, and explain how new technologies influence your strategy. Ideal for reports and trend discussions. Fully compatible with PowerPoint, Keynote, and Google Slides.
5 diapositivas
Performance Progress Tracking Presentation
Monitor performance with precision using this Performance Progress Tracking template. This visually engaging dashboard helps you track progress across multiple stages, from planning to testing. With interactive bar graphs and percentage indicators, you can evaluate real-time performance, identify bottlenecks, and make data-driven decisions. Fully customizable for PowerPoint, Keynote, and Google Slides, ensuring seamless adaptability.


6 diapositivas
Project Proposal Goals Infographic
Maximize the impact of your project proposals with this professional collection of templates, designed to outline your project goals and strategies with precision. Each template facilitates clear communication of project objectives, timelines, and the desired outcomes, making them essential for project managers, consultants, and business analysts. These slides are crafted with a clean, corporate design that uses a harmonious blend of blue tones, engaging charts, and concise content layouts. This ensures that key points are easily digestible and effectively conveyed to stakeholders. The structured format of these templates is ideal for detailing the scope of work, expected milestones, and resource allocation, supporting a comprehensive overview of your project plan. Customize these templates to align with your organization's branding and project specifics, enhancing your presentation and strengthening the proposal's persuasive power. Whether for internal briefings or external pitches, these slides are tailored to help you present a coherent and compelling case for your projects.


6 diapositivas
TAM SAM SOM Market Infographic
TAM, SAM, and SOM are terms used in business and marketing to represent different levels of market potential and segmentation. This Infographic is a visual representation that explains the concepts of Total Addressable Market (TAM), Serviceable Available Market (SAM), and Serviceable Obtainable Market (SOM) in the context of business and market analysis. This template will encourage your audience to share this infographic to help make informed decisions about market strategies and growth potential. Compatible with Powerpoint, Keynote, and Google Slides. Summarize the benefits of the TAM SAM SOM in market analysis concepts.