


Características


¿Tienes alguna pregunta?
Recomendar


6 diapositivas
Professional Business Plan Presentation
Make every idea count with a clean, professional presentation that helps you communicate your business strategy clearly and confidently. Ideal for showcasing goals, market insights, and performance plans, it delivers structure with style. Fully compatible with PowerPoint, Keynote, and Google Slides for easy customization and seamless presentation design.


5 diapositivas
Pet Care Infographics
Pet care refers to the practices and actions taken to ensure the well-being, health, and happiness of pets. These vertical infographic templates are perfect for providing essential information and tips for pet owners to ensure the well-being and proper care of their furry companions. This infographic is designed to present key aspects of pet care in a concise and engaging manner, making it a valuable resource for pet owners, veterinarians, pet stores, or any organization related to pet care. Compatible with Powerpoint, Keynote, and Google Slides. Use the text boxes and graphs to promote responsible pet ownership and provide valuable information about pet care.


7 diapositivas
Law and Compliance Presentation
Bring order and precision to your reports with this modern, structured layout designed to simplify complex regulations and policies. Perfect for presenting legal processes, compliance updates, or governance strategies, it blends professionalism with clarity. Fully compatible with PowerPoint, Keynote, and Google Slides for seamless editing and presentation flexibility.


7 diapositivas
Problem Infographic
These slides focus on presenting problem statements and their contexts in a professional and accessible format. The use of a soft, consistent color palette helps to keep the presentation visually appealing while ensuring that the content remains the focal point. Each slide is designed with ample space for text and icons, which aids in breaking down complex issues into understandable segments. The variety of layouts ensures that you can tailor the presentation to the nature of the problem being addressed, whether it requires more textual explanations or benefits from the use of infographics and icons. These templates are well-suited for business meetings, academic presentations, or any scenario where clear communication of challenges is necessary. They can be effectively used to initiate discussions, brainstorm solutions, or simply to highlight issues that need attention in a structured and organized manner.


6 diapositivas
Time Management Benefits Infographics
Unlock the benefits of effective time management with our Time Management Benefits infographic template. This template is fully compatible with popular presentation software like PowerPoint, Keynote, and Google Slides, allowing you to easily customize it to illustrate and communicate the advantages of mastering your time. The Time Management Benefits infographic template offers a visually engaging platform to highlight the positive outcomes of efficient time management, including increased productivity, reduced stress, improved work-life balance, and more. Whether you're a professional, student, or anyone looking to make the most of their time, this template provides a user-friendly canvas to create informative presentations and educational materials. Optimize your time management skills with this SEO-optimized Time Management Benefits infographic template, thoughtfully designed for clarity and ease of use. Customize it to showcase specific benefits, time-saving techniques, tools, and strategies for effective time management, ensuring that your audience understands the value of this essential skill. Start crafting your personalized infographic today to reap the rewards of improved time management.


3 diapositivas
Introduction to Cryptocurrency Presentation
Step into the future of finance with this sleek, modern template designed to explain digital currencies in a simple, engaging way. Perfect for educators, startups, and analysts, it transforms complex ideas into clear visuals. Fully compatible with PowerPoint, Keynote, and Google Slides for effortless editing and professional presentations.


10 diapositivas
Business Growth through Target Market Analysis Presentation
Showcase how strategic insights drive expansion with this step-by-step infographic. Designed with layered growth icons and space for titles and text, this layout helps illustrate the phases of market targeting, consumer profiling, and sales development. Perfect for marketing strategies, business development roadmaps, and client presentations. Fully customizable in PowerPoint, Keynote, and Google Slides


6 diapositivas
Pyramid-Triangle Visual Logic Presentation
Present interconnected concepts with clarity using the Pyramid-Triangle Visual Logic Presentation. This layout uses a hexagonal pyramid structure to show relationships between six ideas or categories, making it ideal for strategy models, balanced frameworks, or multi-step solutions. Each section includes a title, icon, and editable content block to ensure clarity and customization. Compatible with PowerPoint, Keynote, and Google Slides.


8 diapositivas
7-Step Business Process Presentation
Streamline your workflow with this 7-Step Business Process template. Perfect for illustrating step-by-step strategies, milestones, and project phases. Easily customizable with editable colors, icons, and text to fit your brand. Enhance presentations with a professional, clean layout. Compatible with PowerPoint, Keynote, and Google Slides for seamless integration.


21 diapositivas
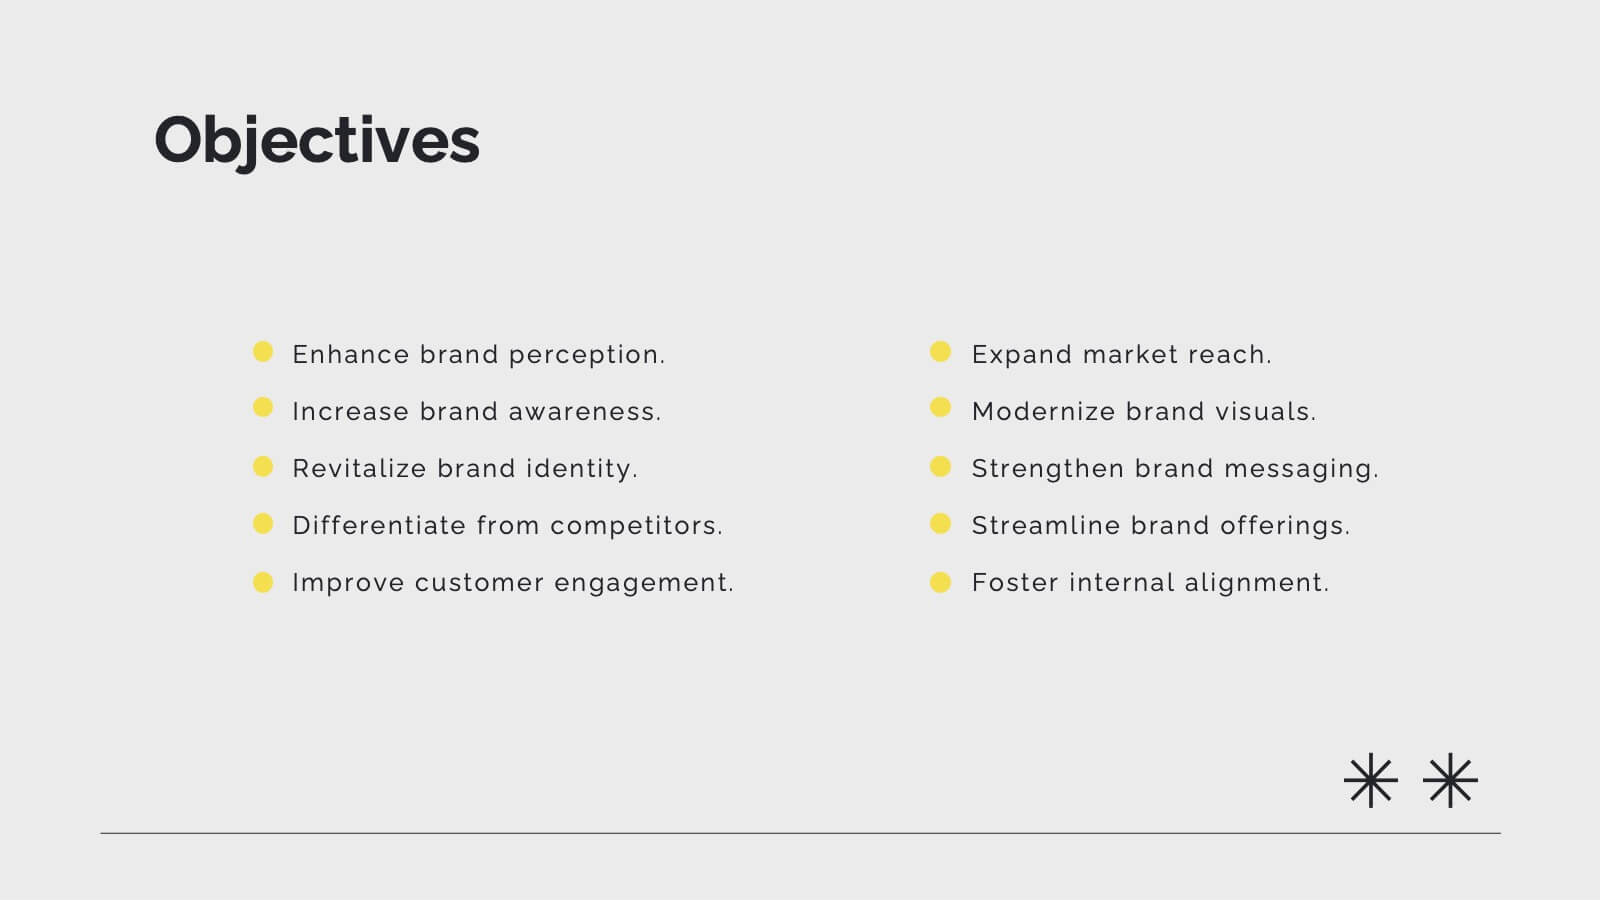
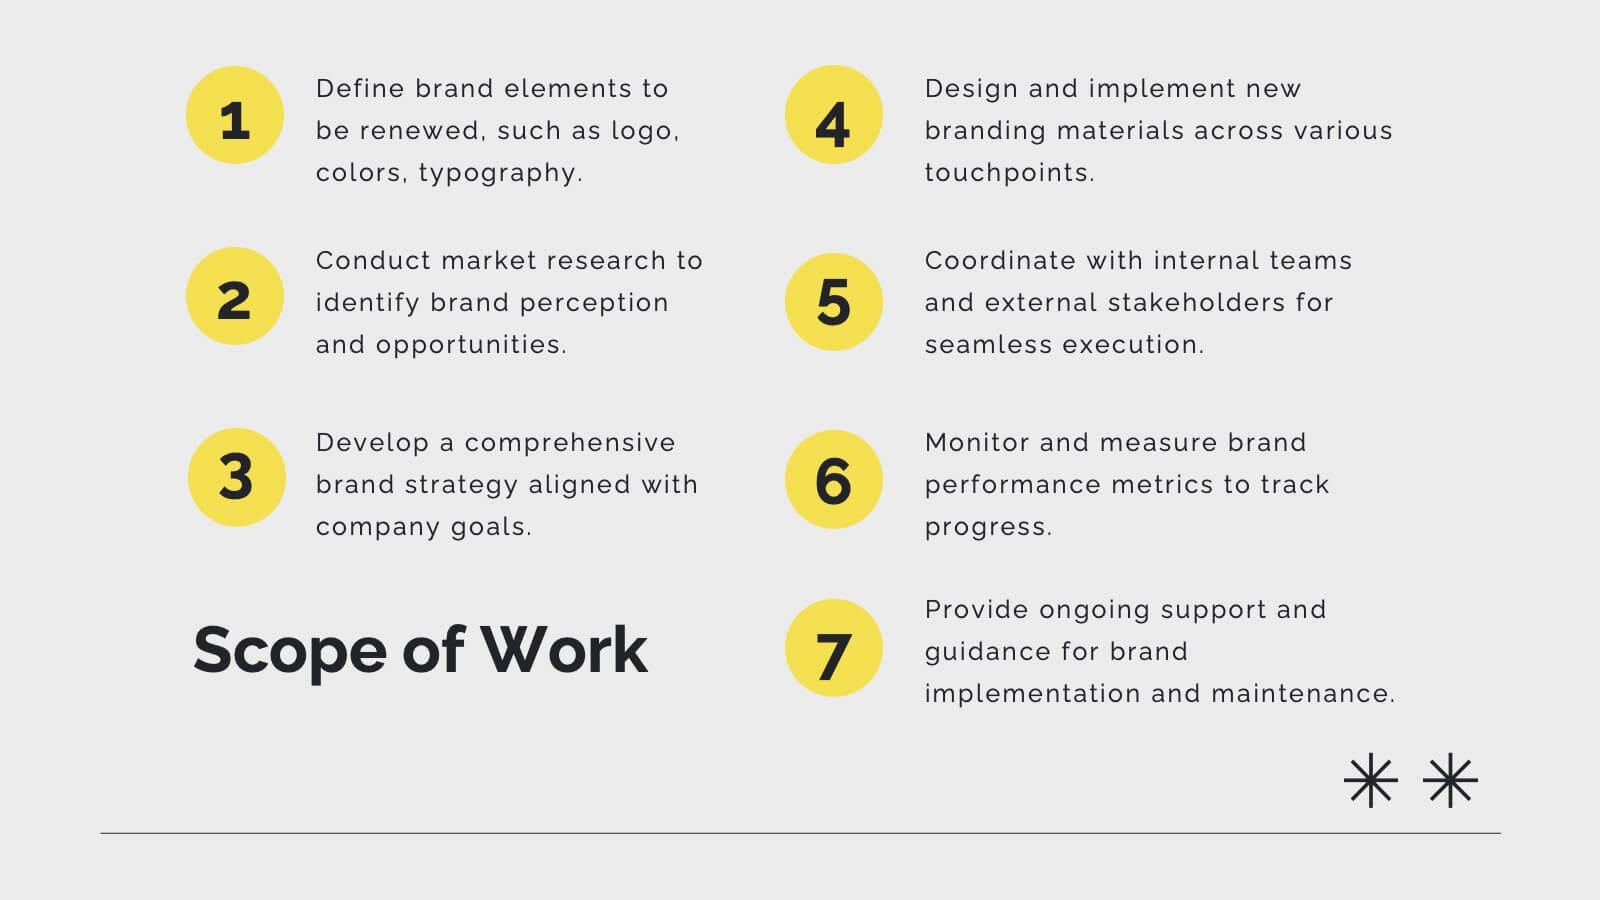
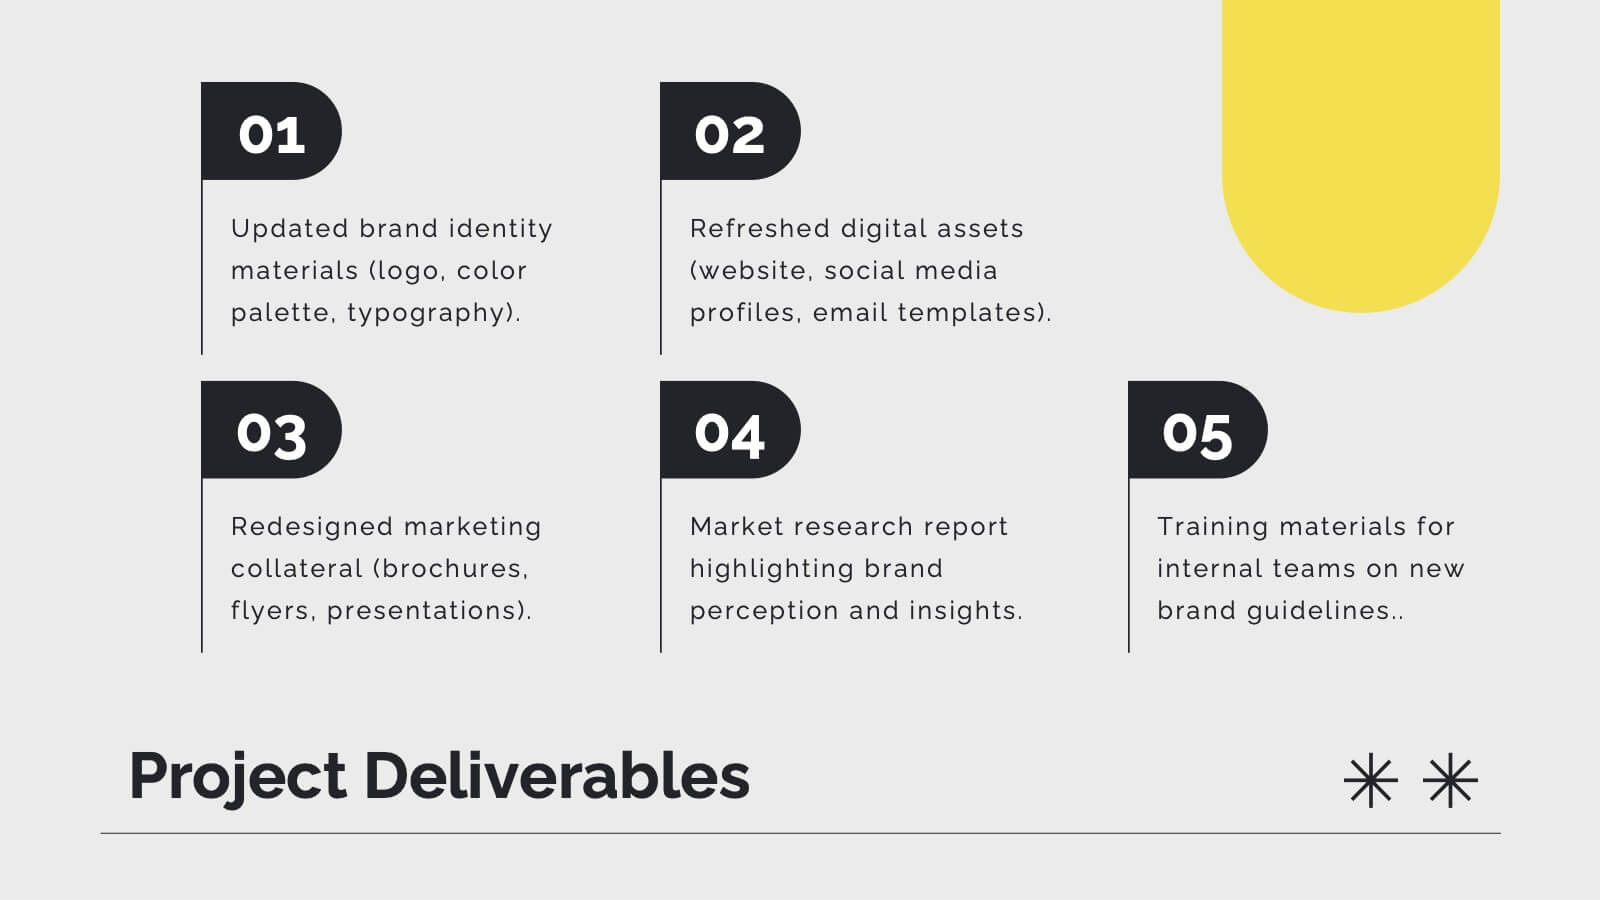
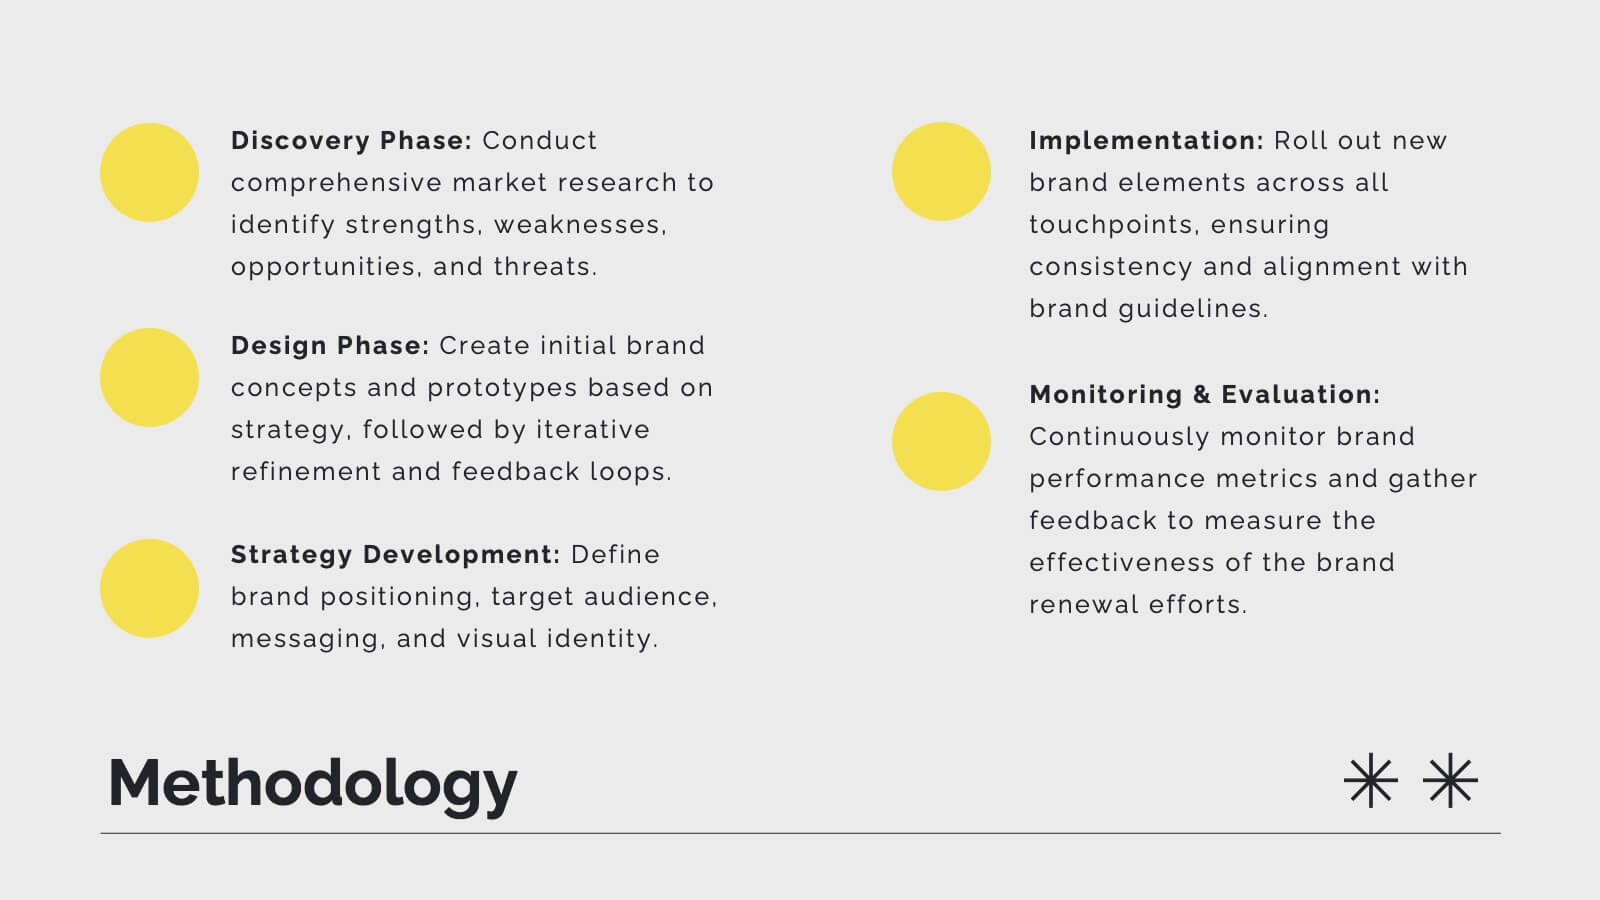
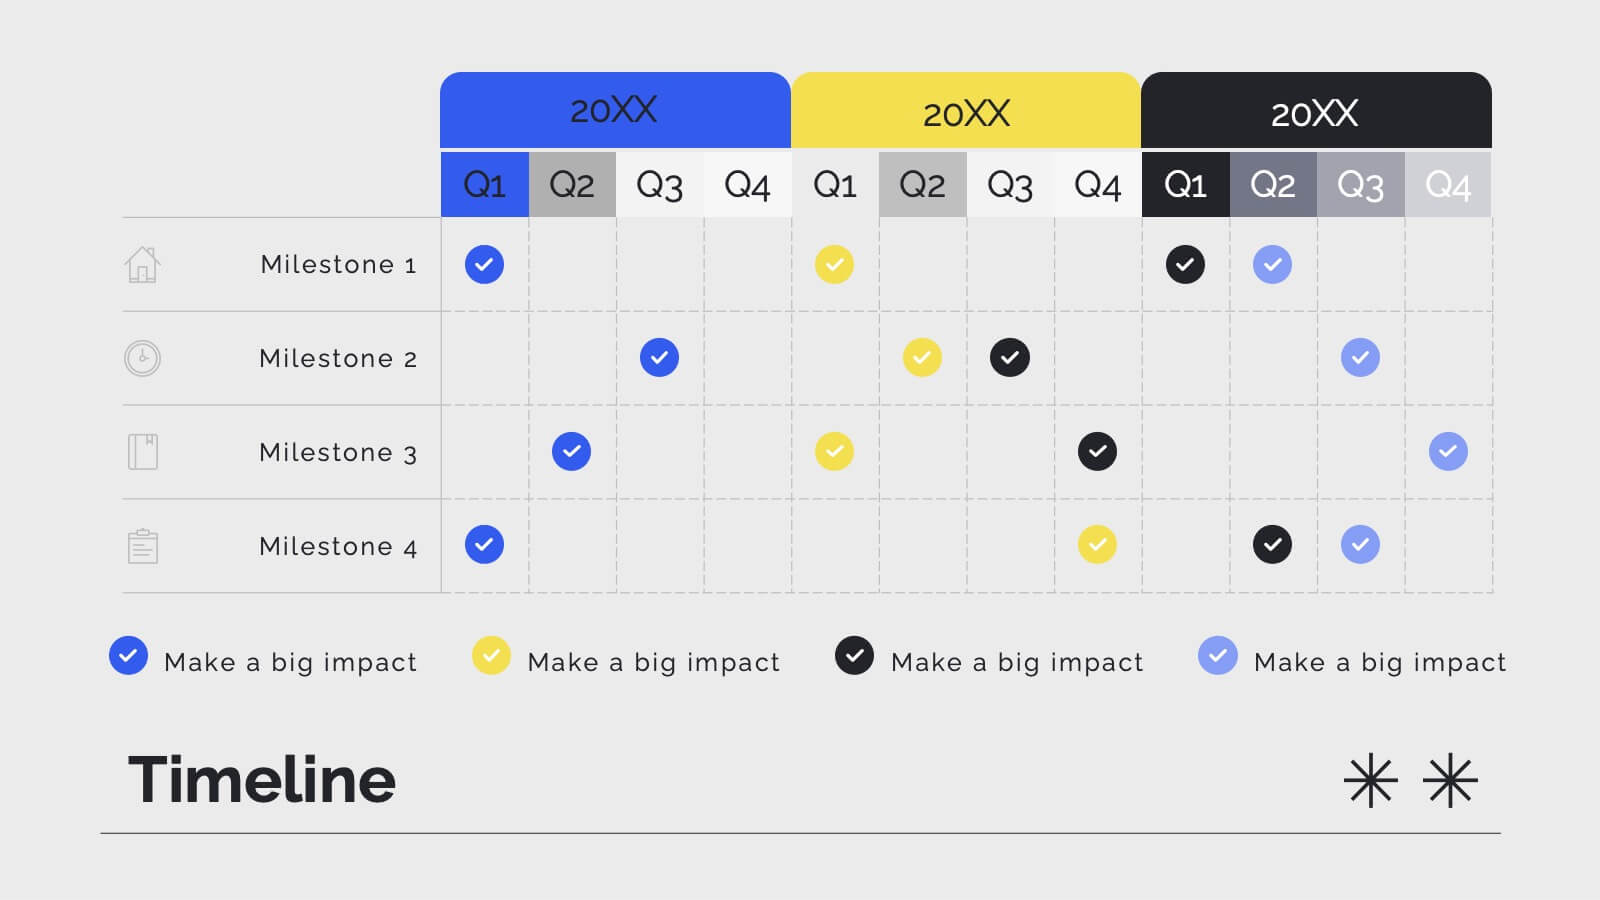
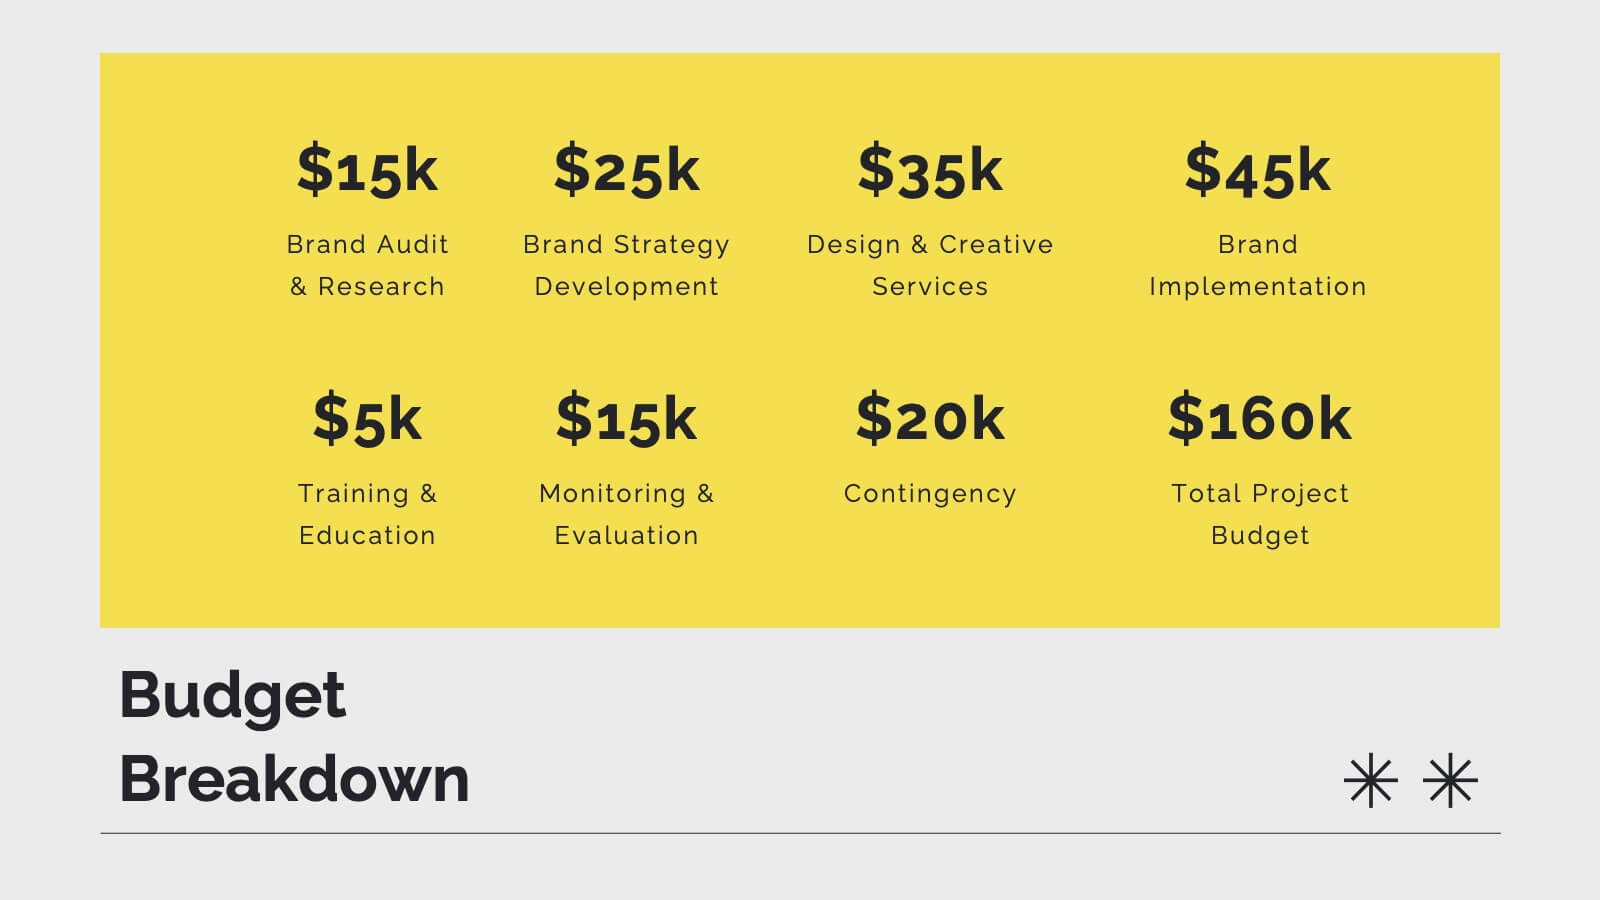
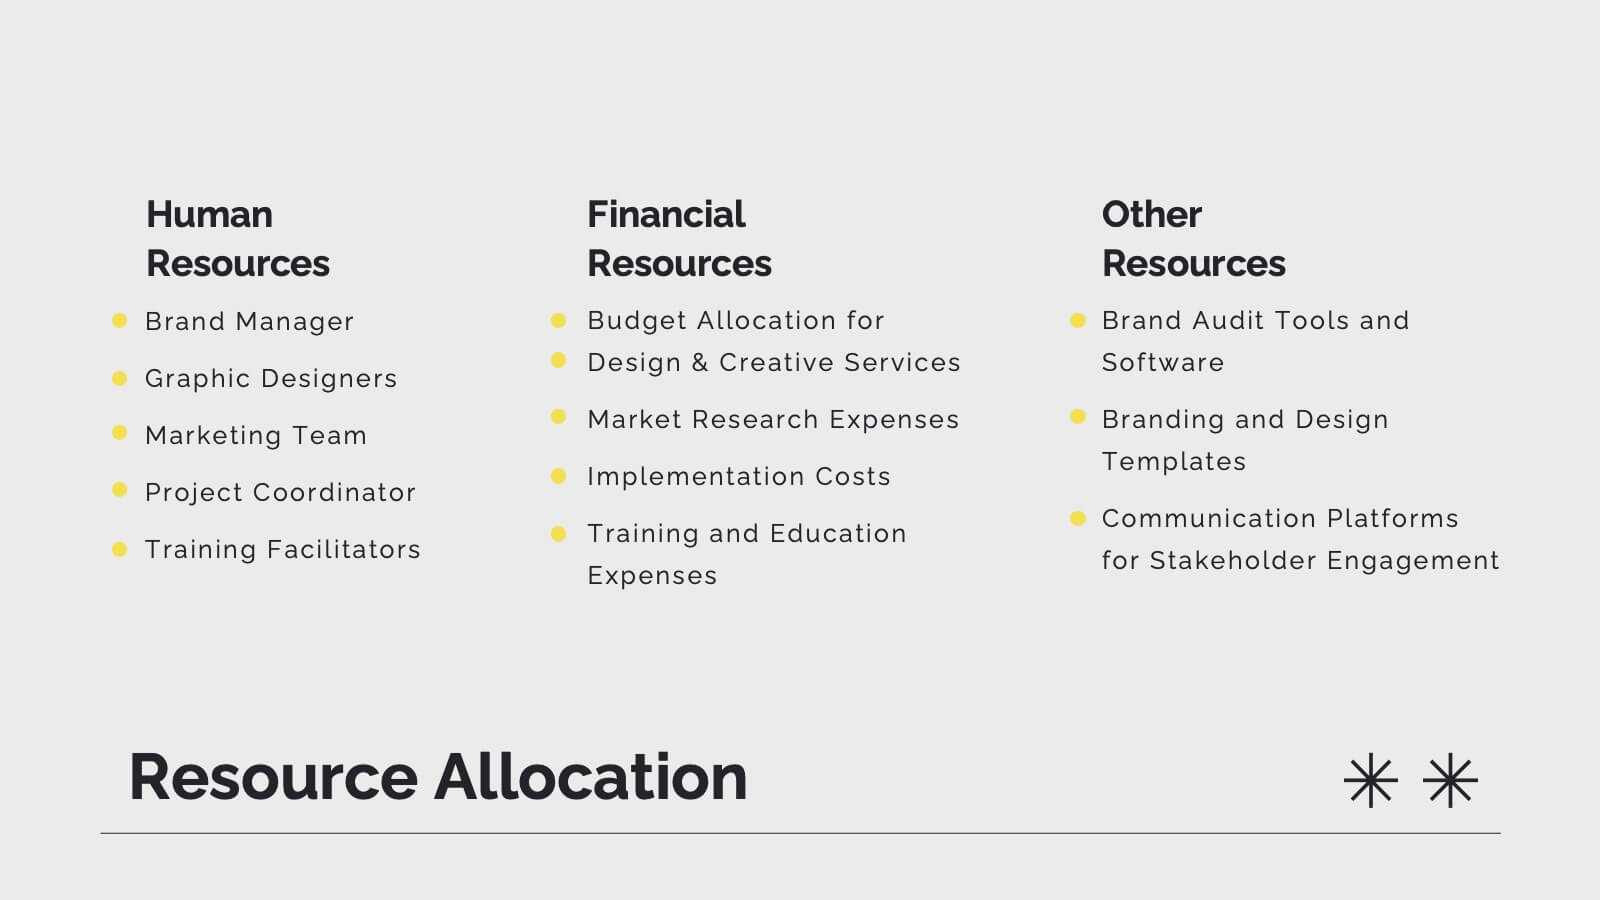
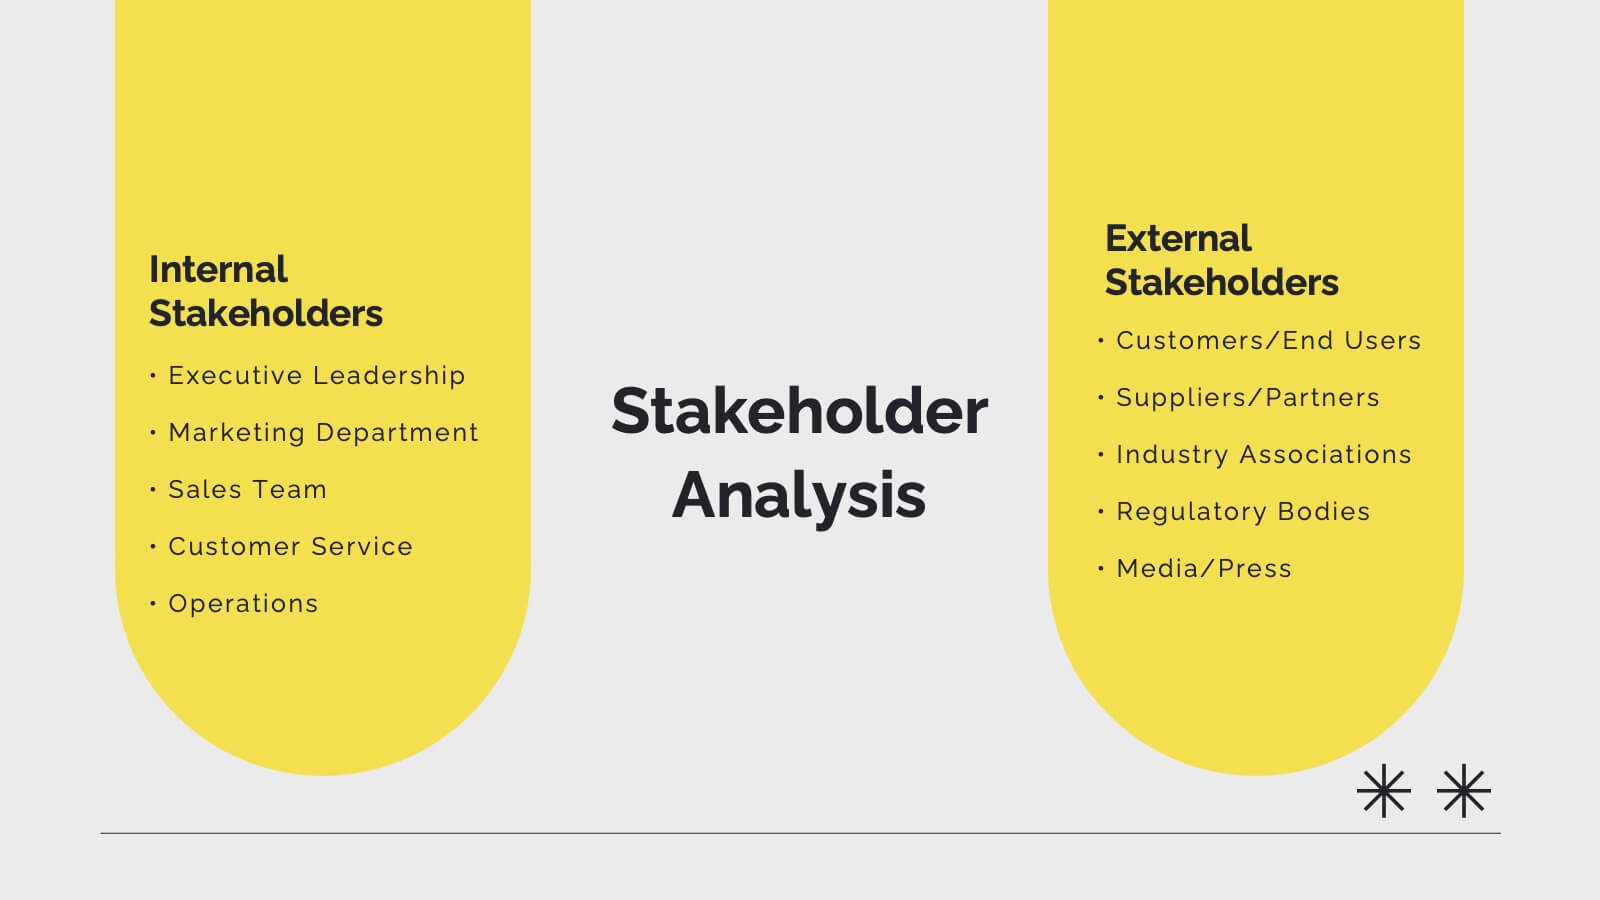
Pulse Project Management Plan Presentation
Streamline your project management with this vibrant template. It covers project overview, objectives, deliverables, methodology, timeline, budget, and risk management. Perfect for clear and engaging presentations. Compatible with PowerPoint, Keynote, and Google Slides for seamless customization.


7 diapositivas
Company Mission Infographic
The templates presented are tailored to elucidate the company's mission, blending aesthetic appeal with functional design to communicate core values and strategic objectives effectively. These slides are ideal for businesses looking to articulate their mission clearly and compellingly, ensuring alignment across all levels of the organization. Each slide in the collection is designed with precision, incorporating elements that highlight key aspects of the company’s ethos without overwhelming the viewer. The use of clean lines, minimalistic design, and coordinated color palettes emphasizes clarity and professionalism, making each slide both engaging and informative. These templates serve multiple purposes; they are perfect for enhancing corporate presentations, annual meetings, and strategic workshops. They help in broadcasting the foundational goals and the mission to new hires, potential investors, and external stakeholders. By presenting the mission in a visually cohesive and structured manner, these slides foster a unified understanding of what the company stands for. Customizable features allow these templates to be adapted to match specific branding requirements, making them a versatile tool in the corporate communication arsenal. They are not just slides but strategic tools that reinforce the company’s identity and commitment to its goals, serving as a cornerstone for building corporate identity and culture.


7 diapositivas
Objective Reasoning Infographic
Objective reasoning is pivotal in making informed decisions, and its importance cannot be overstated in today's fast-paced world. Our objective reasoning infographic, illuminated with shades of green, blue, and yellow, serves as a visual guide for systematically breaking down complex issues. Tailored for educators, business professionals, and decision-makers, this template outlines the core components and steps of objective reasoning. Its compatibility with PowerPoint, Keynote, and Google Slides ensures a seamless integration into your presentations, empowering your audience with a clear understanding of reasoned decision-making.


12 diapositivas
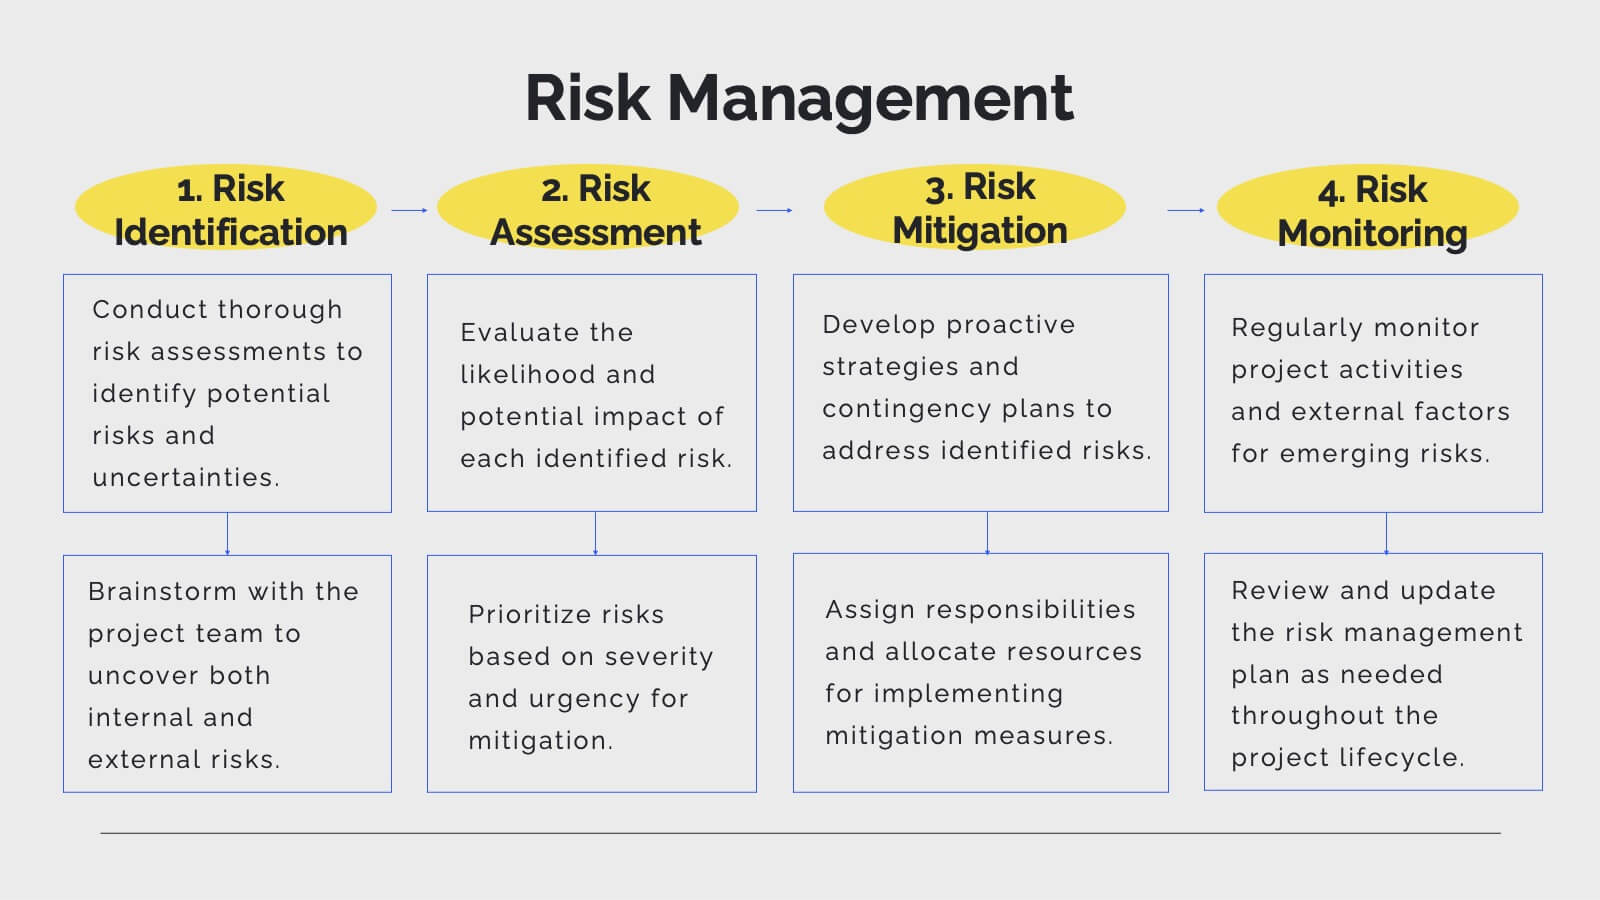
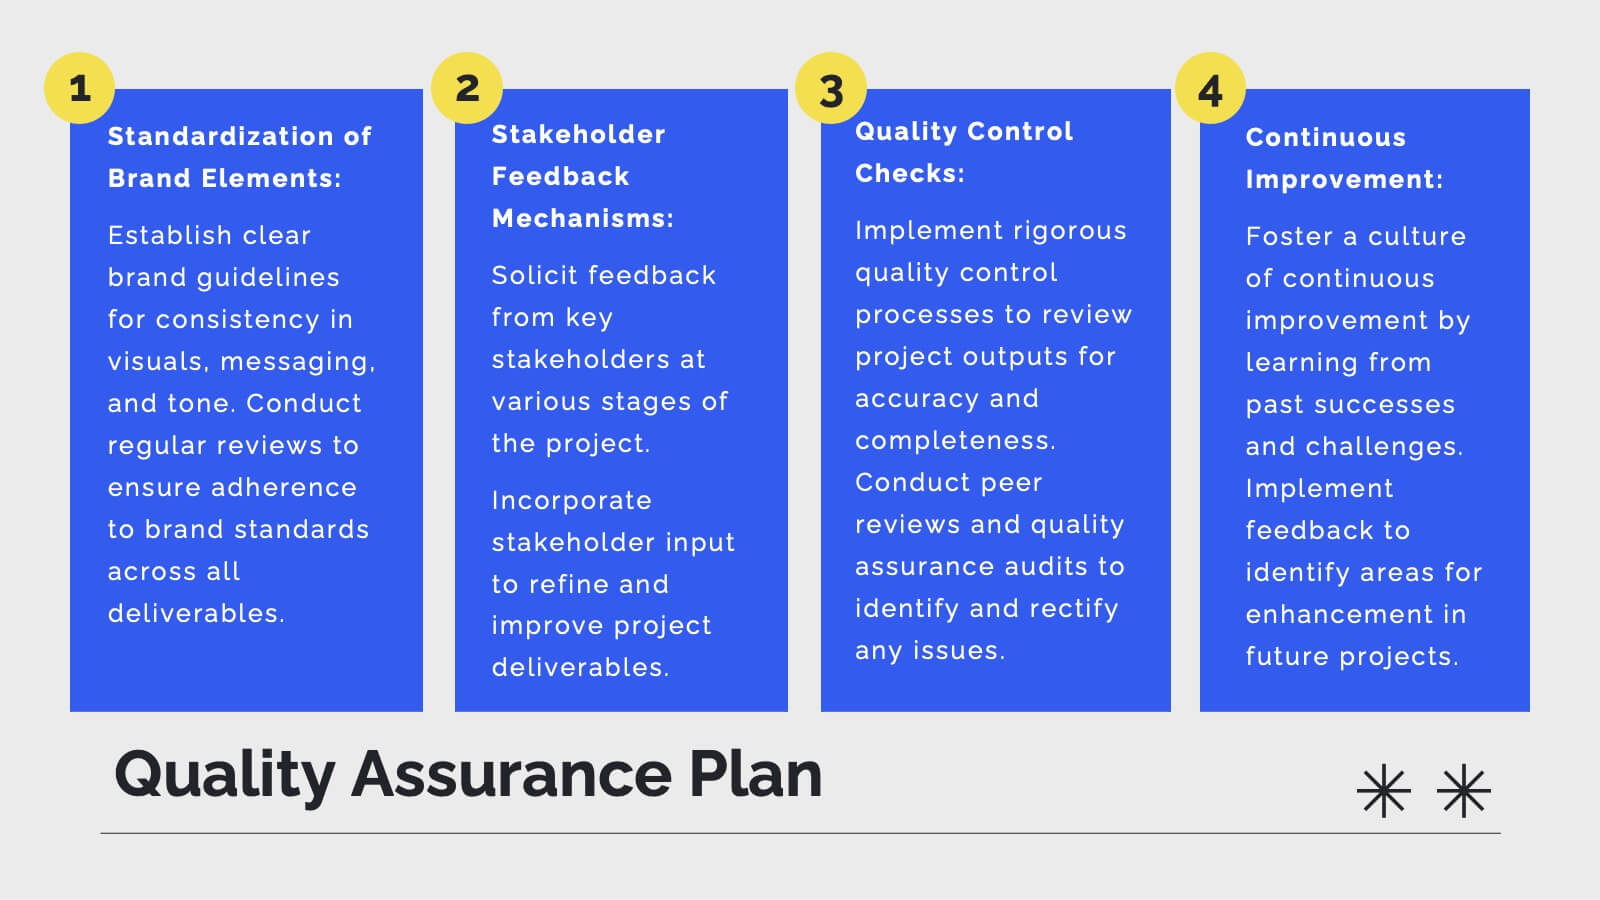
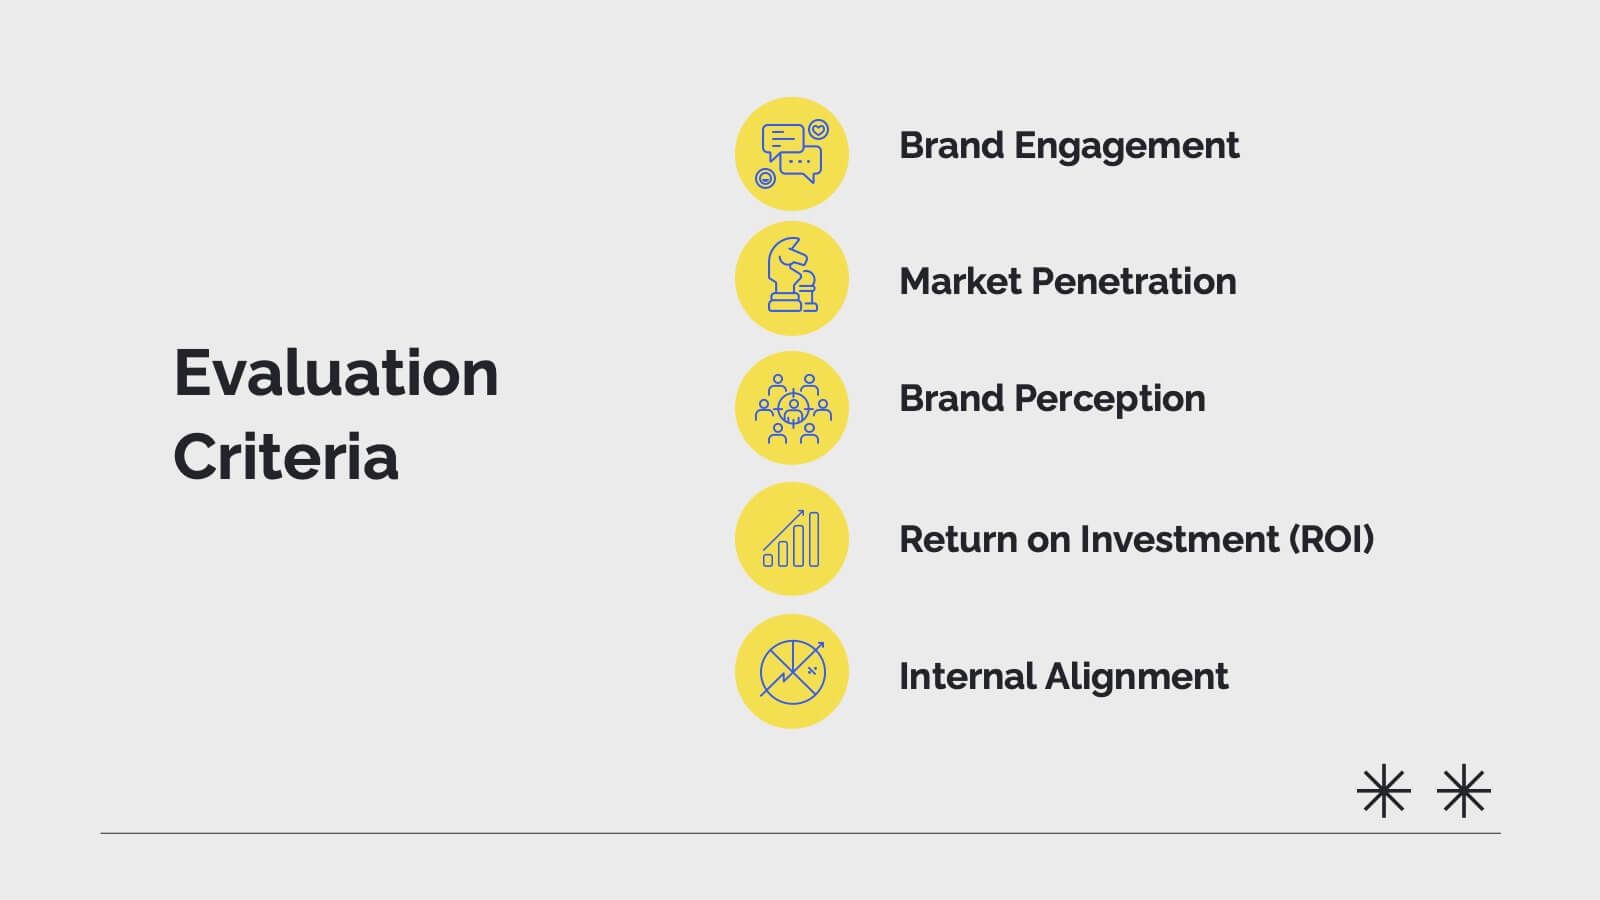
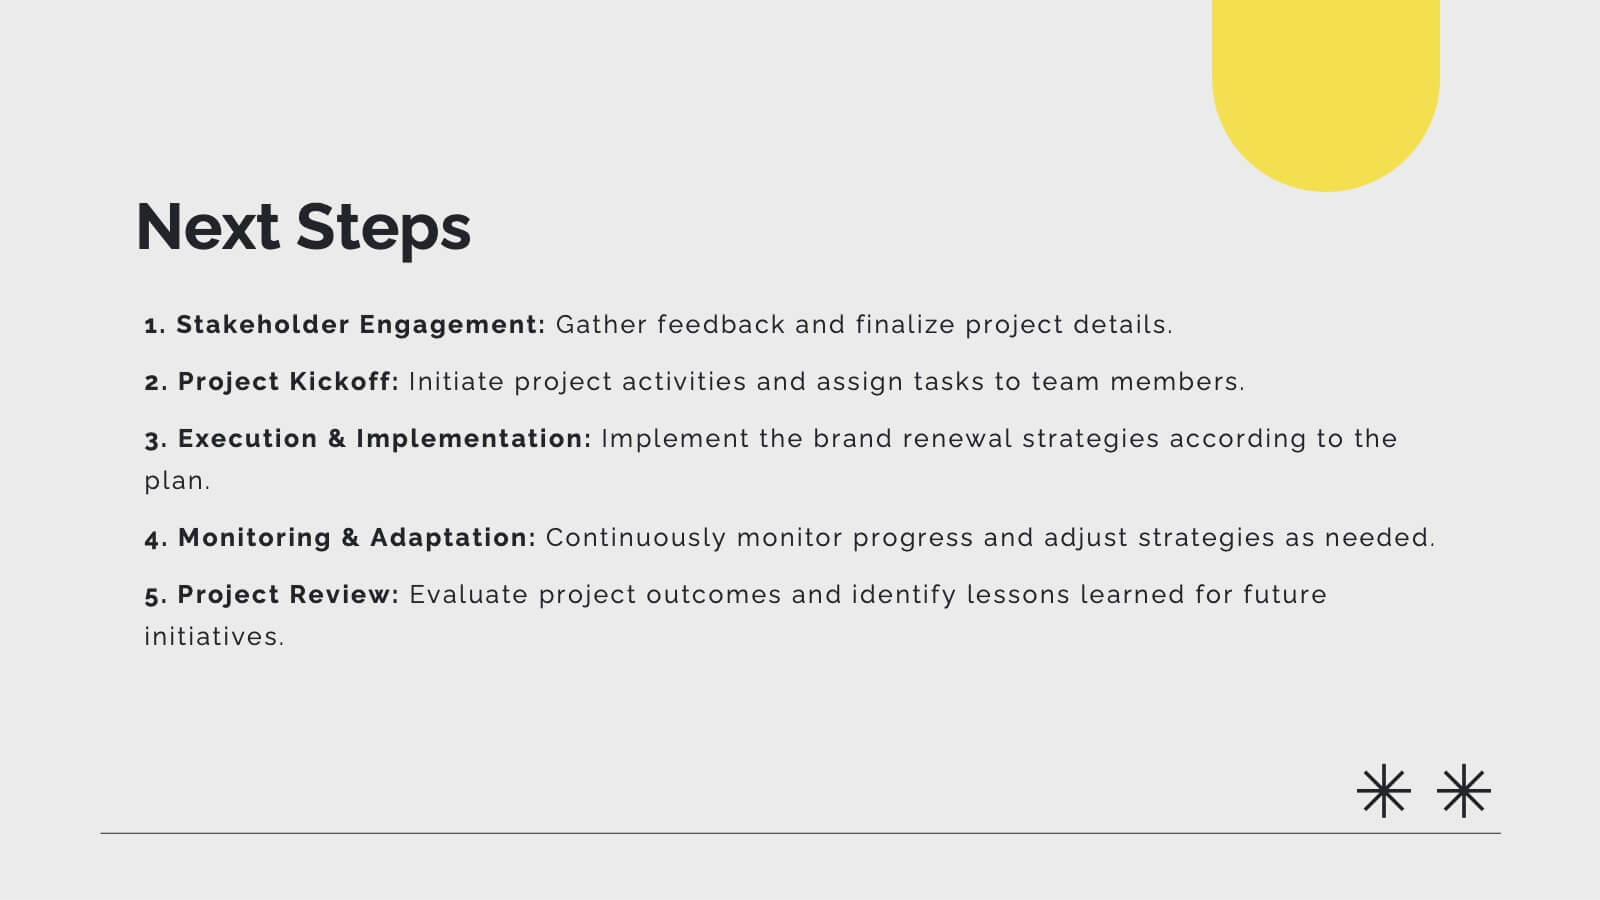
Risk Management and Security Compliance Presentation
Enhance your organizational resilience with the 'Risk Management and Security Compliance' presentation template. This intuitive design helps you communicate complex compliance standards and risk mitigation strategies effectively. Ideal for training sessions, board meetings, and compliance audits, ensuring your team stays informed and proactive in managing risks.


5 diapositivas
SWOT Analysis Business Presentation
Identify key business factors with the SWOT Analysis Business Infographic. This structured template visually highlights strengths, weaknesses, opportunities, and threats, making it ideal for strategy planning, competitive analysis, and decision-making. Fully customizable with editable colors, text, and icons. Compatible with PowerPoint, Keynote, and Google Slides for effortless presentation use.


7 diapositivas
College Statistics Infographic Presentation
A College Statistics Infographic is a visual representation of key data and statistics related to a college. This template can provide a quick and easy-to-understand overview of various aspects of the institution, such as enrollment figures, graduation rates, student demographics, and academic performance metrics. Featured are icons, illustrations, diagrams, and other design elements to enhance the visual appeal of this infographic and make it more engaging for your viewers. This template can be a useful tool for students, teachers, and others interested in learning more about a college.


7 diapositivas
Matrix Diagram Infographic Presentation Template
A matrix diagram, also known as a matrix chart or matrix plot, is a type of chart that is used to compare and contrast different elements or variables. It is typically represented as a grid or table with rows and columns. This template will help show you how different things are related to each other. Use this template to compare and contrast things like products or tasks. It includes grids and tables that you can fill in with your own information. Add your own pictures and colors to make it look more appealing. This template is perfect for your school projects or work presentations.


6 diapositivas
Editable Puzzle Infographic
Piece together complex data with our Editable Puzzle Infographic, compatible with Powerpoint, Google Slides, and Keynote. This engaging infographic is designed to help presenters visually connect different pieces of information in a cohesive and understandable way. The puzzle pieces are a metaphor for how individual components fit into a larger strategy or concept, making it perfect for collaborative projects or educational models. The infographic is fully customizable, allowing you to adapt the colors, text, and arrangement to fit your specific needs. With this puzzle infographic, you can make your presentations more interactive ensuring your audience can see the big picture every time.