


Características


¿Tienes alguna pregunta?
Recomendar


8 diapositivas
Editable SWOT Infographic Presentation
Analyze your business strategy with the Editable SWOT Infographic Presentation. This modern and professional template highlights Strengths, Weaknesses, Opportunities, and Threats in a visually structured format. Perfect for business planning, competitive analysis, and decision-making, it allows for easy customization of colors, text, and layout. Fully compatible with PowerPoint, Keynote, and Google Slides, ensuring seamless editing and presentation.


6 diapositivas
Financial Summary Infographic
The series presented showcases various slide templates tailored for enhancing sales team strategies and communication. Each slide is crafted to assist sales professionals in detailing team structures, sales goals, performance metrics, and strategic initiatives effectively. Utilizing vibrant color blocks and streamlined design elements, these templates make complex sales data approachable and engaging, facilitating clear and impactful presentations. The collection is designed with adaptability in mind, incorporating elements that can be easily customized to fit different team needs and company branding. These include comparative layouts for benchmarking, timeline formats for showcasing sales cycles, and diagrammatic representations for visualizing sales processes and results. Perfect for internal meetings, sales training sessions, and stakeholder presentations, these templates serve as essential tools for sales leaders to convey their team’s progress, celebrate wins, and strategize for future sales endeavors.


6 diapositivas
Funnel Stages Infographic
In marketing and sales, the term "funnel stages" refers to the different stages or steps that a potential customer goes through in their journey from initial awareness of a product or service to making a purchase decision. These infographics visualize and help you understand the customer's progression through these stages. They aim to help businesses and professionals understand the customer journey and optimize their strategies for each stage of the funnel. Whether used in sales presentations, marketing workshops, or educational materials, this template helps businesses build successful sale funnels and maximize their revenue potential.


12 diapositivas
Corporate Hierarchy Structure Presentation
Showcase your Corporate Hierarchy Structure with a sleek and professional design. This template helps visualize organizational roles, reporting relationships, and team structures for clear communication. Perfect for HR teams, business leaders, and project managers, it’s fully customizable and compatible with PowerPoint, Keynote, and Google Slides for easy editing.


23 diapositivas
Kitsune Startup Strategy Presentation
This startup strategy template is designed for clear communication of business vision, target market, and unique value proposition. It also includes slides for marketing strategies, team introduction, and financial overview. Its clean, professional layout makes it ideal for investors or stakeholders. Compatible with PowerPoint, Keynote, and Google Slides for easy customization.


8 diapositivas
Australia and Pacific Map Presentation
Bring your regional data to life with a crisp, modern layout that highlights key insights across Australia and the Pacific islands. Perfect for displaying geographic trends, business reach, or market segmentation, this map design keeps your message clear and engaging. Fully compatible with PowerPoint, Keynote, and Google Slides.


5 diapositivas
Multiple Lists Infographics
Unleash the power of organized information with our multiple lists infographics template, your companion for presenting diverse data. This versatile resource, steeped in a vibrant mix of orange, blue, and purple hues, caters to professionals from all sectors, aiding in the seamless conveyance of varied content, from business agendas to educational material. The template, characterized by its informative and creatively random style, integrates compelling graphics and intuitive icons. Whether you're a business leader, educator, or content creator striving for clarity and engagement, this infographic tool is tailored for an unforgettable visual impact.


21 diapositivas
Logos Content Marketing Pitch Deck Presentation
The Marketing Presentation Template is designed for impactful business storytelling. With 20+ slides, it features sections for company history, core values, target audience, competitive analysis, growth plans, and testimonials. Ideal for agencies and brands, it's fully customizable and compatible with PowerPoint, Keynote, and Google Slides. Perfect for pitching ideas effectively!


6 diapositivas
Corporate Governance Strategy
Present your company’s leadership structure with clarity using this corporate governance strategy slide. This hexagonal framework highlights key areas such as vision, objectives, and strategy—surrounded by six supporting pillars. Each section includes editable icons and text for board responsibilities, ethics, oversight, and more. Ideal for executive updates, policy reviews, and stakeholder reports. Fully customizable in PowerPoint, Keynote, and Google Slides.


4 diapositivas
Organizational Hierarchy Infographic
Showcase your team’s structure with a modern, photo-friendly hierarchy layout. This editable infographic is perfect for company overviews, team introductions, or org chart visualizations. Easily customizable in PowerPoint, Keynote, and Google Slides.


7 diapositivas
Tables of Content Samples Infographic Presentation
A Table of Content is an essential tool that improves the accessibility and organization of a document or book, and enhances its overall professionalism. This table of contents template is an excellent way to organize your information. This template is fully editable, which allows you to easily change colors and fonts, and add or delete components from the design. The slides are designed to be easily updated with new information, allowing you to keep the presentation fresh and up-to-date. Each template has a high quality design that is compatible with powerpoint, Keynote and Google Slides.


5 diapositivas
Financial Plan Infographics
A financial plan provides a roadmap for achieving financial goals, managing income and expenses, mitigating risks, building wealth, and preparing for the future. These infographic templates are designed to help individuals and businesses present their financial plans and strategies in a clear and concise manner. Use this to create a financial report, a business presentation, or to provide financial guidance, this template will help you communicate key financial information effectively. Compatible with Powerpoint, Keynote, and Google Slides, this makes is easy to customize with your information.


23 diapositivas
Nightspire Strategic Planning Report Presentation
Streamline your strategic planning process with this professionally designed presentation template. Covering key areas such as market analysis, SWOT assessment, milestones, and resource allocation, this template is ideal for businesses and project teams. Fully editable and compatible with PowerPoint, Keynote, and Google Slides.


4 diapositivas
Options Comparison Chart Presentation
Make every decision crystal clear with a dynamic, easy-to-follow layout designed to compare options side by side. Perfect for presenting business strategies, pricing plans, or feature breakdowns, this presentation helps your audience see the value instantly. Fully compatible with PowerPoint, Keynote, and Google Slides for effortless editing.


21 diapositivas
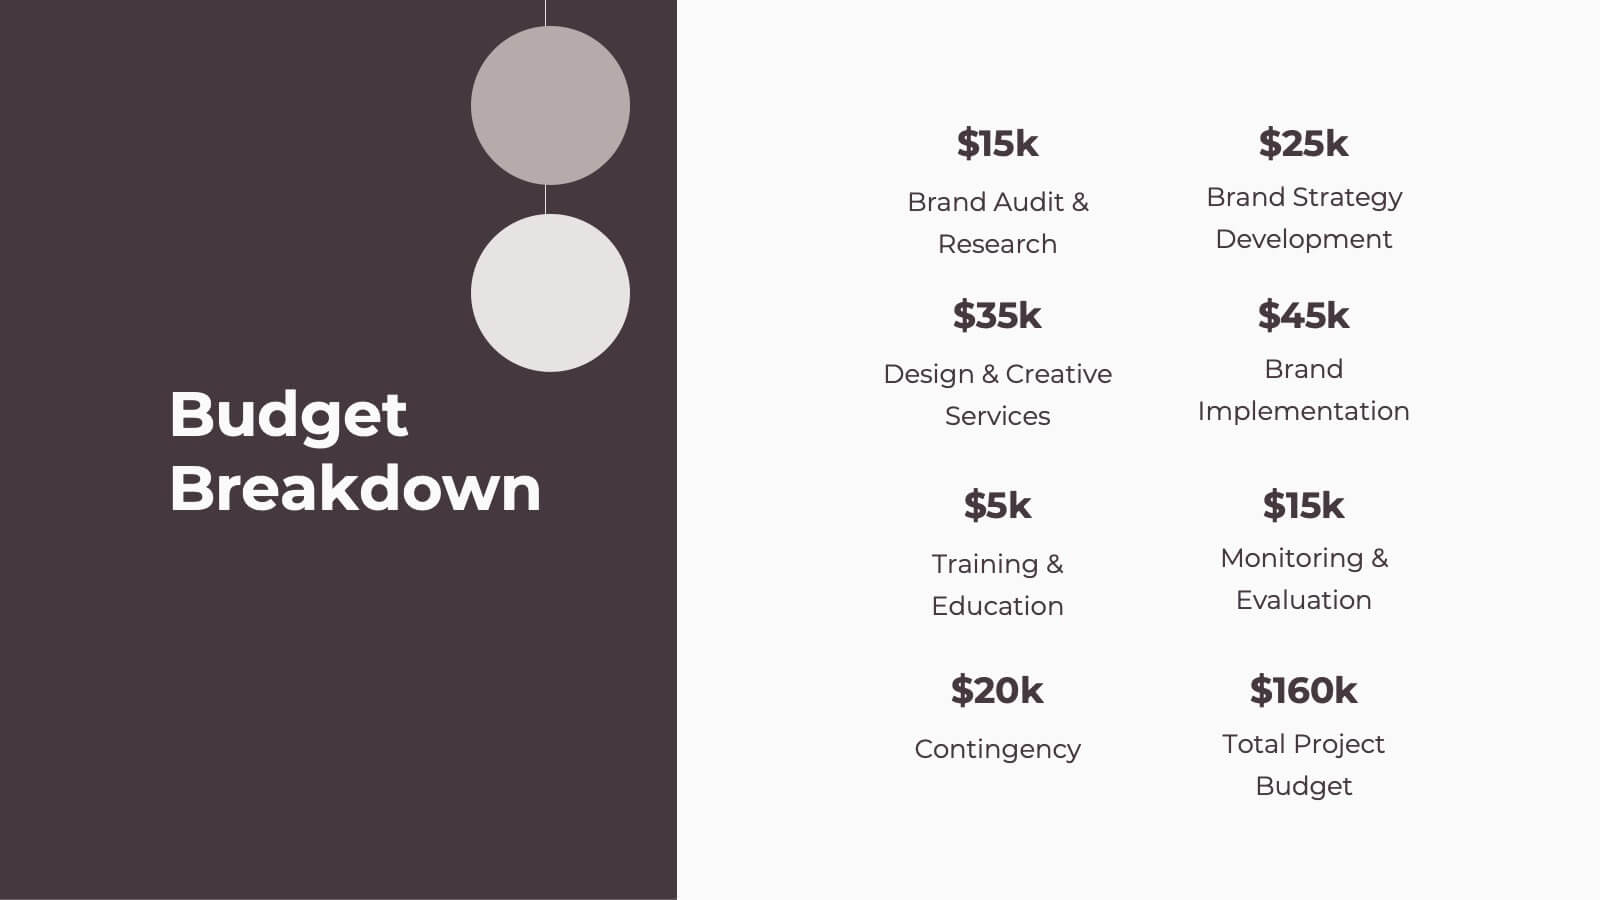
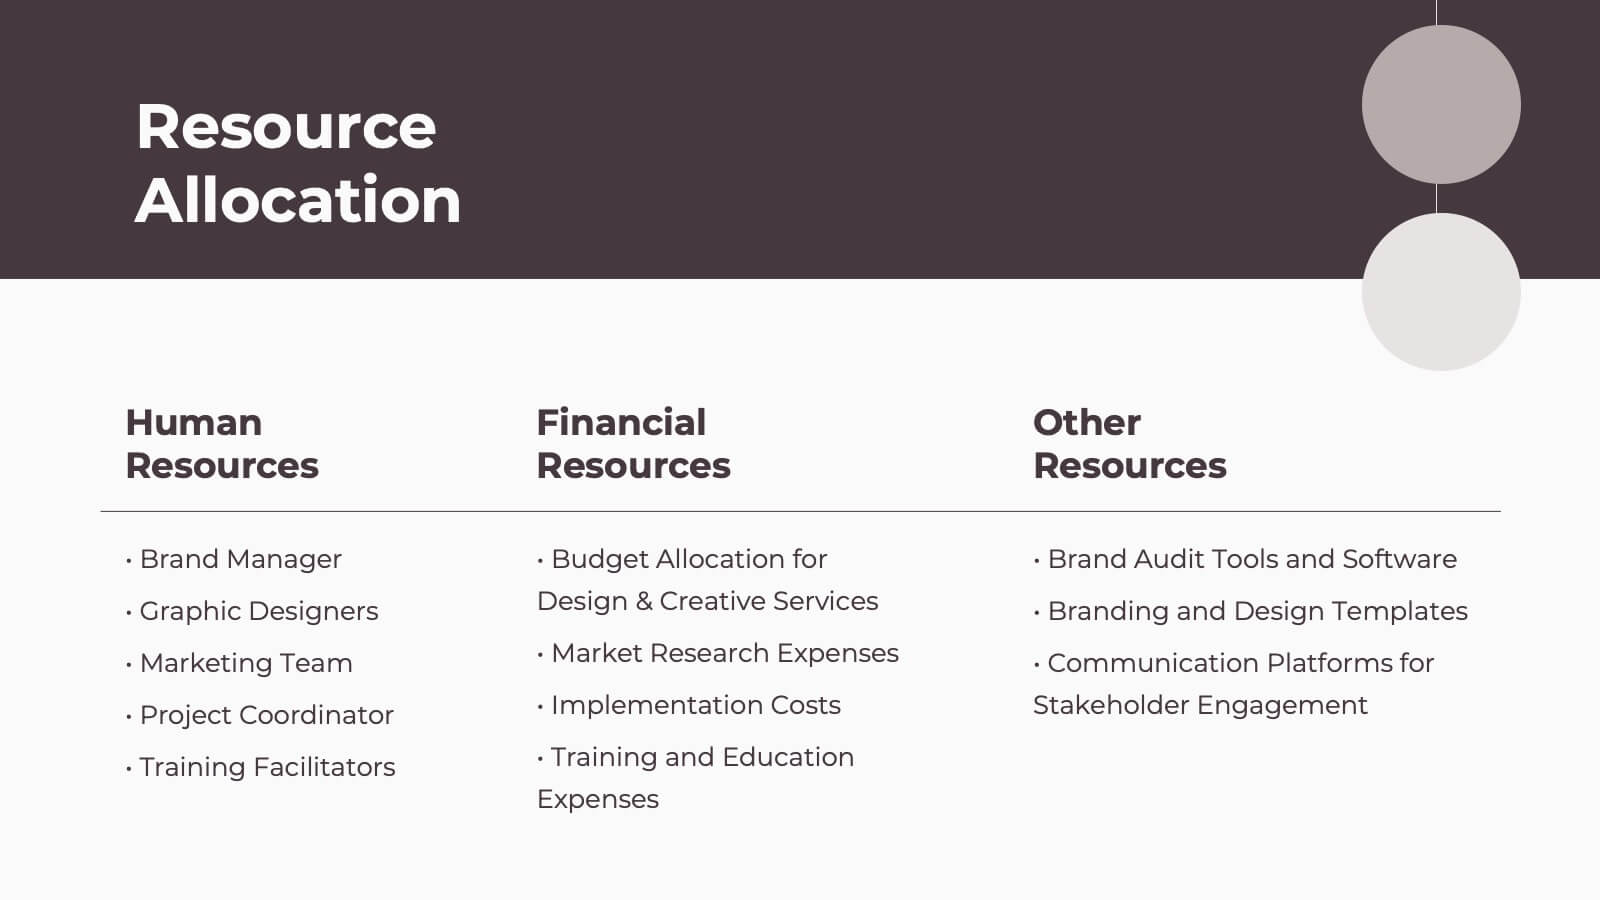
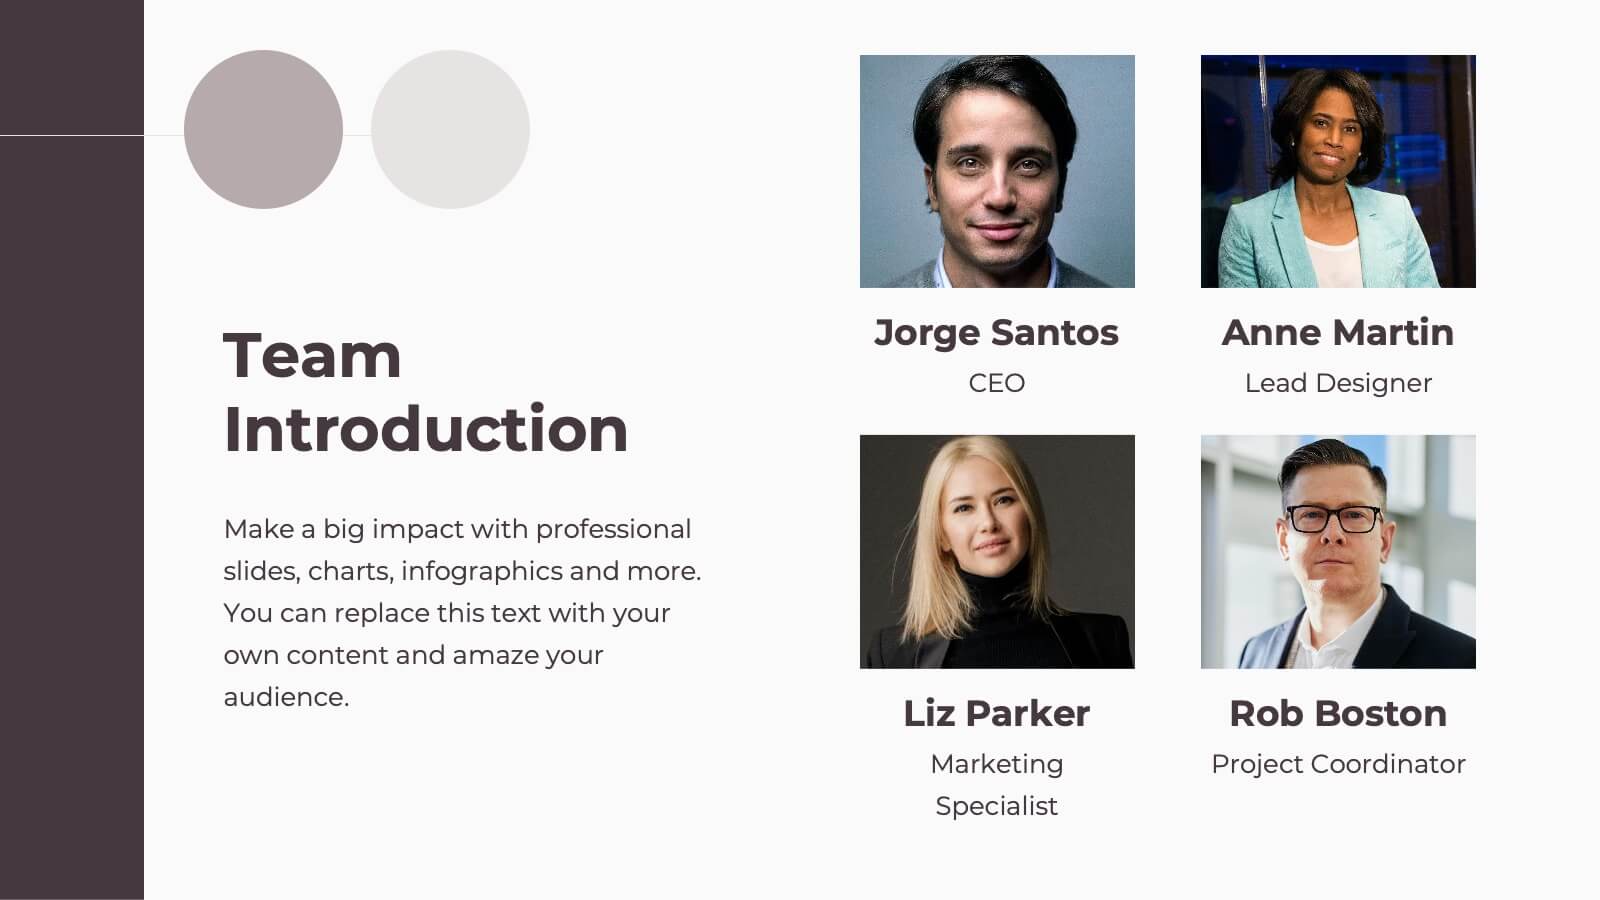
Spectrum Project Timeline Presentation
Plan and execute your projects with precision using this detailed project plan template! Perfect for outlining objectives, timelines, and resource allocation. Ideal for project managers and teams aiming to ensure successful project delivery. Compatible with PowerPoint, Keynote, and Google Slides, this template keeps your project organized, clear, and on track. Ensure project success!


22 diapositivas
Galvonic Research Proposal Presentation
Present research insights professionally with this comprehensive proposal template. Covering objectives, methodology, findings, and implications, it provides a clear structure for academic or market research projects. Compatible with PowerPoint, Keynote, and Google Slides, it’s ideal for presenting detailed analysis, conclusions, and future directions.


6 diapositivas
Preventative Healthcare and Fitness Presentation
Promote wellness and proactive care with this colorful and clean slide layout. Featuring a clipboard-style design with stacked icons and aligned descriptions from A to E, it’s perfect for presenting fitness tips, health programs, or preventative strategies. The vibrant sections help guide viewers through key points at a glance. Fully editable and compatible with PowerPoint, Keynote, and Google Slides.