


Características


¿Tienes alguna pregunta?
Recomendar

19 diapositivas
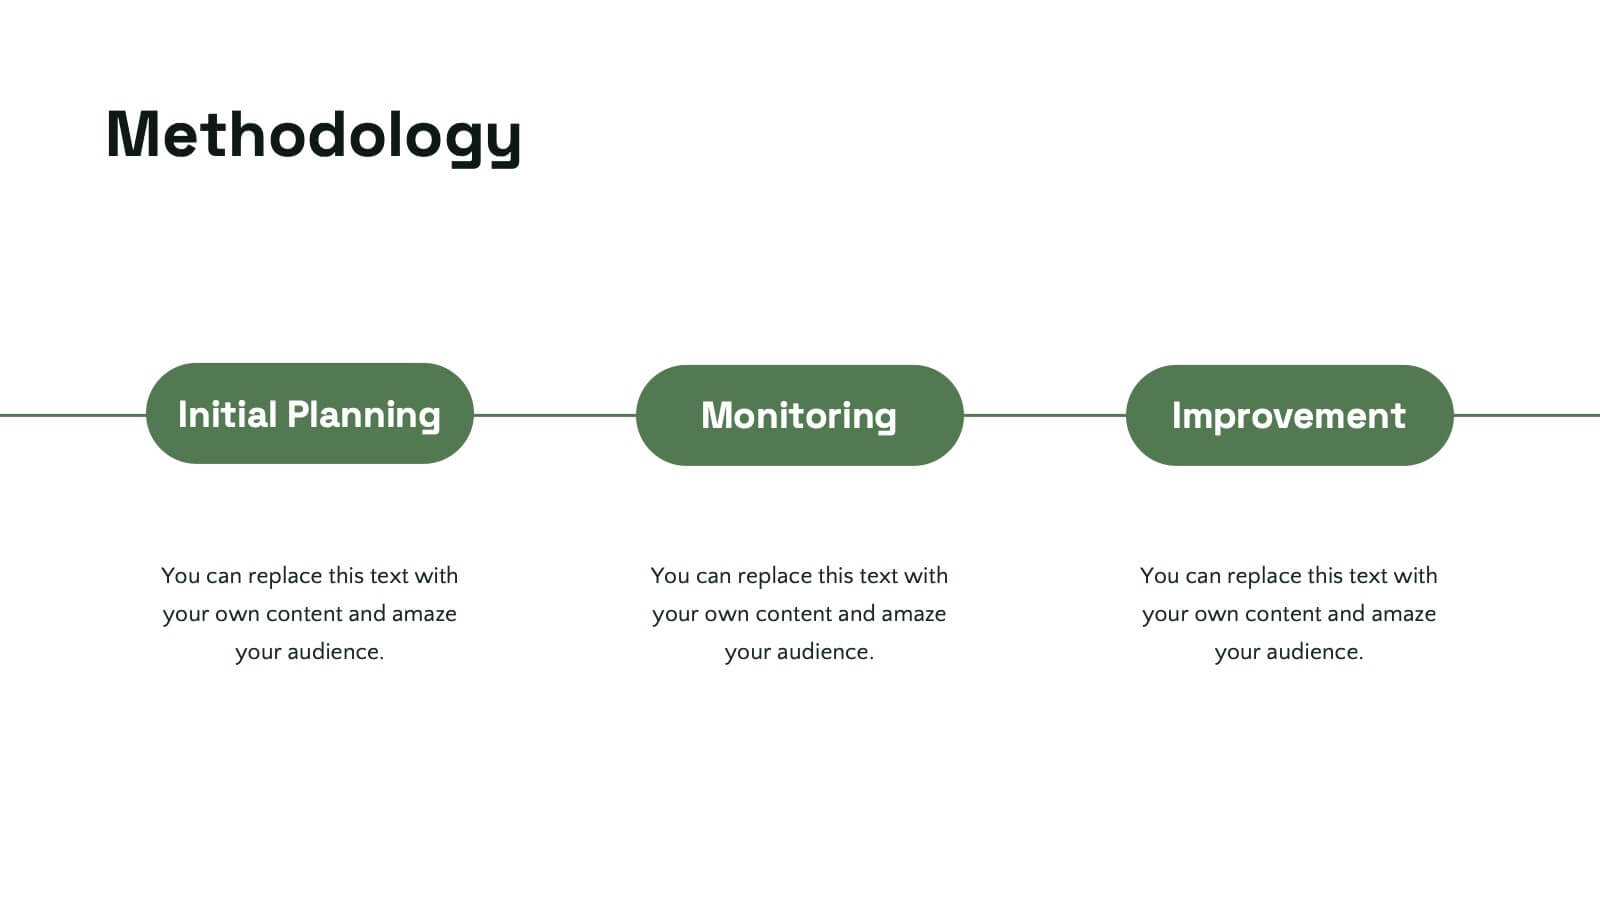
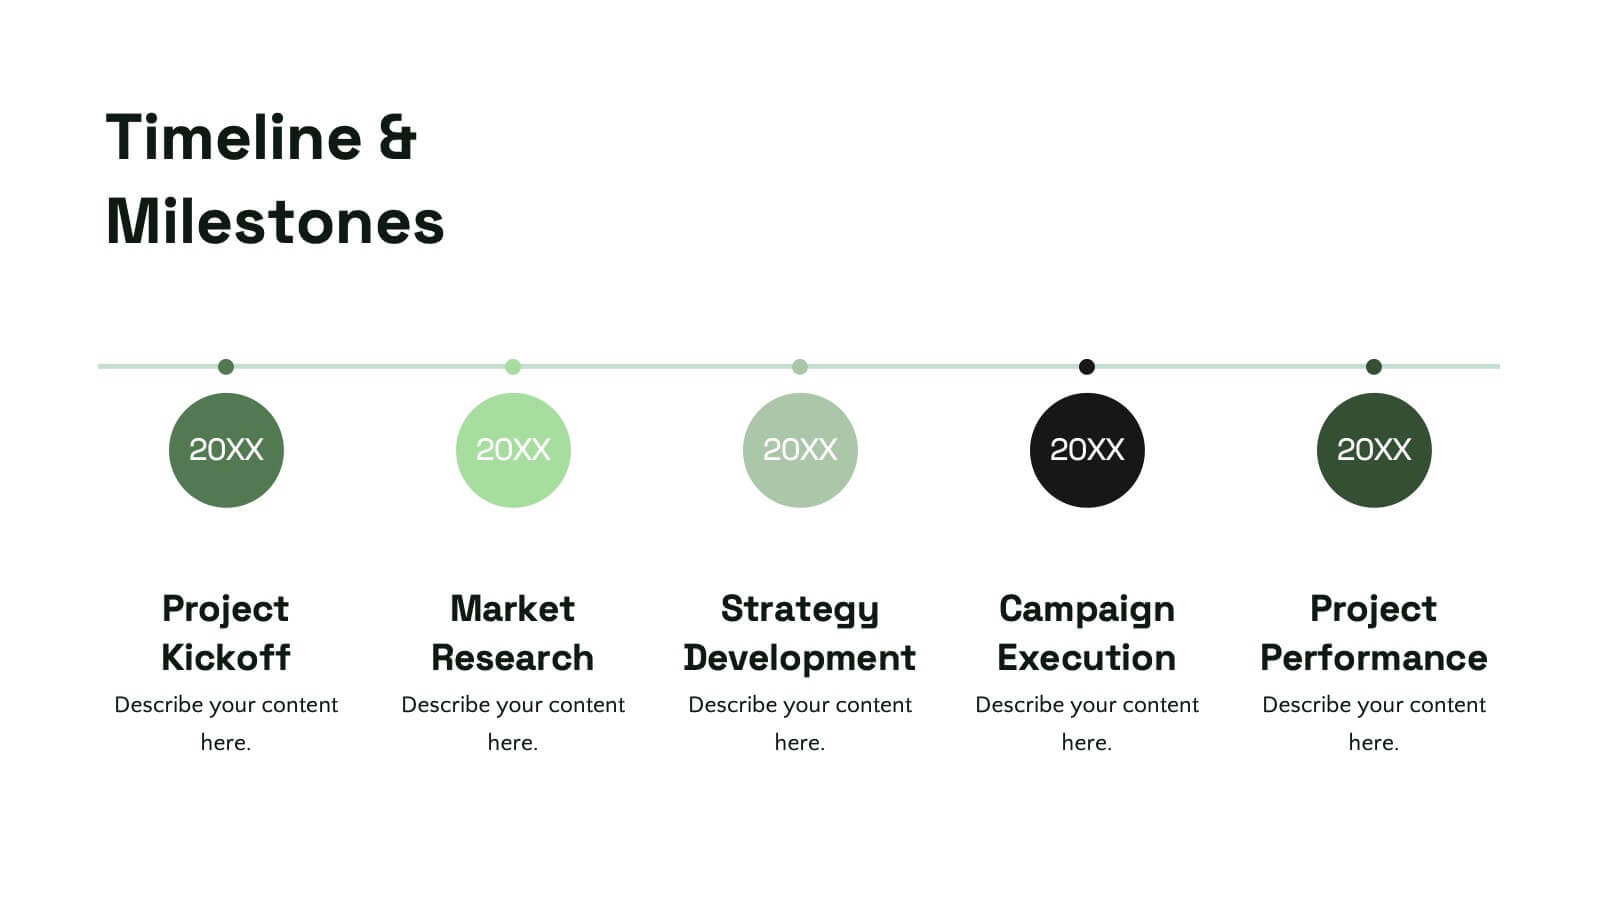
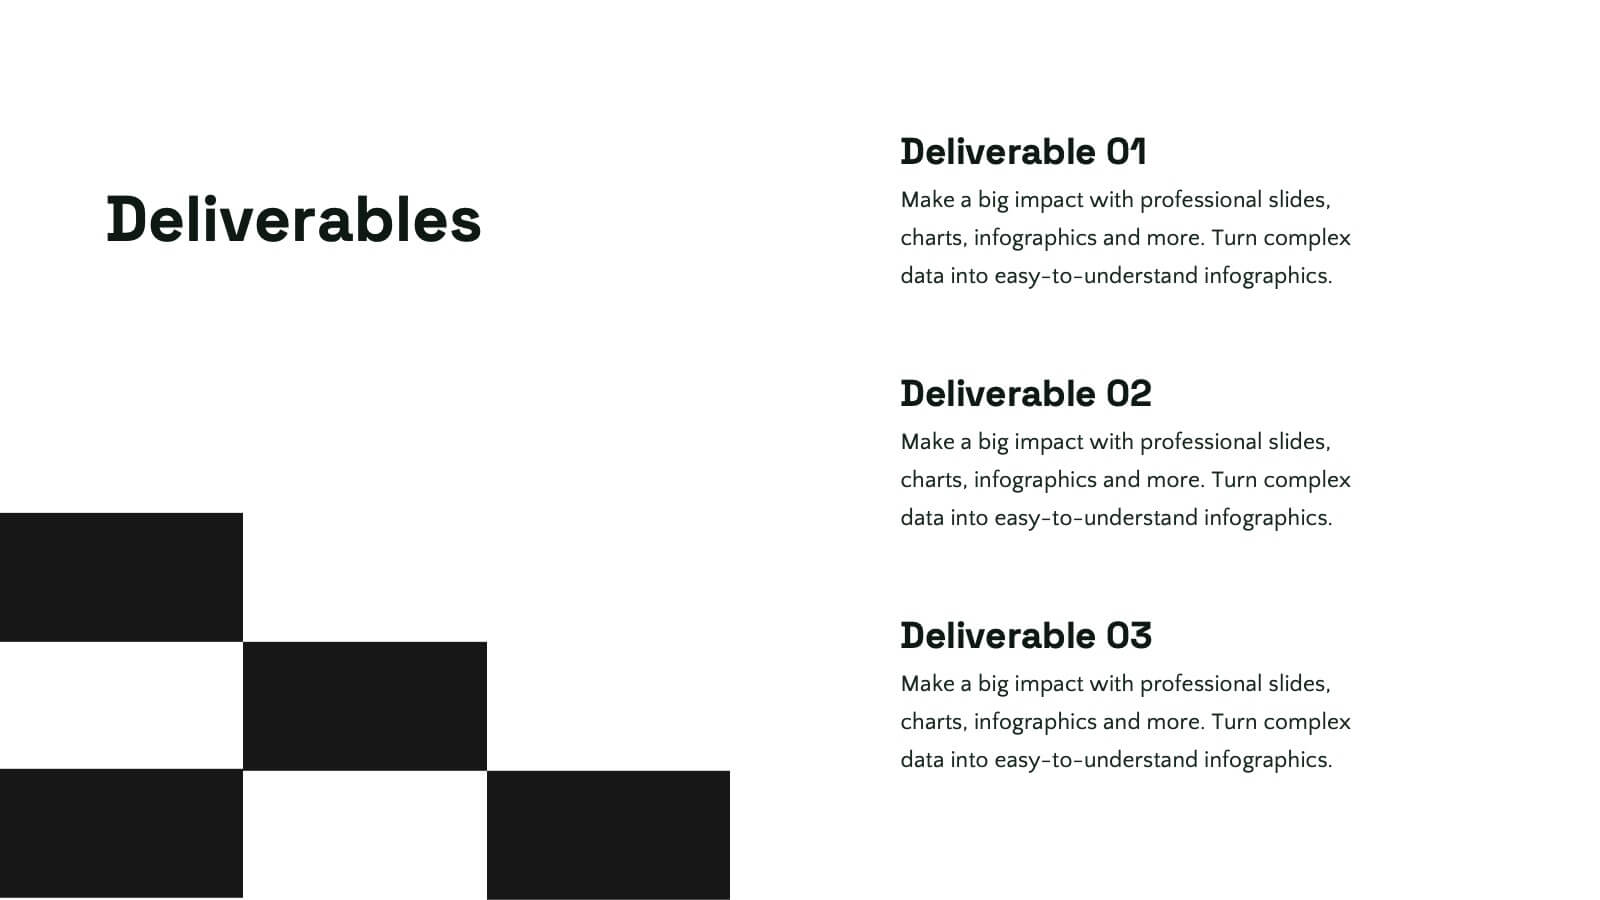
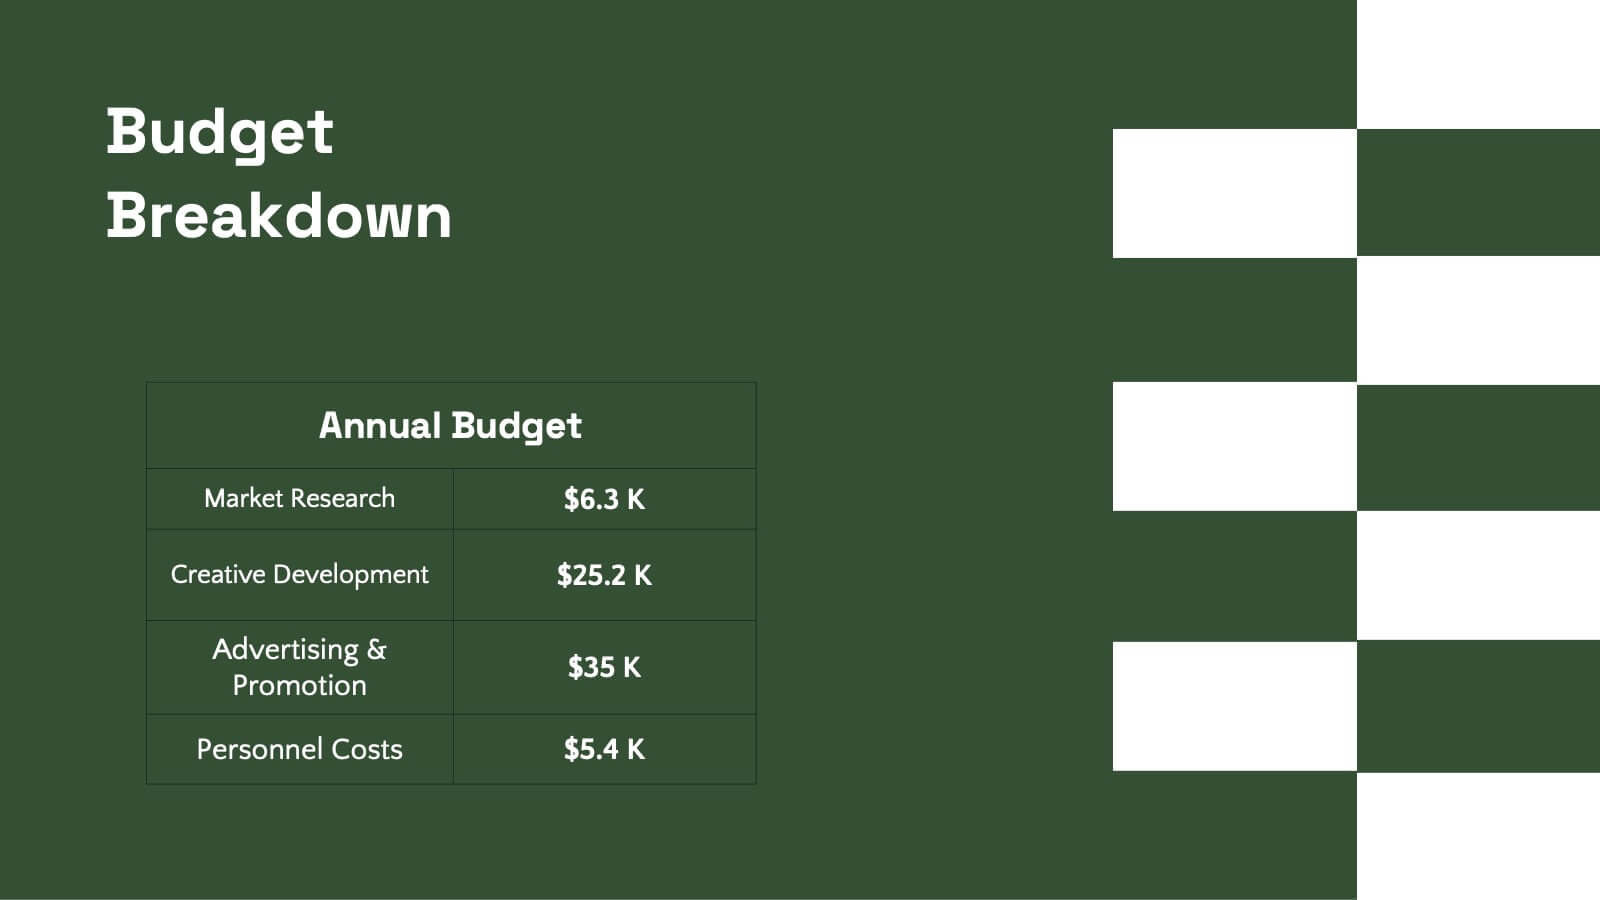
Tidal Design Proposal Presentation
Elevate your pitch with this sleek design proposal template! Perfect for presenting project details, objectives, methodology, and milestones, it ensures your ideas stand out. Impress stakeholders with clear, structured slides and professional aesthetics. Compatible with PowerPoint, Keynote, and Google Slides for a seamless presentation experience across all platforms.


6 diapositivas
Supply Chain and Logistics Strategy Presentation
Streamline complex logistics workflows with this bold, dual-loop arrow layout. Ideal for showcasing the full cycle of sourcing, distribution, warehousing, and returns, this diagram lets you visualize forward and reverse logistics processes side by side. Customizable icons, clear progression, and ample space for key data make this a must-have for operations managers, procurement teams, and logistics planners. Fully compatible with PowerPoint, Keynote, and Google Slides.


6 diapositivas
Professional Company Profile Deck Presentation
Present your business with impact using this modern company profile deck. Designed for clarity and professionalism, it includes structured icons, visual highlights, and customizable content sections. Ideal for pitches, internal briefings, or executive introductions. Fully editable in PowerPoint, Keynote, and Google Slides to match your brand and messaging effortlessly.


5 diapositivas
Sprint Planning and Agile Cycle Overview Presentation
Break down agile sprints with this clean, circular cycle layout. Ideal for scrum teams and product managers to illustrate sprint planning, task flow, and iterative progress. Includes five key stages with icon support. Fully customizable in PowerPoint, Keynote, and Google Slides for agile ceremonies, planning sessions, or team training.


19 diapositivas
Philosium Design Strategy Proposal Presentation
Bring your creative vision to life with this sleek and structured design strategy proposal presentation. Covering key elements like concept development, wireframes, typography, and user research, this template helps you communicate a compelling design approach. Fully customizable and compatible with PowerPoint, Keynote, and Google Slides for a seamless and professional presentation experience.


5 diapositivas
Customer Behavior Pathway Visualization Presentation
Illustrate each step in the decision-making journey with this Customer Behavior Pathway Visualization presentation. Designed with directional arrows and dotted flow markers, this slide helps you map behavioral patterns across key stages—from awareness to loyalty. Ideal for sales, marketing, or UX teams. Fully editable in PowerPoint, Canva, and Google Slides.


4 diapositivas
Breast Cancer Research and Support
Shine a light on women's health initiatives with this impactful “Breast Cancer Research and Support” infographic slide. Featuring a symbolic visual shaped like a heart and ribbon, this layout is ideal for showcasing comparative stats, awareness milestones, or key messages about prevention and treatment. Use it to advocate, inform, or inspire—perfect for awareness campaigns, nonprofit reports, or healthcare presentations. Fully customizable in PowerPoint, Keynote, and Google Slides.


2 diapositivas
Creative Gratitude Slide Presentation
Express gratitude in style with this creative thank-you slide template! Featuring bold typography and modern geometric elements, this design adds a unique touch to your presentations. Ideal for business pitches, creative projects, and professional meetings. Fully customizable and compatible with PowerPoint, Keynote, and Google Slides for effortless personalization.


6 diapositivas
Company Hierarchy Infographics
Effectively illustrate your company's hierarchy with our Company Hierarchy infographic template. This template is fully compatible with popular presentation software like PowerPoint, Keynote, and Google Slides, allowing you to easily customize it to showcase your organization's structure and reporting relationships. The Company Hierarchy infographic template offers a visually engaging platform to depict the different levels of leadership, departments, and roles within your company. Whether you're an HR professional, manager, or business leader, this template provides a user-friendly canvas to create informative presentations and organizational charts. Optimize your communication of your company's hierarchy with this SEO-optimized Company Hierarchy infographic template, thoughtfully designed for clarity and ease of use. Customize it to showcase leadership teams, reporting lines, and the key responsibilities of each role, ensuring that your audience gains a comprehensive understanding of your organization's structure. Start crafting your personalized infographic today to effectively communicate your company's hierarchy.


7 diapositivas
Aviation Infographic Presentation Template
Featuring our light, vibrant and eye-catching aviation infographic template compatible with PowerPoint. The theme is designed to show you the key facts and figures about your topic, so you can easily produce a stunning presentation. This infographic is a visual representation of information related to aviation, presented in a clear and visually appealing way. With this template cover topics such as aviation history or the economic impact of the aviation industry. The information in the template can be in the form of statistics, data visualizations, timelines, maps, or other graphical elements.


26 diapositivas
Emery Presentation Template
Ready to make an impression? Style and professionalism are all wrapped up in Emery. New businesses and startups will find it useful - from real estate to travel agencies and everything in-between. Emery is a bold, colorful minimalistic aesthetic template. It's easy to customize, clean and bold template for you to use for your company website. It's flexible and makes an easy quick start. Fill in your details with our easy to edit text, pictures, timelines, charts and we'll set you up for success. Use this fantastic template to promote your business or project and create the perfect document.


4 diapositivas
Workflow Phases and Team Coordination Presentation
Clarify responsibilities and sequence with the Workflow Phases and Team Coordination Presentation. This structured diagram template helps visualize how tasks move through different phases and how teams interact at each step. Perfect for project managers, team leads, and operations specialists looking to streamline collaboration. Compatible with PowerPoint, Keynote, and Google Slides.


5 diapositivas
Technology Comparison Infographics
When comparing technologies, it's important to consider various factors that can impact their performance, usability, and suitability for specific purposes. These vertical infographics can be used in various contexts, including product evaluations, technology assessments, investment decisions, and educational presentations. It helps simplify complex information and facilitates the understanding of technology options, enabling individuals and organizations to make well-informed choices that align with their goals and requirements. Compatible with Powerpoint, Keynote, and Google Slides.


4 diapositivas
Team Relationship Structure Presentation
Show your organization’s hierarchy with clarity and style using this modern visual layout. Ideal for illustrating team dynamics, reporting lines, or company roles, it helps simplify complex structures into easy-to-follow visuals. Fully customizable and compatible with PowerPoint, Keynote, and Google Slides for seamless editing and professional presentation design.


6 diapositivas
Threat and Mitigation Bowtie Model Presentation
Clarify cause and consequence pathways with the Threat and Mitigation Bowtie Model Presentation. This template helps visualize risk sources, critical events, and mitigation strategies in a clear bowtie format. Ideal for incident analysis, safety reviews, and compliance reporting. Fully editable in PowerPoint, Keynote, and Google Slides.


6 diapositivas
Cryptocurrency Analysis Infographics
Analyze cryptocurrency effectively with our Cryptocurrency Analysis infographic template. This template is fully compatible with popular presentation software like PowerPoint, Keynote, and Google Slides, allowing you to easily customize it to illustrate and communicate various aspects of cryptocurrency analysis. The Cryptocurrency Analysis infographic template offers a visually engaging platform to explore and explain the key elements of analyzing cryptocurrencies, including market trends, technical analysis, fundamental analysis, and investment strategies. Whether you're a cryptocurrency enthusiast, trader, or investor, this template provides a user-friendly canvas to create informative presentations and educational materials. Enhance your cryptocurrency knowledge and analysis skills with this SEO-optimized Cryptocurrency Analysis infographic template, thoughtfully designed for clarity and ease of use. Customize it to showcase cryptocurrency charts, indicators, risk management techniques, and insights into the volatile world of digital assets, ensuring that your audience gains valuable insights into this evolving field. Start crafting your personalized infographic today to become a more proficient cryptocurrency analyst.


6 diapositivas
KPI Data Visualization and Metrics Overview Presentation
Get a clear snapshot of your performance with this KPI Data Visualization and Metrics Overview Presentation. Designed with bold triangle charts, percentage rings, and a color-coded value panel, it’s perfect for summarizing five key metrics in a compact, visual format. Easily editable in PowerPoint, Google Slides, Keynote, and Canva.