


Características


¿Tienes alguna pregunta?
Recomendar


23 diapositivas
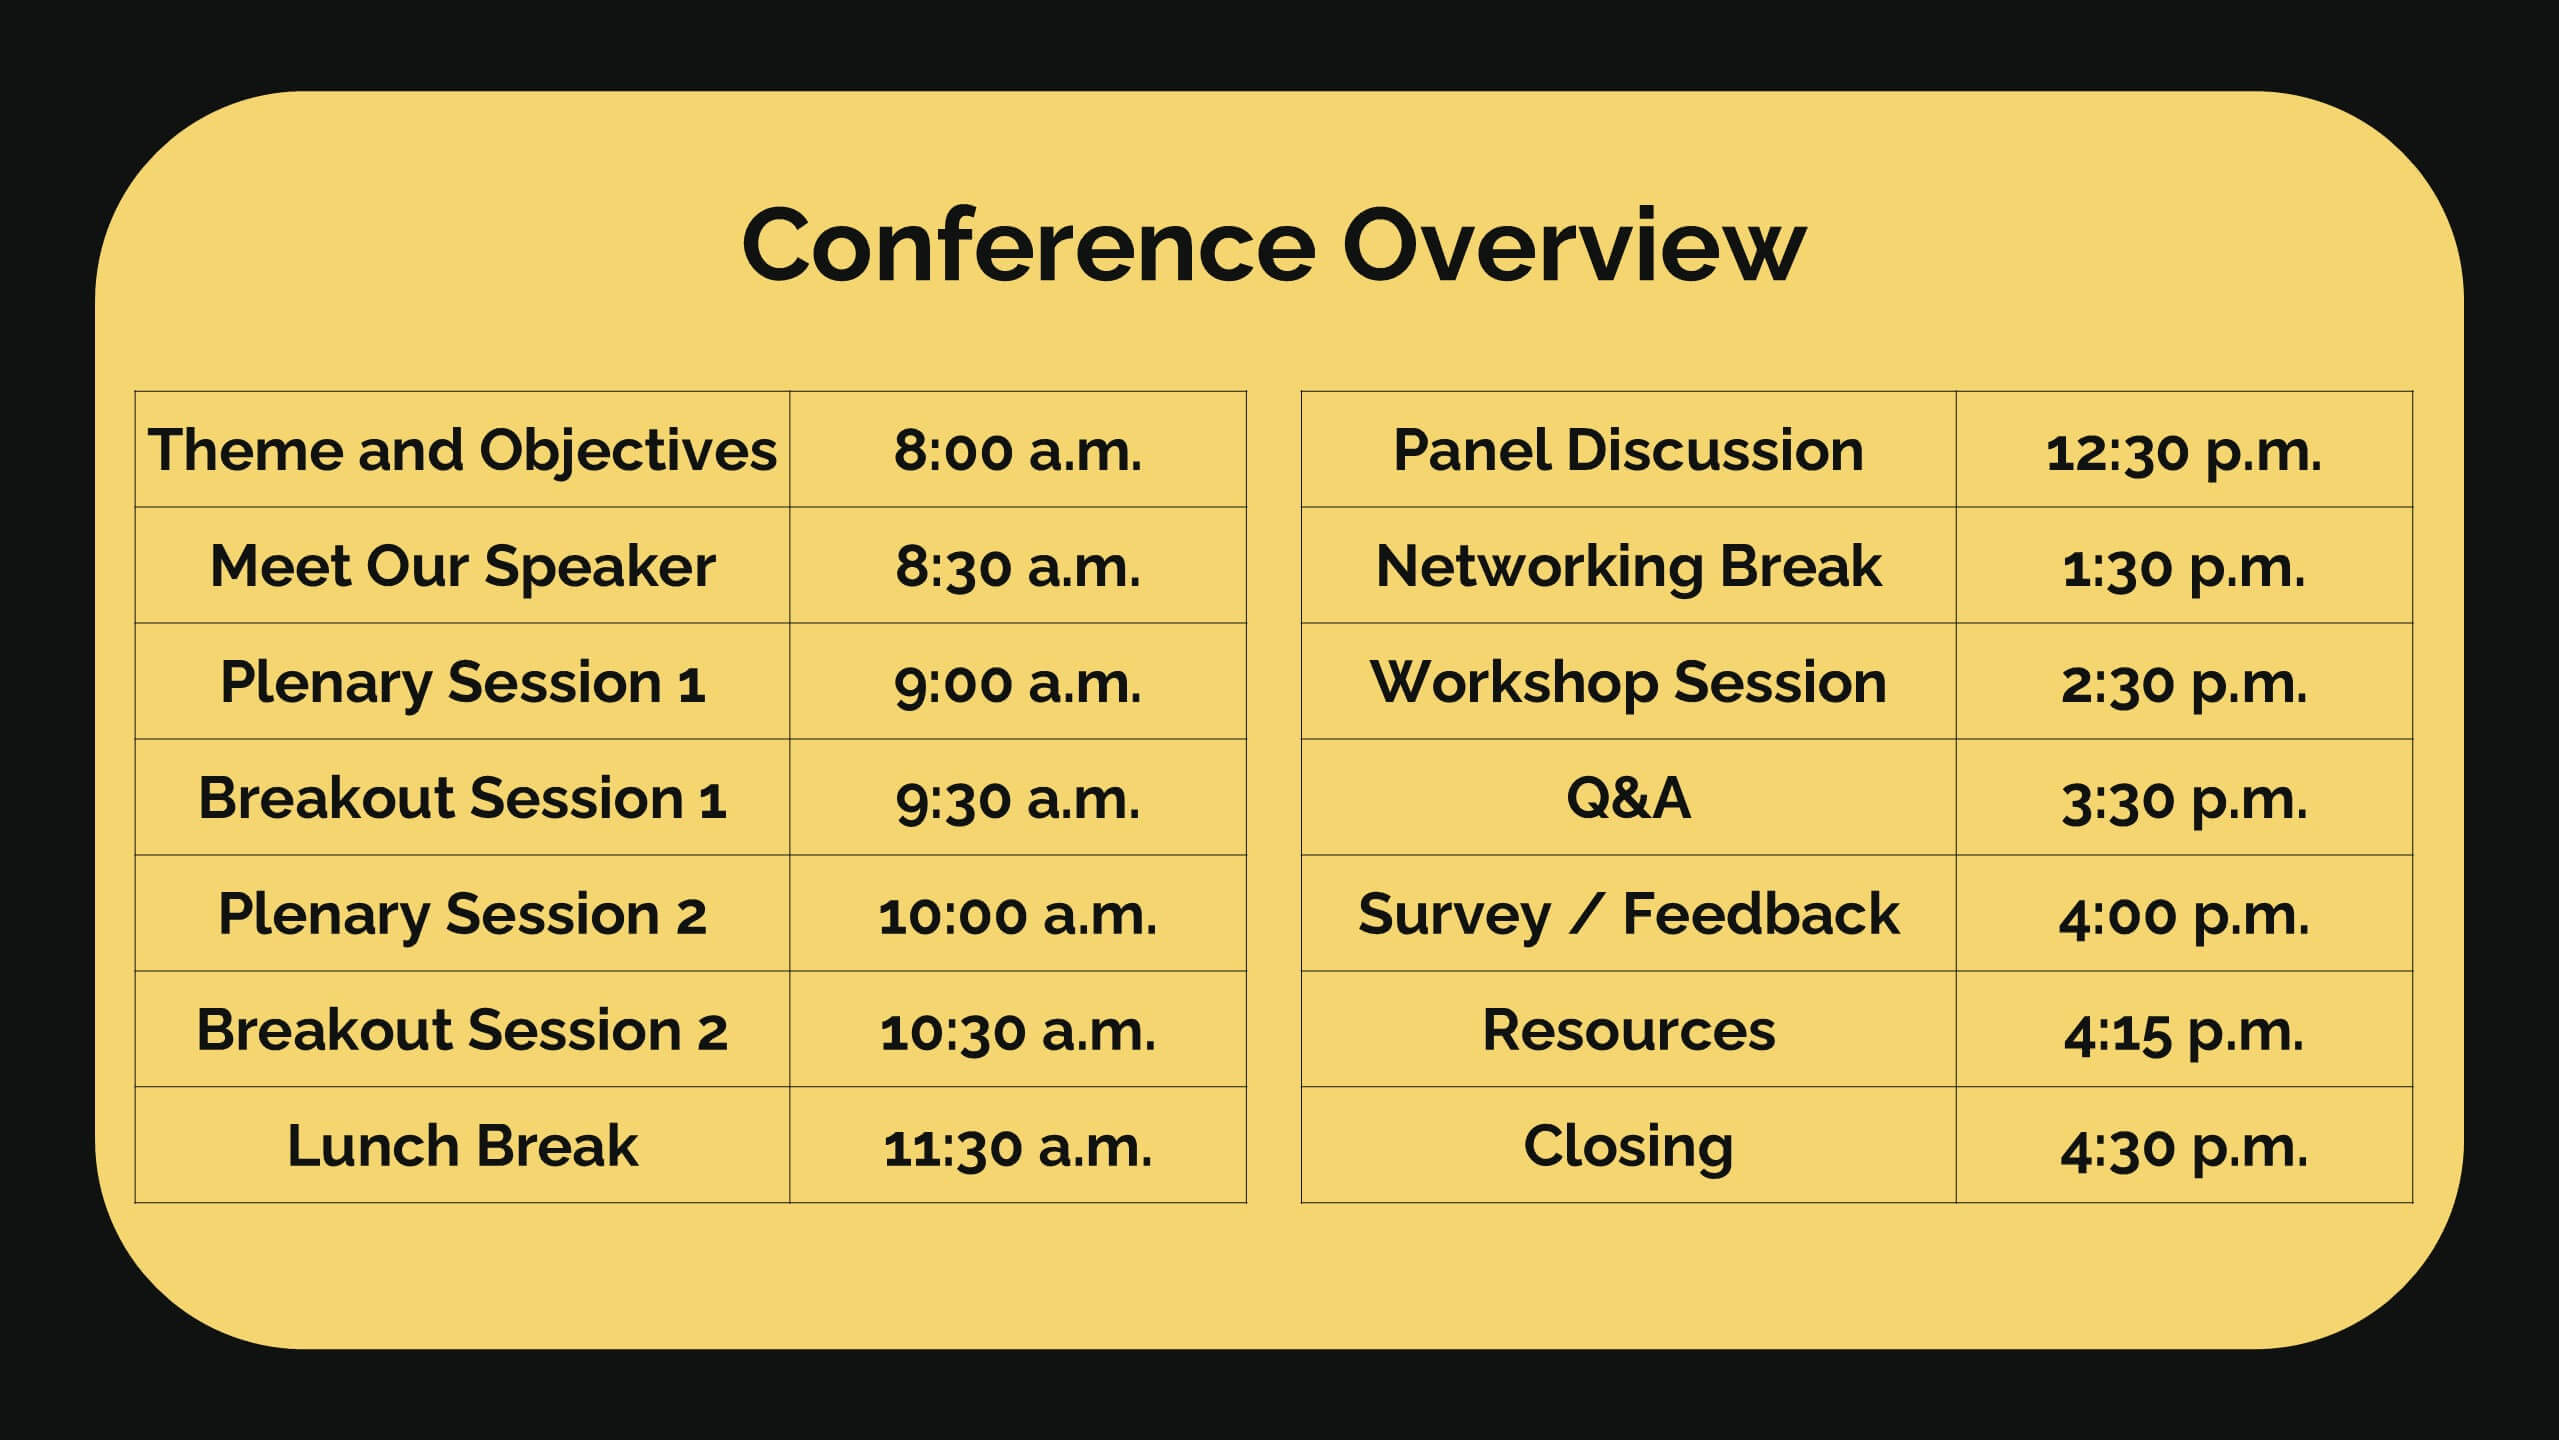
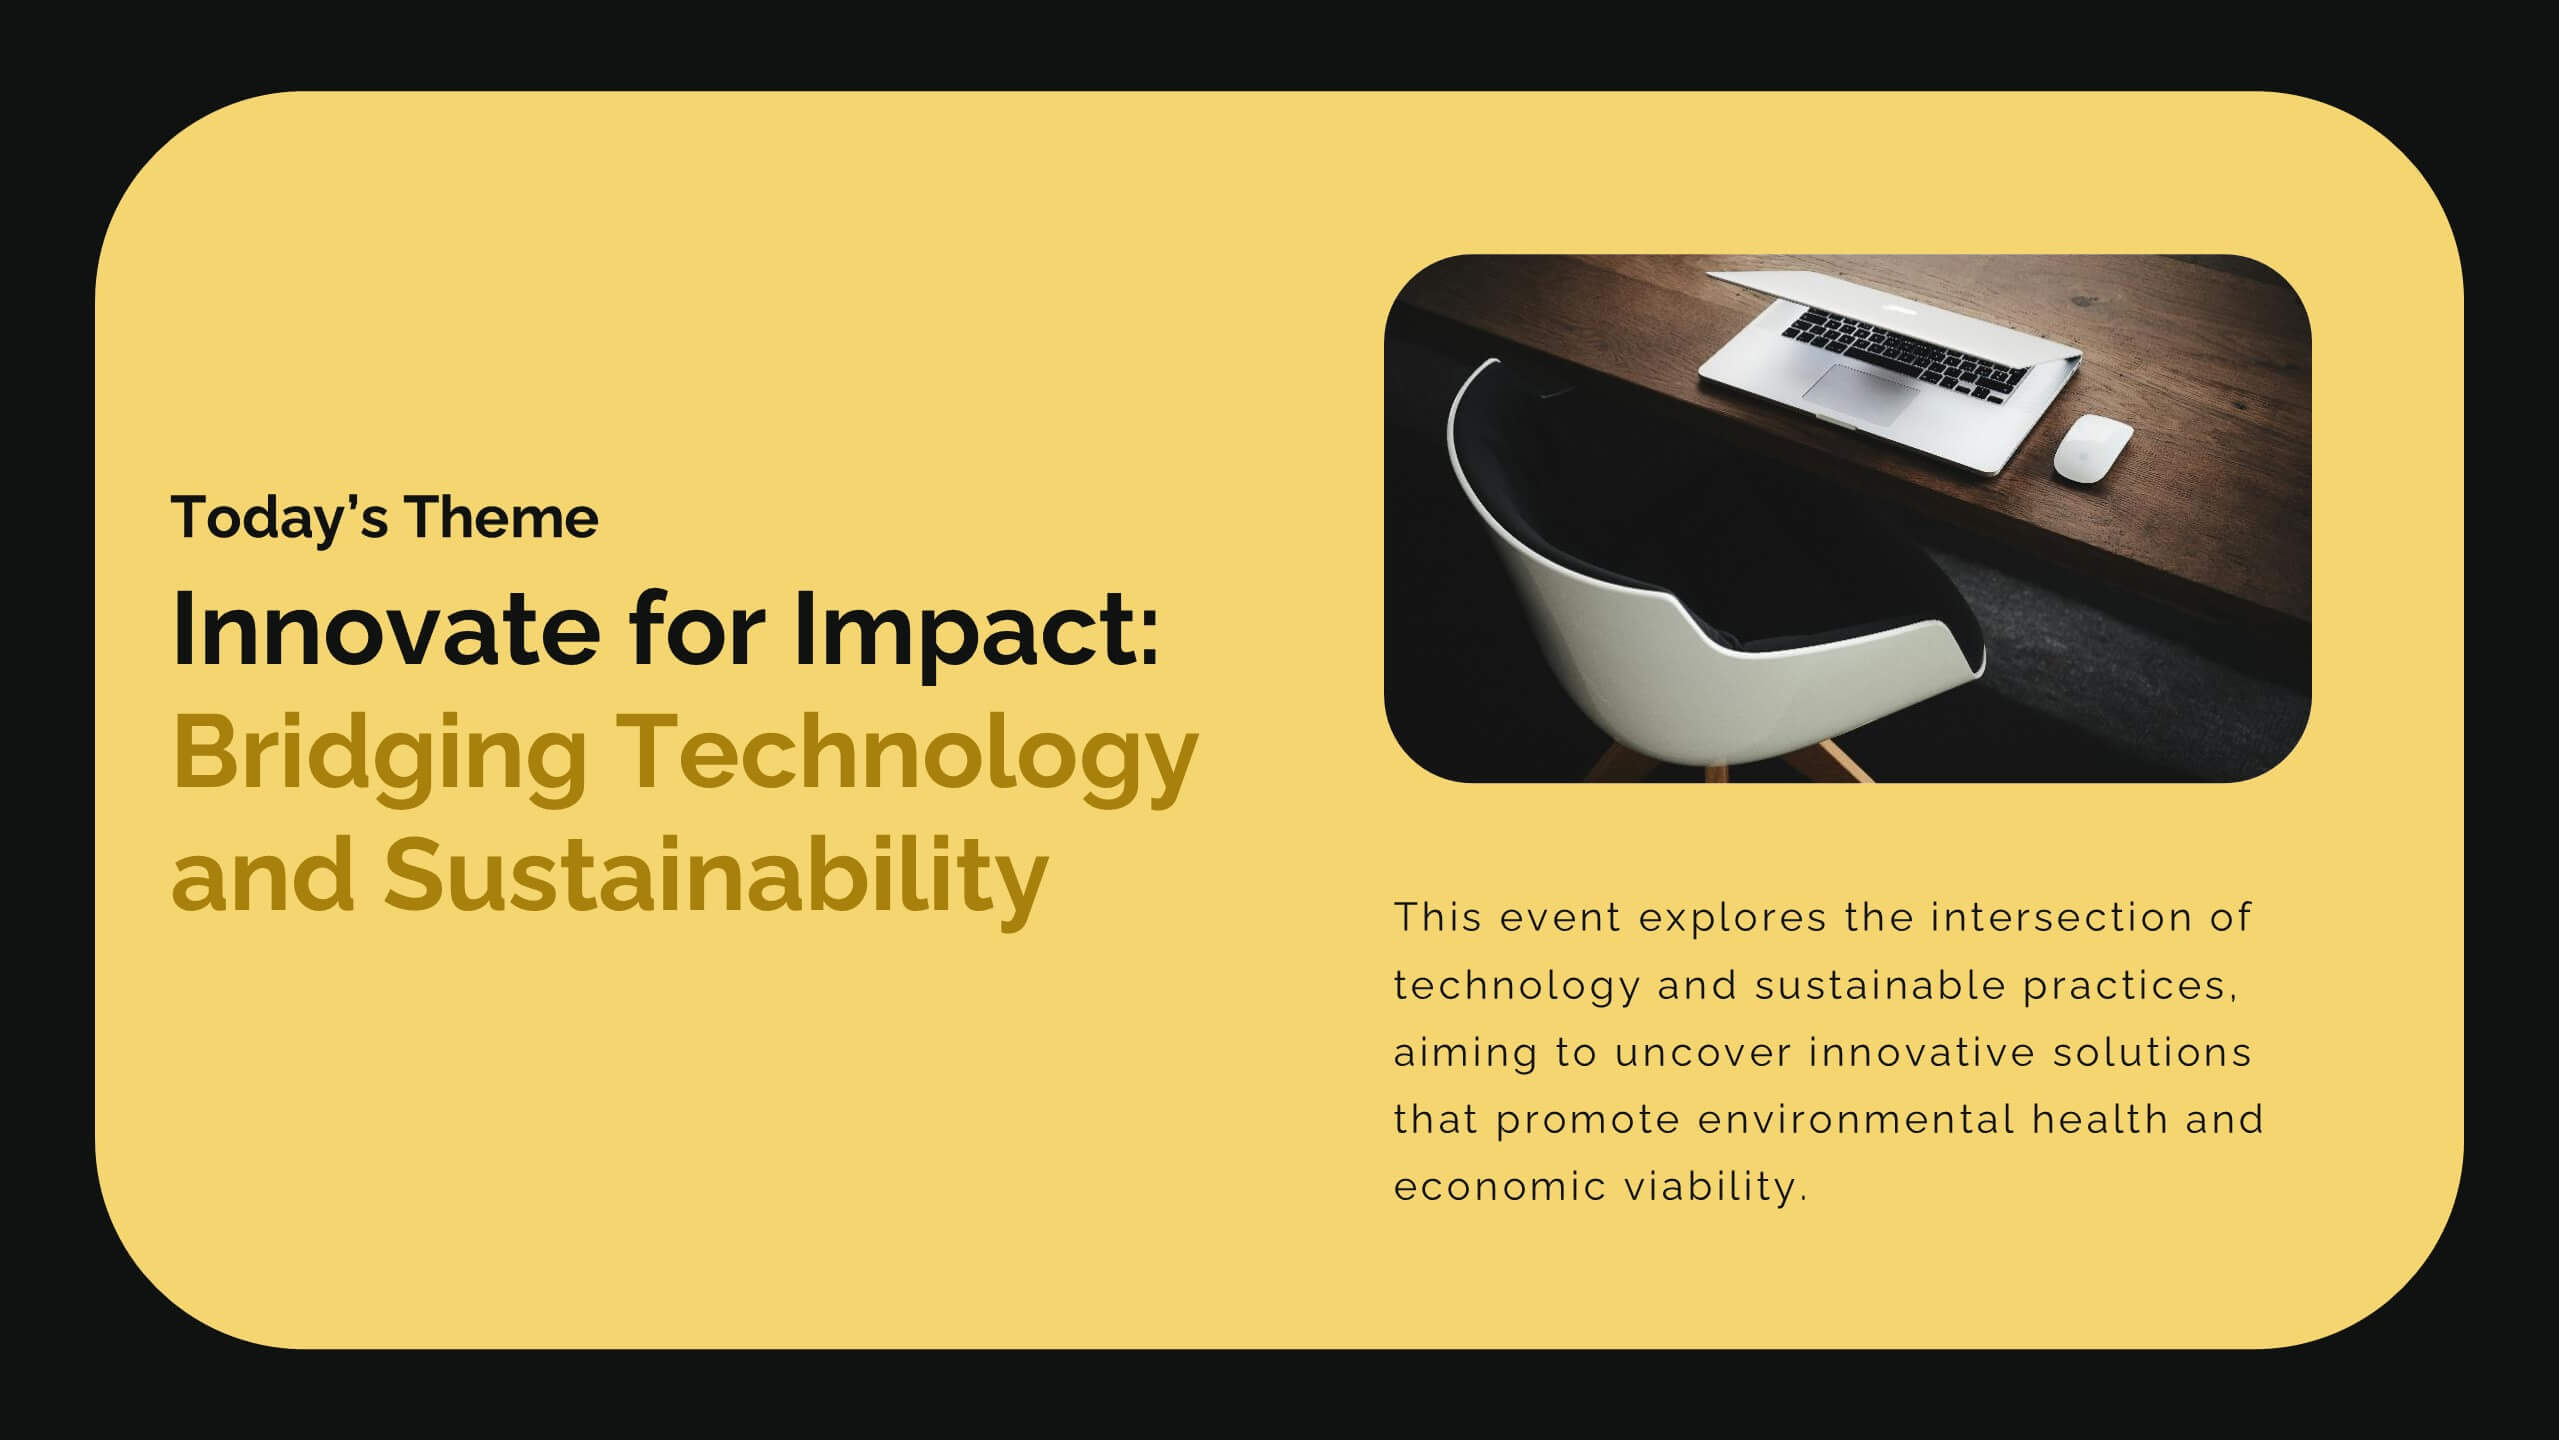
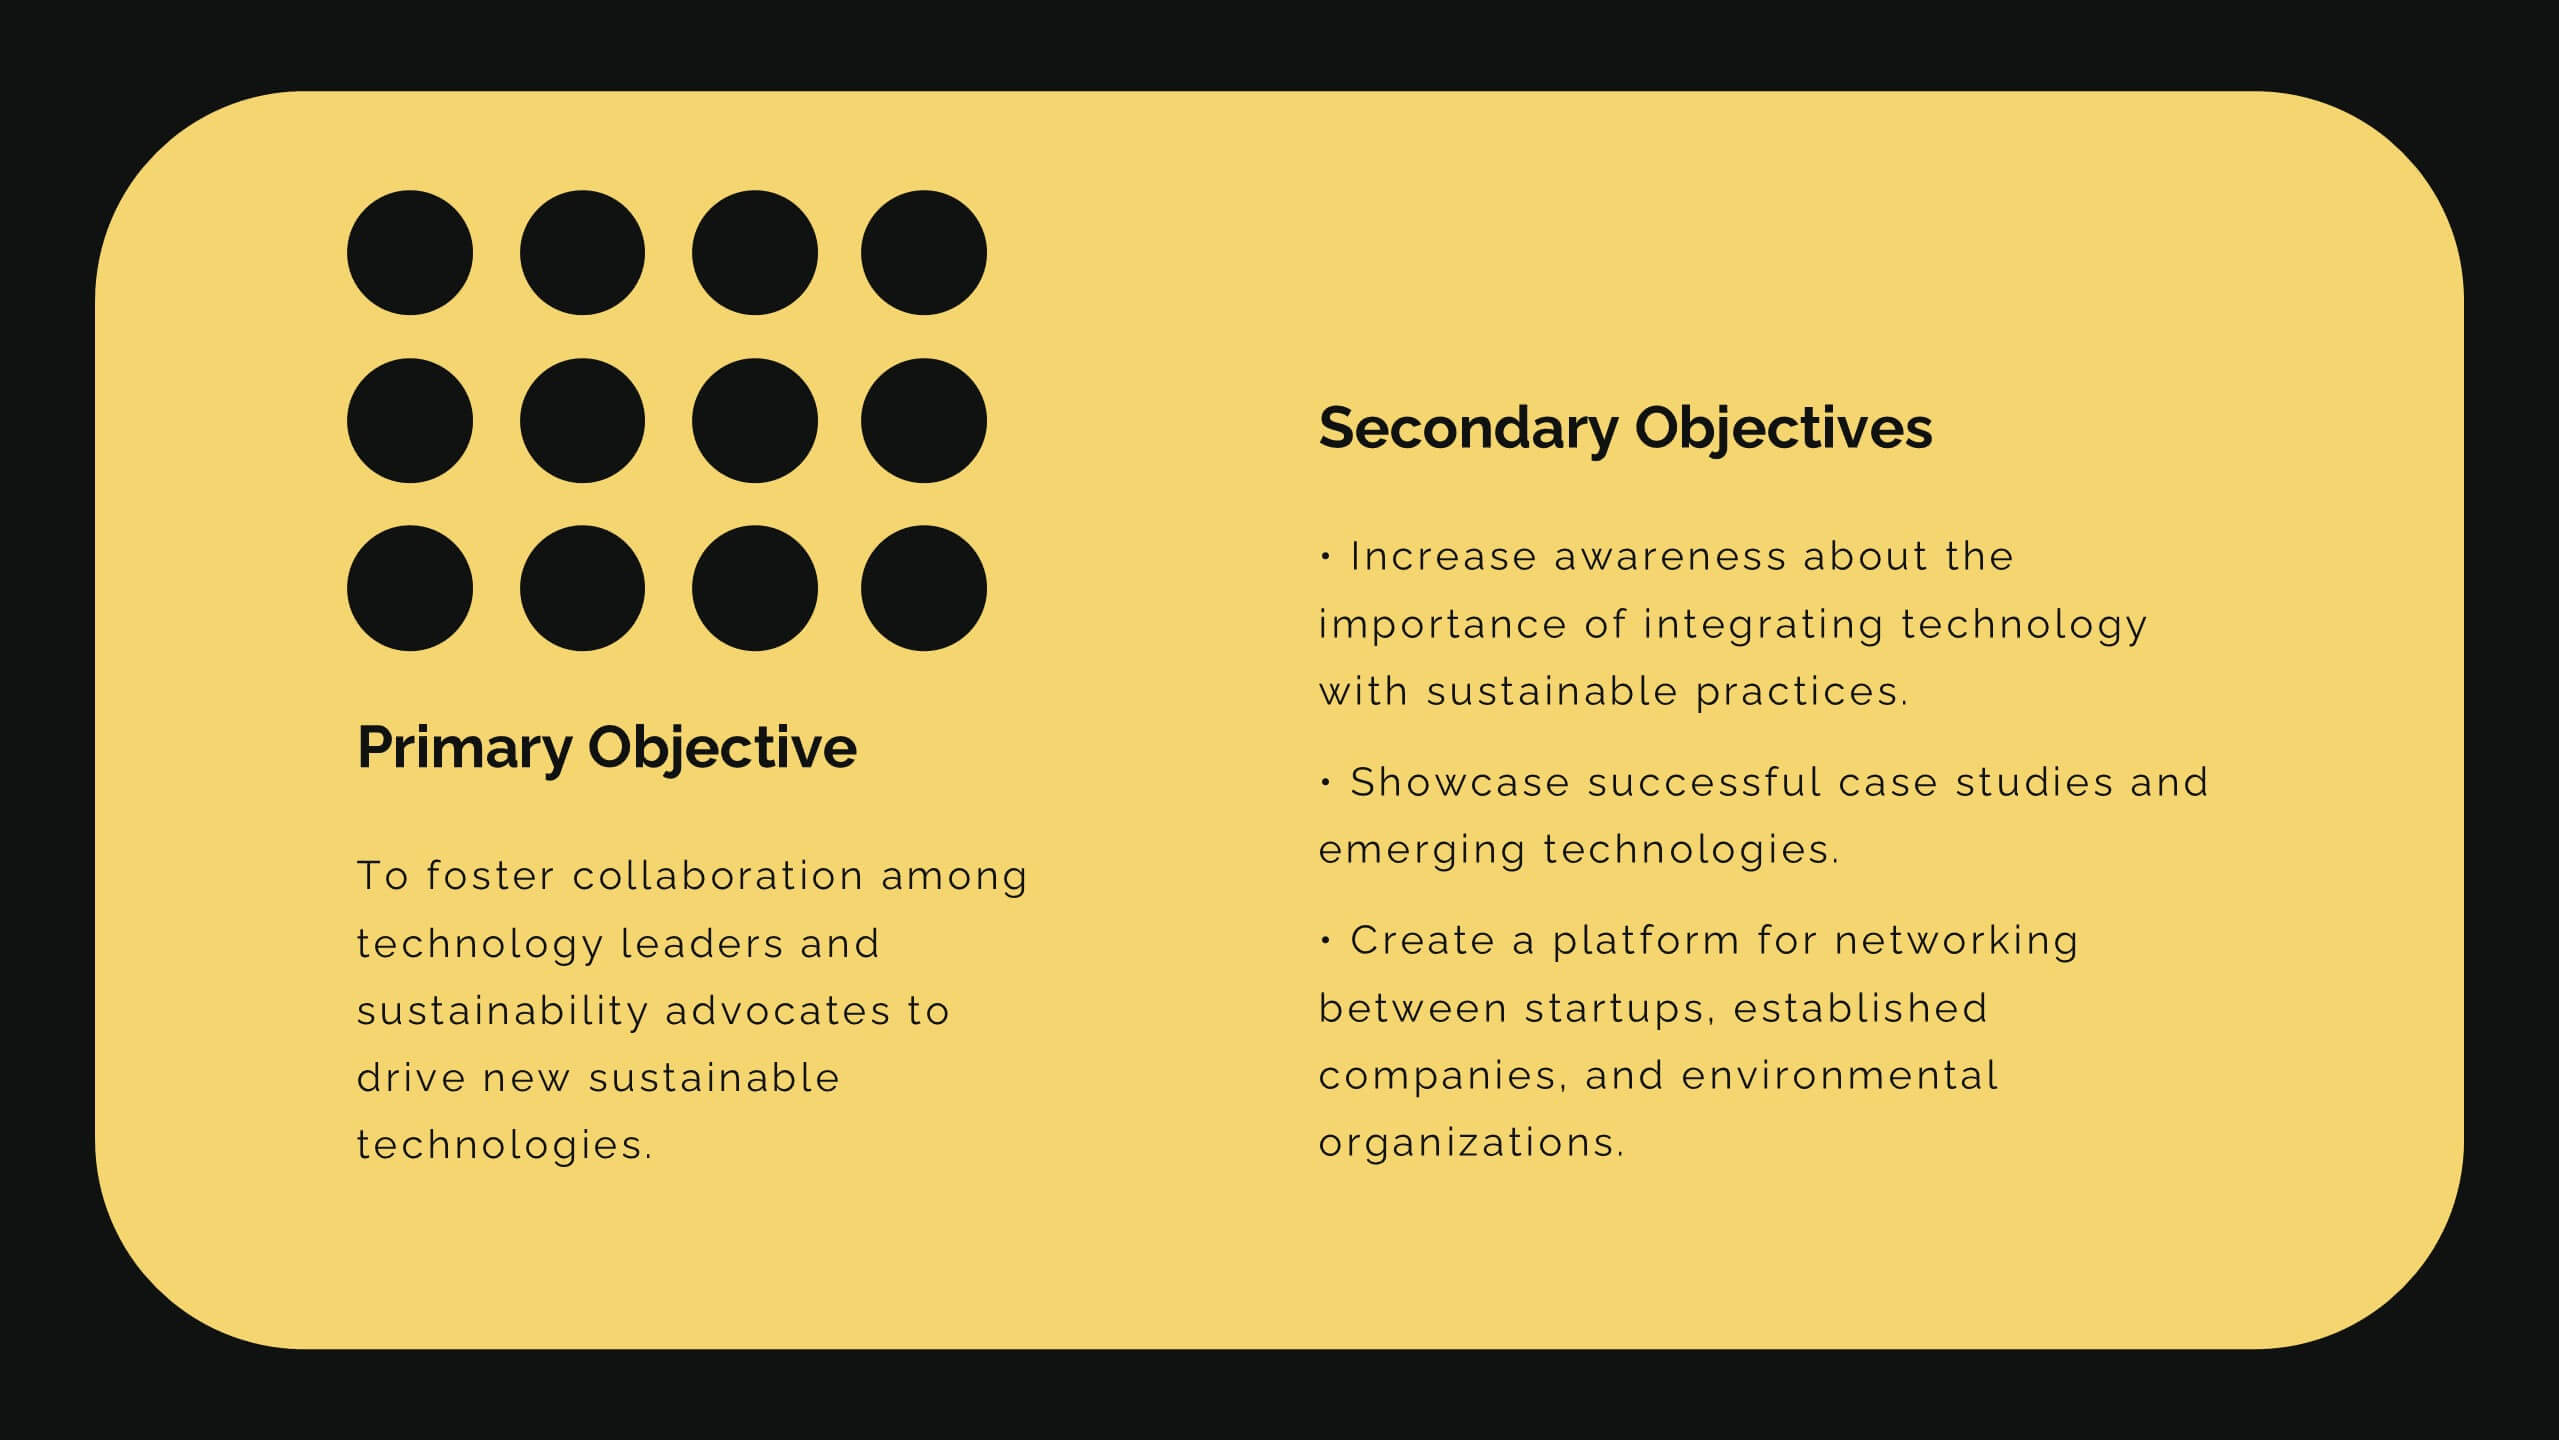
Diamond Business Development Proposal Presentation
Unlock the potential of your business proposals with this bold and engaging presentation template! Perfect for business development pitches, conferences, and workshops, it includes sections for speaker introductions, panel discussions, and session breakdowns. With its clean and professional design, this template ensures clarity and impact. Fully customizable and compatible with PowerPoint, Keynote, and Google Slides.


6 diapositivas
Strategic Expansion in Africa Map Presentation
Showcase your regional growth plan with the Strategic Expansion in Africa Map Presentation. This layout combines a clean Africa map with color-coded country highlights and directional labels, making it perfect for outlining market entry, regional operations, or investment focus. Ideal for business consultants or NGOs. Works in PowerPoint, Canva, and Google Slides.


10 diapositivas
Customer Demographic Breakdown Presentation
Give your insights a bold, modern look with a clear visual layout that turns customer data into an easy-to-follow story. This presentation helps you explain key demographic patterns, highlight audience behavior, and support smarter decisions with clean, structured visuals. Fully editable and compatible with PowerPoint, Keynote, and Google Slides.


5 diapositivas
Geographic Oceania Overview Presentation
Visualize your regional data with a sleek, easy-to-read map highlighting key areas across Oceania. Perfect for presenting geographic insights, business distribution, or market trends, this clean layout ensures every detail stands out clearly. Fully compatible with PowerPoint, Keynote, and Google Slides for simple editing and professional presentations.


6 diapositivas
Business Process Flowchart Presentation
Streamline your workflow with the Business Process Flowchart presentation. This structured and visually engaging template helps you map out processes, optimize efficiency, and improve communication within your team. Designed for business analysts, managers, and strategists, this fully editable slide ensures clarity in decision-making and operations. Compatible with PowerPoint, Keynote, and Google Slides.


26 diapositivas
Hotel Chain Deluxe Company Profile
Dive into the lavish world of Miami's finest hotel chains, where luxury meets tropical allure. Drenched in the vibrant shades of green and sun-kissed orange, our template exudes the freshness and opulence of Miami's hospitality scene. Graced with luxurious graphics, iconic landmarks, and evocative image placeholders, it's a visual treat that captures the city's essence. Flawlessly curated for Powerpoint, Keynote, or Google Slides. A gem for travel agencies, luxury travelers, hotel reviewers, or anyone keen on showcasing the pinnacle of Miami's hospitality. Experience luxury; let Miami's best hotels unfold.


6 diapositivas
Strategic Planning with OKRs
Align your business strategy with measurable outcomes using this OKR-based planning slide. Highlight objectives, key activities, and results alongside a clear problem-solution structure. Perfect for strategy sessions and team planning meetings. Fully editable in PowerPoint, Keynote, and Google Slides.


4 diapositivas
Neuroscience-Inspired Concept Mapping Presentation
Visualize abstract ideas with clarity using the Neuroscience-Inspired Concept Mapping Presentation. Featuring a head silhouette and four labeled concept nodes, this layout is perfect for connecting ideas, frameworks, or steps in a thought process. Fully editable in PowerPoint, Canva, and Google Slides for seamless customization and presentation.


7 diapositivas
Big Data Tools Infographic
Big Data refers to large volumes of data, both structured and unstructured, that inundate a business or organization on a day-to-day basis. This infographic template is designed to captivate, educate, and empower, providing a bold and clear representation of the sheer magnitude and impact of big data. Compatible with Powerpoint, Keynote, and Google Slides. This template involves processing and analyzing Big Data to extract meaningful insights, patterns, and trends. These insights can be used for business intelligence, decision-making, research, and various other applications across different domains and industries.


8 diapositivas
Medical Anatomy Study
Deliver engaging medical insights with this professionally designed anatomy slide. Perfect for health education, biology lessons, or healthcare proposals, this layout highlights key internal systems with clean visuals. Editable in PowerPoint, Keynote, and Google Slides—customize the organs, labels, and notes with ease.


6 diapositivas
Social Relationship Infographics
Revitalize your presentations on social dynamics with our Social Relationship infographic, seamlessly compatible with Powerpoint, Keynote, and Google Slides. This infographic is a perfect addition for sociologists, relationship coaches, and educators who aim to discuss the complexities and interconnectedness of social relationships. The infographic offers a visual breakdown of different social relationship types, the dynamics within those relationships, and the factors influencing social interactions. It's designed to help audiences understand the different layers and nuances that make up social connections, whether in personal networks, communities, or professional environments. Incorporating this infographic into your presentations will assist in illustrating how relationships are formed, maintained, and evolved. It serves as an educational tool that can lead to deeper discussions about social bonds, communication patterns, and relationship management. Utilize this infographic to provide a clear and impactful visual representation of the fundamental concepts in social relationship studies.


4 diapositivas
Property Investment Pitch Deck Presentation
Impress investors with a sleek and confident presentation designed to highlight property opportunities and market growth. This professional layout helps you showcase financial insights, projections, and investment strategies with clarity and style. Fully customizable and compatible with PowerPoint, Keynote, and Google Slides for effortless editing and impactful delivery.


6 diapositivas
Organizational Mind Mapping Slide Presentation
Bright ideas deserve a space to grow, and this presentation turns complex thoughts into a clean, organized visual map. It helps teams outline processes, connect concepts, and structure information with clarity and flow. Perfect for planning or strategy sessions. Fully compatible with PowerPoint, Keynote, and Google Slides.


2 diapositivas
Thank You Page for Final Impressions Presentation
Leave a lasting impression with a bold, modern layout that speaks professionalism and clarity. This presentation template is designed to wrap up your message with impact, offering space for contact details and a short message of appreciation. It’s fully editable and works seamlessly in PowerPoint, Keynote, and Google Slides.


8 diapositivas
Rewards and Membership Benefits
Highlight the value of your loyalty or subscription programs with this eye-catching slide. Featuring four ticket-style sections radiating from a central icon, this layout is ideal for outlining exclusive perks, tiered rewards, or member-only features. Fully editable in PowerPoint, Keynote, and Google Slides.


7 diapositivas
Travel Infographic Presentation Template
Our Travel Infographic is a gorgeous infographic template that allows you to instantly create a modern, stylish and eye-catching travel infographic. You can easily customize this travel infographic to suit all your needs in just a few minutes. This Travel Infographic is designed to used as a travel guide with tons of destinations, flight deals and tips to make your trip memorable. This template can be used to help you create dynamic visual content for your travels. This travel infographic is a perfect way to plan, organize and prepare for your next trip or for all the upcoming trips!


6 diapositivas
3D Shapes Infographic
3D shapes, also known as three-dimensional shapes or solids, are geometric figures that have three dimensions: length, width, and height (or depth). This Infographic visually explains various three-dimensional geometric shapes, their properties, and real-world applications. With this template you can summarize the benefits of the 3D Shapes in simplifying the understanding of complex shapes and encouraging practical applications in various fields. This infographic is the perfect study aid for students preparing for geometry exams. This is fully customizable and compatible with Powerpoint, Keynote, and Google Slides.