


Características


¿Tienes alguna pregunta?
Recomendar


23 diapositivas
Nymph Startup Pitch Deck Presentation
This startup pitch deck template covers all the essentials for presenting a business. It includes slides for mission and vision, business model, market analysis, value proposition, and financial overview. Easily customizable for any startup industry, this modern design makes presenting your ideas a breeze. Compatible with PowerPoint, Keynote, and Google Slides.


5 diapositivas
Environmental and Social Sustainability Presentation
Explore the synergy of environmental protection and social responsibility with our Environmental and Social Sustainability Presentation template. This visual aid is a compelling tool for discussing key strategies in balancing ecological and social impacts, providing a roadmap for sustainable business practices. Ideal for engaging audiences in discussions about conservation and community engagement, the template is fully compatible with PowerPoint, Keynote, and Google Slides, ensuring a smooth presentation experience in any setting.


4 diapositivas
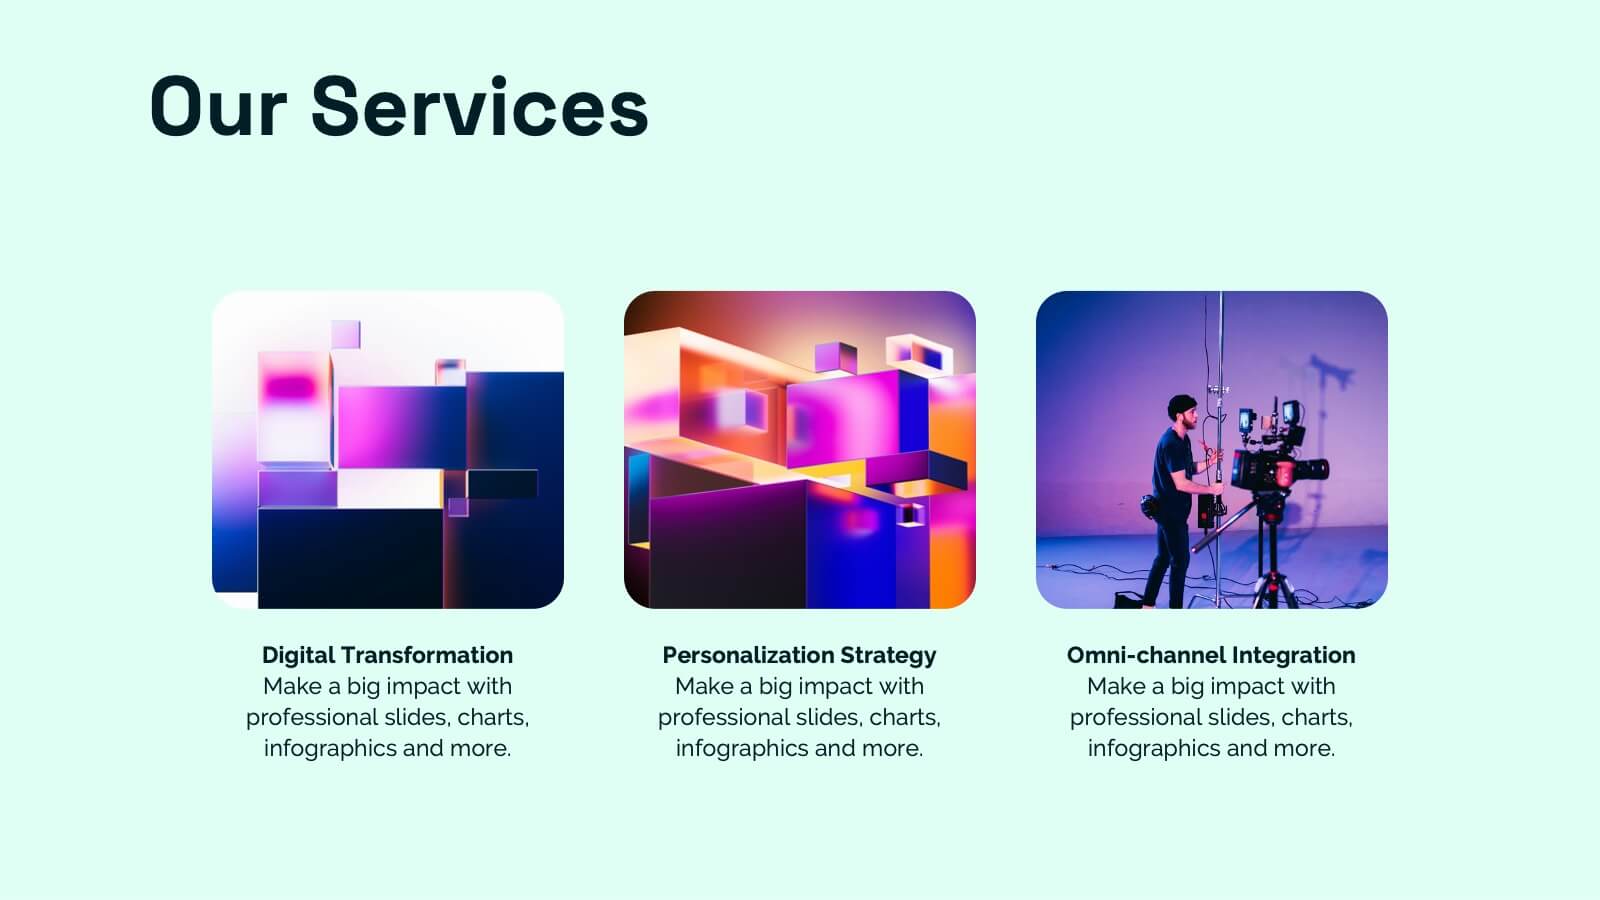
Corporate Company Profile Overview Presentation
Present your business story with clarity and impact using this sleek company profile layout. Designed for corporate overviews, it highlights key points alongside a modern visual backdrop. Ideal for executive summaries, strategy decks, or investor briefings—fully editable in PowerPoint, Keynote, and Google Slides for effortless customization and professional results.


6 diapositivas
Sales Process Infographic
The sales process refers to the step-by-step approach or series of activities that a salesperson or sales team follows to close a sale. This infographic template provides an informative overview of the sales process, guiding professionals through each stage and highlighting best practices for success. This template is designed to help you outlines the key stages involved in the sales process. This is a valuable resource for professionals seeking to enhance their understanding of the sales process and improve their performance. Compatible with Powerpoint, Keynote, and Google Slides.


6 diapositivas
Business Challenges and Solutions Presentation
Address challenges with strategic solutions using this Business Challenges and Solutions template. Featuring a clear side-by-side layout, this design helps visualize business obstacles and their corresponding solutions for effective decision-making. Perfect for problem-solving discussions, strategy meetings, and brainstorming sessions, this template ensures your content remains structured and impactful. Fully customizable for PowerPoint, Keynote, and Google Slides.


8 diapositivas
Market Research Survey Analysis Presentation
Present your Market Research Survey Analysis with this visually engaging template, designed for clear data visualization and insights presentation. Featuring an intuitive infographic layout, this template allows you to highlight key survey findings, customer insights, and strategic takeaways. Fully customizable in PowerPoint, Keynote, and Google Slides, you can adjust colors, edit text, and modify icons to align with your business needs.


6 diapositivas
Business Value Proposition Presentation
Ignite your strategy with this captivating template that highlights your unique business value. This tool breaks down key value propositions, market differentiators, and customer benefits in an engaging format. Perfect for pitching ideas, it clarifies competitive advantages and growth opportunities. Compatible with PowerPoint, Keynote, and Google Slides for seamless presentations.


6 diapositivas
Business Funnel Breakdown Visualization
Break down your entire sales or operational funnel with clarity using the Business Funnel Breakdown Visualization Presentation. This clean, 3D-styled funnel graphic divides your process into five editable layers, making it ideal for showcasing lead flow, process stages, or customer lifecycle phases. Fully customizable in PowerPoint, Keynote, and Google Slides.


4 diapositivas
Risk Assessment Heat Map
Visualize and evaluate risk levels with clarity using this impact-based heat map layout. Ideal for risk management reports, audits, and strategic planning, this template highlights potential threats across multiple categories and severity levels. Fully customizable in PowerPoint, Keynote, and Google Slides.


5 diapositivas
Steps Process Infographics
A steps process refers to a series of sequential actions or stages that need to be followed to accomplish a specific task or achieve a desired outcome. These informative vertical infographics are designed to showcase step-by-step processes, procedures, or workflows. Whether you need to explain a business process, a project timeline, or a complex procedure, this provides a clear and concise way to present information in a visually engaging manner. The infographic offers a variety of layouts specifically designed to display step-by-step processes. The template allows you to customize the infographics according to your specific needs.


4 diapositivas
Effective Team Communication
Break down communication impact with this data-driven walkie-talkie infographic. Perfect for showing percentage-based contributions, roles, or workflow efficiency across teams. Fully customizable in PowerPoint, Keynote, and Google Slides.


6 diapositivas
Strategic PESTEL Presentation
Kickstart smarter strategy sessions with a clean, colorful layout that makes external factor analysis feel effortless. This presentation helps teams map trends, identify risks, and understand the broader environment shaping business decisions. Clear visuals keep insights organized and actionable. Fully compatible with PowerPoint, Keynote, and Google Slides.


3 diapositivas
Financial Planning and Budget Forecast Presentation
Present your financial goals with clarity using the Financial Planning and Budget Forecast Presentation. This modern, minimalist layout helps you break down percentage allocations, forecast future spending, and visualize budget insights with eye-catching graphics. Perfect for finance teams, startups, and consultants. Fully customizable in PowerPoint, Google Slides, Keynote, and Canva.


2 diapositivas
Creative Gratitude Slide Presentation
Express gratitude in style with this creative thank-you slide template! Featuring bold typography and modern geometric elements, this design adds a unique touch to your presentations. Ideal for business pitches, creative projects, and professional meetings. Fully customizable and compatible with PowerPoint, Keynote, and Google Slides for effortless personalization.


21 diapositivas
Everwyrm Startup Strategy Presentation
The Startup Strategy Presentation Template is crafted to highlight your business vision, growth plans, and financial insights. With 21 fully editable slides, it covers areas like business model, market analysis, and milestones. Perfect for entrepreneurs and investors, compatible with PowerPoint, Keynote, and Google Slides.


8 diapositivas
Three Phase 30-60-90 Strategy Presentation
Give your roadmap a dynamic, flowing rhythm with a clean three-phase layout that makes each milestone feel clear, actionable, and easy to present. This presentation helps you outline priorities, track progress, and communicate strategic goals with confidence and simplicity. Fully editable and compatible with PowerPoint, Keynote, and Google Slides.


7 diapositivas
Tables of Content Samples Infographic Presentation
A Table of Content is an essential tool that improves the accessibility and organization of a document or book, and enhances its overall professionalism. This table of contents template is an excellent way to organize your information. This template is fully editable, which allows you to easily change colors and fonts, and add or delete components from the design. The slides are designed to be easily updated with new information, allowing you to keep the presentation fresh and up-to-date. Each template has a high quality design that is compatible with powerpoint, Keynote and Google Slides.